Peru Latin America & Caribbean
Upper middle income Upper middleincome Country data group 2005 2013 2013
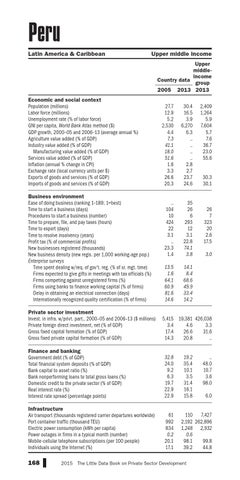
Economic and social context Population (millions) Labor force (millions) Unemployment rate (% of labor force) GNI per capita, World Bank Atlas method ($) GDP growth, 2000–05 and 2006–13 (average annual %) Agriculture value added (% of GDP) Industry value added (% of GDP) Manufacturing value added (% of GDP) Services value added (% of GDP) Inflation (annual % change in CPI) Exchange rate (local currency units per $) Exports of goods and services (% of GDP) Imports of goods and services (% of GDP) Business environment Ease of doing business (ranking 1–189; 1=best) Time to start a business (days) Procedures to start a business (number) Time to prepare, file, and pay taxes (hours) Time to export (days) Time to resolve insolvency (years) Profit tax (% of commercial profits) New businesses registered (thousands) New business density (new regis. per 1,000 working-age pop.) Enterprise surveys Time spent dealing w/req. of gov't. reg. (% of sr. mgt. time) Firms expected to give gifts in meetings with tax officials (%) Firms competing against unregistered firms (%) Firms using banks to finance working capital (% of firms) Delay in obtaining an electrical connection (days) Internationally recognized quality certification (% of firms) Private sector investment Invest. in infra. w/privt. part., 2000–05 and 2006–13 ($ millions) Private foreign direct investment, net (% of GDP) Gross fixed capital formation (% of GDP) Gross fixed private capital formation (% of GDP) Finance and banking Government debt (% of GDP) Total financial system deposits (% of GDP) Bank capital to asset ratio (%) Bank nonperforming loans to total gross loans (%) Domestic credit to the private sector (% of GDP) Real interest rate (%) Interest rate spread (percentage points) Infrastructure Air transport (thousands registered carrier departures worldwide) Port container traffic (thousand TEU) Electric power consumption (kWh per capita) Power outages in firms in a typical month (number) Mobile-cellular telephone subscriptions (per 100 people) Individuals using the Internet (%)
168
2015
27.7 12.9 5.2 2,530 4.4 7.3 41.1 18.0 51.6 1.6 3.3 26.6 20.3
.. 104 10 424 22 3.1 .. 23.3 1.4 13.5 1.6 64.1 60.9 81.6 14.6
30.4 16.5 3.9 6,270 6.3 .. .. .. .. 2.8 2.7 23.7 24.6
35 26 6 293 12 3.1 22.8 74.1 3.8 14.1 8.4 68.6 49.9 33.4 14.2
2,409 1,264 5.9 7,604 5.7 7.6 36.7 23.0 55.6
30.3 30.1
26 7 323 20 2.6 17.5 3.0
5,415 19,381 426,038 3.4 4.6 3.3 17.4 26.6 31.6 14.3 20.8 ..
32.8 24.0 9.2 6.3 19.7 22.9 22.9
61 992 834 0.2 20.1 17.1
19.2 35.4 10.1 3.5 31.4 16.1 15.8
.. 48.0 10.7 3.6 98.0 6.0
110 7,427 2,192 262,896 1,248 2,932 0.6 98.1 99.8 39.2 44.8
The Little Data Book on Private Sector Development