CLIMATE PLAYBOOK
WOODS BAGOT
A
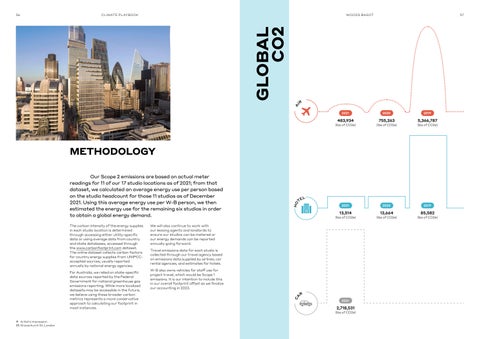
GLOBAL CO2
56
57
IR 2021
483,934
2020
755,263
2019
5,366,787
(lbs of CO2e)
(lbs of CO2e)
(lbs of CO2e)
2021
2020
2019
Our Scope 2 emissions are based on actual meter readings for 11 of our 17 studio locations as of 2021; from that dataset, we calculated an average energy use per person based on the studio headcount for those 11 studios as of December 2021. Using this average energy use per W-B person, we then estimated the energy use for the remaining six studios in order to obtain a global energy demand.
For Australia, we relied on state-specific data sources reported by the Federal Government for national greenhouse gas emissions reporting. While more localized datasets may be accessible in the future, we believe using these broader carbon metrics represents a more conservative approach to calculating our footprint in most instances.
Artist's Impression 85 Gracechurch St, London
EL T
13,514
(lbs of CO2e)
We will also continue to work with our leasing agents and landlords to ensure our studios can be metered or our energy demands can be reported annually going forward. Travel emissions data for each studio is collected through our travel agency based on emissions data supplied by airlines, car rental agencies, and estimates for hotels. W-B also owns vehicles for staff use for project travel, which would be Scope 1 emissions. It is our intention to include this in our overall footprint offset as we finalize our accounting in 2023.
C
The carbon intensity of the energy supplies in each studio location is determined through accessing either utility-specific data or using average data from country and state databases, accessed through the www.carbonfootprint.com dataset. The online dataset collects carbon factors for country energy supplies from UNIPCCaccepted sources, usually reported annually by national energy agencies.
HO
METHODOLOGY
R A
2021
2,718,531
(lbs of CO2e)
13,664
(lbs of CO2e)
85,582
(lbs of CO2e)


