A Closer Look at Economic Mobility Data in Winston-Salem
Economic Mobility in Winston-Salem
A CLOSER LOOK AT LOCAL DATA FEATURING:
• David Forte, Opportunity Insights
• Adam Hill, Forsyth Futures
We are a research and policy lab based at Harvard University.
Our mission is to identify barriers to economic opportunity and inform scalable solutions that will empower people throughout the United States to rise out of poverty and achieve better life outcomes.
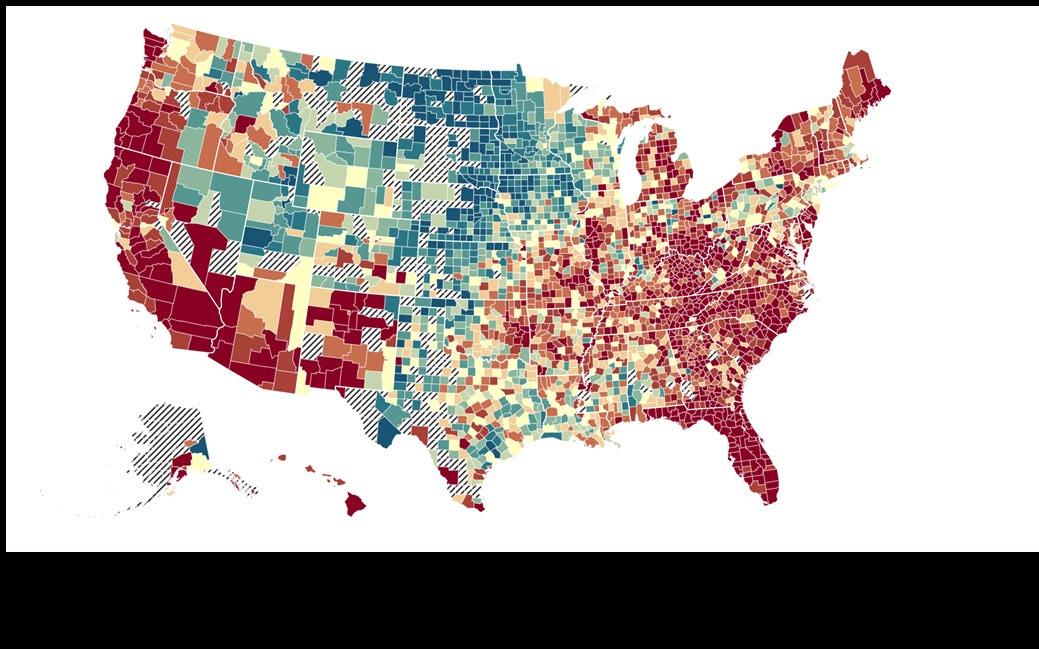
The Geography of Opportunity
What does opportunity look like geographically? How is it changing in recent years?
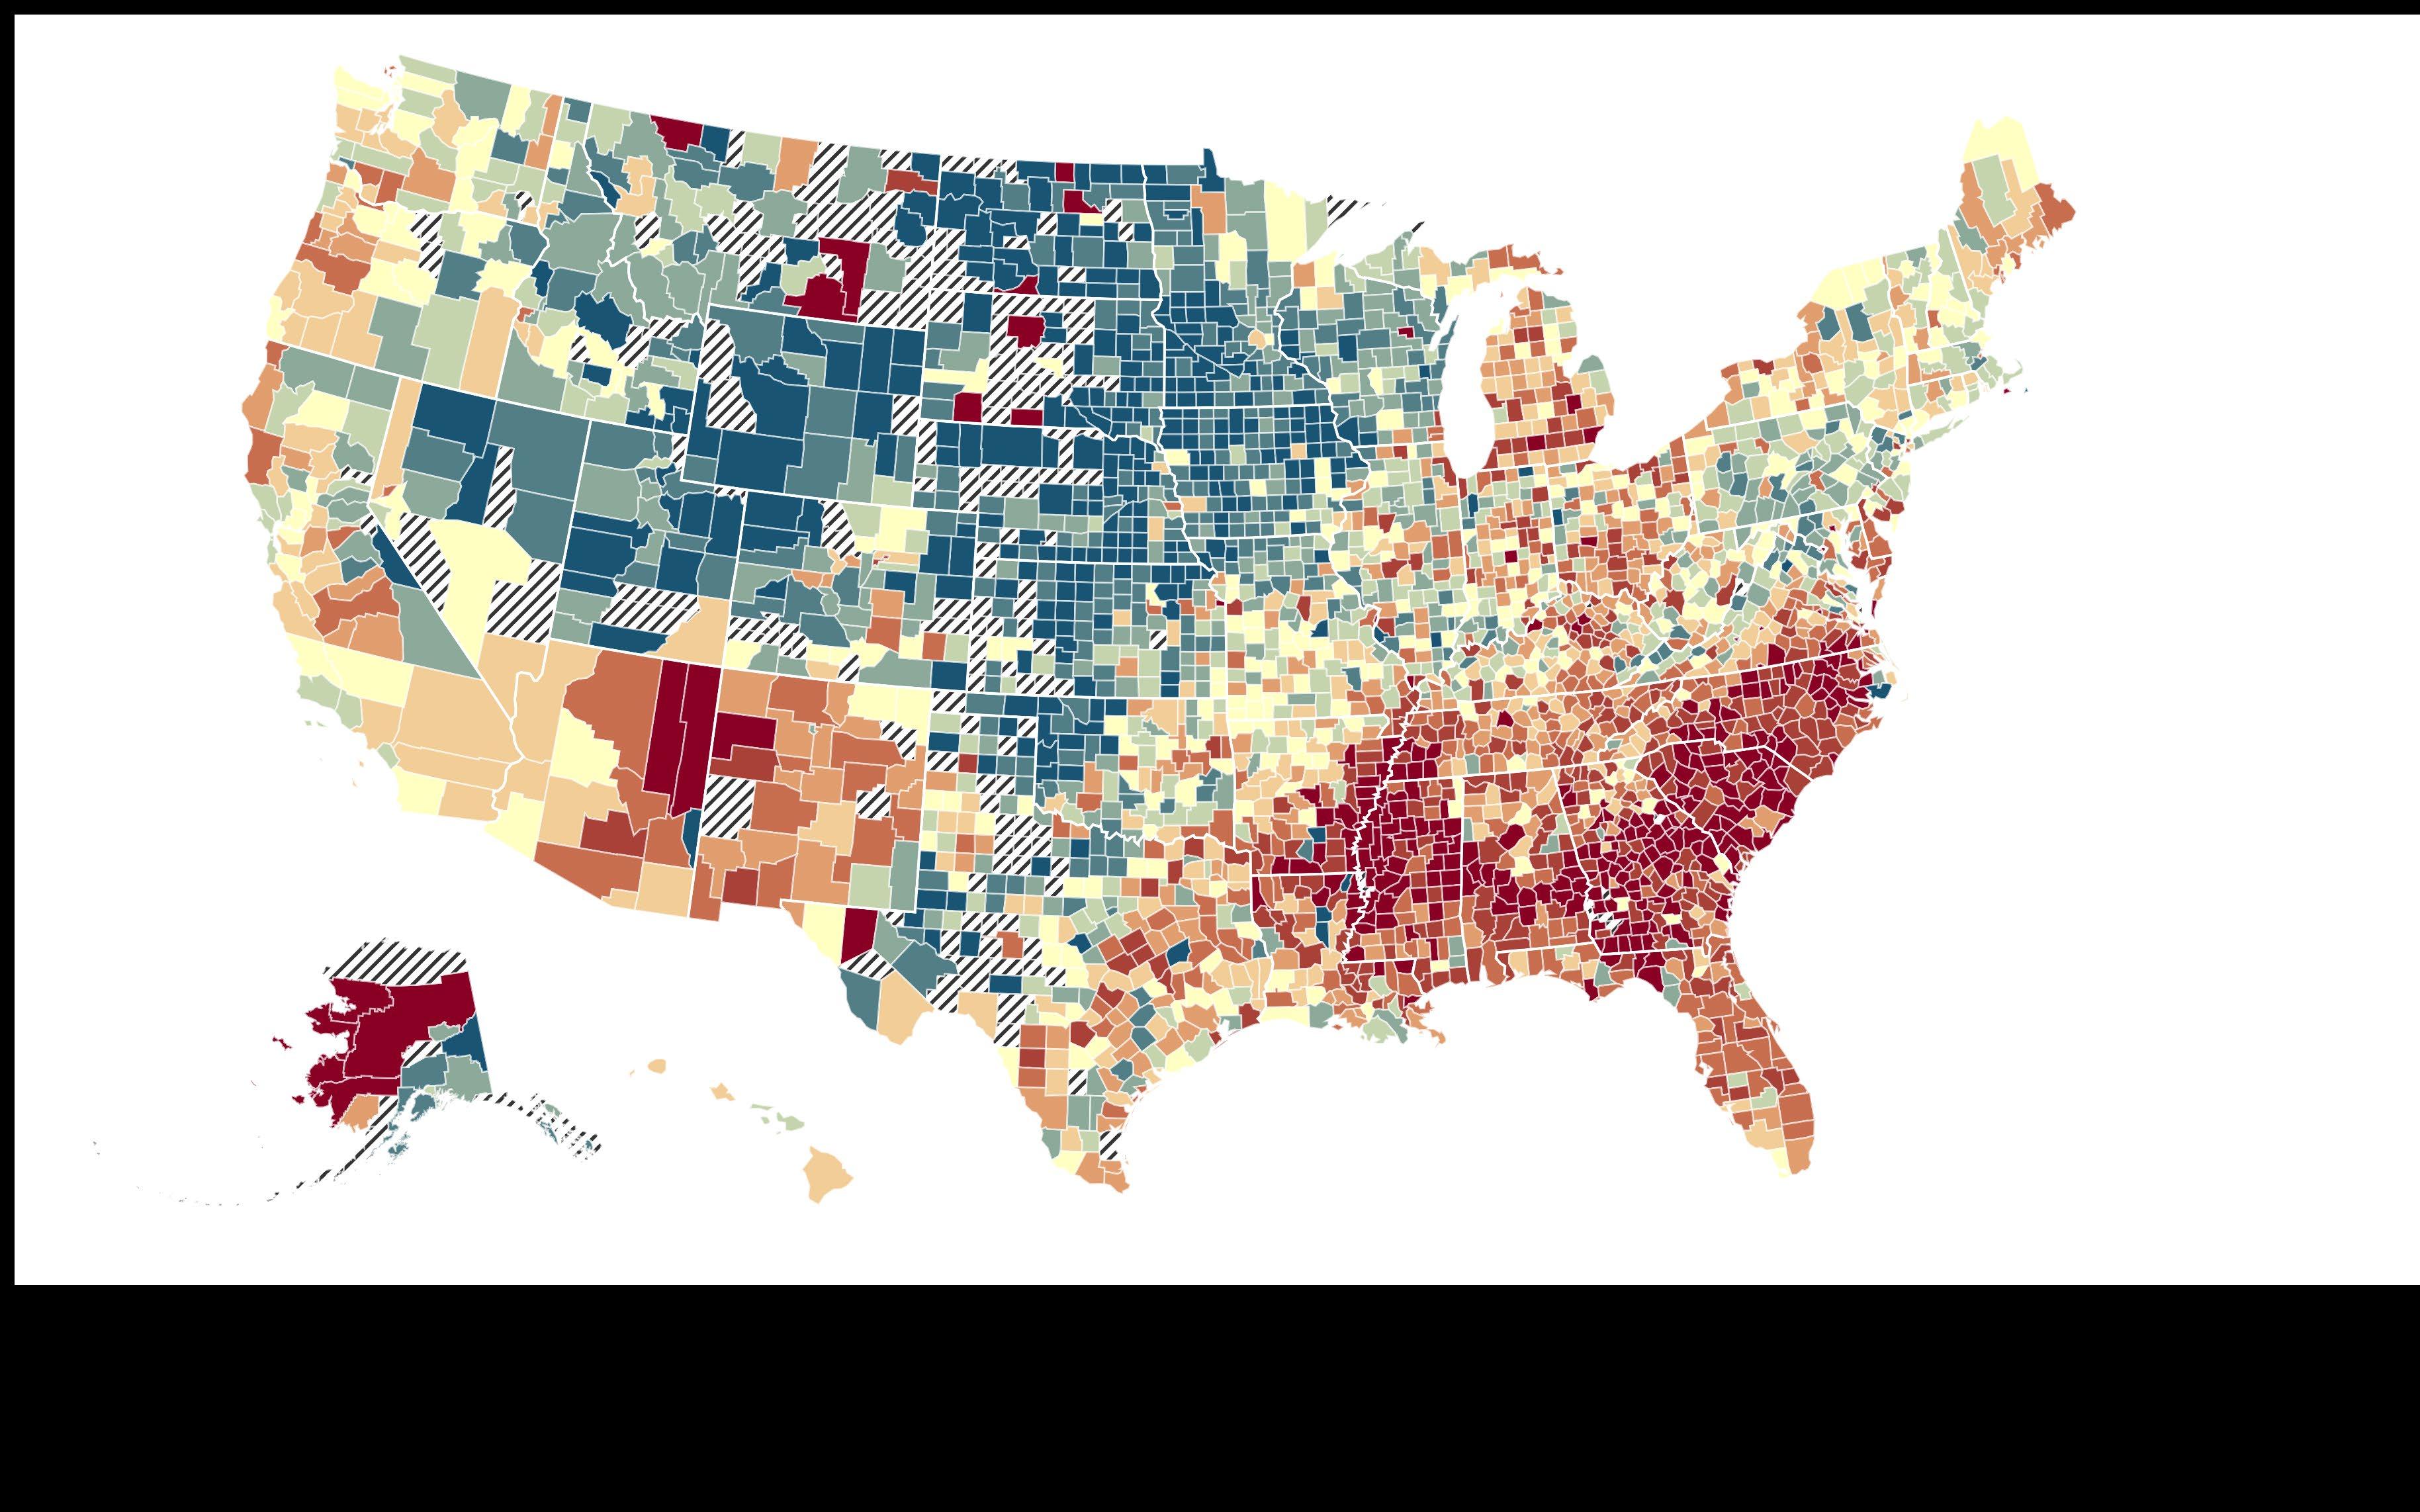
Opportunity Varies by Place
Average Household Income at Age 35 for Children whose Parents Earned $27K (25th percentile)
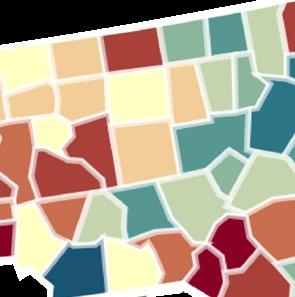
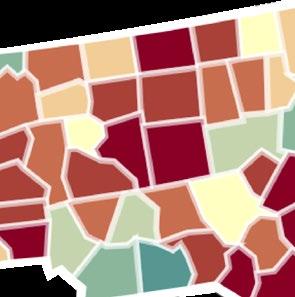
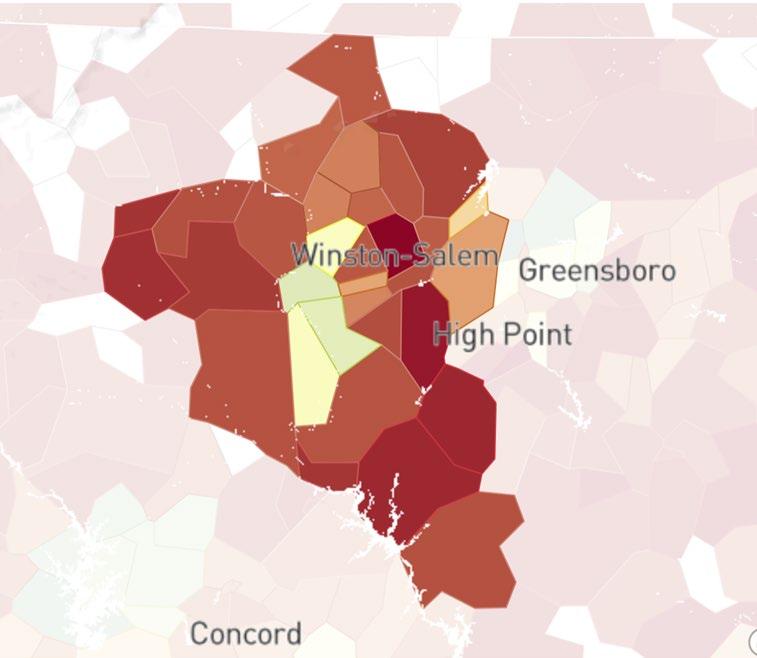
Opportunity Varies by Place + is hyper local
Average Household Income at Age 35 for Children whose Parents Earned $27K (25th percentile)
Source: Chetty, Hendren, Kline, Saez (QJE 2014)
Higher Opportunity Neighborhood $45K
Lower Opportunity Neighborhood $16K
Blue = More Upward Mobility Red = Less Upward Mobility
Changing Opportunity
How is opportunity changing within places in recent years?
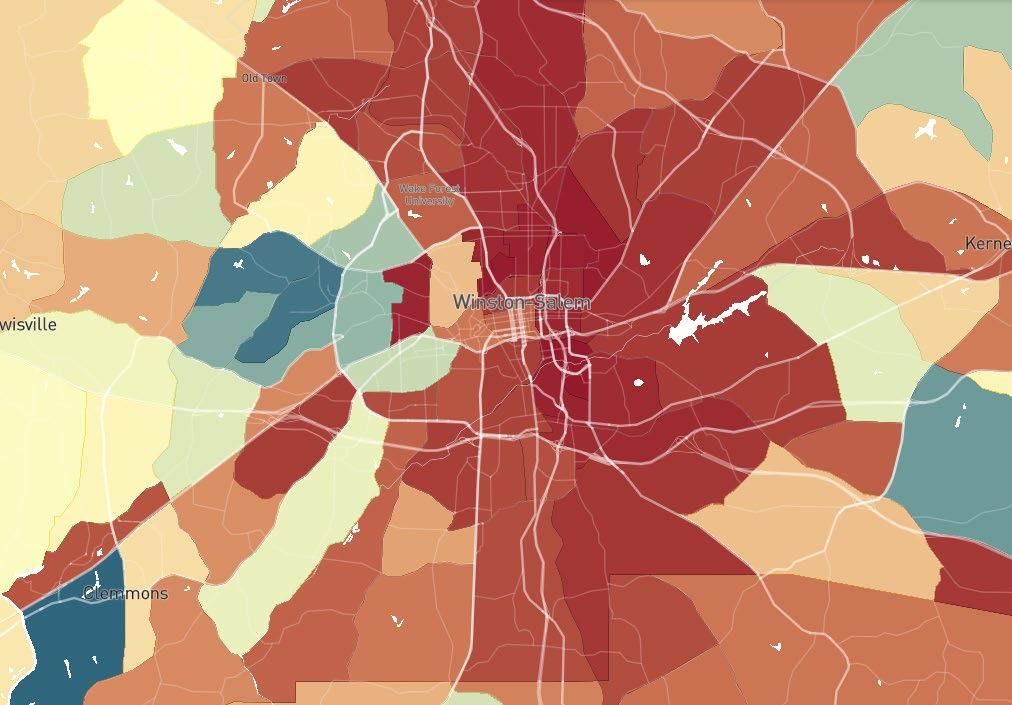
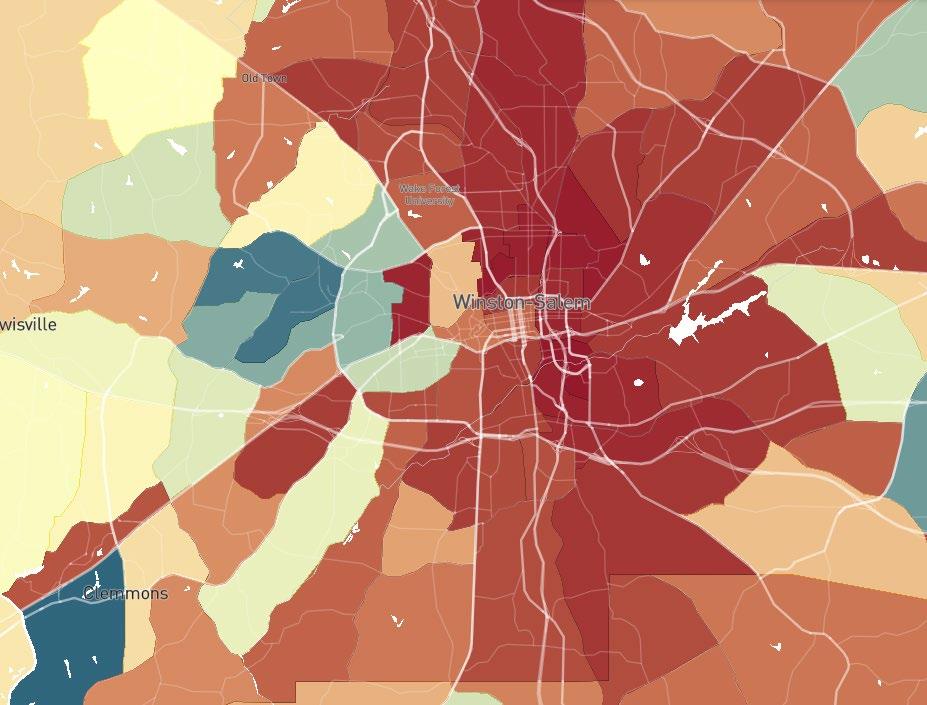
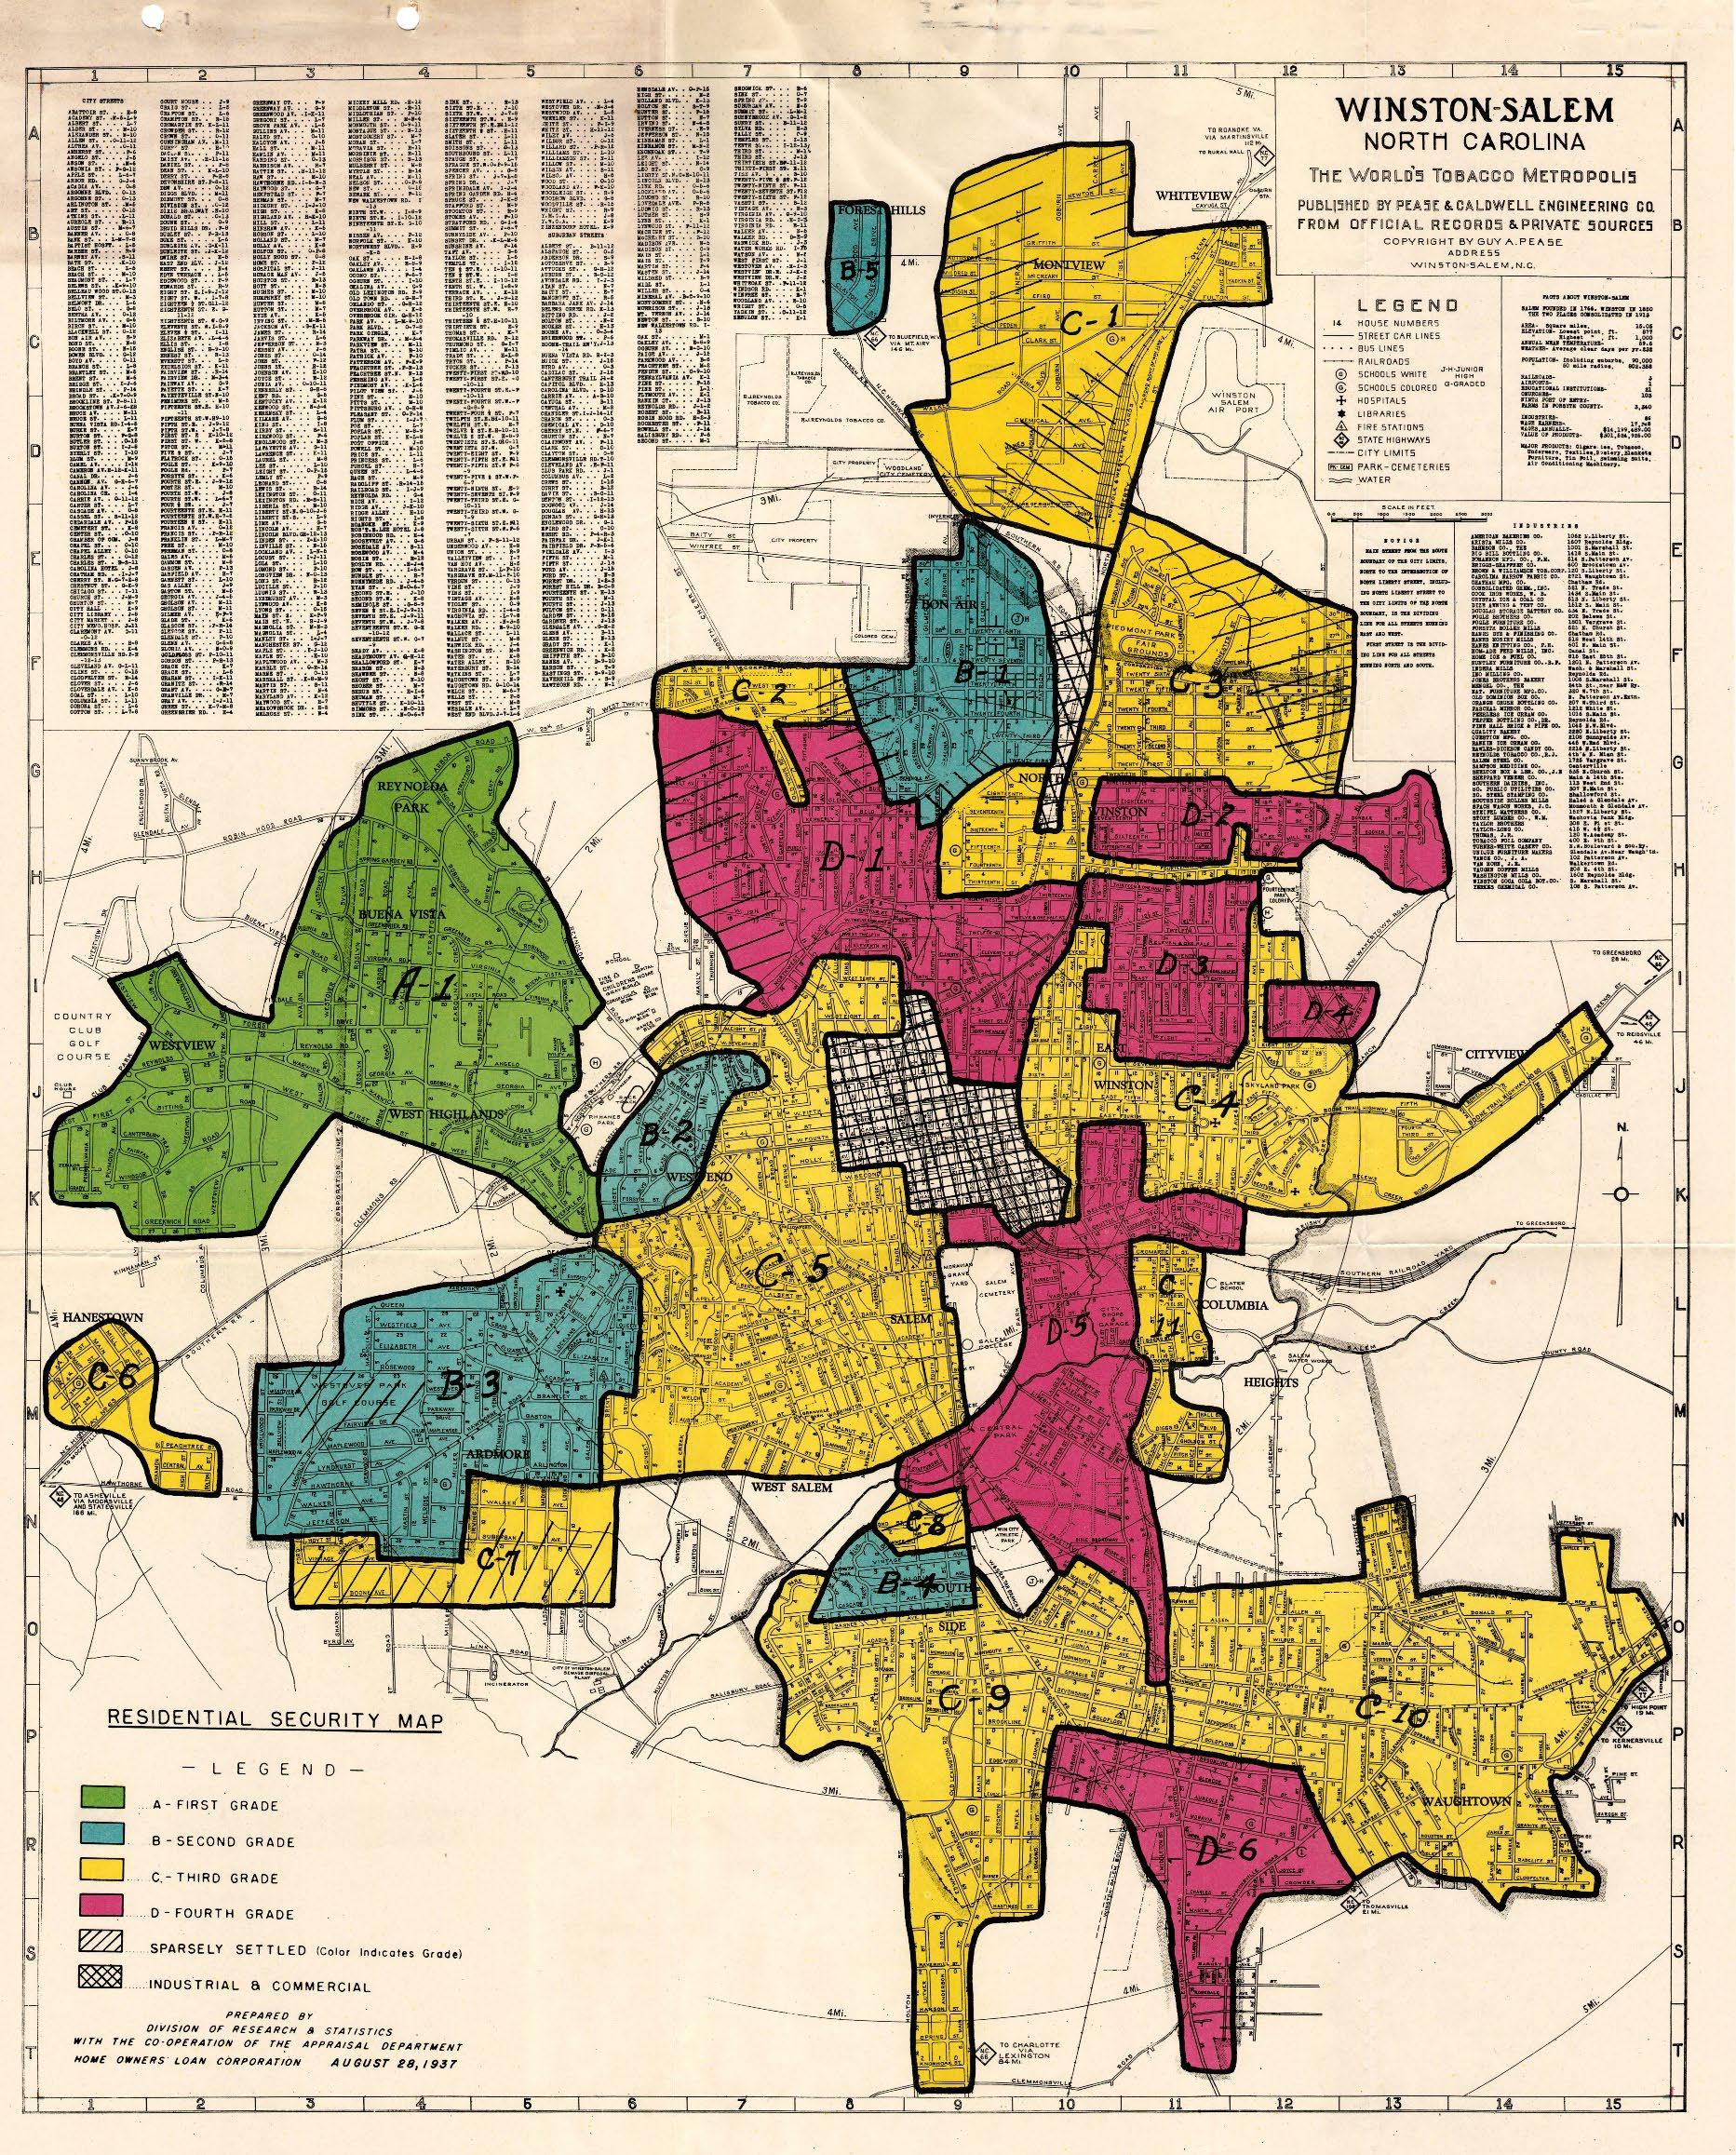
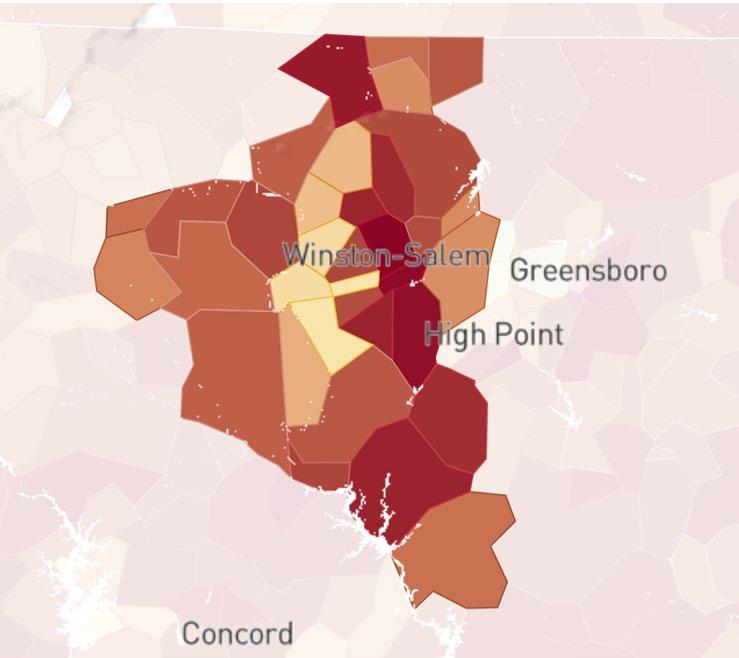
The Geography of Upward Mobility and History’s Long Shadow
Rates of Upward Mobility contrasted with Redlining Boundaries in Winston-Salem, NC
Source: Chetty, Hendren, Kline, Saez (QJE 2014)
Changes in Opportunity
Average Household Income in Adulthood for Children whose Parents were Low-Income
Born in 1978 (Gen X)
Born in 1992 (Millennial)
Household Income Percentile at Age 27 for Children with Parents at 25th Percentile
Source: Chetty, Dobbie, Goldman, Porter, Yang (2024)
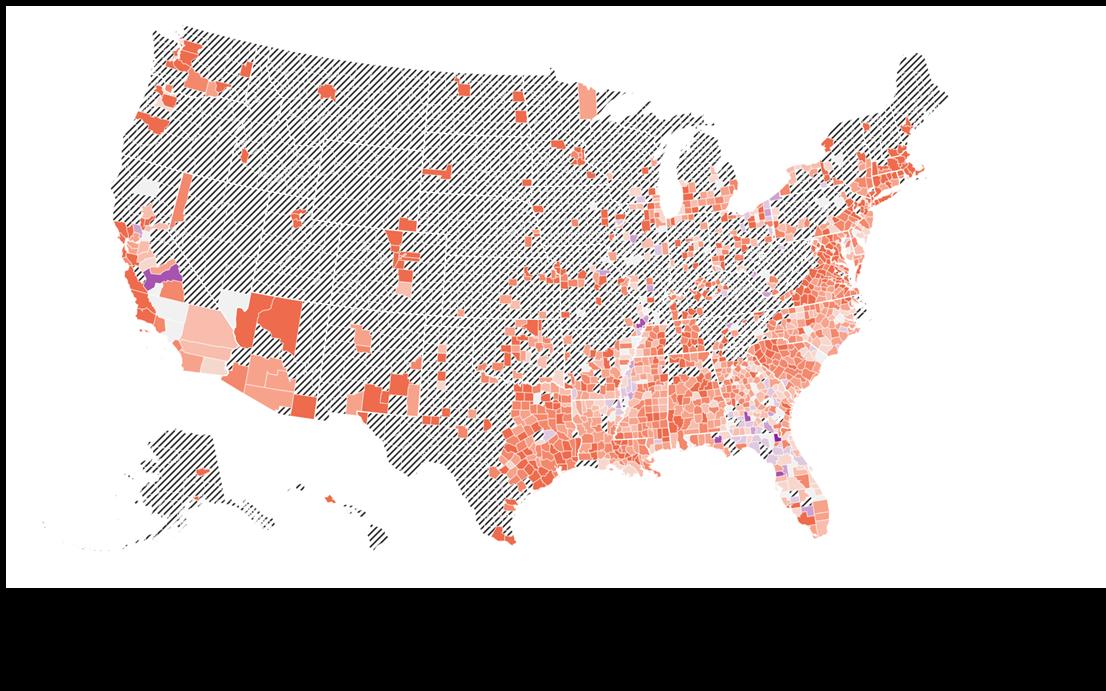
Changes in Opportunity
Average Household Income in Adulthood for Children whose Parents were Low-Income
Born in 1978 (Gen X)
Born in 1992 (Millennial)
Household Income Percentile at Age 27 for Children with Parents at 25th Percentile
Source: Chetty, Dobbie, Goldman, Porter, Yang (2024)
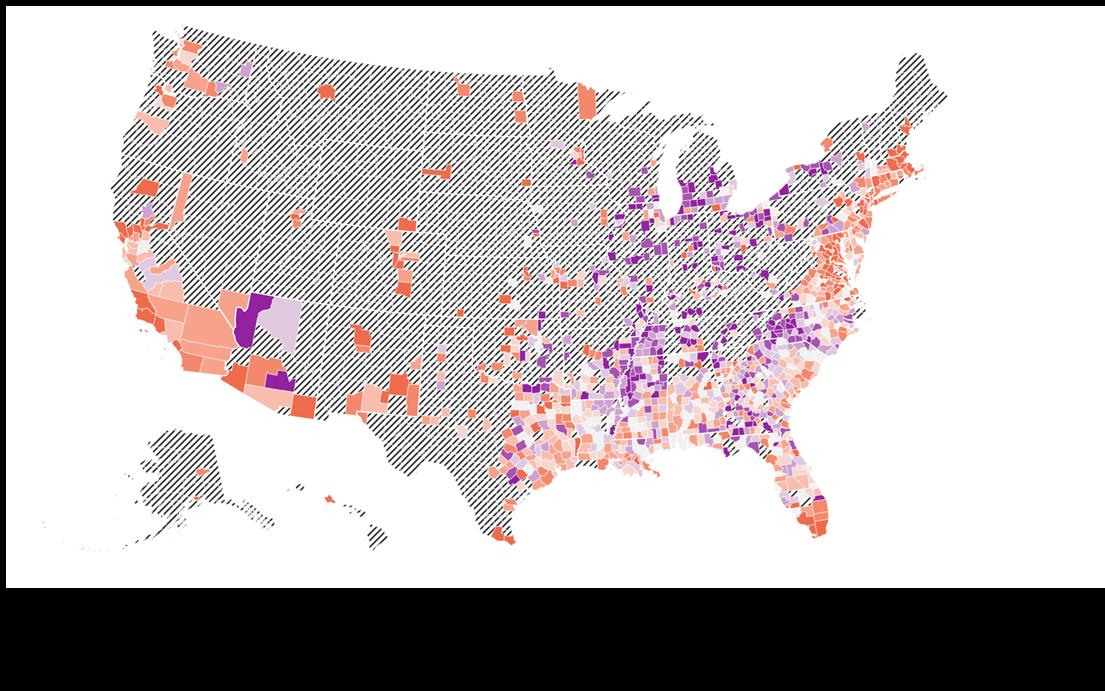
Changes in Opportunity for White Americans
White Children with Low-Income Parents
Born in 1978 (Gen X)
Born in 1992 (Millennial)
Household Income Percentile at Age 27 for Children with Parents at 25th Percentile
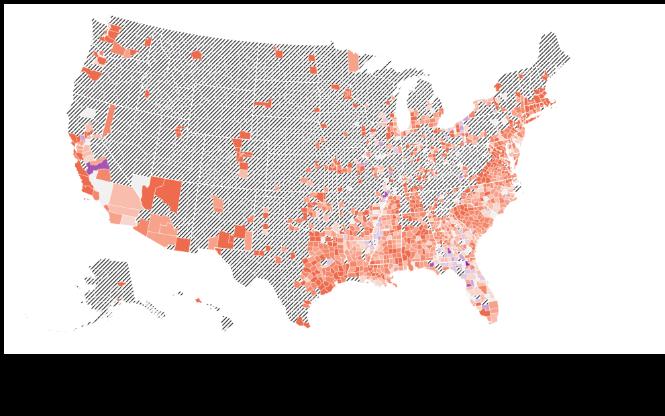
Changes in Opportunity for Black Americans
Black Children with Low-Income Parents
Born in 1978 (Gen X)
Born in 1992 (Millennial)
Household Income Percentile at Age 27 for Children with Parents at 25th Percentile
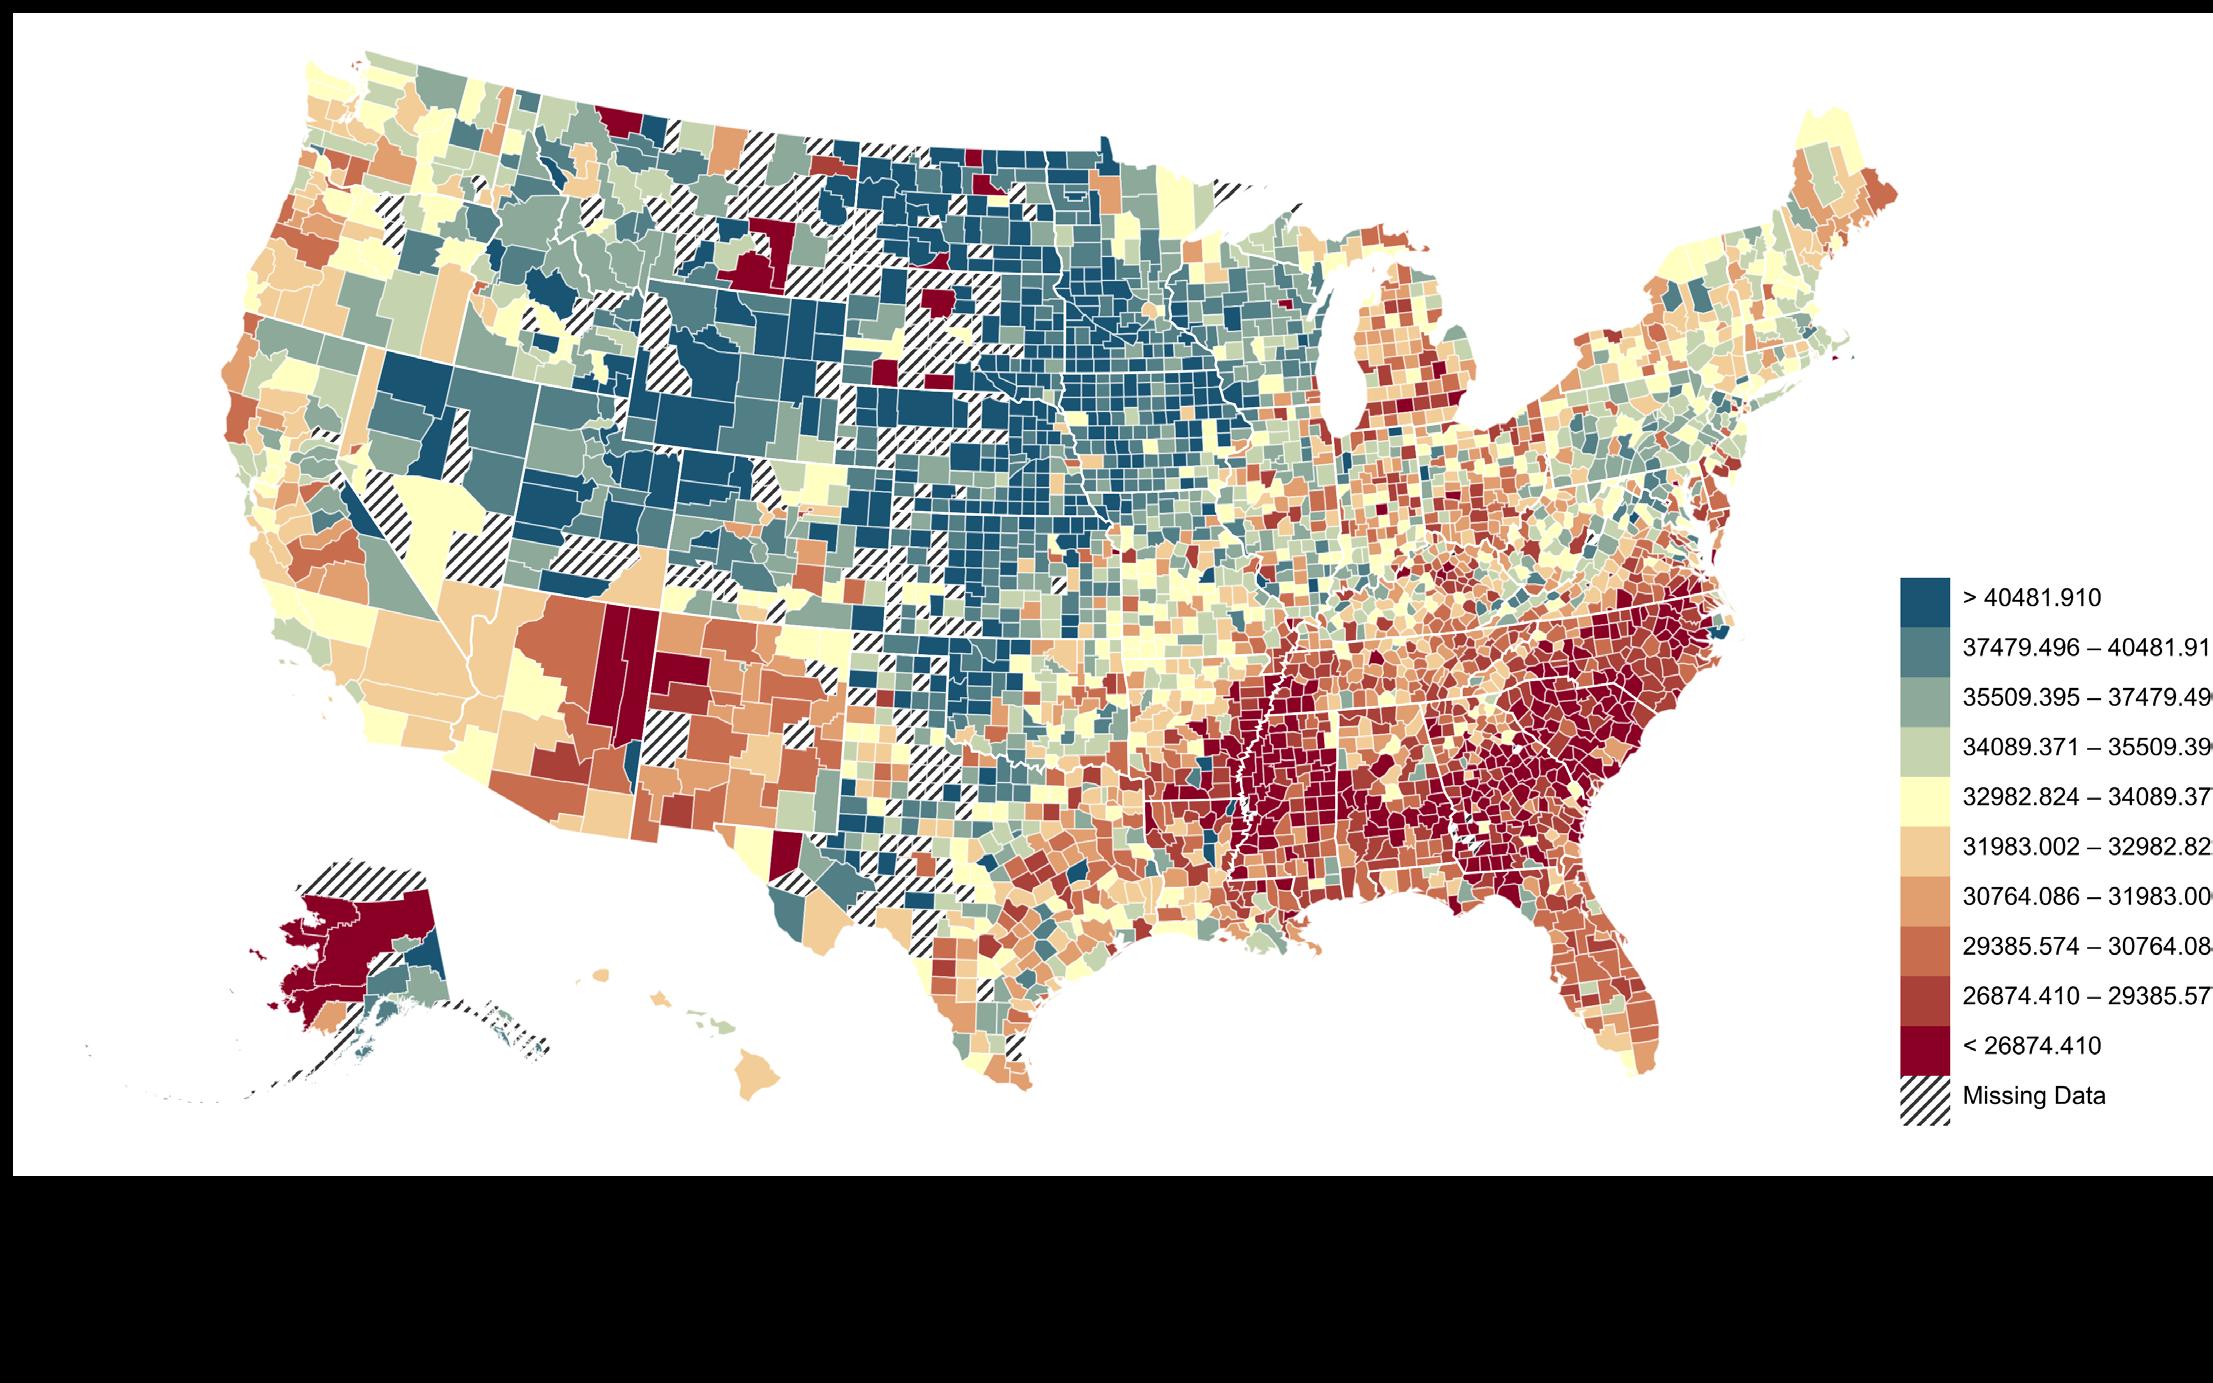
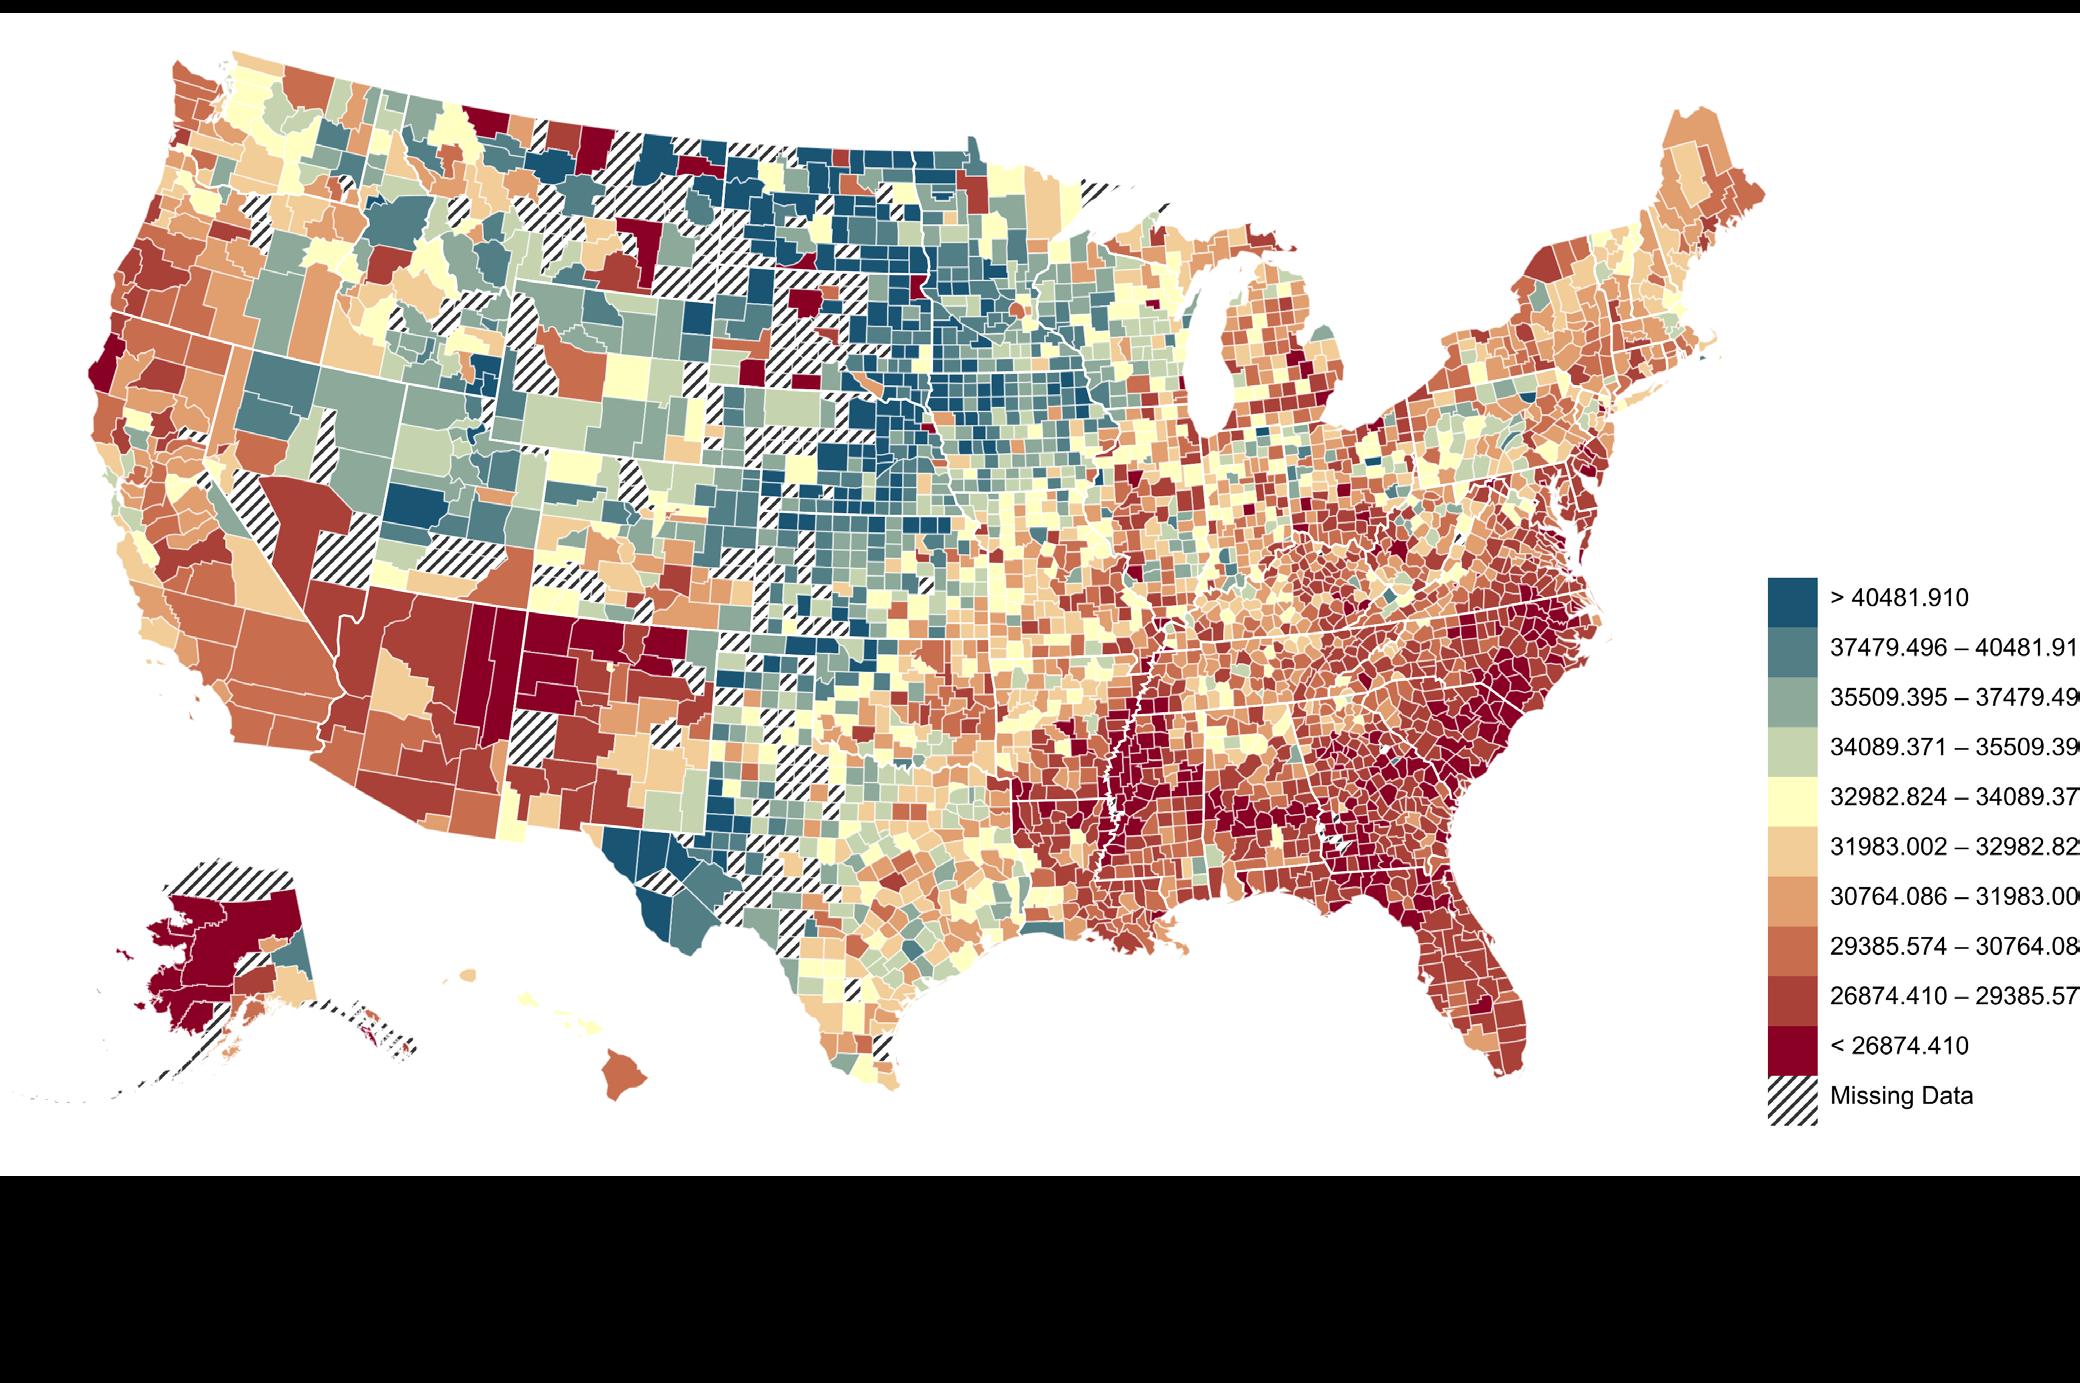
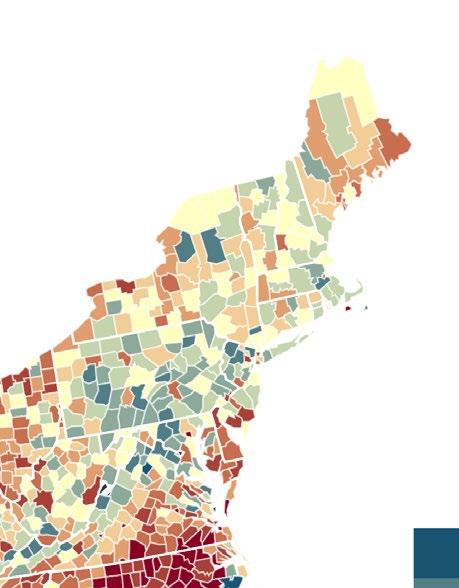
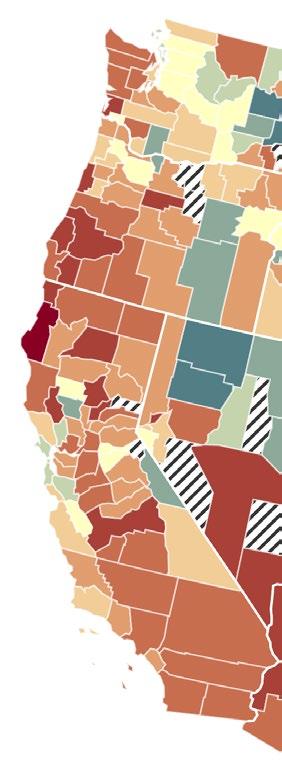
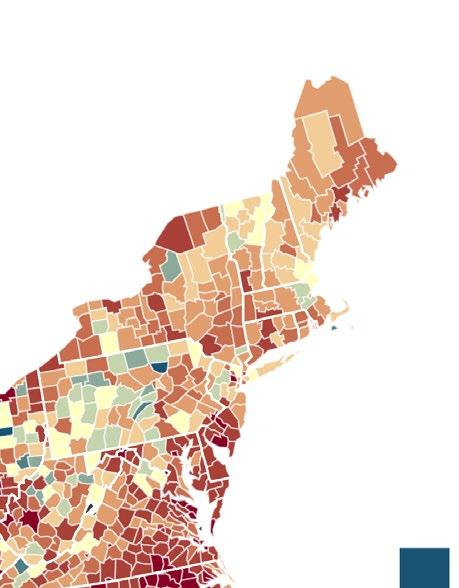
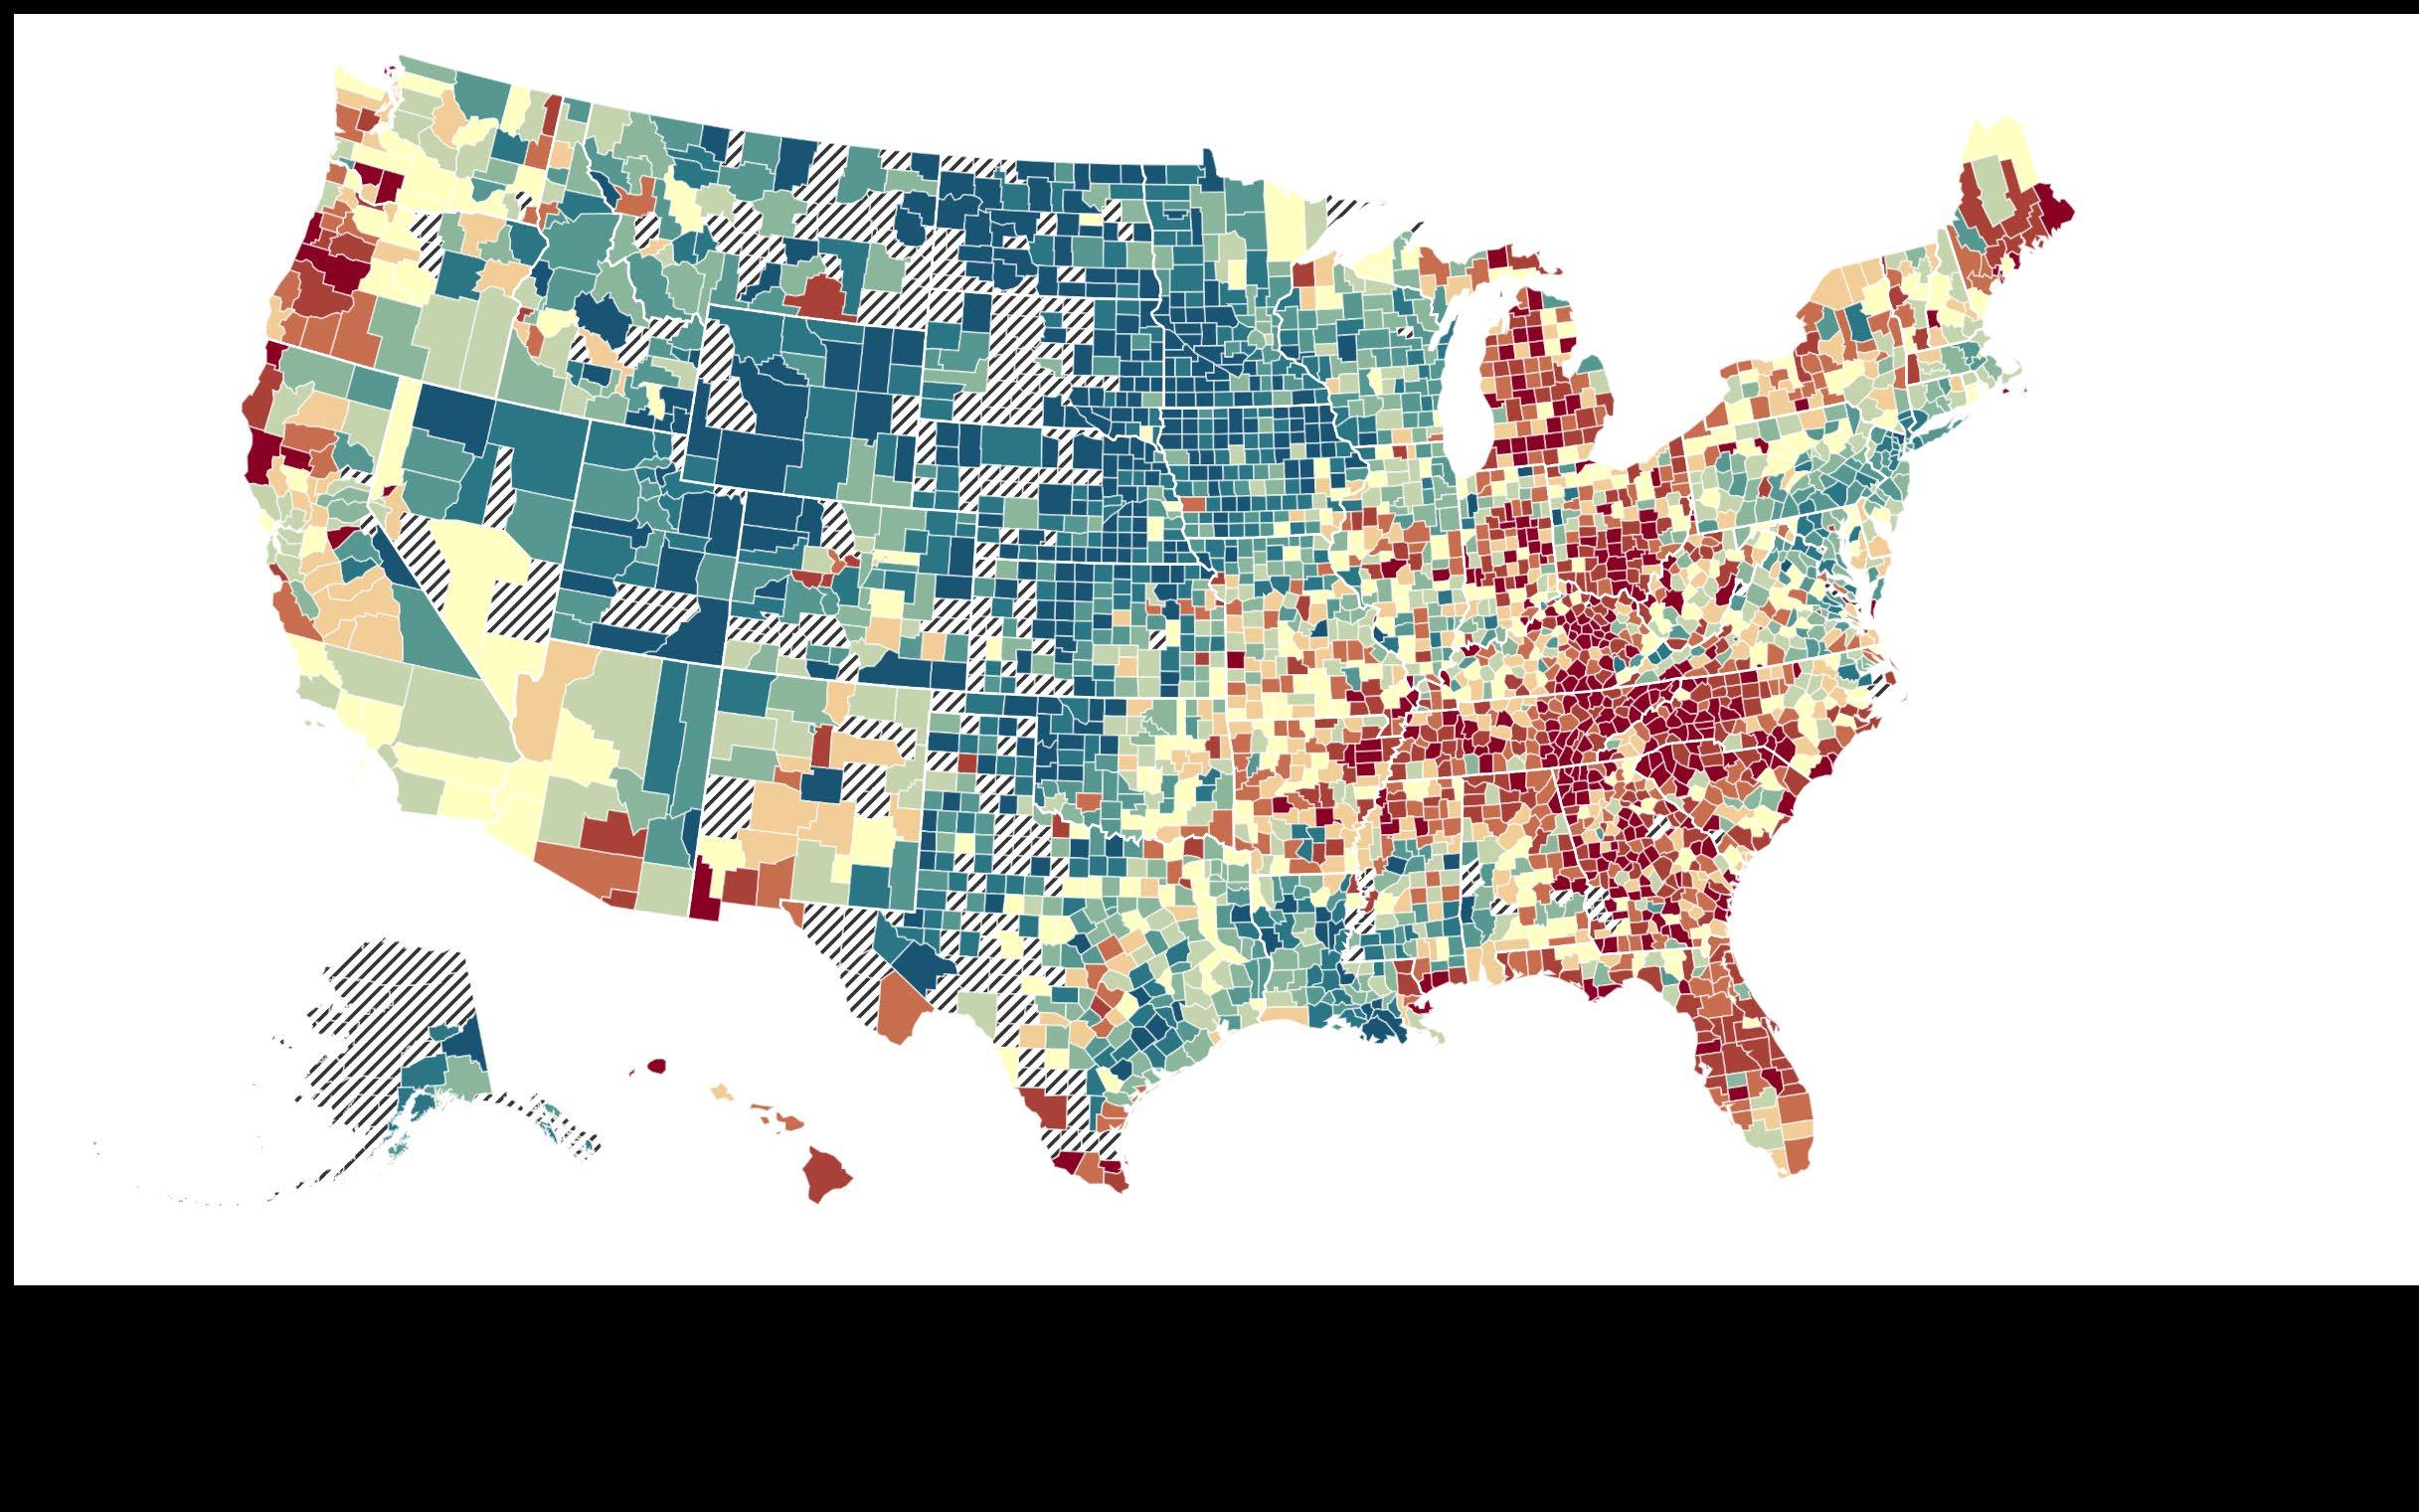
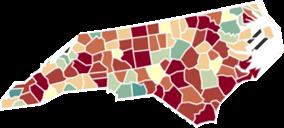
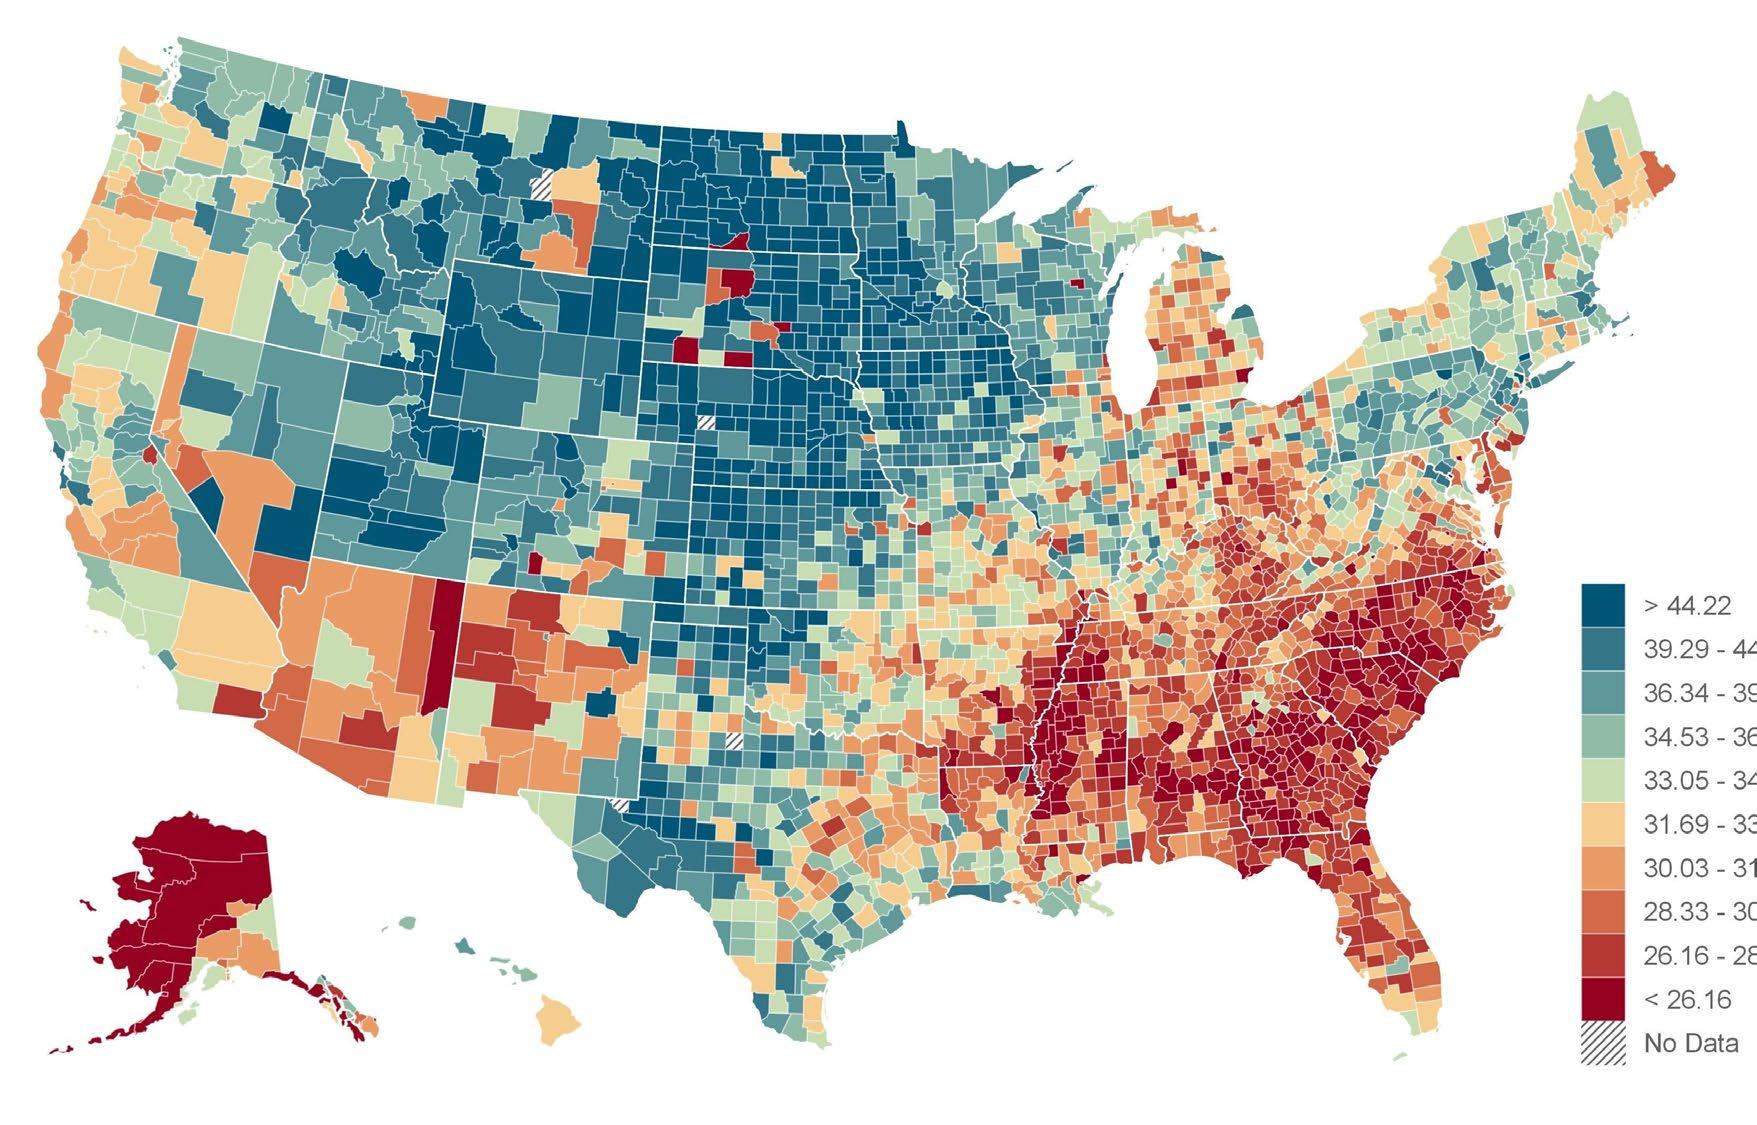
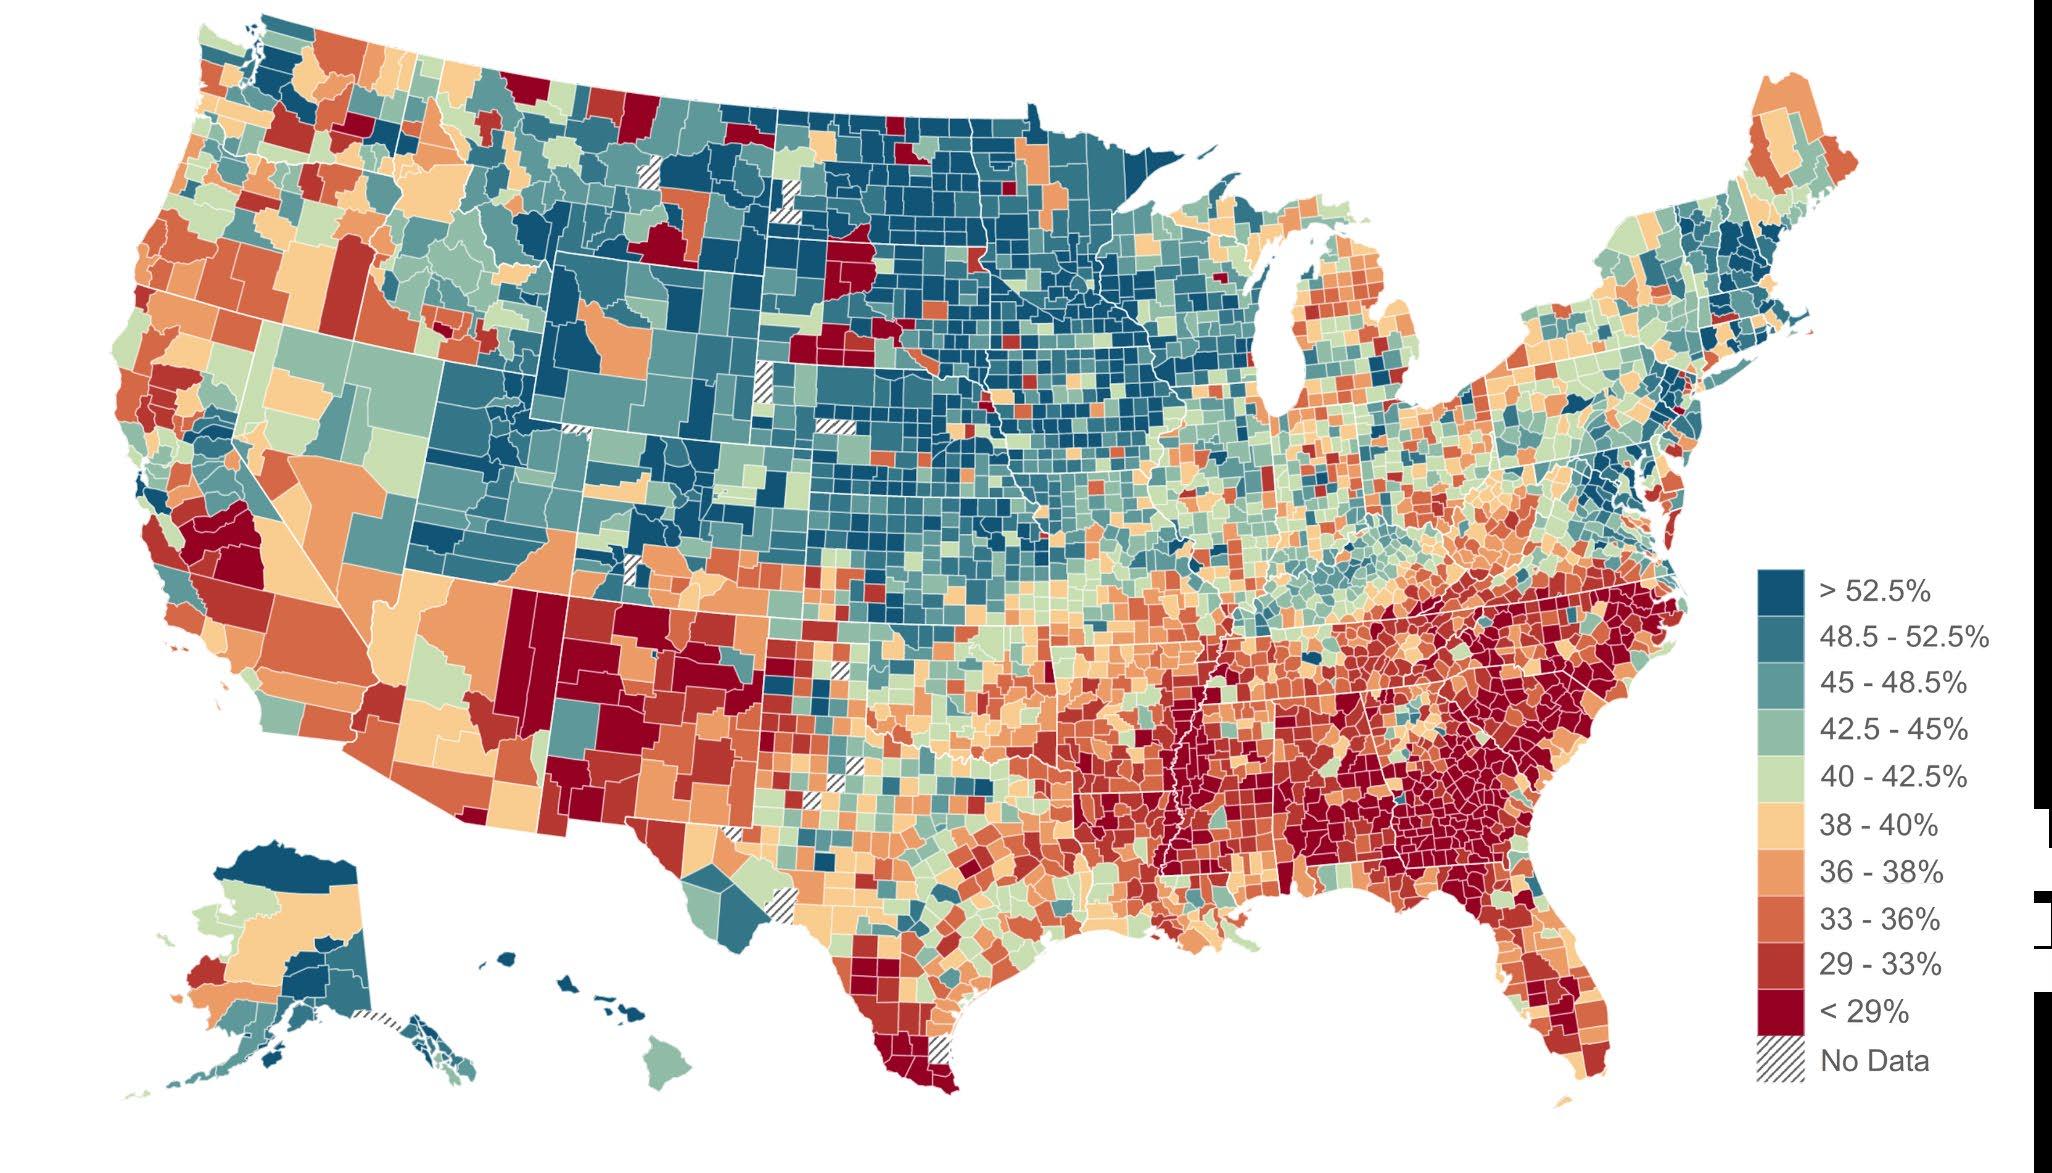
The Geography of Upward Mobility in the United States
Average Household Income at Age 27 for Children born in 1992 whose Parents Earned $27K
Black Children Born in 1992
White Children Born in 1992
Household Income Percentile at Age 27 for Children with Parents at 25th Percentile
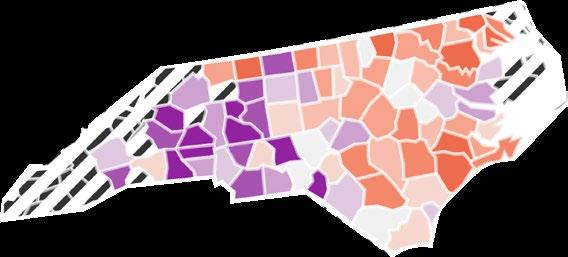
Changes in Opportunity for White Americans in NC / Winston-Salem
White Children with Low-Income Parents
Born in 1978 (Gen X)
Born in 1992 (Millennial)
Household Income Percentile at Age 27 for Children with Parents at 25th Percentile
Source: Chetty, Dobbie, Goldman, Porter, Yang (2024)
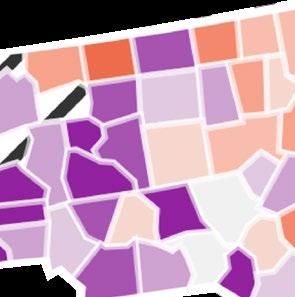
Changes in Opportunity for Black Americans in NC / Winston-Salem
Black Children with Low-Income Parents
Born in 1978 (Gen X)
Born in 1992 (Millennial)
Household Income Percentile at Age 27 for Children with Parents at 25th Percentile
Source: Chetty, Dobbie, Goldman, Porter, Yang (2024)
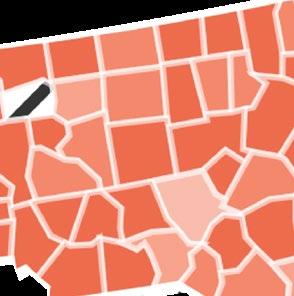
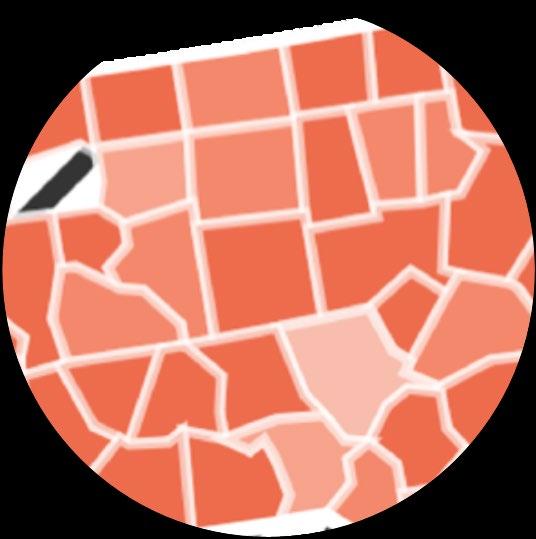
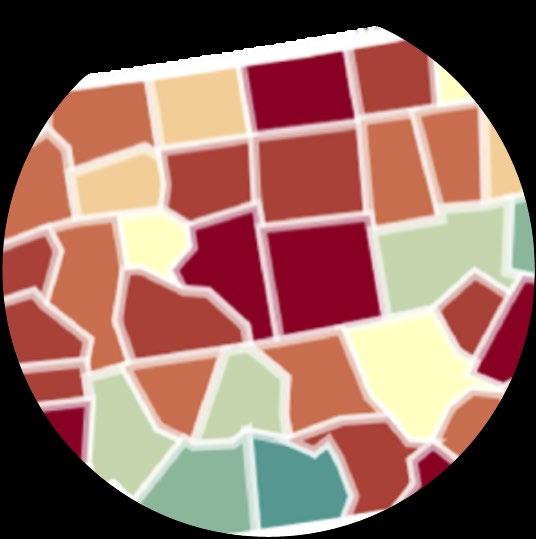
The Geography of Upward Mobility in NC / Winston-Salem
Average Household Income at Age 27 for Children born in 1992 whose Parents Earned $27K
Black Children Born in 1992
White Children Born in 1992
Household Income Percentile at Age 27 for Children with Parents at 25th Percentile
Source: Chetty, Dobbie, Goldman, Porter, Yang (2024)
Changes in Mobility for Black vs. White Children with Low-Income Parents
Forsyth, NC
Changes
in Mobility for Black vs. White Children with Low-Income Parents
Spartanburg, SC
Hamilton, TN
Forsyth, NC
Guilford, NC
Knox, TN
Madison, AL
Jefferson, AL
Greenville, SC
Trends in Economic Mobility by Group in Forsyth County
Change in Children’s Income in Adulthood born to Low-Income Parents, 1978 vs. 1992 Birth Cohorts
Born in 1978 Born in 1992
Source: Opportunity Atlas, Opportunity Insights and the US Census Bureau
Characteristics of High-Opportunity Areas
Opportunity Varies by Place + is hyper local
Average Household Income at Age 35 for Children whose Parents Earned $27K (25th percentile)
Source: Chetty, Hendren, Kline, Saez (QJE 2014)
Higher Opportunity Neighborhood $45K
Lower Opportunity Neighborhood $16K
Blue = More Upward Mobility Red = Less Upward Mobility
Characteristics of High Mobility Neighborhoods
Characteristics of High Mobility Neighborhoods
Lower Poverty Rates More Stable Family Structure Better School Quality
50% Exposure
Segregation by Income
50% Friending Bias
Interaction conditional on exposure
Economic
Opportunity and Social Capital
Upward Mobility Based on Tax Records
Average Household Income at Adulthood for Children with Low-Income Parents
Economic Connectedness Based on Facebook Data
Share of High-Income Friends among Low-Income People
Real-world applications of social capital data to improve outcomes
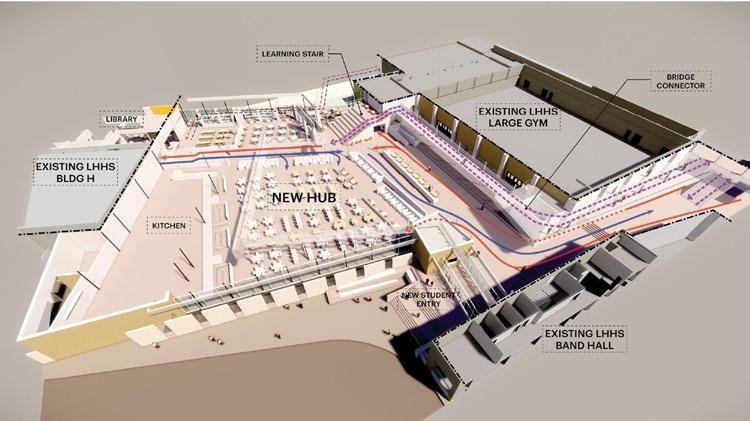
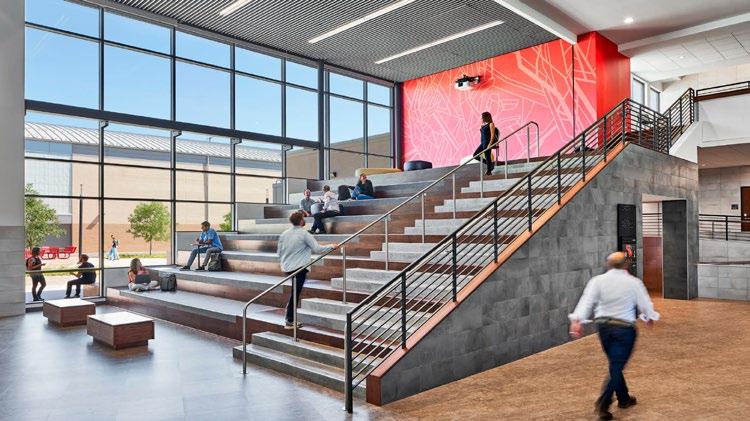
Architectural design in schools
Dallas, TX
A school that had separate cafeterias for free/reduced lunch students redesigned the campus to create communal spaces that promote social connection.
Thinking Outside the Checkbox: How HKS Teamed Up with a Dallas School to Connect Divided Campus
Source: Lake Highlands High School; Station Soccer
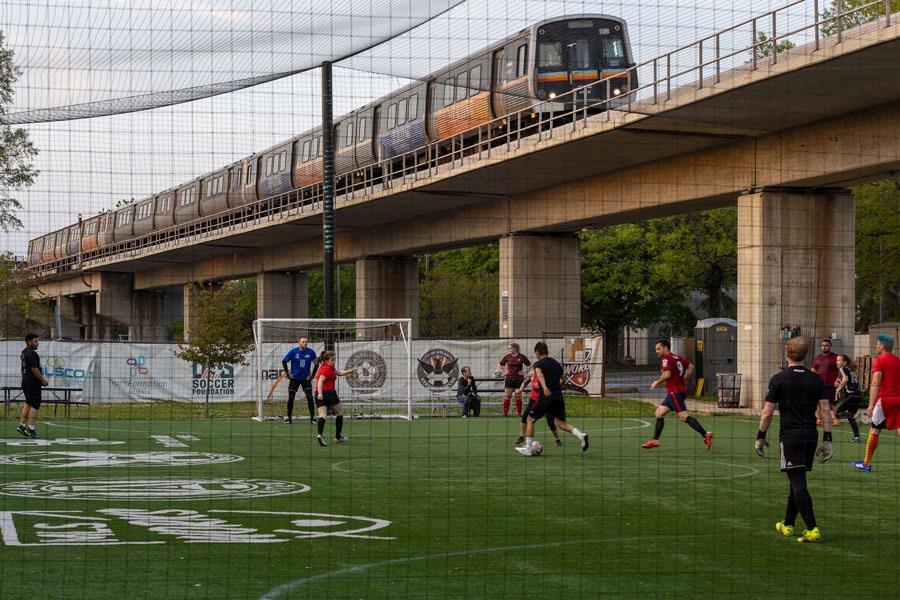
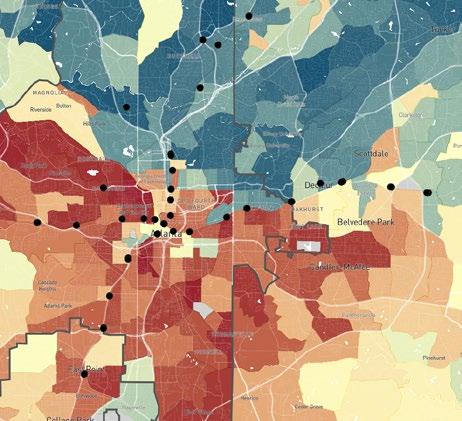
Building connection through transit and sports Atlanta, GA
Station Soccer teamed up with MARTA to build soccer fields and youth sport programs at public transit stations to build connection across the city.
Connecting Communities: Adding Soccer Fields to Atlanta’s MARTA Stations
MARTA Stations
Policy Approaches to Increasing Upward Mobility
Three Policy Approaches to Increasing Upward Mobility
Reducing Segregation
Place-Based Investments
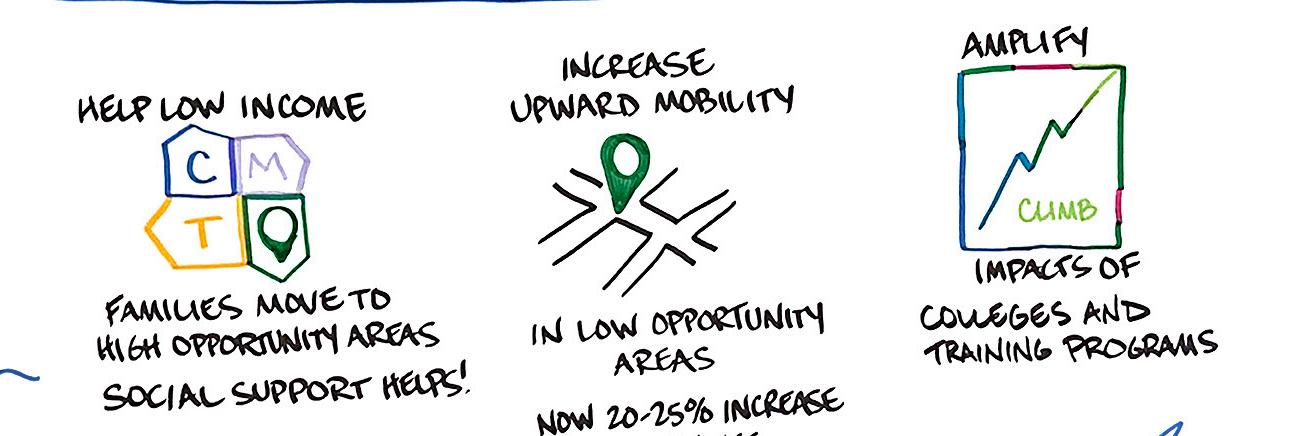
Help Low-Income
Families Move to High-Opportunity Areas
Increase Upward Mobility in LowOpportunity Areas
Higher Education & Workforce Training
Amplify Impacts of Colleges and Training Programs on Mobility
Three Policy Approaches to Increasing Upward Mobility
Reducing Segregation
Place-Based Investments
Help Low-Income
Families Move to High-Opportunity Areas
Increase Upward Mobility in LowOpportunity Areas
Higher Education & Workforce Training
Amplify Impacts of Colleges and Training Programs on Mobility
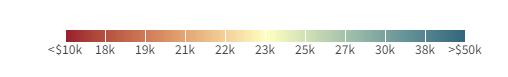
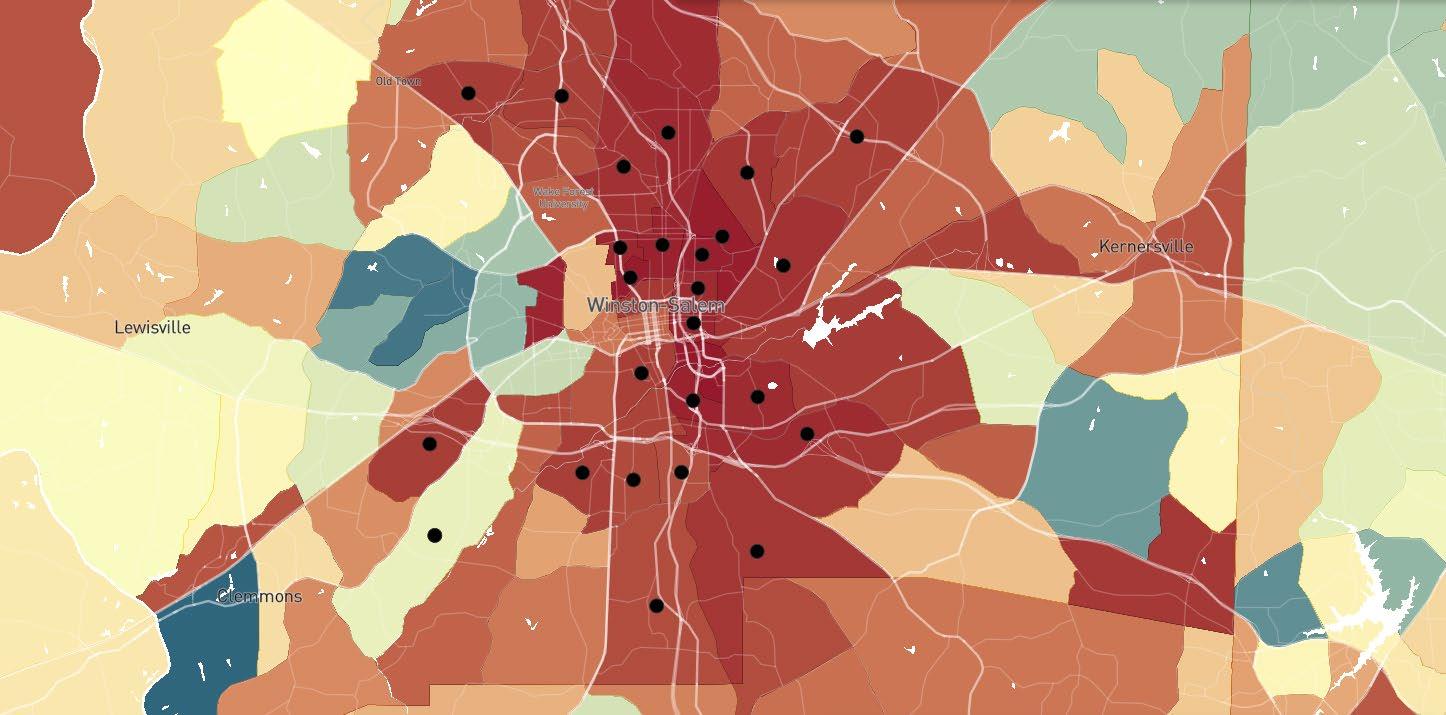
Where Housing Voucher Holders Live in Winston-Salem
25 most common tracts where voucher holders lived in 2015-19
>$60k $34k <$10k
Blue = More Upward Mobility Red = Less Upward Mobility
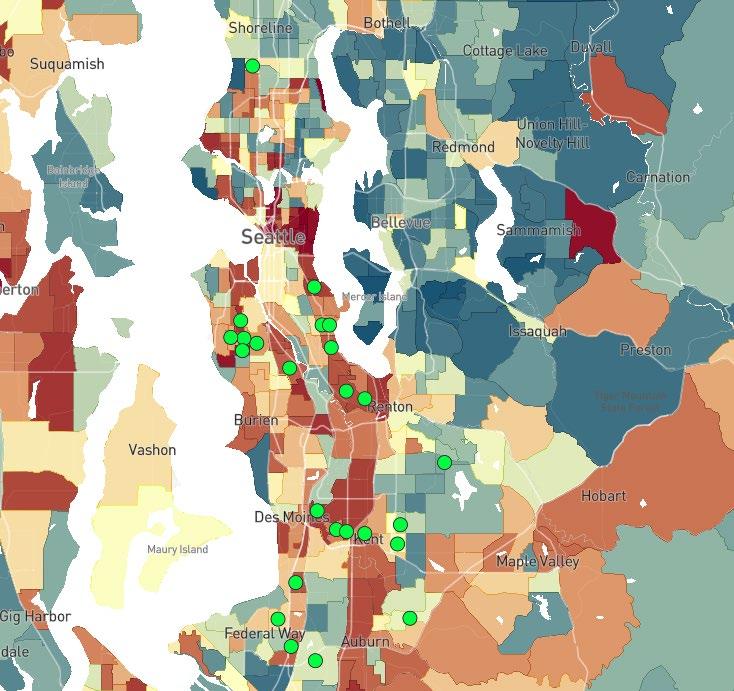
Where Housing Voucher Holders Live in Seattle
25 most common tracts where voucher holders lived in 2015-17
Percentile Rank in Adulthood
> 60 ($55k)
48 ($39k)
< 30 ($20k)
Improving
Housing Policy at the Local and Federal Levels
Expanding families’ access to high opportunity neighborhoods
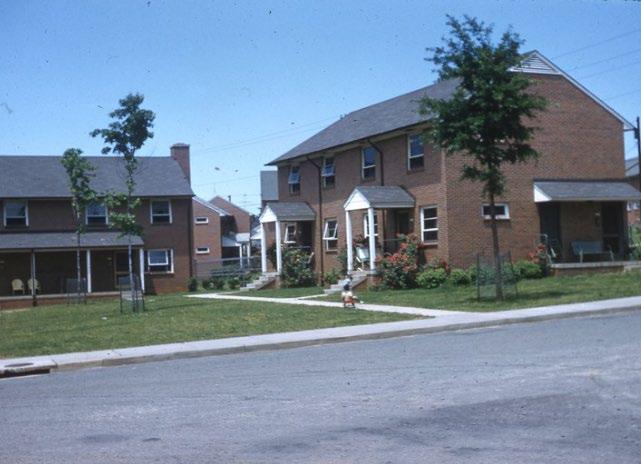
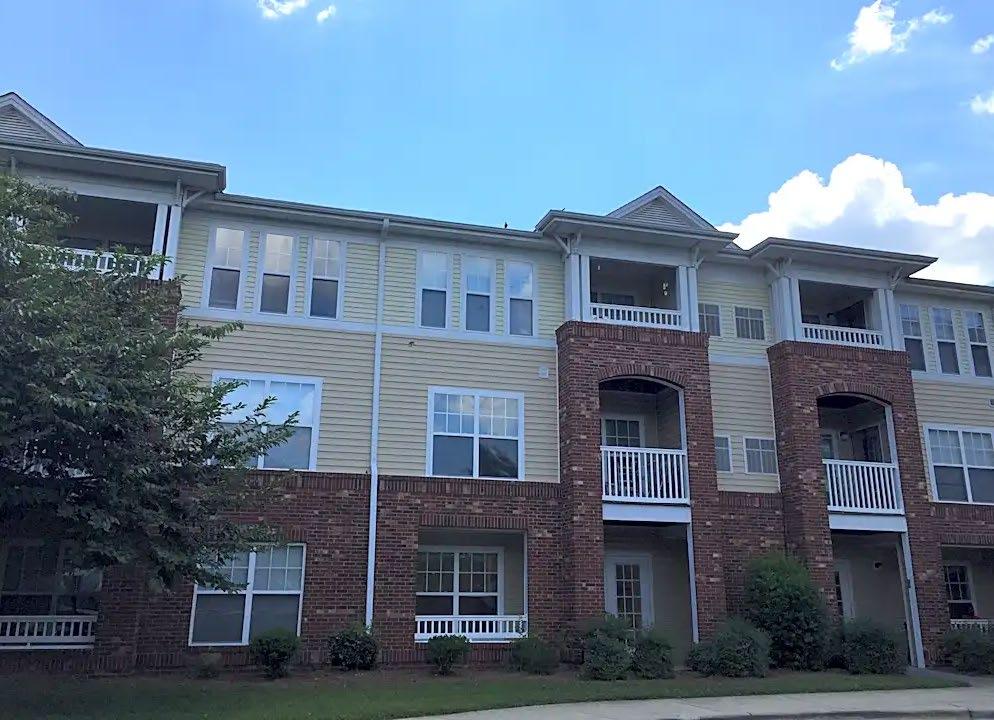
Creating Moves to Opportunity Seattle, WA
CMTO, a pilot program in Seattle, tested strategies to help families with housing choice vouchers move to high-opportunity neighborhoods. Promising results catalyzed new federal housing investments.
A Better Address Can Change a Child’s Future
In Seattle, A Move Across Town Could Be A Path Out Of Poverty
Seattle may have figured out how to get more poor people into better housing
Source: CMTO
Community
U.S. Department of Housing and Urban Development
HUD launches $75M Community Choice
Demonstration project in CA, LA, MN, NY, OH, PA, and TN to replicate the CMTO approach.
U.S. Congress
Bipartisan bill, Family Stability & Opportunity Vouchers Act, to add 250K vouchers to increase stability and geographic choice for families.
U.S. Congress
Bipartisan bill, Choice in Affordable Housing Act, to provide $500M to increase landlord participation and expand access to vouchers.
Three Policy Approaches to Increasing Upward Mobility
Reducing Segregation
Place-Based Investments
Help Low-Income Families Move to High-Opportunity Areas
Increase Upward Mobility in LowOpportunity Areas
Higher Education & Workforce Training
Amplify Impacts of Colleges and Training Programs on Mobility
HOPE VI Neighborhood Revitalization Program
Housing Opportunities for People Everywhere: $16.7 bn spent to Revitalize 261 Public Housing Sites (1993-2010)
Sparking City-Wide Partnerships to Increase Economic Mobility
In Charlotte, NC and Philadelphia, PA
Charlotte
$160M corporate investment in local workforce development
Mayor’s initiative raises $250M to boost opportunity in Charlotte
A local data tool developed to monitor opportunity indicators for >100 area nonprofits
Philadelphia
$20M investment will support training programs for in-demand jobs and provide wraparound services to expand economic opportunity for all Philadelphians.
We are investing not only in jobs, but in people –ensuring Philadelphians are trained, supported, and connected to the industries that are shaping the future of our city. With the help of key public-private partners, like the William Penn Foundation and Comcast, together we are building and growing One Philly, a United City.
- Cherelle Parker, Mayor of Philadelphia, PA April 23, 2025
Source: YearUp & Bank of America | The Mayor’s Initiative | Leading on Opportunity
Three Policy Approaches to Increasing Upward Mobility
Reducing Segregation
Place-Based Investments
Help Low-Income
Families Move to High-Opportunity Areas
Increase Upward Mobility in LowOpportunity Areas
Higher Education & Workforce Training
Amplify Impacts of Colleges and Training Programs on Mobility
Source: Chetty, Katz, Noray, Porter, Reisinger (2025) Control Treatment
Participants enrolled in YearUp
Ways To Explore The Data
The Opportunity Atlas Which places in America offer children the best chance to rise out of poverty?
Virtual Office Hours
Talk directly with our team.
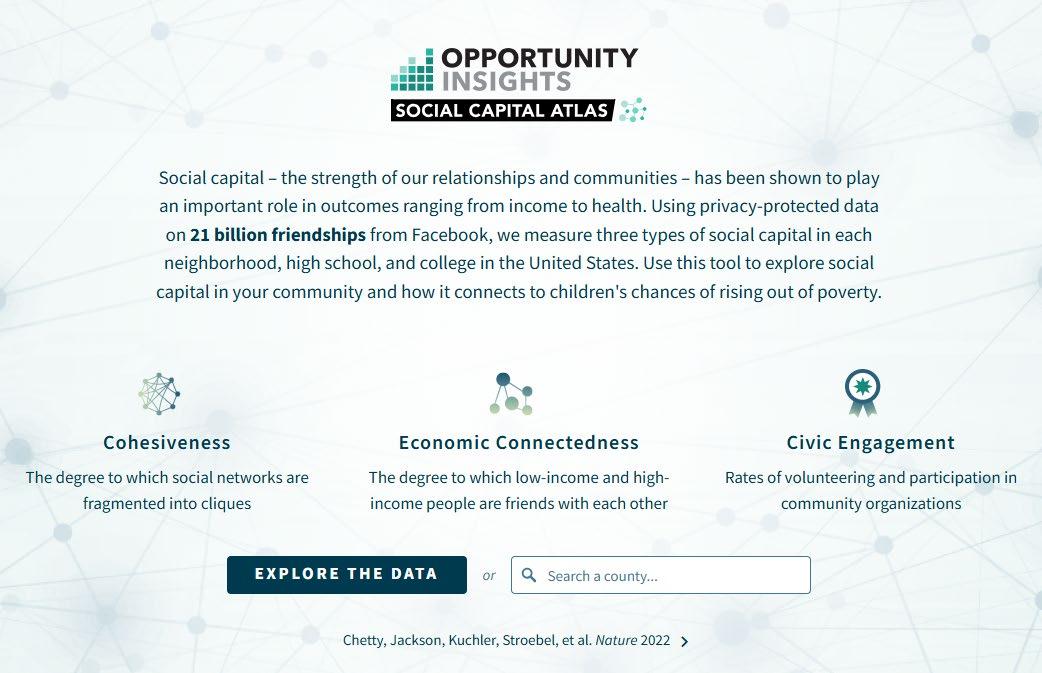
The Social Capital Atlas
The degree to which lowincome and high-income people are friends with each other.
Mobility Report Cards
Economic diversity and student outcomes at America’s colleges and universities.
Research Papers
Explore all of OI’s research.
Appendix Slides
Key Takeaways for Winston-Salem
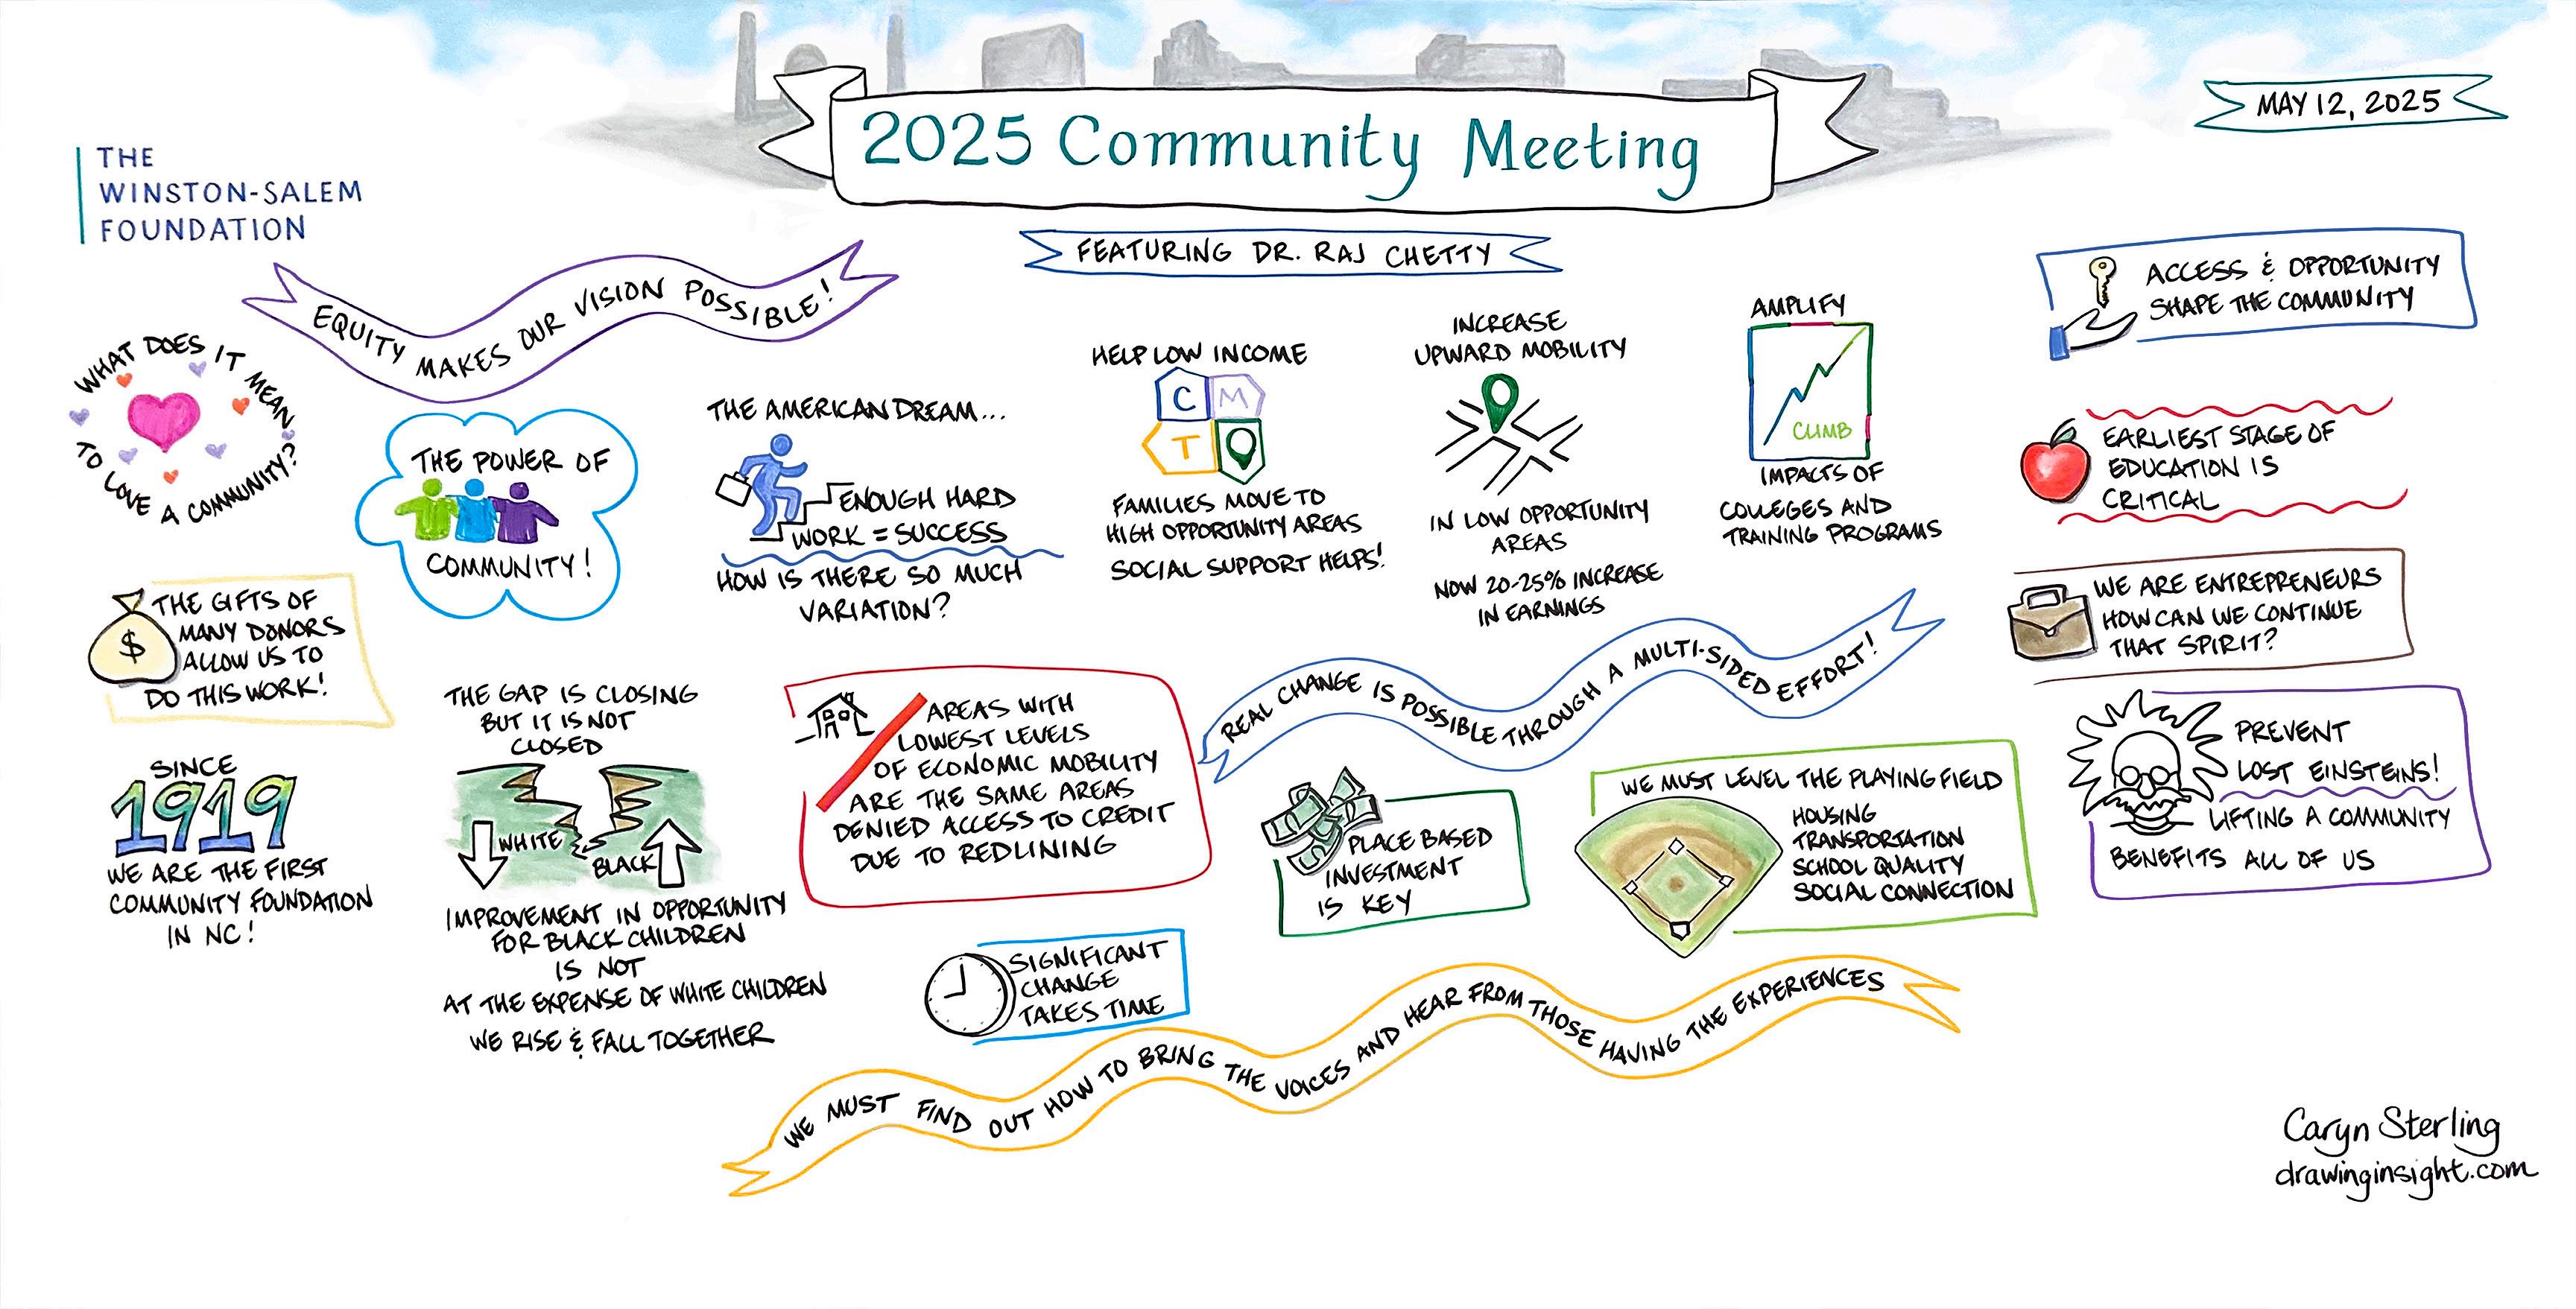
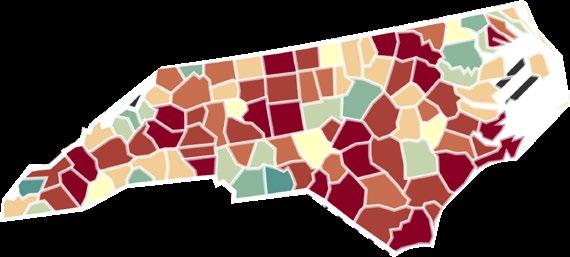
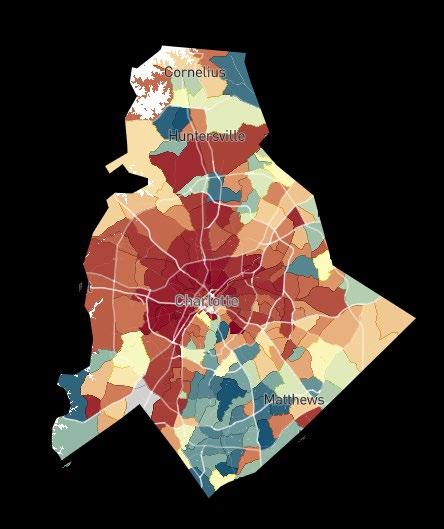
Opportunity varies widely across Forsyth County neighborhoods.
Average adult household income for children from low-income families ranges from $16K in neighborhoods east of Highway 52 to $45K in the western part of the city—a nearly $25K gap between lower- and higher-opportunity areas.
Economic mobility has improved modestly in Forsyth County.
Children from low-income families born in 1992 (Millennials) earned about $700 more in average household income than those born in 1978 (Gen X)—a 2.7% increase, from $25,700 to $26,400.
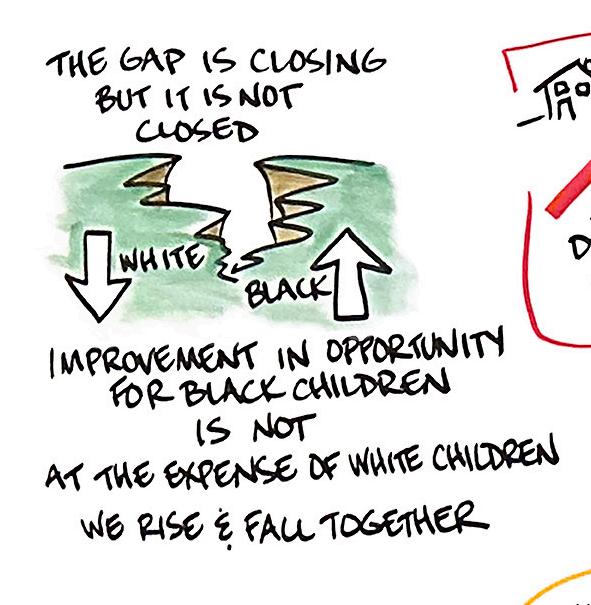
Earnings gaps between low-income Black and white children have narrowed but remain significant.
The gap decreased by 38%, from $12,400 to $7,700 a meaningful improvement, though a substantial disparity persists.
Economic
Connectedness is a key factor for
improving upward mobility.
Communities with more cross-class interaction have higher levels of upward mobility.
Income Gain from Moving to a Higher Opportunity Neighborhood
By Child’s Age at Move
Source: Chetty and Hendren (QJE 2018)
Age of Child when Parents Move
Ardmore
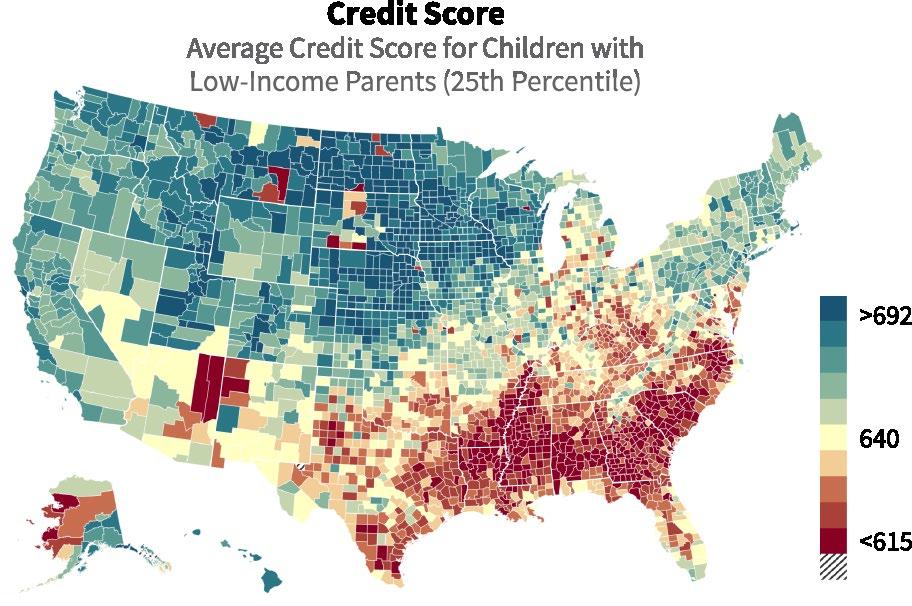
Racial Gaps in Credit Scores Emerge Early and Persist
● Goal 4: Increase upward economic mobility by improving access to workforce development, training, and educational programs for all residents.
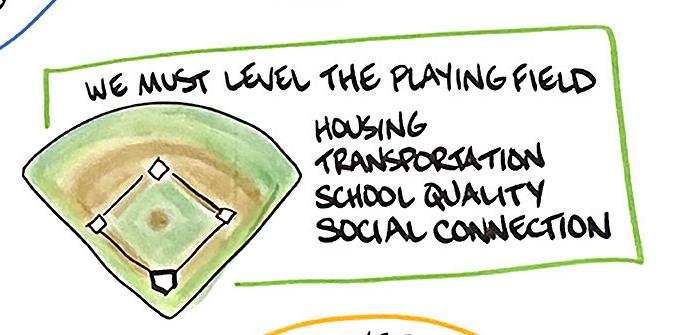
Attainable Housing and Stable Neighborhoods
● Goal 2: Use City and County resources to create and preserve more affordable housing for lowand moderate-income individuals and households.
○ Prioritize and incentivize the development of affordable housing in neighborhoods with access to high-performing schools, workplaces, grocery stores and other services.
● Goal 3: Acknowledge and address historical injustices and inequities that are the result of past policies.
○ Prioritize investment in neighborhoods that were devalued by redlining, urban renewal, and racial zoning, while maintaining affordability and ensuring the investments benefit current residents.
○ Encourage the development of housing that integrates residents of multiple income levels throughout Winston-Salem and Forsyth County, providing access to high-performing schools, workplaces, grocery stores, and other services.
Upcoming Public Input Meetings
Public input is needed to better understand what changes to prioritize and the extent to which changes should be made to zoning regulations. Staff is holding five public meetings to gather input on how best to expand housing choices for Winston-Salem and Forsyth County residents.