


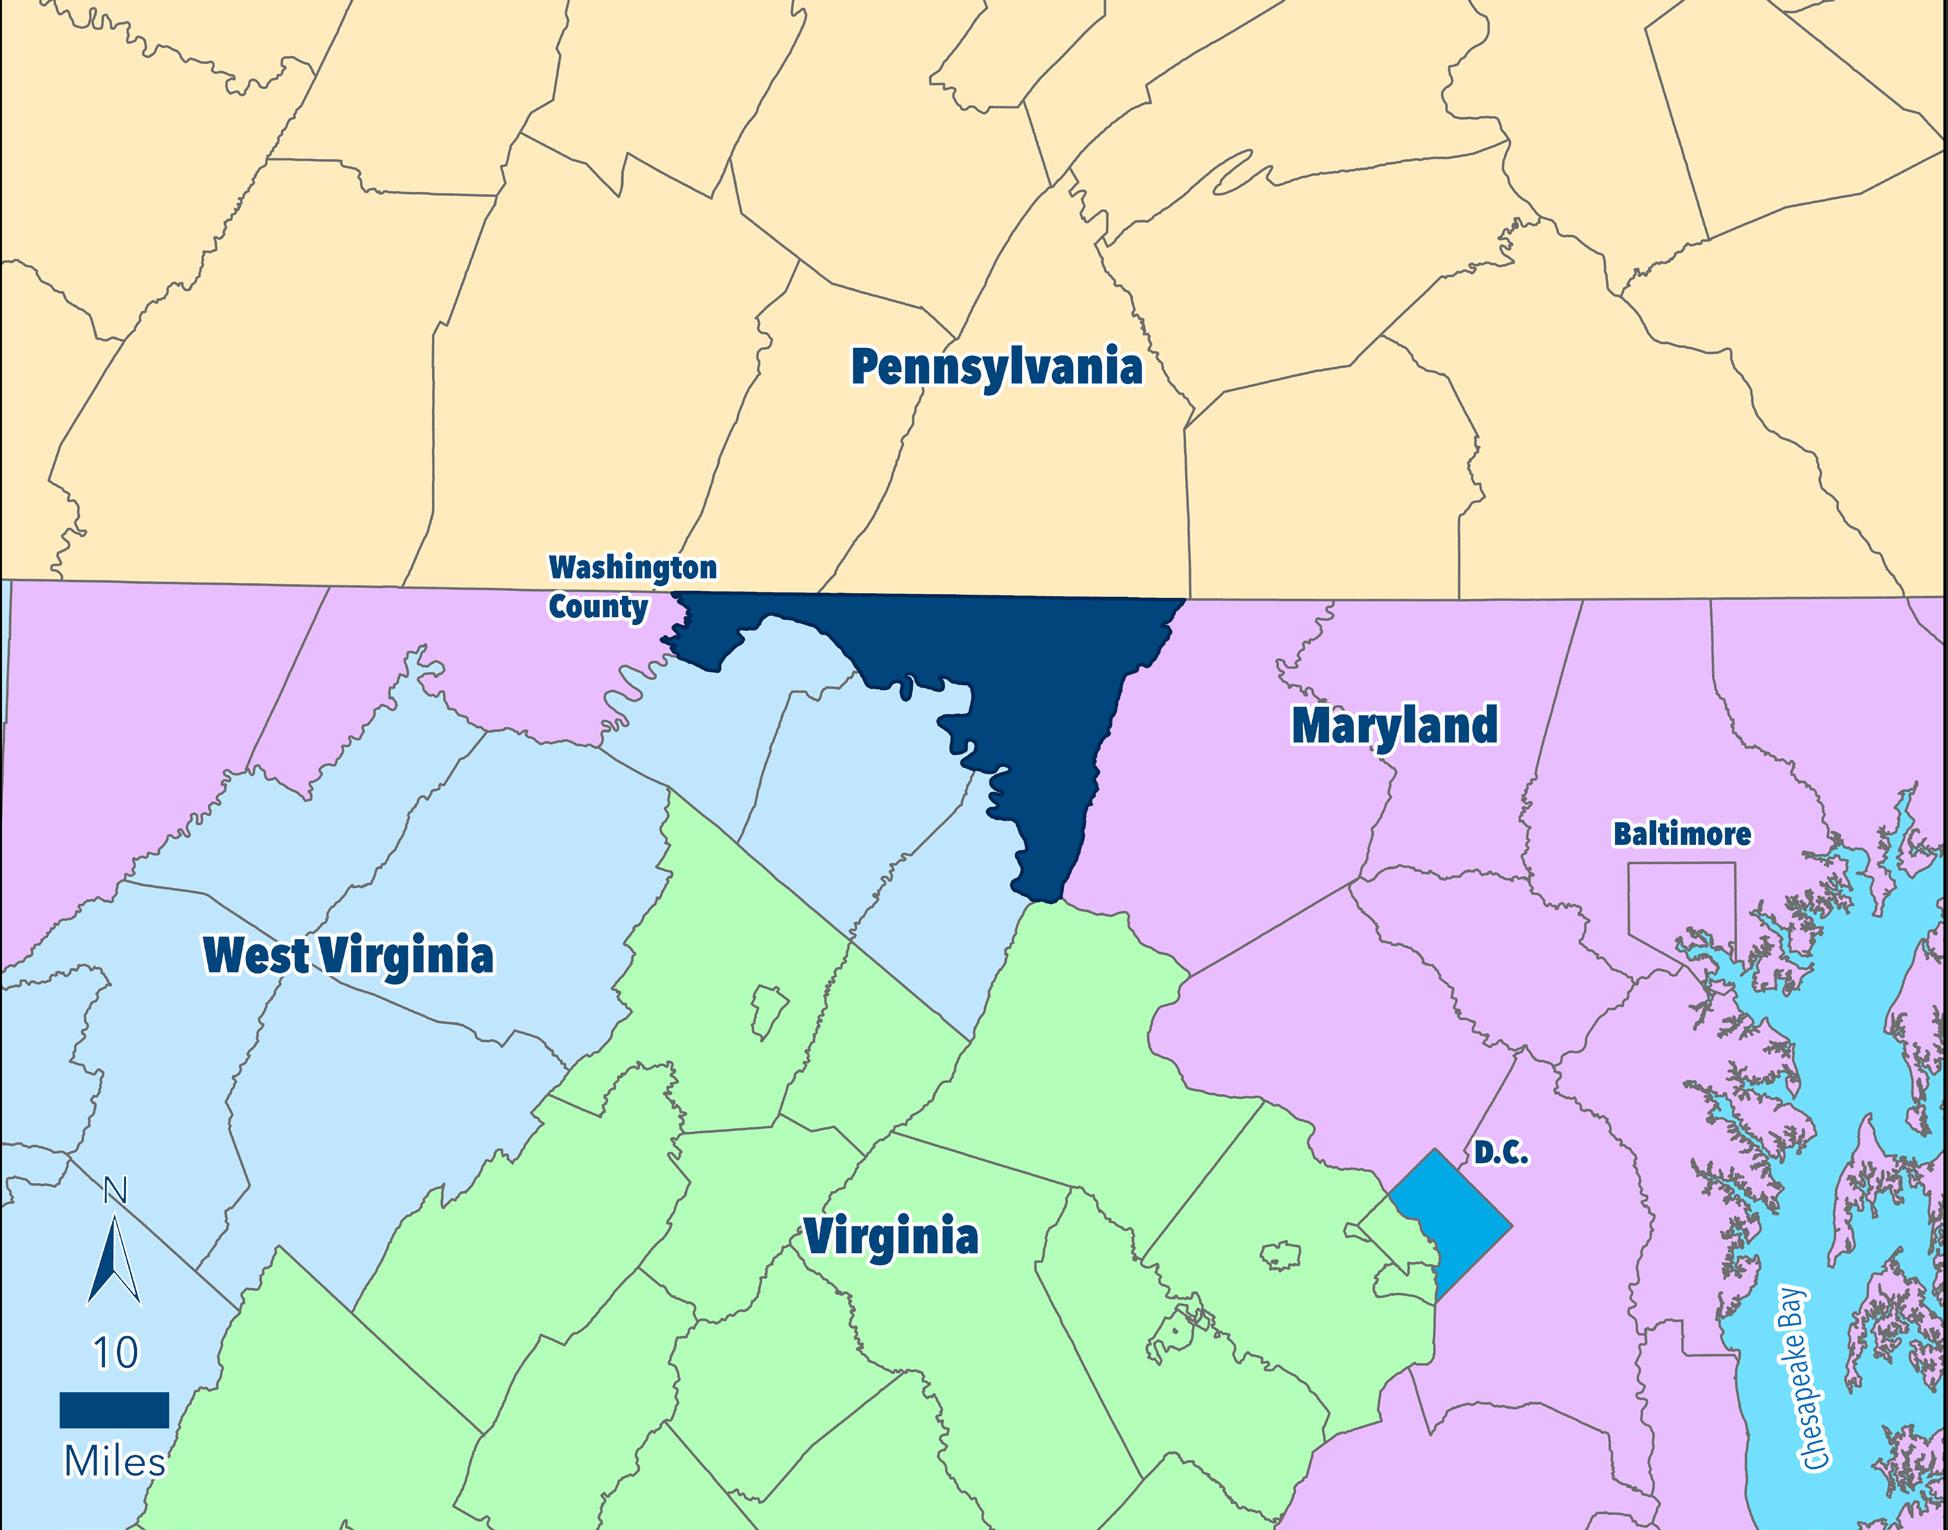
Washington County is one of four counties commonly described as “Western Maryland”. It is bounded to the east by Frederick County; the north by Pennsylvania (Mason-Dixon Line); to the west by Allegany County, and the south by the Potomac River. There are nine incorporated municipalities located within the County. Hagerstown, the County seat and largest municipality, is located approximately 70 miles northwest of Baltimore and Washington DC and 165 miles southeast of Pittsburgh.
The County contains 468 square miles (299,522 acres), of which approximately 455 square miles are land. The terrain consists of prominent ridges and broad valleys running in a northeast to southwest direction. More than 100 miles of shoreline along the Potomac River occur within the County. Two major highways, Interstate 81 and Interstate 70, intersect within the County’s borders.
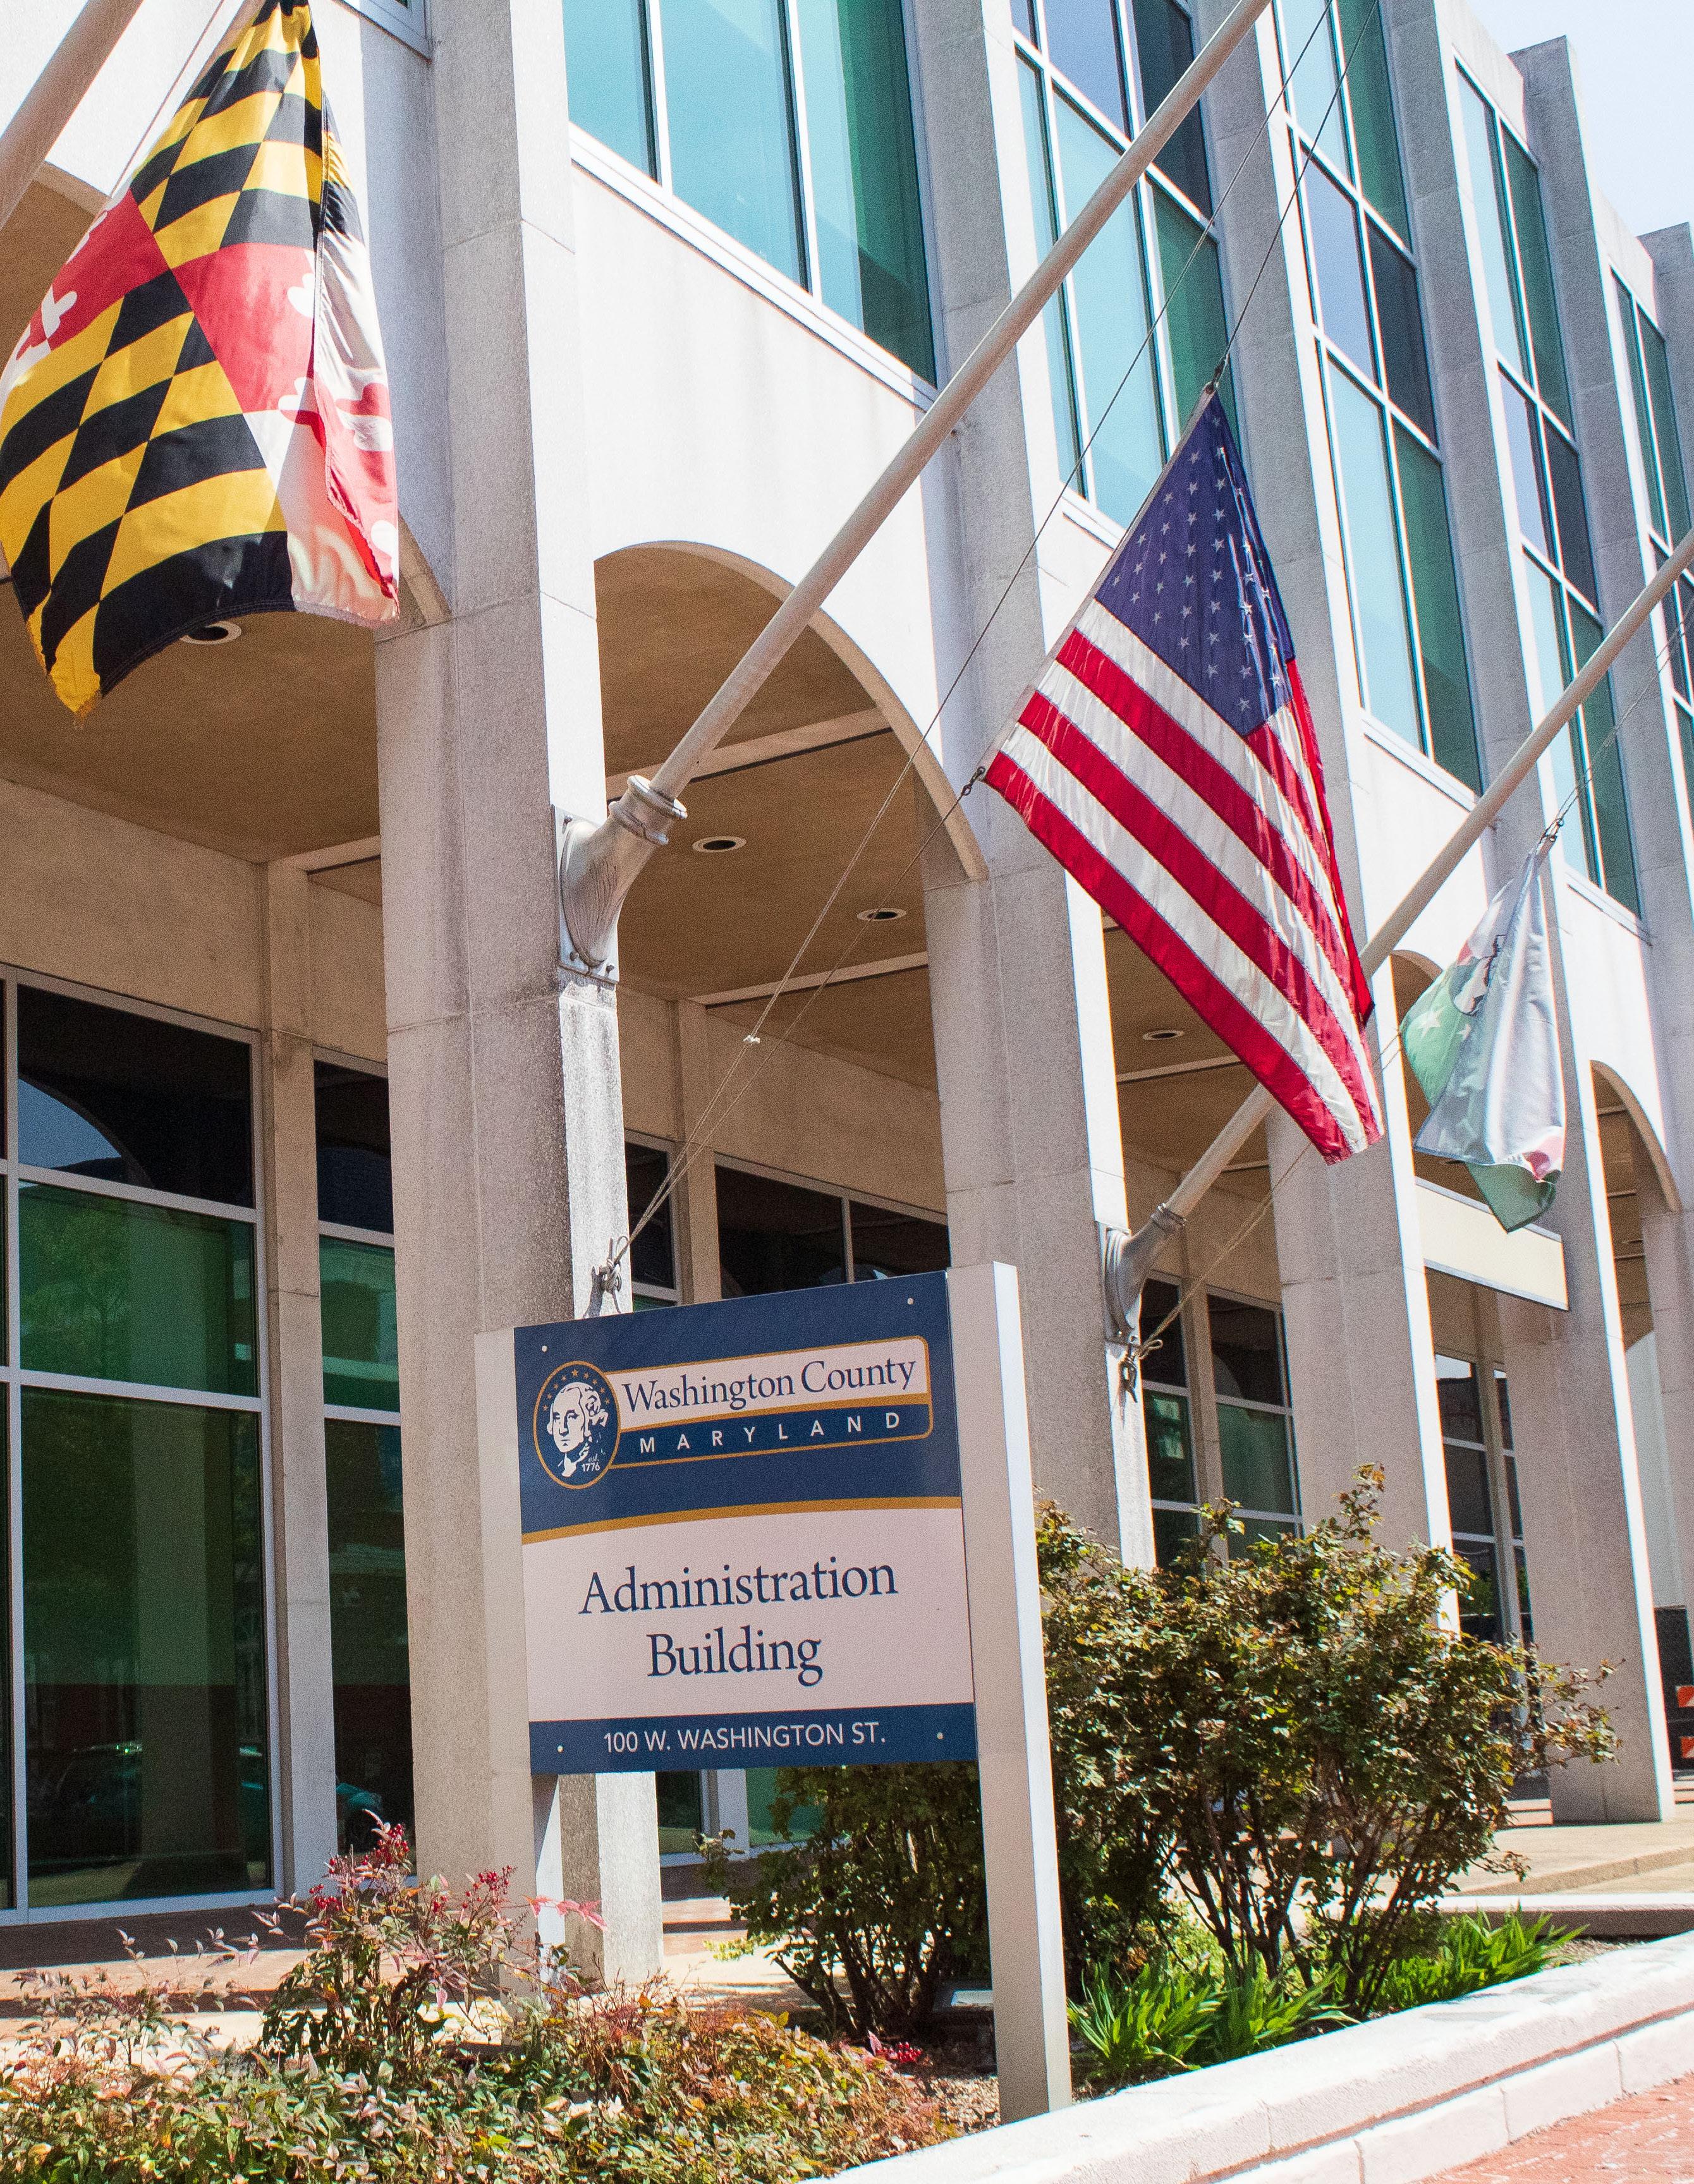

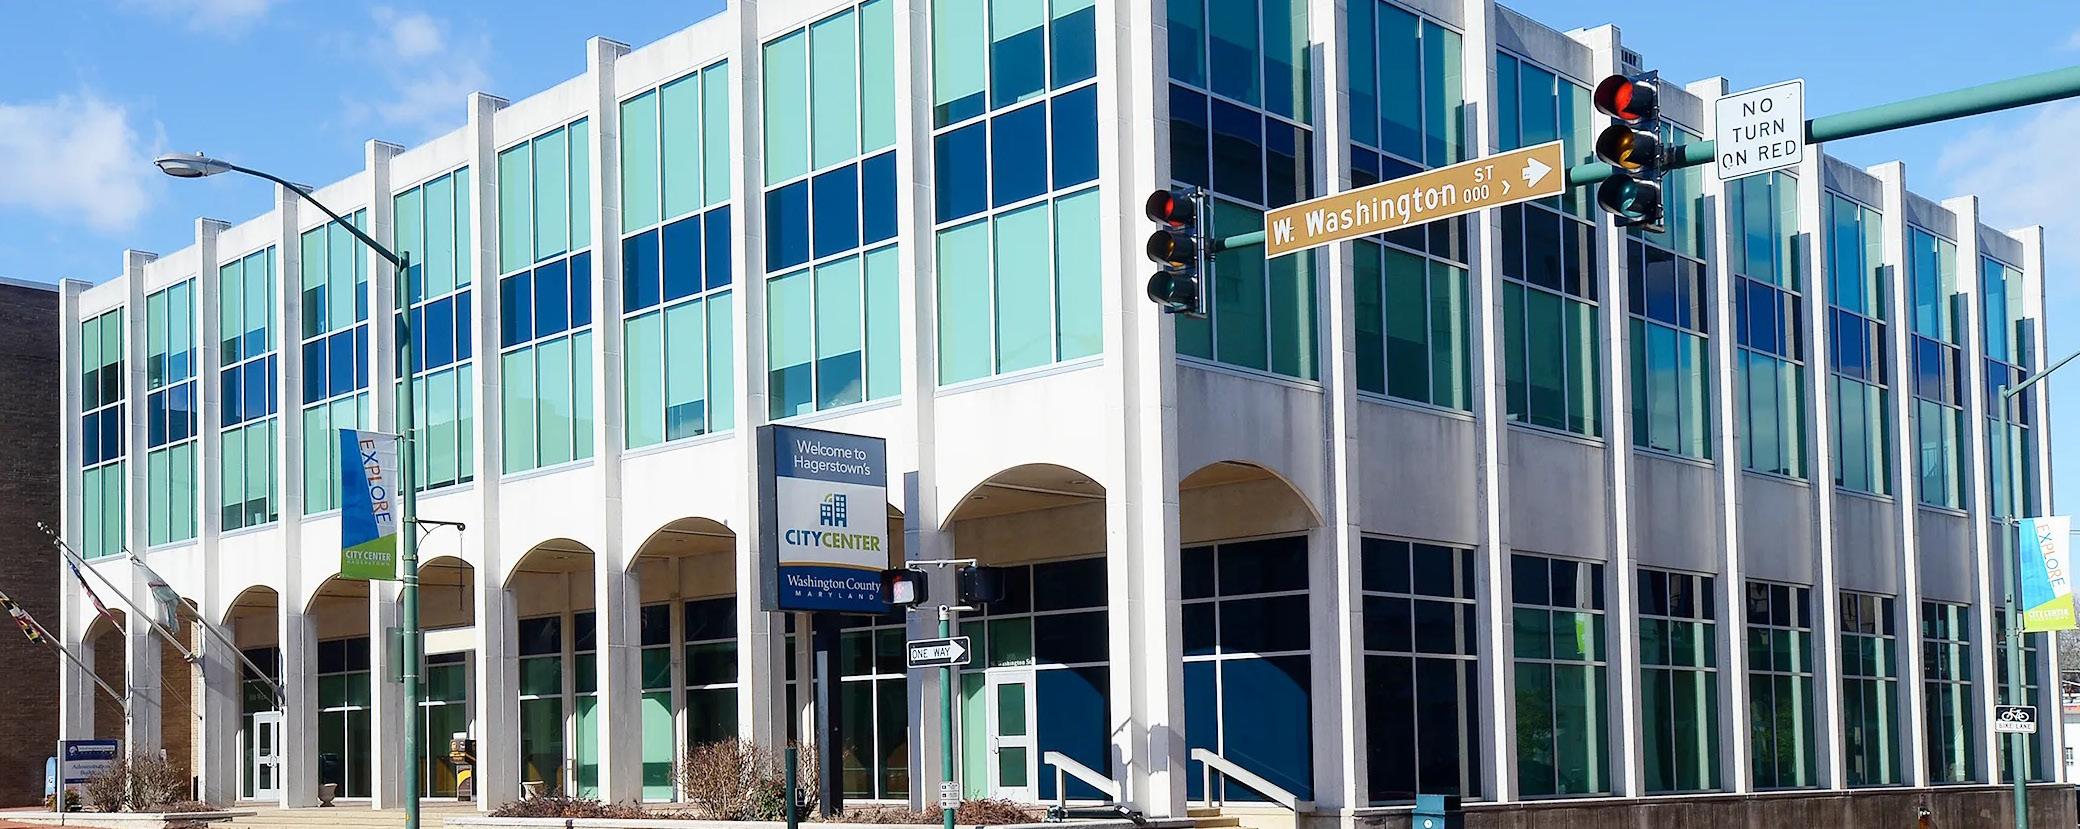
The County is a body corporate and politic, which performs all local governmental functions in Washington County except those performed by the nine incorporated municipalities within Washington County. The administrative offices of the County are in Downtown Hagerstown. The County follows a commissioner structure of government whereby both the executive and legislative functions of the County are vested in the elected, five-member Board of County Commissioners of Washington County (the “Board”). The Board may only exercise such powers as are conferred upon it by the General Assembly of Maryland, including authorization to issue debt to finance its capital projects. Commissioners are elected on a county-wide basis and serve four-year terms.
Under the direction of the County Commissioners, an appointed County Administrator is responsible for the day-to-day operations of the County government in conformity with applicable laws. This individual is also charged with the supervision of County departments and agencies.
County financial matters are administered in part through the office of the Treasurer of Washington County. The County Code establishes the elected office of County Treasurer. The County Treasurer is constituted the collector of County and State taxes, charges and assessments and is charged with the enforcement of collection of taxes in the manner provided by law. The Board also appoints the Chief Financial Officer (CFO). The CFO is charged with assisting the Board in the preparation and administration of County budgets and other accounting and fiscal matters as the Board deems necessary. In addition, the CFO is responsible for the fiscal methods and procedures of each office, department, board, commission, institution, and agency of County government. The CFO reports to the County Commissioners.
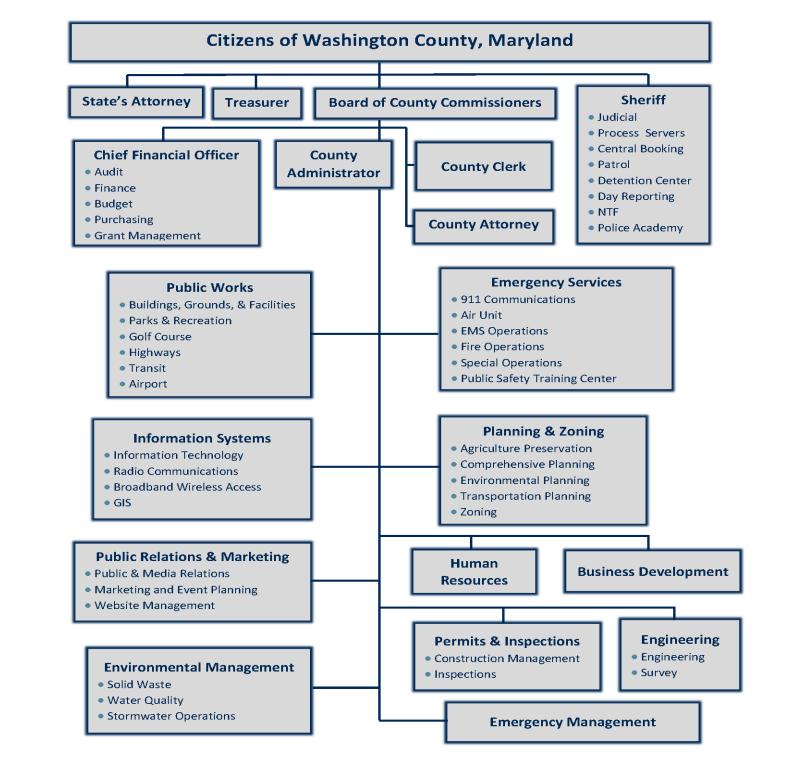
An organizational chart of Washington County Government is shown on the following page.
Source: Washington County FY2023 Citizens Guide to the Budget
Local governments are required to prepare a comprehensive plan by the Annotated Code of Maryland’s Land Use Article in most jurisdictions. The comprehensive plan is intended to create policies which promote growth and development according to desired land use patterns over a ten-to-twenty-year time period. This policy document in turn serves as the foundational basis for implementing various land use regulations such as zoning which carry out the plan’s recommendations across rural and urban areas alike. Comprehensive plans must be adopted in order for local governments to apply for numerous state and federal grant programs, such as Community Development Block Grants, housing grants, and Federal Highway funding. When paired with local funding, these grants contribute substantially to the realization of the Plan’s goals and objectives.
Above all, a comprehensive plan offers the opportunity for the communities to develop a shared vision for their future. The task in achieving this vision, however, is to ensure that the adopted document is flexible enough to adapt to changing conditions, but strong enough to plot a firm course to a desired future.
The purpose of this Plan, in accordance with the Maryland Annotated Code, Land Use Article is:
• To carefully study and survey the present conditions and projections of future growth;
• Guide and accomplish the coordinated, adjusted, and harmonious development of the local jurisdictions and their environs;
• To promote good civic design and arrangement; a healthy and convenient distribution of population; the health, safety, and general welfare of the local jurisdiction; and efficiency and economy in the development process;
• To evaluate and provide for transportation needs; the promotion of public safety; light and air; the conservation of natural resources; the prevention of environmental pollution; the wise and efficient expenditure of public funds; adequate public utilities; and an adequate supply of other public requirements; and
• To act as a guide in the formation of other functional plans.
The State of Maryland entrusts local jurisdictions with land use planning authority to guide growth and development through the Land Use Article of the Maryland Annotated Code. The Land Use Article delegates planning and land use regulatory authority to all non-charter counties and all incorporated municipalities, except for Montgomery and Prince George’s counties and some of their jurisdictions.
The statute outlines the responsibilities, roles, and functions of the planning commission and sets the ground rules for planning and zoning powers. In 2012, the Maryland General Assembly repealed Article 66B and Article 28 and replaced it with the Land Use Article. The Board of County Commissioners for Washington County designates the Planning Commission and the Department of Planning and Zoning to prepare and periodically update the comprehensive plan to guide growth and development. This Plan has been developed in accordance with said State statutes and regulations.
The Comprehensive Plan serves as the foundational document of the County’s land use planning program. The policies and recommendations formulated in the Plan provide the overall foundation for growth and development policy in the County. It is implemented using a variety of tools and mechanisms, including other planning documents.
General policies developed as part of the Comprehensive Plan inform more specific functional and facilities plans and ultimately assist the Board of Washington County Commissioners in budgetary and regulatory decision making. The Comprehensive Plan provides consistency throughout the planning framework and implementation of local land use policies. The following is a summary of the County’s planning framework.
Comprehensive Plan – establishes policies and recommendations that guide future decisions about growth and development, land preservation, resource protection, and the provision of infrastructure and services;
Functional Plans – focus on specific functions of the County government, such as the provision of services and development and location of infrastructure.
Facilities and Strategic Plans – developed by specific County agencies or service providers for strategic and capital budget planning purposes. They focus more directly on capital and operational needs and are typically updated on an annual, bi-annual, or tri-annual basis.
Development Regulations – used as a primary mechanism to implement the County’s land use planning program.
for growth and development.
As part of the update of this Plan, the County has coordinated with each of the nine incorporated municipalities to establish consistency with adopted municipal plans. State law requires municipal jurisdictions to develop a Municipal Growth Element (MGE) as part of their Comprehensive Plan. The MGE must identify a municipality’s future growth areas outside of existing corporate limits and be submitted to the County for review and comment. Proposed annexations must be consistent with those outlined in the MGE. Currently, all of the municipalities, with the exception of Clear Spring and Funkstown, have adopted Comprehensive Plans with a Municipal Growth Element.

The concept of consistency as described in the Maryland Annotated Code Land Use Article § 1-303 states that “…when a provision in a statute listed under §1-302 of this subtitle requires an action to be “consistent with” or have “consistency with” a comprehensive plan, the term shall mean an action taken that will further, and not be contrary to, the following items in the plan: (1) policies; (2) timing of the implementation of the plan; (3) timing of development; (4) timing of rezoning; (5) development patterns; (6) land uses; and (7) densities or intensities.”
The issue of consistency relative to comprehensive planning in Maryland is multi-faceted. There are many types of consistency that are considered, related to local and state construction projects, local government land use regulation, local plan accord with state planning visions, intra-jurisdictional plans (within county), local development decisions, and inter-jurisdictional planning (outside county).
According to the Maryland Office of Planning Models and Guidelines publication Achieving Consistency Under the Planning Act of 1992 (Consistency Report), the method of examining consistency varies with the specific type of consistency being considered. However, some universal concepts are provided. These are related to: “1) clearly identifying what is supposed to be consistent with what; 2) identifying shared characteristics and looking for conflict, support, or neutrality; and 3) applying principles of logical coherence and reasonableness.”
As stated in the Consistency Report, “The fundamental concept of “consistency” under the new Planning Act is that “land use regulations and land use decisions should agree with and implement what the Plan recommends and advocates. A consistent regulation or decision may show clear support for the Plan. It may also be neutral – but it should never undermine the Plan.”1
”There will often be ambiguities when judging consistency. When faced with an area of difficult judgment, emphasis should be placed on clear contradictions, illogical connections, and notable disagreements. In the end, determining consistency with the comprehensive plan should not be a forum for reversing adopted policies, but rather should support development that results in an implementation, over time, of the comprehensive plan’s vision for the future. Additionally, consistency may not be binary. Sometimes development may possess both consistent and inconsistent aspects relative to the comprehensive plan. This may make the issue of consistency a question of degree. If the comprehensive plan were interpreted as a ‘literal, exact translation from Plan to land use law over the entire jurisdiction, undesirable results might occur.’”

The future Land Use Map is the central tool in making decisions of consistency. Generalized land use designations have been applied across the county based upon the analysis and recommendations of the overall plan. In determining issues of consistency, careful consideration must be given to both the land use plan as well as the relevant mitigating factors outlined in other chapters of the plan.
The Washington County Comprehensive Plan contains topic specific chapters as follows: Land Use, Water Resources, Housing, Transportation, Economic Development, Community Facilities, Historic and Cultural Resources, Agricultural and Forestry Resources, Sensitive Areas, Mineral Resources and an Implementation Plan. Each chapter includes introductory or purpose statements, provides an existing conditions baseline and analyzes key issues or trends that warrant further consideration for their effect on county-wide land use policy. The analysis then translates into a series of chapter specific recommendations that are further elaborated on in the Implementation Plan.
In addition to the Land Use Article of the Annotated Code of Maryland, which delegates planning and land use regulatory powers to local jurisdictions, several other key pieces of State legislation heavily inform modern land use planning in Maryland. These legislative milestones are described in brief on the following page.

In its 1992 session, the General Assembly passed the Economic Growth, Resource Protection, and Planning Act of 1992. One of the key provisions of this Act is the implementation of 7 Visions for future development in the State of Maryland. These Visions relate not only to new urban development, but also to conservation of resources, protection of sensitive areas, and stewardship of the Chesapeake Bay and its drainage basin. An 8th vision, regarding funding mechanisms to achieve the seven primary visions, was added later.
The Maryland General Assembly passed the Neighborhood Conservation and Smart Growth initiatives in 1997. This legislation enhances the Planning Act passed in 1992 that established the seven visions to guide growth and development throughout the State. The Smart Growth initiatives go much further by establishing a variety of State programs and fiscal tools in an effort to protect sensitive areas, plan for better growth, and direct resources. The State’s Smart Growth toolbox includes a wide range of policies and programs that address land preservation, economic development, neighborhood revitalization, transportation, environmental protection, historic preservation and other initiatives. Some of the more significant initiatives affecting Washington County are described below.
Priority Funding Areas (PFA) define geographical areas within each county where the State wants to target its programmatic efforts and infrastructure funding to support economic development and new growth. Existing or new developments located outside of a State certified PFA would not be eligible to receive state funding for infrastructure improvements such as roads, water, or sewer. Generally, the PFA criteria require a property to be within a designated growth area, have appropriate zoning, and be classified in a 10-year water/sewer service area.
This program provides funding to identify and protect the State’s most valuable farmland and natural resource areas. The funding is used to either purchase development easements on property through a voluntary application process from the property owner or in fee-simple of land by the State. The funding can only be used in State designated Rural Legacy Areas.
House Bills 1141 and 2 (2006)
The 2006 Maryland Legislative session produced several planning related requirements that affect the way Maryland’s counties and municipalities exercise planning and zoning authority. The specific legislation, resulting in several new comprehensive plan elements, came out of House Bill 1141 and House Bill 2. Key provisions of the legislation are described on the following page.
Addresses the relationship between water and wastewater capacities with planned growth. The three components of the WRE include: drinking water supply; wastewater treatment and disposal; and non-point source and stormwater management.
Required of municipalities to identify areas for future growth consistent with a long-range vision. This element also requires coordination with the County and recommends the use of joint planning agreements between the municipality and the County.
This element came out of HB 2 and is required for counties with certified agricultural land preservation programs. Priority Preservation Areas may designate several connected or unconnected parcels of land with the goal of creating larger contiguous blocks of parcels in agricultural preservation.
House Bill 1160 established a Work Force Housing Grant Program, which can be used by local jurisdictions that have a Work Force Housing element in its comprehensive plan. This element would assess workforce housing needs and goals to address the needs.
The Smart, Green, and Growing Legislation, passed in 2009, included three significant planning Bills designed to update existing planning legislation and further enhance state and local implementation. These Bills include the Planning Visions Bill; the Smart and Sustainable Growth Act of 2009; and the Smart Growth Goals, Measures, and Indicators and Implementation of Planning Visions Bill. These bills strengthened local government comprehensive plans; directed local jurisdictions and the State to collect smart growth measures and establish a statewide land use goal; and updated the planning process to include 12 new planning visions.
The State of Maryland enacted Senate Bill 236 in April 2012. The goal of this new legislation is to reduce the number of septic systems statewide in an effort to reduce nitrogen load to the Chesapeake Bay and to support development in and around existing public infrastructure.
House Bill 1045 (2019)
This legislation requires the inclusion of a Housing Element into any new Plan adopted after June 1, 2020. In addition to mandating the inclusion of specific criteria within the Housing Element, the legislation requires local jurisdictions to address the need for workforce and low-income housing within its boundaries.
HB 90 (2021): Affirmatively Furthering Fair Housing
As of January 1, 2023, HB 90 (2021) requires all housing elements for municipalities and noncharter counties to “affirmatively further fair housing.”
HB 90 defines affirmatively furthering fair housing as, “taking meaningful actions… to:
• Overcome patterns of segregation;
• Foster inclusive communities free from barriers that restrict access to housing and opportunity based on protected characteristics;
• Address significant disparities in housing needs and access to opportunity;
• Replace segregated living patterns with truly integrated and balanced living patterns; and
• Foster and maintain compliance with civil rights and fair housing laws.”
The evolution of land use planning in Washington County reflects both local concerns related to the effects of urbanization on a traditionally rural county, and our response to the statewide legislation described above. County planning milestones are described in brief below.
The focus of this plan was to address growth through the creation of new communities at several locations throughout the County and set the stage for growth management and adoption of the Washington County Zoning Ordinance in 1973.
In 1980, Washington County began the Agricultural District Program, now one of many programs aimed at preserving the County’s rural character. This program encourages landowners to voluntarily enter into an Agricultural Land Preservation District in which it is agreed that the land will not be developed for a period of ten years. In return for the restriction, the landowner receives protection from nuisance complaints through the Right to Farm Ordinance, becomes eligible to sell Development Rights Easements through MALPP, and receives a property tax credit. To date, nearly 39,000 acres of agriculture and resource lands have been preserved across Washington County under various land preservation programs.
The concept of designating targeted growth areas around existing towns and cities in Washington County was introduced for the first time to protect rural character and channel growth to where infrastructure exists to serve it. Defined growth areas were officially adopted in 1983 and have remained as a vital part of county comprehensive planning since. Special Planning Areas were also initially identified in 1981, providing additional land use planning consideration for areas of unique local significance. These Areas included the Edgemont and Smithsburg Reservoir Watersheds, the Appalachian Trail corridor and the Upper Beaver Creek Basin.
In response to Maryland’s Economic Growth, Resource Protection, and Planning Act of 1992, Subdivision and Zoning Ordinance amendments were adopted in 1996 to implement sensitive area protection of streams and their buffers, 100-year floodplains, habitats of threatened and endangered species and steep slopes.
The 2002 Plan provided a renewed focus of directing development to existing urbanized centers and designated growth areas. A new Land Use Plan proposing to reduce residential densities in the Rural Areas of the County was adopted. This new Plan spawned the first major comprehensive rezoning of the County. In a series of three major amendments to the Zoning Ordinance (2005, 2012 and 2016), regulations were adopted to reduce residential development densities, re-evaluate several urban zoning designations, develop new zoning districts to accommodate emerging technology, further efforts to preserve agricultural land, and expand efforts to conserve natural resources.
In addition, amendments to the Adequate Public Facilities Ordinance stemming from Comprehensive Plan recommendations, in 2003, 2005 and 2013, enabled the County to better manage the impacts of new development on essential infrastructure. This included the creation of methodology to determine and mitigate for the impacts by new development on school capacity to ensure that necessary infrastructure is available to support growth in a timely manner.
In support of targeted economic development in rural communities, the 2002 Plan also recommended the creation of the Rural Business Zoning District. This floating zone permits the development of businesses that support the agricultural industry and farming community, serve the needs of the rural residential population, provide for recreation and tourism opportunities, as well as establishing locations for businesses and facilities not otherwise permitted in the rural areas of the County.
Finally, in response to House Bills 1141 and 2, Washington County amended the 2002 Plan to include Priority Preservation Areas (PPA) in 2008 and a Water Resources Element in 2011. The official PPA map was most recently updated in 2010, targeting 74,854 acres for land preservation efforts. A new Water Resources Element is included as part of this Comprehensive Plan update.

Citizen participation is a vital component in the creation of a county-wide comprehensive plan. Accordingly, beginning in 2015, the Department of Planning and Zoning held six public input meetings in various locations of the County including: Boonsboro, Clear Spring, Hagerstown, Hancock, and Smithsburg. These meetings were advertised in local newspapers and on the County website and invited citizens to talk with planning staff about their ideas for local land use policies. Citizen comments consistently mentioned agricultural lands, rural community relationships, and an abundance of natural, historic and cultural resources as the County’s most significant assets. Citizens were most concerned with growth and development related impacts on overall quality of life, rural character, transportation facilities, and school capacity.
In addition to soliciting feedback from these general public comment meetings, Planning Staff also initiated targeted stakeholder meetings with various groups impacted by land use regulations. Stakeholder meetings were divided into broad topics including agricultural resources, community facilities, economic development, environmental resources, historic resources, housing, parks and recreation, and transportation. Over 100 different government, non-profit, and local business organizations were invited to attend these specialized meetings and provide feedback on future land use policies. Attendees provided useful information which was incorporated into the applicable sections of this Plan.
The members of the Washington County Planning Commission met with eight other municipal planning commissions to discuss their efforts in land use planning and seek input on future growth initiatives they may be planning. Many of the same issues facing the County regarding growth impacts are being similarly felt in the municipal jurisdictions. However, they are typically felt on a more magnified scale given smart growth initiatives that direct high density growth into areas, such as the towns and municipalities, where existing infrastructure is available. Transportation, public water and sewer availability, and potential annexation plans were common topics during these meetings.
Using the information gathered from the above referenced meetings in tandem with input from the Planning Commission, a draft Plan was developed and made available for public comment through a variety of distribution methods on July 25, 2023. Final public comment opportunities were offered at a Public Information Meeting with the Washington County Planning Commission on _______ and a Public Hearing before the Board of Washington County Commissioners on _________. The Plan was adopted on _______.


The Maryland Economic Growth, Resource Protection and Planning Act of 1992 gave new responsibilities to jurisdictions in the State of Maryland to establish priority areas for growth and resource conservation. To provide consistent guidance and minimum standards for land use planning, “Eight Visions” were adopted in the Planning Act of 1992. These Visions were expanded upon in amendments made to the Planning Act in 2000 and 2009. The most current State “visions” are listed below.
A high quality of life is achieved through universal stewardship of the land, water, and air resulting in sustainable communities and protection of the environment;
Public Participation:
Citizens are active partners in the planning and implementation of community initiatives and are sensitive to their responsibilities in achieving community goals;
Growth Areas:
Growth is concentrated in existing population and business centers, growth areas adjacent to these centers, or strategically selected new centers;
Community Design:
Compact, mixed-use, walkable design consistent with existing community character and located near available or planned transit options is encouraged to ensure efficient use of land and transportation resources and preservation and enhancement of natural systems, open spaces, recreational areas, and historical, cultural, and archaeological resources;
Infrastructure:
Growth areas have the water resources and infrastructure to accommodate population and business expansion in an orderly, efficient, and environmentally sustainable manner;
Transportation:
A well-maintained, multi-modal transportation system facilitates the safe, convenient, affordable, and efficient movement of people, goods, and services within and between population and business centers;
Housing:
A range of housing densities, types, and sizes provides residential options for citizens of all ages and incomes;
Economic development and natural resource-based businesses that promote employment opportunities for all income levels within the capacity of the state’s natural resources, public services, and public facilities are encouraged;
Land and water resources, including the Chesapeake and Coastal Bays, are carefully managed to restore and maintain healthy air and water, natural systems, and living resources;
Resources Conservation: Waterways, forests, agricultural areas, open space, natural systems, and scenic areas are conserved;
Stewardship:
Government, business entities, and residents are responsible for the creation of sustainable communities by collaborating to balance efficient growth with resource protection; and
Implementation:
Strategies, policies, programs, and funding for growth and development, resource conservation, infrastructure, and transportation are integrated across the local, regional, state, and interstate levels to achieve these visions.
To cultivate a sustainable community that embraces a common goal of growth management and resource protection resulting in a variety of opportunities for a diverse population to attain each individuals’ needs, goals, prosperity and dreams.
Incorporating this Plan’s vision, Maryland’s State Visions and policies established by past land use plans, the following goals have been identified for this Comprehensive Plan update. These goals and objectives, expanded upon in the Implementation Plan at the end of this document, will be used as a guide for future land use policy in Washington County at all levels of planning.
1 2 3 4 5 6 7 8
Provide a diverse range of housing for citizens that promote sustainable, livable and affordable housing opportunities.
Promote a balanced and diversified economy.
Provide a safe, efficient, and interconnected multi-modal transportation system.
Maintain policies and strategies that direct growth to areas where the County can provide adequate infrastructure and community resources for existing and future development.
Provide residents with a high quality of life through the impactful planning and delivery of fundamental community facilities and services.
Enhance the County’s rich historic and cultural heritage through land preservation and historic preservation efforts.
Provide adequate protections for, and enhanced stewardship of, environmental resources and sensitive areas.
Encourage infill development and revitalization of existing communities using context sensitive development strategies to maintain and enhance community character. 4


In creating policies that will govern land use in Washington County for the next ten to twenty years, it’s important to understand baseline demographic and economic conditions within the jurisdiction as they exist today. Below, an overview of select demographic indicators is presented, highlighting trends that have occurred, mostly since 2000. Later chapters of this plan will build upon this baseline data to establish future land use policies applicable to each topic.
Population trends, which are an important tool in planning for public investments, have been very difficult to evaluate in recent decades due to numerous factors and events affecting the economy and housing markets. Both the economy and housing market flourished during the end of the 1990’s and into the beginning of the 2000’s in Washington County, bringing in a much higher number of new citizens than previously predicted. The County’s population grew 8.6% from 1990-2000, and 11.7% between 2000-2010, according to the U.S. Census Bureau.
Obscured by this overall trend of progressively increasing population growth in the previous two decades was the sudden decline in the housing market in the mid to late 2000’s, which had a tremendous impact both locally and nationally. The resulting recession significantly reduced previous growth trends and likely was a strong contributor to an increase of only 7,275 people (or 4.9%) since 2010. Washington County’s current population stands at 154,705 people, according to the 2020 Census. The current population increase is notably less than was previously predicted by the County and State prior to 2020 (both estimates exceeded 160,000 people by 2020). The effects of the COVID-19 Pandemic bring further uncertainty to forecasting future population growth based upon these continually shifting economic fortunes.

The racial composition of Washington County’s total population between 2000 and 2020 is shown in Chart 4-2 below. Throughout that time period, the significant majority (80% - 90%) of County residents have identified as white alone. It is notable however that those identifying as belonging to this group have dropped nearly 10% during the last twenty years (from 89.9% in 2000 to 81.2% in 2020). Correspondingly, the share of those identifying as Black or African American alone or belonging to two or more races has increased by the largest percentage during the survey period. The former group rose by 3.2% (7.7% to 10.9%) from 2000 to 2020, while the latter group increased by 3.8% of the total population (1.1% to 4.9%). “American Indian and Alaska Native Alone as well as Native Hawaiian and Other Pacific Islander Alone populations remained below 1% across all three census.

Source: U.S. Census Bureau - 2000 P006, 2010 and 2020 American Community Survey 5-Year Estimate (B02001)
The standard economic definition of a household is the number of persons living together in one housing unit. More simply, a household is equivalent to any occupied housing unit. Households are broken down into family (where residents are related to primary householder through birth, marriage or adoption) and non-family (where residents are unrelated). This statistic is important in understanding the demand for types of living quarters and estimating population fluctuations based on new unit development. Two tables below track changes in County households since 2000.
Table 4-2, below, indicates a number of interesting trends regarding changes in household composition between 2000 and 2020. Married-couple family households grew by more than 20% between 2000 and 2010, rising from 54% of total households in 2000 to 75.6% in 2010. Significant construction of single family detached homes occurred during this period, particularly in the suburban areas of the County’s Urban Growth Area around the City of Hagerstown. Also notable is an increase in non-traditional family households. Family households headed by an unmarried male rose more than 4%, growing from 5% of total family households in 2010 to 9.2% by 2020.
Charts 4-3 and 4-4, below, shows the age distribution by gender of Washington County’s total population between 2010 and 2020. These charts demonstrate that the County has entered a stationary phase of population growth, where age distribution is nearly equal for most age groups. A stationary pyramid indicates that population growth has been slow and is symptomatic of low birth rates, low mortality rates, and higher life expectancy.
Charts 4-3 and 4-4 also show the growth in age groups which will reach the age of retirement within the scope of this plan. In 2010, the two largest age groups were those that fell between 40 and 49 years of age. Those groups have now aged into the 50-59 age groupings by the 2020 Census. Accordingly, Washington County must begin increasingly considering the needs of the retirement aged population in the provision of community services, a scenario recognizable to many other local jurisdictions throughout the Country.


Charts 4-3 and 4-4: Age of Total Population (2010-2020)
Source: U.S Census Bureau - 2010, 2020 American Community Survey 5-Year Estimate (S0101)
Table 4-3 shows the distribution of household income over three ten-year periods between 2000 and 2020 as a percentage of total households in Washington County. A two-fold trend can be identified from this table. First, there is the growth in the percentage of total households falling within income classes exceeding $100,000 annually during the twenty-year period. By 2020, the $100,000 to $149,999 income class became the second largest in Washington County for the first time. This income bracket made up only 5.3% of total households in 2000 but reached 15.4% of total households in 2020. Additionally, the percentage of total households making $150,000 or more grew significantly in comparison to other income classes as well.
An opposing trend to that identified above can also be identified in Table 4-3. All household income classes below $75,000 shrank as a percentage of total households in Washington County from 2000 to 2020. In fact, the only household income classification below $100,000 that grew during this period were those making just below that figure - $75,000 to $99,999. Numerous factors are likely responsible for this trend, such as inflation, in-migration of more affluent residents seeking reduced housing costs, middle-class wage stagnation, changes to labor markets and more. Thus, while the table also notes that median household income grew by 56% (from $40,617 in 2000 to $63,510) during the period surveyed, that measure is not necessarily indicative of growth in household prosperity that is uniformly distributed among all income classifications.
Table 4-4 shows the educational attainment of the total population of Washington County residents aged twenty-five years and older from 2000 to 2020. Evident from the table is the rising levels of education achieved by the local population during this twenty-year period. The percentage of the County population aged twenty-five years and older receiving a bachelor’s degree rose 4.4% from 2000 to 2020 and more than 9% of this age group had achieved a graduate or professional degree by that year.
Overall, there was a 10.3% increase in the percentage of the County population aged twentyfive years and older achieving at least a high school education and a 7.8% increase in those receiving a bachelor’s degree or higher, from 2000 to 2020. It should be noted however, that these rates still fell below the rates of educational attainment for Maryland as a whole. In Maryland, the overall percentages of those aged twenty-five years and older achieving at least a high school education or a bachelor’s degree by 2020 was 90.6% and 40.9%, respectively. Table shown on the following page.
Your County. Your Vision. Your Future.


Washington County’s history and heritage is rich and diverse. Being the first County named in honor of the first President of the United States, George Washington, the area has deep ties to early colonization and its related conflicts. The County continues to embrace this history through preservation of resources such as structures, buildings, sites, districts and objects of importance that are used to interpret the culture and way of life experienced by past citizens.
This element will seek to build on existing efforts to identify, preserve and protect significant pieces of Washington County’s history for the benefit of future generations. Whether attempting to rehabilitate a historic resource to maintain its functionality or restore a property to a specific time period, it is important to remember that the value of historic resources is often found first and foremost at an individual level. Resources must be identified, maintained and valued at an individual level or the goals and policies of historic resource protection will not succeed.
Prior to the 1700s, Washington County was home to Native Americans of Delaware and Catawba tribes. Their stewardship of the land prior to colonization left the County largely open and full of resources. As settlers moved into the County, the native population was pushed to the West into unsettled territory. Most historic resources related to the native population of the County are archaeological in nature.
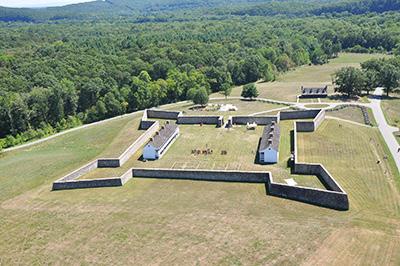
Conflict occurred between various domestic and foreign powers vying for control of the territory previously occupied by these native tribes. The French and Indian War erupted in 1754 and pitted the existing British colonies against the forces of New France to the north. These clashes led to the establishment of frontier forts to protect existing colonists. One such fort still exists in Washington County today: Fort Frederick, originally erected in 1756 and later restored in the 1930s by the Civilian Conservation Corps, stands as a reminder of the early colonization of Washington County.
Colonization and immigration continued through the late 18th Century leading to the establishment of formal settlements and the beginnings of our current municipalities. The County seat of Hagerstown (first known as Elizabeth Town) was officially founded in 1762 by Jonathan Hager. Several other small towns were being settled at the same time including Sharpsburg, Funkstown, and Keedysville. Settlements continued to be founded through the early 1800s. Washington County was officially designated as a Maryland County in 1776. The land was taken out of the existing Frederick County and extended to the far western region of the State to what is now known as Garrett County.
As colonization continued through the early to mid-1700s, land grants were used to explore and develop the western frontiers. While the large tracts of fertile land were ideal for livestock and grains, the expansive wilderness and limited transportation to more settled areas of the State drove the need for local service industries. Grist mills were the predominant form of industry in the early 18th Century. Operated by local farmers and built along local waterways, these industries became an anchor for rural settlements nearby. Many of the grain and grist mills of this time still exist in varying degrees of repair.
By the late 1800’s, a typical farmstead consisted of vernacular stone or log farmhouses surrounded by service buildings such as spring houses, smokehouses, and animal pens. As agriculture began to diversify from crop production to animal husbandry activities, barns and other support buildings such as milk houses began to become part of the typical farmstead. Examples of these historic resources still exist in Washington County today.
As agriculture and trade industries began to evolve and grow, and connection to larger markets continued to improve, other merchant-based industries began to form. However, in Washington County, a different type of industry was beginning to formthe iron industry. Rich deposits of pig iron ore in the southern portion of the County provided a resource and opportunity for this new industry. Iron forges and furnaces began emerging and produced cannons and ammunition for the Revolutionary War through the late 1700s. While true capitalism had not fully materialized in the newly discovered North America, these industries provided the basis for future settlement and industrialization.

As the country continued to grow through the early and mid-1800s, there became a deep divide over the fundamental ideals and economic principles guiding the direction of the Country. These differences escalated to the outbreak of a national Civil War between Northern and Southern States. The war began in the South in 1861 with Confederate armies attacking union defenses and pushed north into the Union territory during General Robert E. Lee’s Maryland Campaign. Several battles raged in the mid-Atlantic region of southern Pennsylvania, Maryland, and Northern Virginia between September 1862 and July 1863. It led to the bloodiest days of the war with battles at Bull Run, Antietam, Fredericksburg, Chancellorsville, and Gettysburg.

Washington County bore much of the devastation of this campaign during the Battle of Antietam, the single bloodiest day of fighting in the history of the country. Numerous other battles and skirmishes occurred within Washington County including, but not limited to, the Battle of Williamsport, Battle of Funkstown, Battle of Hancock, and the Battle of South Mountain. There are numerous historic resources in the County that preserve this solemn time.
After the Civil War, industry began to resume its dominance in the area. Hagerstown and Williamsport quickly became hubs for industry in the early 20th century because of their access to transportation and trade routes. Early industries included silk and garment factories. Hagerstown housed numerous other industries including Moller Organ Works, Foltz Manufacturing and Supply Company, Antietam Paper Company, and the Pangborn Corporation just to name a few. Williamsport housed the LeFevre Broom Company, Cushwa Brick Company, and a tannery. Many of these early industrial buildings still exist but are largely vacant. The City of Hagerstown has targeted some of these buildings in the Downtown core for redevelopment and revitalization efforts.
Another important industry was developing in the early 20th century, aviation design and manufacturing. Kreider-Reisner began as a sub-contractor to the Maryland Press Steel Company during its contract period for military equipment during World War I. After the closure of the Maryland Press Steel Company, Kreider-Reisner continued to manufacture and mass produce airplanes.

Eventually Kreider-Reisner was absorbed by Fairchild in the late 1920s. Fairchild continued to flourish through the early to mid20th century eventually becoming the largest employer for the County. Fairchild became such an economic power that they began to build residential neighborhoods throughout Hagerstown to increase the local workforce.
Few things have impacted the settlement of Washington County like that of transportation networks. The movement of goods and people through various forms of transportation have influenced the location and economics of our local communities.
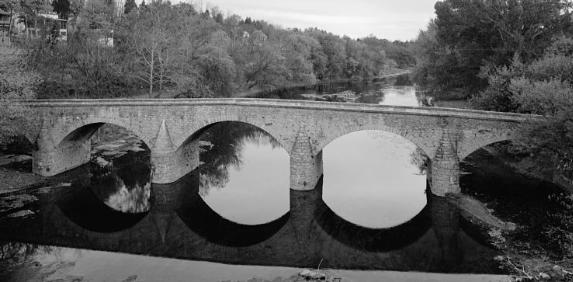
One of the first major routes impacting Washington County was the National Road. It was the first federally funded interstate highway authorized by Congress in 1806. The road was to start in Cumberland, Maryland and stretch to the Ohio River. Inspired by the Federal government investment in this new road, the Maryland General Assembly created a turnpike to connect Baltimore and Cumberland. It was designated as the Baltimore National Pike and was financed by local banks thus gaining the nickname of “The Bank Road”.1 Installation of the road gave rise to thriving Main Streets and ultimately led to clusters of richly historic building resources and many of the County’s National Register Districts. Other historical products of this new road included mile markers and stone arch bridges. The Wilson Bridge, which spans the Conococheague Creek near the rural village of Wilson, was the first stone arch bridge built in Washington County. It was built as part of the original Bank Road.
As the country continued to grow and the Industrial Revolution continued to develop new technologies and expand economies, the need for movement of commodities into new markets became increasingly important. Railroads became the answer to these needs since they could traverse longer distances and carry more cargo than horse drawn wagons. The Baltimore and Ohio Railroad, one of the oldest railroads in the United States, began construction in Baltimore in 1828 and reached the southern tip of Washington County by 1834. While the B&O Railroad was the first company to establish lines in Washington County, many other companies followed suit. The City of Hagerstown became a prime location for several railroad companies, and thereby earned the nickname of the “hub city”. Some historic resources related to this mode of transportation, such as roundhouses, have been lost but some bridges remain. The railways are vital today as some are still active while others have been transformed into public parks.
These railways served to provide for the movement of people around the County, however the commerce railways provided helped to shape the County’s history to an even greater degree.

Around the same time period that railroad companies had begun to develop, another mode of transportation gained popularity. Construction of The Chesapeake and Ohio Canal started in 1828. The Canal was not completed until 1850, years after railways had reached similar markets. Initially intended to span from Georgetown, Maryland to the Ohio River, construction of the Canal became too costly and could not compete with the railroad companies in the movement of goods and services. While not reaching its destination, the canal still served as yet another link to commerce centers supporting growth specifically in the towns of Hancock and Williamsport along its route. The 184-milelong canal ceased operation in 1924 but was revitalized in 1971 when it was designated as a National Historic Park. This designation has helped to preserve an abundance of historic resources along its corridor and provide context for historic resources outside of the park.
One final notable contribution of transportation to County historic resources came with the automobile. This caused a resurgence in the popularity of the National Road as well as eventually leading to the construction of the three (3) interstates that cross the County. Interstates 68, 70 and 81 all impacted the history of the County starting in the mid 1960’s. As main arteries for commerce and travel, their effect was like railways. They changed the landscape of the County as well by bisecting rural tracts and heralding the beginning of larger residential subdivisions. The growth in automotive travel and expanded road capacity made it possible to live distant to one’s place of employment. The result was a greater freedom of movement for individuals, but also a growing threat to the preservation of Washington County’s historic resources as result of urban sprawl.
In summary, each of the themes in history discussed led to the creation of Washington County and its historic resources as we know them today. The County is an excellent example of resources which display an evolving culture across many periods of time. Since many of the historic resources are intact it is important to plan for their preservation into the future.
Many times, the definition of historic is based on a segment of time or age. Depending upon a person’s perspective, this time component could be very short (minutes, hours, days, etc) or very long (years, decades, centuries, etc). Therefore, the definition of historic can be subjective. To help prioritize resources during evaluation, there are factors such as significance and integrity to be considered. These criteria are essential to obtaining National Register recognition for a resource but are also helpful in making determinations about resource value to County citizens.
The word preservation is often associated with the act of “saving” something; however, that only describes the result. It does not explain what action has been taken to ensure the conservation of an object. In the case of historic structures or objects, preservation is often thought of in terms of saving the structure or object from some form of demolition or alteration. However, citizens should be educated that preservation is more than just saving an old object; it is about saving the contextual history of the object. Typically, this means making improvements to the structure or object to restore the historical context. Examples of these methods include:
• ADAPTIVE REUSE. This is the process of reusing a site or building for something other than for what it was designed. While it may not preserve the historic context and all of the unique characteristics, it is still a good use of historic resources to encourage good environmental stewardship. An example of this might be an historic farm house turned into offices or a restaurant where it has lost some of its historic characteristics to make way for the new use.
• REHABILITATION. This is probably what people think of when they consider resource protection. It is the repair, alteration, and addition in preparation for a new use while retaining features which convey historical, cultural or architectural significance. There are many examples of this throughout the County as this is typically the most common practice when updating a historic property.
• RESTORATION. This method aims to return a building to a specific period, acknowledging the need to remove changes since that time and recreate previous aspects that have been removed. An example of this might be the National Historic Trust properties like Montpelier, located in Virginia.

• PRESERVATION. This is the maintenance and repair of existing historic materials or preserving of the structure in its current form with little or no replacement or new addition. Another form of this is stabilization where a property is given the minimum treatment to prevent further deterioration. Adding a roof to a barn to either keep it in working order or to prevent further collapse is an example of this type of treatment.
To begin the preservation of resources, identification and location of potential resources is foremost. There are four main inventories that cover resources found in Washington County:
Ì National Register of Historic Places; and
Ì Maryland Register of Historic Properties;
Ì National Historic Landmarks;
Ì Maryland Inventory of Historic Properties
Each of these inventories represents a different evaluation level of historical significance.
It is the goal of both the County and State to document resources to determine eligibility for the National Register of Historic Places. Therefore, the definition of a historic resource used by both is derived from the National Register guidelines. A Historic Resource is “any prehistoric or historic district, site, building, structure or object, included in, or eligible for, inclusion on the National Register, including artifacts, records and material remains related to such a property or resource.”1
A broader classification under which a historic resource can fall or participate in is a Cultural Resource. The National Park Service (NPS) highlights these main categories of cultural resources as follows:
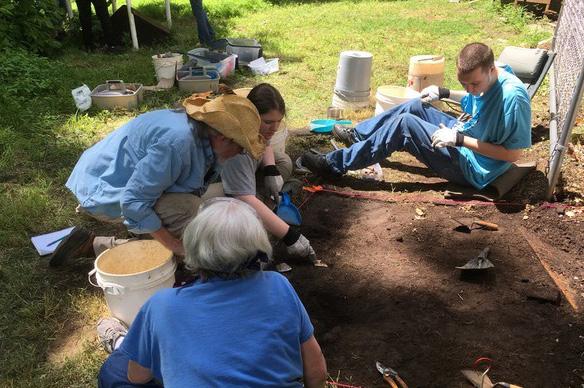
• ARCHAEOLOGICAL: Archeological resources are the remains of past human activity and records documenting the scientific analysis of these remains to explain human behavior. Archeological features are typically buried but may extend above ground; they are commonly associated with prehistoric peoples but may be products of more contemporary society.
• CULTURAL LANDSCAPES: Cultural landscapes are settings we have created in the natural world. They reveal fundamental ties between people and the land–ties based on our need to grow food, give form to our settlements, meet requirements for recreation, and find suitable places to bury our dead. Examples: Historic rural village communities or rural landscapes.
• STRUCTURES: Structures are material assemblies that extend the limits of human capability. Examples: Stone arch bridges, historic houses, National Road Monuments.
• MUSEUM OBJECTS: Museum objects are manifestations and records of behavior and ideas that span the breadth of human experience and depth of natural history. They are evidence of technical development and scientific observation, of personal expression and curiosity about the past, of common enterprise and daily habits.
• ETHNOGRAPHIC RESOURCES: Ethnographic resources are basic expressions of human culture and the basis for continuity of cultural systems. A cultural system encompasses both the tangible and the intangible. It includes traditional arts and native languages, religious beliefs and subsistence activities.
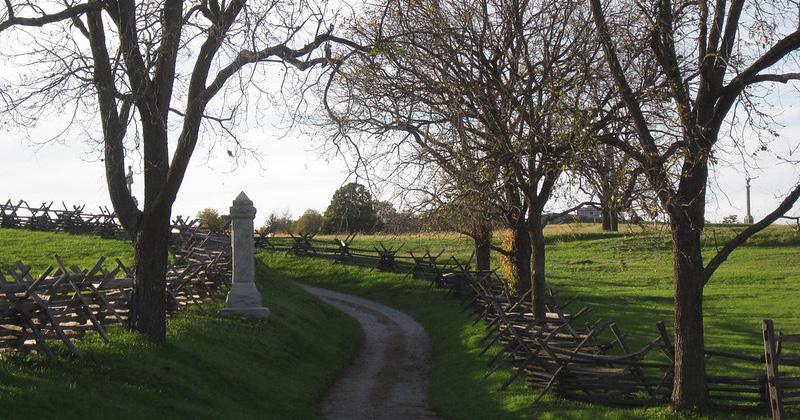
As mentioned, the goal of the County and State is to eventually document all properties to determine their eligibility for the National Register. Inclusion on the Register is voluntary and provides opportunities for grant funding to restore and or rehabilitate a resource. It also provides an opportunity for additional review of impacts on a resource if Federal or State money is being utilized to fund the project. Resources can have local, State or national significance. Typically, there is a period of significance which can be anywhere from a thousand years to a few days depending on the events the resource may be associated with.
Significance is the importance of a property to the history, architecture, archaeology, engineering, or culture of a community. To be included on the National Register a property must display some form of significance which is achieved by association with one or many criteria:
CRITERIA A That are associated with events that have made a significant contribution to the broad patterns of our history; or
CRITERIA B That are associated with the lives of significant persons in our past; or
CRITERIA C
That embody the distinctive characteristics of a type, period, or method of construction, or that represent the work of a master, or that possess high artistic values, or that represent a significant and distinguishable entity whose components may lack individual distinction; or
CRITERIA D
That have yielded or may be likely to yield information important in history or pre-history.
Another important factor in eligibility for the National Register is integrity. Integrity relates to the ability of the resource to convey its historical associations or attributes. Integrity is measured by how intact the following characteristics remain for the resource.
LOCATION
Location is the place where historic property was constructed or the place where the historic event occurred.
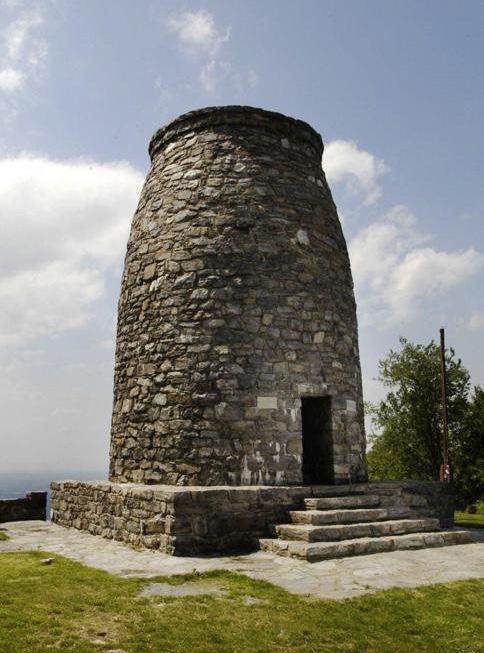
SETTING
Setting is the physical environment of an historic property. It refers to the historic character of the place in which the property played its historical role. It involves how, not just where, the property is situated and its historical relationship to surrounding features and open space.
Design is the combination of elements that create the historic form, plan, space, structure and style of a property. This includes such elements as: organization of space, proportion, scale, technology, ornamentation, and materials.
Materials are the physical elements that were combined or deposited during a particular period of time and in a particular pattern or configuration to form an historic property.
WORKMANSHIP
Workmanship is the physical evidence of the crafts of a particular culture or people during any given period in history.
Feeling is a property’s expression of the aesthetic or historic sense of a particular period of time.
ASSOCIATION
Association is the direct link between an important historic event or person and an historic property.
It is important to note that these criteria and associated integrity are also very important when considering the value of resources to citizens and the treatments undertaken to preserve a resource. Nationwide, the register has more than 90,000 properties housing 1.4 million individual resources. Washington County has approximately 120 historic resources and districts that are included on the National Historic Registry. Boonsboro, Funkstown, Hagerstown, Keedysville, Sharpsburg and Williamsport are all municipalities within the County that have at least one, if not more, National Register districts containing multiple individual resources.
Source: Maryland Historical Trust, County GIS Data
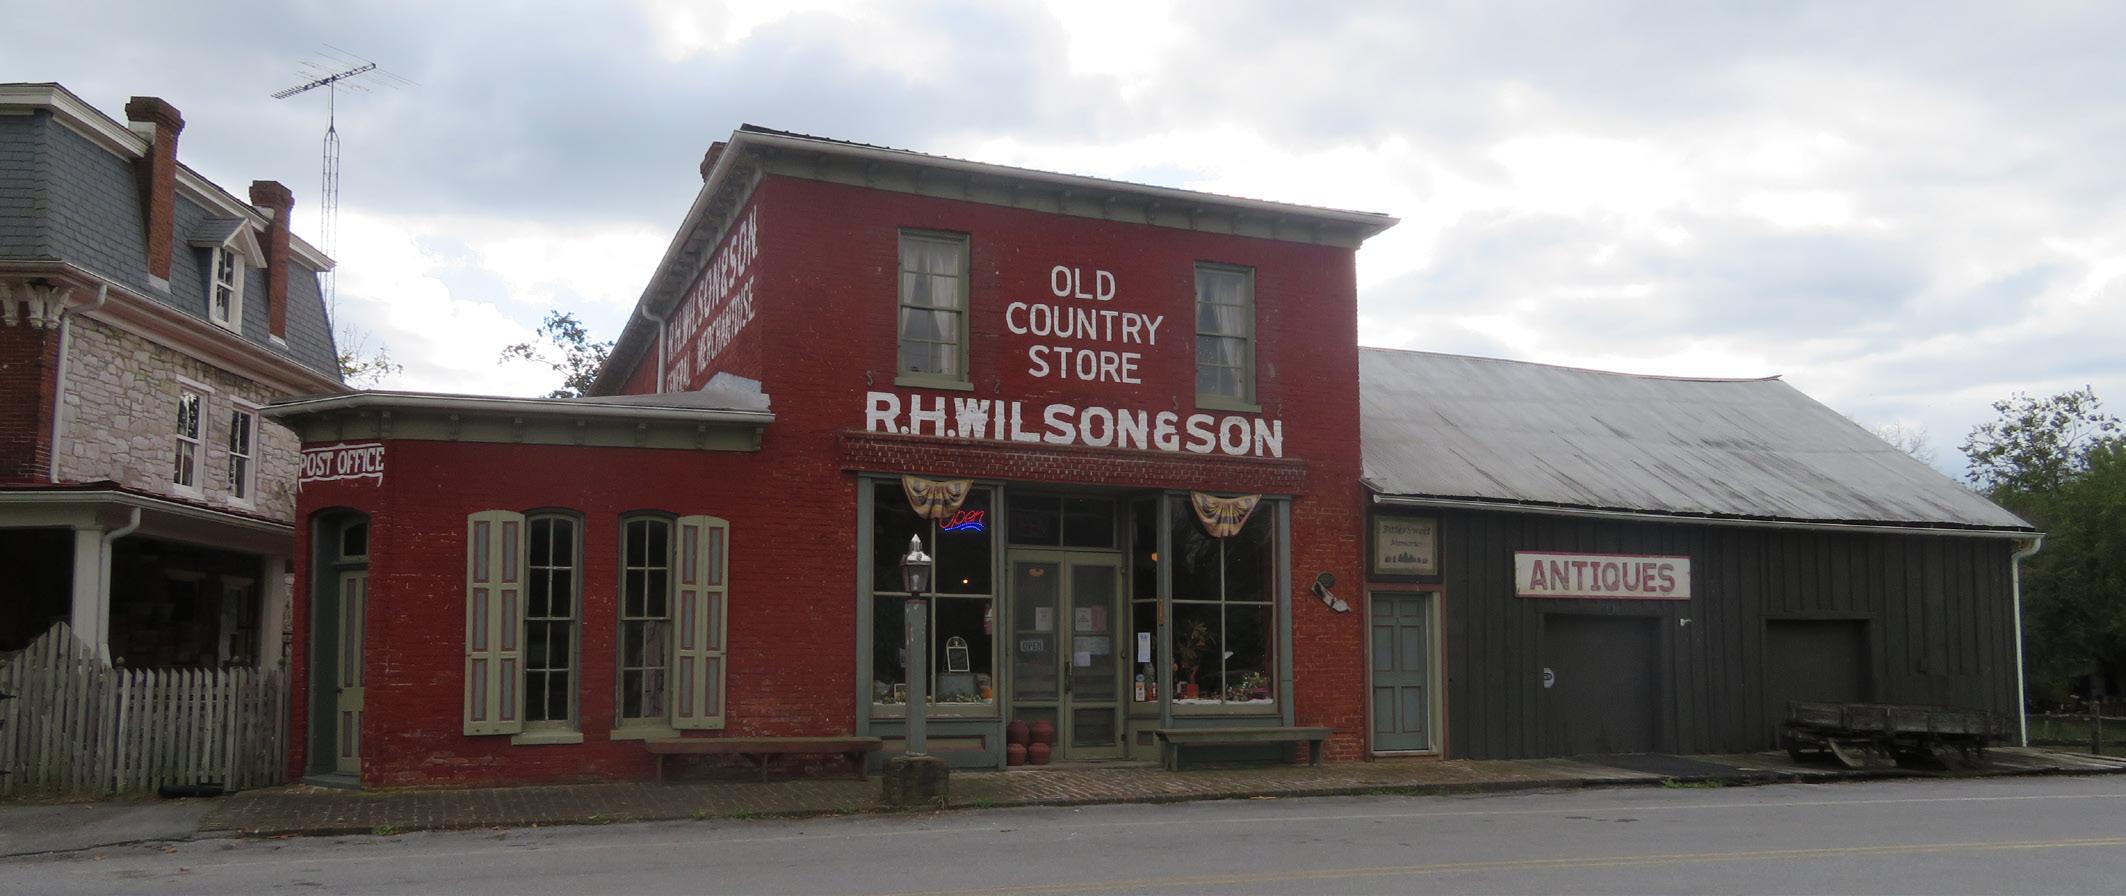
A property listed on the National Register of Historic Places or determined eligible by the Director of the Maryland Historical Trust (MHT), is included in the Maryland Register of Historic Properties (MRHP). The MRHP is a list of properties recognized by the State of Maryland for their significance in American history or culture. These properties are afforded certain regulatory protections and are eligible for MHT grants or loans
As a smaller subset, the National Historic Landmarks illustrate the heritage of the United States and their localities. These are considered outstanding representations of American history and culture. Washington County is fortunate to have three of these landmarks: Fort Frederick State Park and John Brown’s Headquarters (Kennedy Farm), listed in 1973 and Tolson’s Chapel and School, listed in 2021.

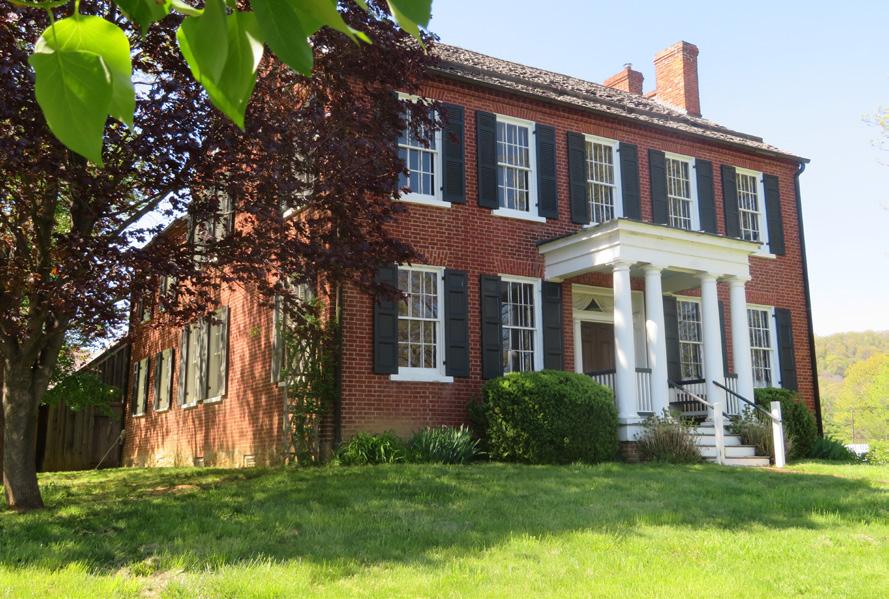
The primary repository for resource identification and documentation is the Maryland Inventory of Historic Properties (MIHP). The Inventory was created by the Maryland Historical Trust (MHT) shortly after its creation in 1961. The inventory includes the nationally listed resources mentioned previously as well as those added by State and local efforts. With grant assistance from MHT, the County inventory has continued to expand since initial efforts in the early 1970s and now includes approximately 1,300 sites. The County currently does not maintain its own inventory of historic or cultural resources.
Surveys for the resources include details such as the period of significance, narratives, location information, and photographs. Generally speaking, historic resources must be at least 50 years old to be inventoried and to coincide with the eligibility requirements for the National Register. The main themes of the County’s historic resources include industry, transportation, vernacular architecture, and social history. The properties fall into the categories of Buildings, Districts, Objects, Sites or Structures as highlighted next.
The County’s northern border is known as the MasonDixon line. As part of the effort to survey this historic border between the Confederate and Union states, milestone markers were placed that are now included in the MIHP under this category. The Old National Pike, a historic travel corridor in the County, also has milestones included in this category which are on the National Register. Because of the frequency of the milestones, this category contains over 70 resources in the County.

The County has additional historic districts not included on the National Register which cover towns, rural villages and landscapes previously surveyed through joint efforts with the State. Including the National Register districts, the County has more than 50 districts.

More than 90% of the County’s MIHP inventoried historic resources are buildings. The majority of the inventoried structures were built in the 19th century. Frame and brick are the most common exterior materials for structures on the inventory. The majority of residential buildings are vernacular, meaning they are not planned by an architect but based upon regional traditions, materials at hand and functionality. Washington County has more than 3400 buildings on the inventory.
Many of the historic sites in the County are cemeteries, either church related or small family cemeteries. There are also a limited number of State and local parks included in this category. Some sites related to prominent industries, including mining furnace complexes and mills, also fall into this category. Washington County has less than 70 sites included in the MIHP.
One of the most recognized historic resources to fall under this category of the MIHP are the County’s more than 20 stone arch bridges. Not surprisingly, stone culverts and walls are also prominent in this category. This category also includes other bridge construction types. Bridges are, by far, the dominant resource in this category. The category has more than 140 resources included in the MIHP.

In 1983, the Getty Survey (named for Mr. Joe Getty who performed the research) included an additional 82 properties in the inventory that were primarily early 20th century resources. Several years later in 1989, the County and Towns began working together to evaluate resources within Town limits. This resulted in documentation of potential historic districts, their contributing resources and a contextual history of each of the Towns describing factors that lead to Town development. A summary of these surveys is below in Table 5-2. The City of Hagerstown, which completed its own inventory, has 1,653 contributing resources located within six National Register Districts.

Between 1991 and 2002, further surveys were completed in smaller, unincorporated communities including Maugansville (101 resources), Rohrersville (42 resources), Pen Mar (53 resources), Fairplay (23 resources) and Tilghmanton (72 resources). Since the 2002 Comprehensive Plan, additional work has been completed resulting in updates to existing surveys and new documentation of resources. These new surveys have led to the designation of historic Rural Villages that require additional development review by the Historic District Commission. A list of the surveys conducted are included in Table 5-3. In addition to the surveys, the County has made progress in making the inventory more accessible to the public. A web application has been developed to assist the public in searching the inventory. The web application provides easy access to information related to historic buildings, districts, objects, sites and structures in Washington County. The app also provides direct links to the Maryland Inventory of Historic Properties through a hyperlink associated with each resource.

The Federal Government plays a large supporting role to state and local governments in historic resource preservation and planning. The Antiquities Act of 1906 was the first time the government inserted itself into the protection of historic resources. While it allows the President to create National Monuments from public lands, it also protects resources within public lands from what could be considered looting.
Created in 1949, The National Trust for Historic Preservation is a nonprofit organization charged with protecting acquired historic resources. These resources are significant to society and are used to inspire support in public participation of historic preservation. An example of a property held by the National Trust is James Madison’s Montpelier in the town of Orange, Virginia. Washington County does not have any sites that are under the supervision of the National Trust.
The most significant law passed regarding historic resource protection in the United States is the National Preservation Act of 1966. This one act is responsible for creating the majority of historic resource protections many people automatically associate with preservation. The main components of the act include the Advisory Council on Historic Preservation (ACHP), State Historic Preservation Officers (SHPO), National Register of Historic Places and Section 106 Review.
The ACHP was specifically established as part of the National Preservation Act of 1966 as an independent federal agency. The mission statement of the Council is to “…promote the preservation, enhancement, and sustainable use of our nation’s diverse historic resources…”. The Council has an advisory role to the President and Congress on historic resources preservation matters and they administer the public review and consultation process for Federal undertakings established by Section 106. They also work to improve any Federal policies or programs that impact historic resources to ensure that federal agencies act as responsible stewards of our nation’s historic resources.
The purpose of SHPOs is to carry out the national historic preservation program as delegates of the U.S. Secretary of the Interior. In Maryland, the SHPO is the Maryland Historical Trust. Their duties include:
• Locating and recording historic properties;
• Nominating significant historic properties to the National Register;
• Fostering historic preservation programs at the local government level and the creation of preservation ordinances;
• Providing matching funds for preservation projects;
• Commenting upon preservation projects under consideration for the federal rehabilitation tax credit;
• Reviewing all federal projects for impact on historic properties under Section 106 of NHPA and the regulations of the Advisory Council on Historic Preservation; and
• Provide technical assistance on restoration and other preservation activities to Federal agencies, State and local governments, and the private sector.
The National Register, as mentioned previously, is a tool that is used to document historic resources and provide a process for additional review for impact when federal or State funding is involved in a project. These properties also qualify for federal tax credits which incentivize rehabilitation projects.
Section 106 review (a reference to the section of the National Preservation Act of 1966) occurs when any federal or state funding or permitting is involved in a project that affects a National Register resource or a resource eligible for the National Register. It opens a consultation with Federal, State and local government as well as the public about views and concerns for the project. The review usually results in agreements and plans to mitigate the impacts on delineated resources.
The National Park Service and specifically the Department of the Interior, are named in legislation as the agencies responsible for implementation of plans that affect historic resources. The federal level programs, policies and laws are all administered by the Secretary of the Interior, or they have an advisor or advisee role. Federal programs set the basis for many of the local and state programs but are usually broad in their approach to historic resource protection.
The State of Maryland has several mechanisms in place to aid in the protection of historic resources. Established in 1966, the Maryland Historic Trust (MHT) acts as the State Historic Preservation Office (SHPO) for the State of Maryland pursuant to the National Historic Preservation Act of 1966. The main goals of the Trust are to research, conserve and educate, as well as assist the citizens of Maryland in preserving and interpreting the State’s history. As mentioned previously, they both assist the County with historic resource inventory updates as well as serving as a repository for documentation. They are also involved in providing guidance to the County and citizens regarding historic resources. As the SHPO, they are responsible for reviewing projects using State or federal funding to determine if there are impacts to historic resources. The following are key programs administered by the MHT:
• The Maryland Inventory of Historic Properties (MIHP): One of the main tasks of MHT is to be the primary repository for resource identification and documentation. It is important to note that the properties listed on the survey may not necessarily be historically significant nor are they subject to any restrictions or regulations.
• The Maryland Register of Historic Places: The Register is a listing of properties that have been extensively evaluated and found to be historically significant at a local, State or National level.
• Maryland Heritage Areas Programs: The Maryland Heritage Areas Program, currently encompassing 13 certified Heritage Areas located in every County in the State as well as the City of Baltimore, helps assist and promote heritage tourism throughout the State.
Washington County is one of three counties included in the Heart of the Civil War Heritage Area (HCWHA) which was created in July of 2006. The extent of the HCWHA in the County can be seen in map 5-1.

The mission of the Heart of the Civil War Heritage Area is:
“To promote the stewardship of [the] historic, cultural, and natural Civil War resources; encourage superior visitor experiences; and stimulate tourism, economic prosperity, and educational development, thereby improving the quality of life in [the] community for the benefit of both residents and visitors.”
The Heart of the Civil War Heritage Area Management Plan was adopted and made a part of the comprehensive plans of Carroll, Frederick and Washington Counties in 2007. This update of the Comprehensive Plan, when adopted by the County, incorporates, by reference, all portions of the Heart of the Civil War Heritage Area Management Plan, except those portions solely relating to other jurisdictions within the Heritage Area, as part of the Comprehensive Plan. The Civil War Heritage Area Management Plan provides an overview of resources and opportunities in the heritage area, as well as goals and priorities to advance the Heart of the Civil War Heritage Area mission.
In addition to the Maryland Historic Trust, there are several other State agencies that assist with programs designed to protect and revitalize historic and culturally significant properties. The State of Maryland offers many programs which correlate with national and local policies to enable the preservation of historic resources and maintain historic context. All of these require the public as partners and as active participants in preserving.
The Main Street Maryland Program was created in 1998 and is administered by the Maryland Department of Housing and Community Development (DHCD). The program coincides with the Main Street Project at the national level which was launched in 1977 by the National Trust for Historic Preservation. There is a 5-point approach to keep the downtown thriving that includes: Organization, Promotion, Design, Business Relations and “Clean, Safe, & Green” (Maryland Specific Point). Washington County has two Main Street communities: Williamsport and Hagerstown. The City’s involvement allows access to tools and partnerships as well as funding opportunities for the downtown.


The Maryland Scenic Byways Program, part of a national network of scenic byways, offers 18 planned routes for citizens to follow the history and culture of Maryland. Maryland’s Scenic Byways Program is a partnership of six agencies including the Maryland Heritage Areas, National Park Service, Office of Tourism Development, Department of Planning, Department of Natural Resources, and Maryland Main Street Program. Six state designated Scenic Byways are also recognized as National Scenic Byways. Four of these six pass through Washington County including the Historic National Road, Chesapeake and Ohio Canal, Antietam Campaign, and the Catoctin Mountain byways. The State utilizes funding to help protect, promote, and complete enhancements along routes each year.
The broader goals of the program include: maintaining and promoting the statewide system, sustaining the corridors over time through corridor management, facilitating a visitor experience, working to further associate the economic benefits of the routes, increasing the connection of the byways and improving livability in communities.
While not a well-known program, the Maryland Resident Curatorship Program is an incentivebased program used to maintain historic resources on State lands. The program, established in 1982, provides the curator of the property with a lifetime tenancy to restore, maintain in good condition and periodically share the property with the public. There are nearly 50 curatorship’s across the State. This program requires the investment of your own money and time into the restoration process.
The Maryland Environmental Trust (MET) and the Maryland Department of Natural Resources’ Rural Legacy Program (RL) are other programs that can have a historical component in the easements. The Rural Legacy boundary encompasses much of the southern portion of the County with about half of the properties having a historically or culturally significant resources listed on the MIHP. These programs are detailed further in the Agriculture and Forestry Chapter of the Plan.
The County does encounter many challenges to the retention of resources, there have been many successful collaborative efforts and mechanisms employed to support, educate and enable the stewardship of historic and cultural resources.
The State of Maryland has a total of 24 counties. 11 of these Counties have been designated as Certified Local Governments (CLG) which denotes that they have made a special commitment to historic preservation. Washington County is one of the few western jurisdictions designated as a CLG. The County obtained the designation in August of 1991. The Historic District Commission (HDC) acts as the required qualified historic preservation commission for the program.
Benefits of becoming a CLG include:
• Eligibility to compete for funds to conduct projects that promote preservation, CLG sub-grant funds, ability to participate in the CLG Educations Set Aside Program
• Formal participation in the National Register nomination process
• Annual performance evaluations
• Priority technical assistance.
Being designated as a CLG means that the County is recognized by the National Park Service as being able to participate in the national policy of preservation.
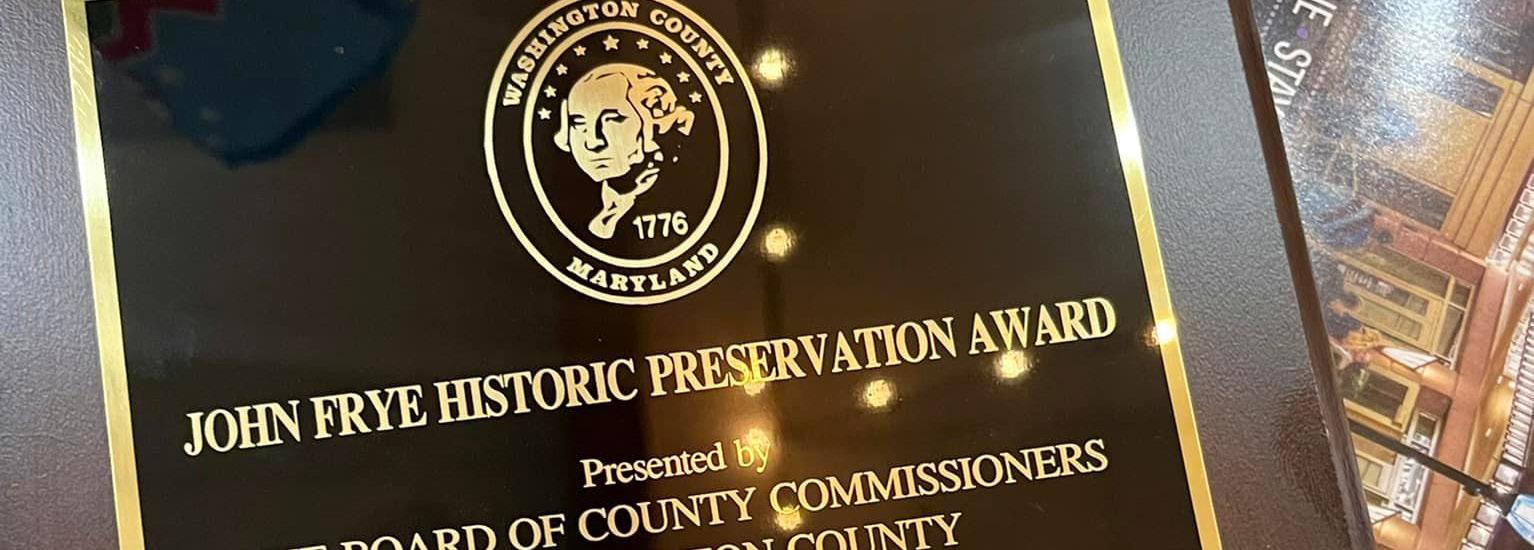
This Committee was originally tasked with generating the report about historic resources in the County during the late 1960’s. This report fueled historic resources additions to the MIHP in the following years as well as highlighting potential policies which might promote the preservation and protection of resources. The HAC is still active today and focuses on listing and reviewing updates to the historic resources in the County by recommendation to the Board of County Commissioners. They also sponsor the annual John Frey Historic Preservation Award.
The Historic District Commission (HDC) was created in 1986 and its duties and powers are largely housed in the Zoning Ordinance for Washington County. The HDC is responsible for reviewing applications which are affected by select Rural Villages in the County, as shown in Map 5-2, the Antietam Overlay 1 or Antietam Overlay 2 (AO) zoning districts, and the Historic Preservation (HP) zoning overlay. In addition, applications affecting properties on the Maryland Inventory of Historic Properties (MIHP) are also reviewed. The HDC makes recommendations regarding legislation, applications for zoning text or map amendments, special exceptions, variances, site plans, subdivisions or other proposals affecting historic preservation or historic resources. One of the important roles of the HDC is also to work closely with the MHT to promote State preservation efforts.
Other duties of the HDC include:
• Recommend programs and legislation to the Board of County Commissioners and Planning Commission to encourage historic preservation
• Serve as a clearing house for information, provide educational materials and information to the public and undertake activities that advance the goals of historic preservation
• Development of additional duties and standards. For example, criteria to be used in the review of building permit applications
• Prepare, adopt, publish and amend additional guidelines to provide adequate review materials for applications including HP and building permits
• Oversee maintenance and updating of the inventory of Washington County Historic Sites
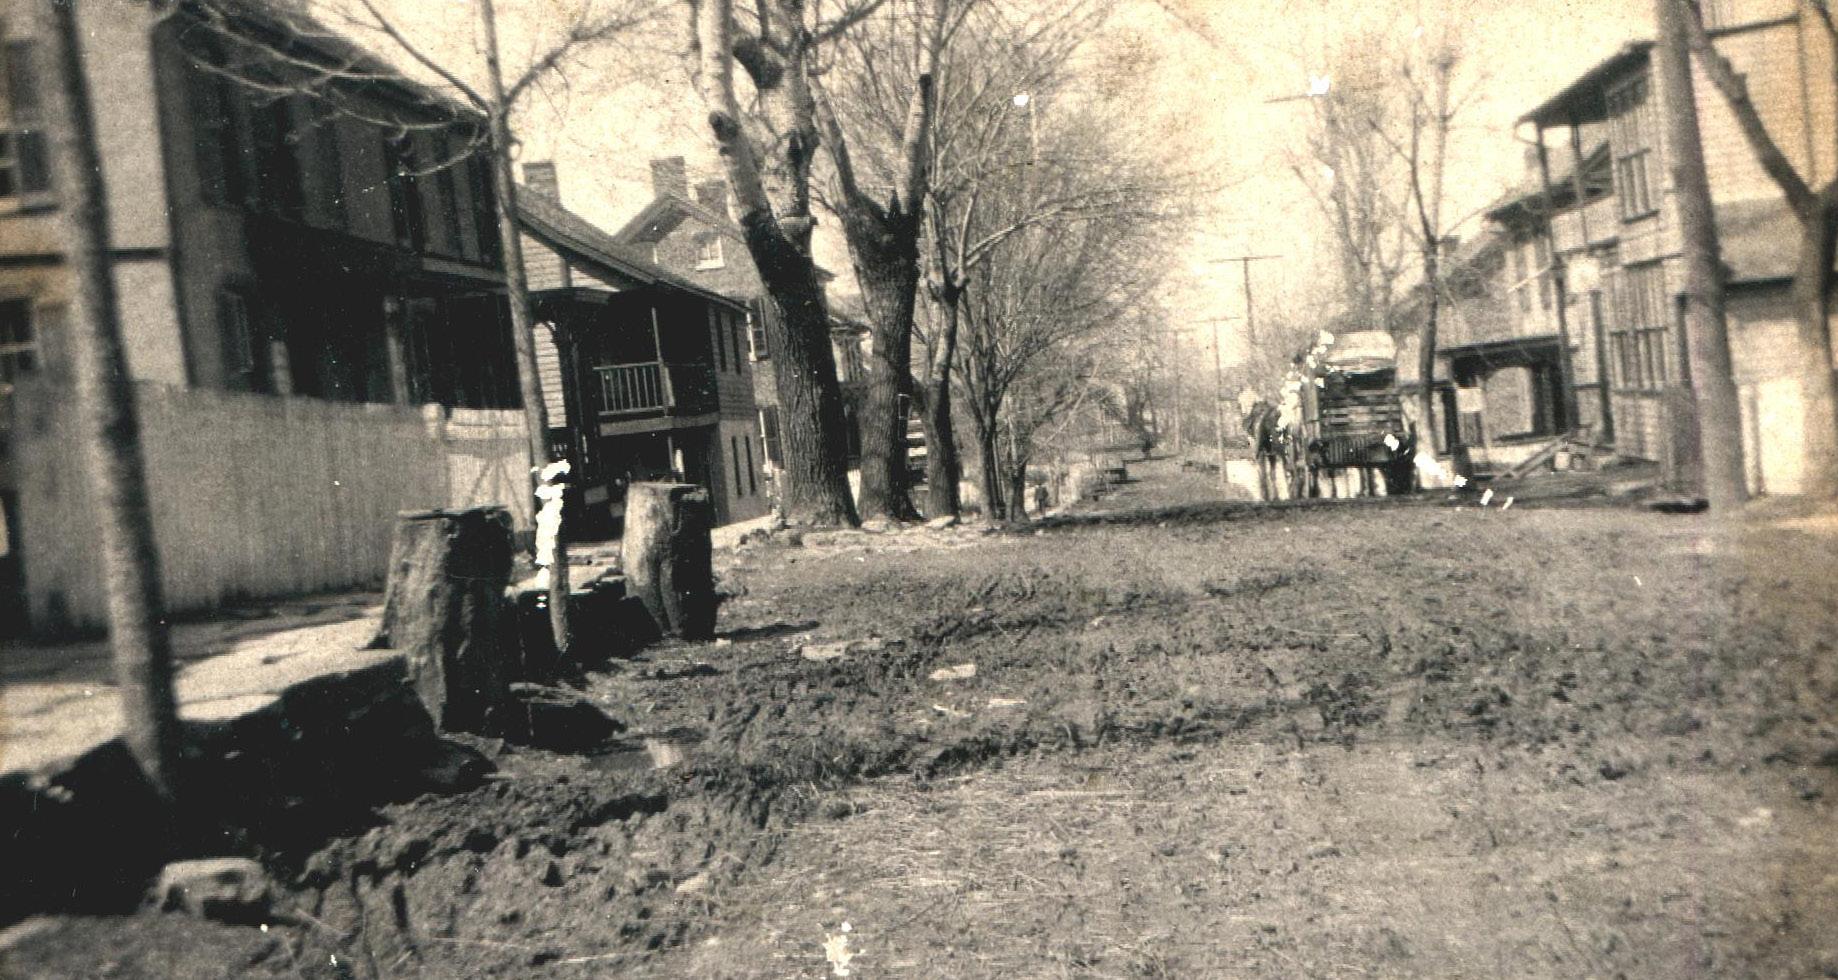

Many of the updates to the MIHP, which the County and State have worked on collaboratively, involved surveys within the County’s unincorporated Rural Villages. They are often strongly related to industry, transportation or migration. The County has a Rural Village zoning classification, but it is important to note that Historic Rural Villages do not always coincide with this zoning designation.
Once a Historic Rural Village is surveyed by MHT or the County, the individual resources identified would then have to undergo review by the HDC if any exterior changes are to be made. In addition, properties individually listed on the MIHP or any new construction within a designated Rural Village would be reviewed by the HDC review. A map of rural villages surveyed is displayed in Map 5-2 above and a list is also below.
Antietam Bakersville
Brownsville Cavetown
Downsville Fairplay Gapland Highfield
Leitersburg
Rohrersville
Mount Lena
Sandy Hook
Pen Mar Ringgold
Tilghmanton
The protection of scenic vistas, especially those associated with small towns and villages, is integral to historic resource protection. Vistas dramatically altered from their historic context reduce the goal of visitor immersion in the resource that heritage tourism strives to achieve. Washington County has numerous examples of historic and cultural landscapes that offer scenic vistas, particularly within or approaching its Rural Villages.
The Antietam Overlay zoning districts (AO) are a primary tool by which the County protects scenic vistas. The AO protects viewsheds around the Antietam National Battlefield and its approaches through additional levels of regulatory review.

As shown on the Map 5-2 above, there are three distinct subareas that are defined in the Antietam Overlay zoning district.
• AO-1 encompasses the Battlefield proper and a buffer surrounding the Federally owned land. In this area, any exterior changes to existing structures are required to have additional review provided by the HDC.
• AO-2 consists of the approach areas to the Battlefield along major transportation corridors. This area also requires additional review of changes to the exterior of any existing structures by the HDC.
• AO-3, pertains to the Red Hill middle ground viewshed from the Battlefield. This area was designated with assistance from the National Park Service via a technical study entitled “Analysis of the Visible Landscape: Antietam” published in April 1988. Regulations in this area limit the amount of tree cutting allowed on specific areas of Red Hill.
The purpose of the Historic Preservation district is to provide a mechanism for the protection, enhancement and perpetuation of historic and cultural resources. It is established as an overlay zone which adds additional land use controls to the base zoning district. The presence of the overlay on a property indicates there is a historic or cultural resource that has significance to the heritage of Washington County.
An HP Overlay must be in place on a property to be eligible for County tax credits. Once in place, the HP Overlay provides continued opportunities for County tax credits as well as providing review authority for new construction or modification of existing structures’ exteriors on the property. There are currently more than 40 HP Overlay areas within the County as seen in Map 5-3 below. The intention of the Overlay as listed in the Zoning Ordinance is as follows:
• Safeguard the heritage of Washington County as embodied and reflected in such structures, sites and districts;
• Stabilize and improve property values of such structures, sites, and districts and in Washington County generally;
• Foster civic pride in the beauty and noble accomplishments of the past;
• Strengthen the economy of the County; and
• Promote the preservation and appreciation of historic structures, sites and districts for the education and welfare of the residents of Washington County.
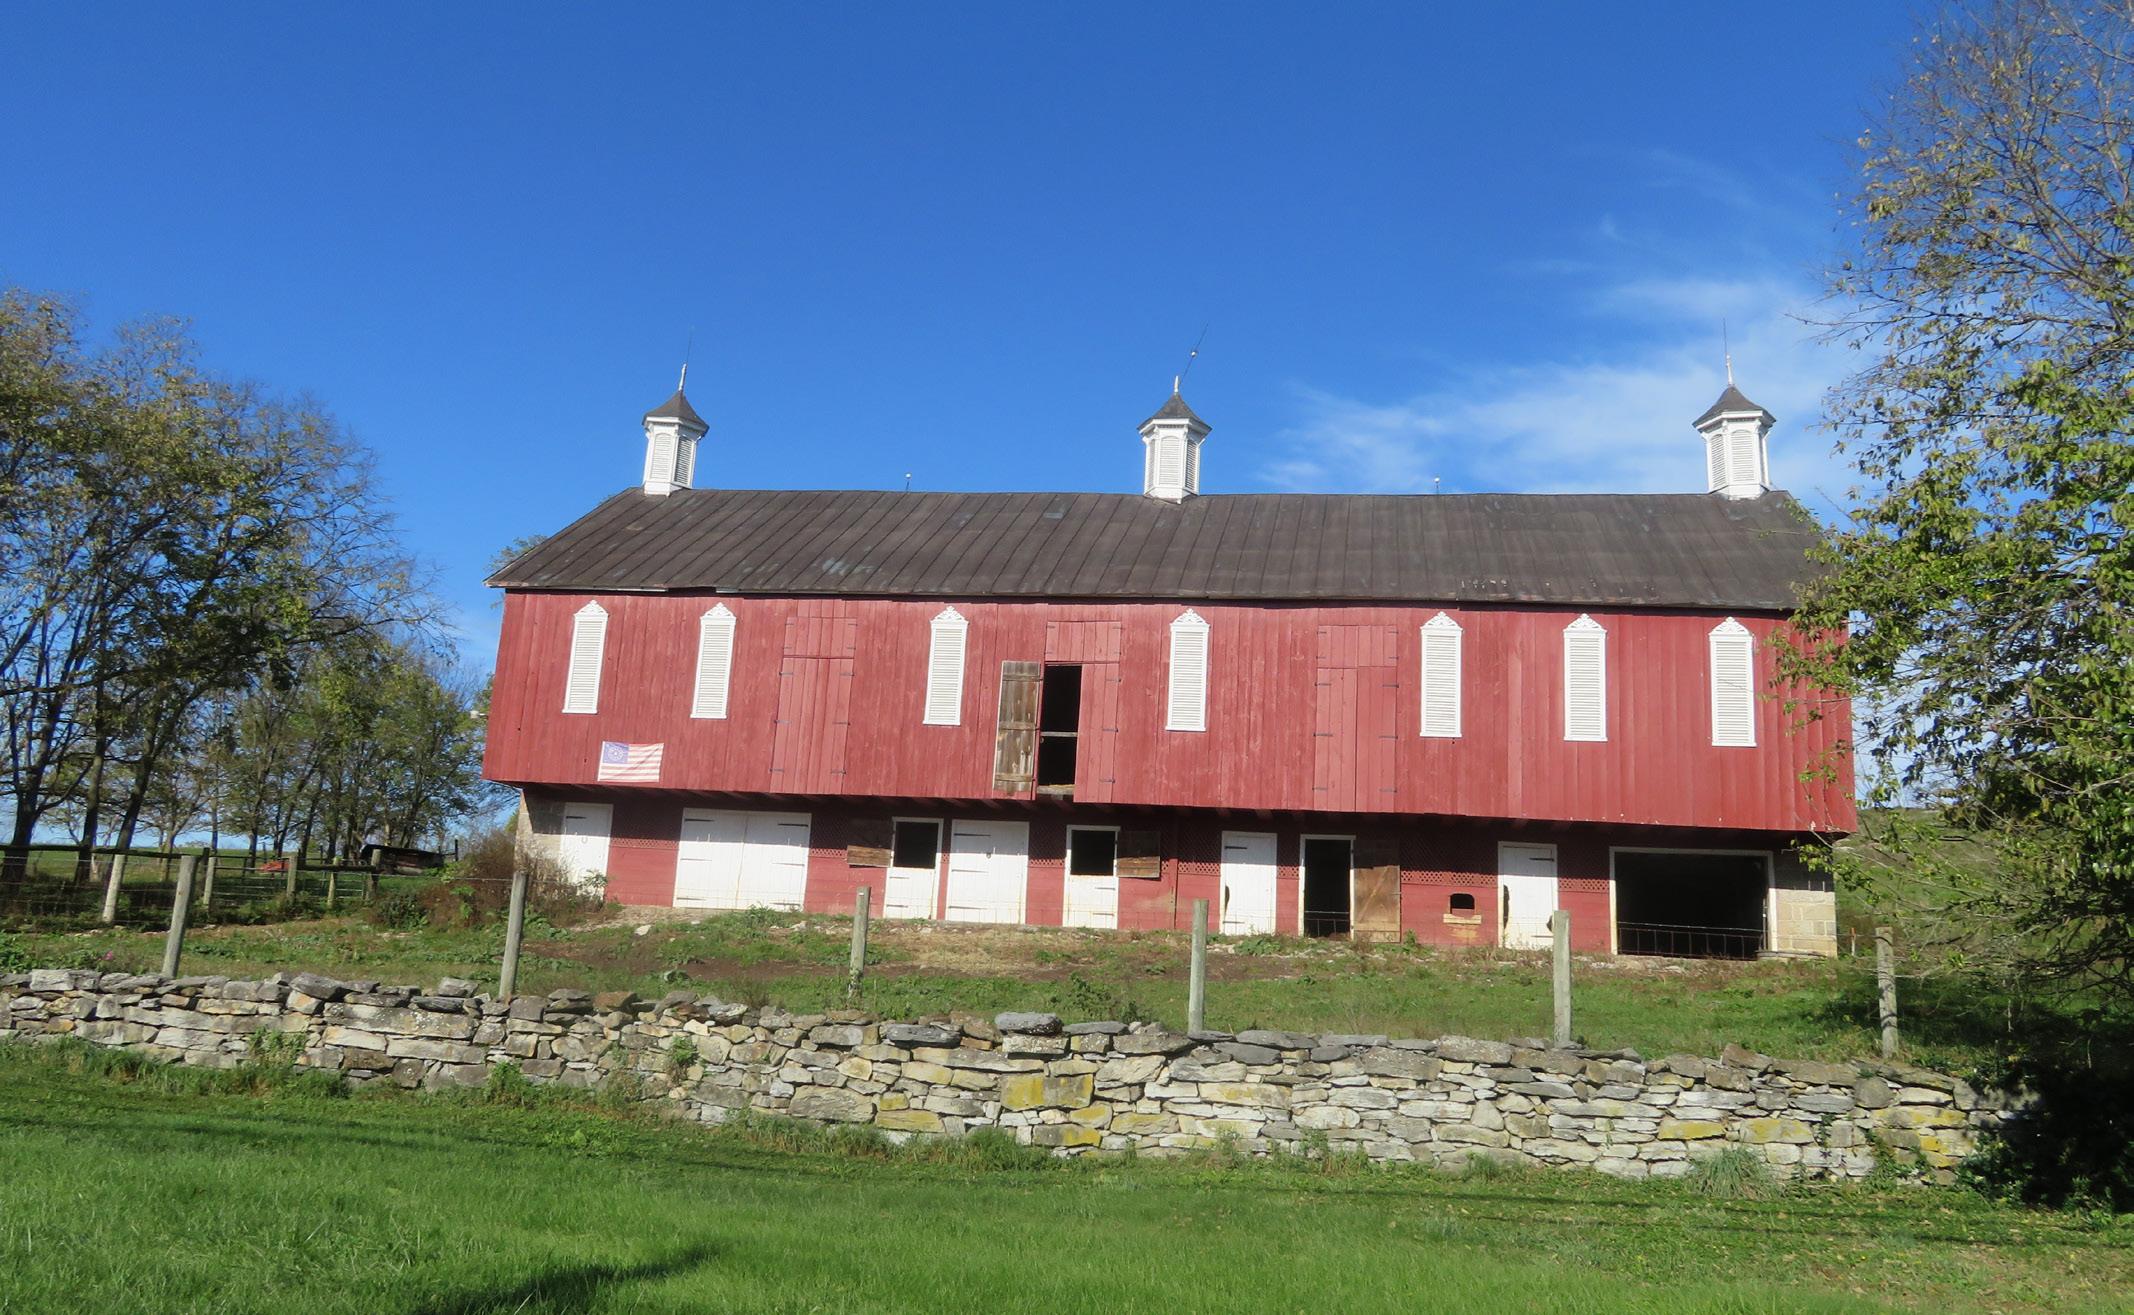
One of Washington County’s main tools used to promote historic preservation is offering tax credits for the restoration and rehabilitation of exteriors on historic structures. Applicants apply for these credits prior to work starting to determine if the property is in the HP Overlay or Antietam Overlay 1 or 2 zoning areas. If the property is not in an existing area, the HP Overlay must be applied prior to application for the tax credit. This overlay is added through the rezoning process at no charge to the applicant. Once the property is in an eligible area, credits of up to 10% of the total amount spent on preservation are available from the County if the owner follows the Secretary of Interior Standards for the Treatment of Historic Properties.
The HDC reviews applications for tax credits against eligible items in the Zoning Ordinance Section 20.6 or improvements as described by the US Internal Revenue Service. The owner can also apply for State and Federal tax credits up to 20% through the Maryland Historical Trust, which is a separate application process. The County is exploring ways to gain greater participation in this program.

In June of 2022, the Historic District Commission (HDC) adopted “Design Guidelines for Historic Structures –Washington County, Maryland”. These Guidelines are a set of guiding principles that establish a basis for the HDC’s recommendations, approval, or denial of applications. The HDC uses the Guidelines and the Secretary of Interior’s Standards for the Treatment of Historic Properties to determine if proposed work is appropriate for properties that fall under its review. The Guidelines are made available to assist owners of historic buildings in understanding how historic preservation policies affect their plans to maintain, preserve, or enhance their properties. The information provided is intended to assist with planning and implementing projects in a way that is mindful of the historic nature of both the property being reviewed and its surroundings.


Stakeholder meetings held prior to the development of this Plan identified building code flexibility with historic properties as one challenge in the preservation of historic structures. To help address some of the issues related to historic building rehabilitation, the County has adopted a specific chapter in the building code that relates solely to historic structures. In order for a contractor to use this portion of the building code, the structure must be listed with the State or local body as historic. If the building is listed as a historic structure, then they may submit for approval to use alternative materials, methods, and equipment to complete their renovations in accordance with Section 105.2 of the International Building Code. For properties falling outside of this portion of the Code, the only current option is to work with Code officials at the County on an individual project basis.
While not regulatory, private preservation organizations serve an important role in protecting historic resources. Washington County is fortunate to have an abundance of active organizations that not only serve as local repositories for historic resources but are also stewards of many of the important resources in the County. These organizations serve to provide guidance for individual property owners as well. It is important for Washington County to continue to foster established relationships and encourage new connections with these organizations to continue to save historic resources. Some of these resources are included on Table 5-5.
Washington County Historical Society
Washington County Historical Trust
Smithsburg Historical Society
Keedysville Historical Society
Hancock Historical Society Save Historic Antietam Foundation
Sharpsburg Historical Society
Clear Spring Historical Association
Civil War Trust
Boonsboro Historical Society
Washington County Association of Museums and Historic Sites
Founded in 1911, the Washington County Historical Society (WCHS) is an organization dedicated to the preservation and promotion of the County’s history and culture. The WCHS is housed in the historic Miller House on West Washington Street in downtown Hagerstown. Tours are given of the property throughout the year, which also houses exhibits and special collections focusing on County history and offers resources for genealogical research. WCHS also leads walking tours to historic sites around downtown Hagerstown on a periodic basis, and provides other special programs throughout the year. The Historical Society has been involved in the preservation of many historically significant properties around the County over time, including Fort Frederick, the Washington Monument, Burnside Bridge at Antietam Battlefield as well as many others.
The Washington County Historical Trust (WCHT) works to preserve County historic structures and cultural resources through education and public awareness. An eight-member Board of Directors governs the Trust, which is headquartered in Hagerstown. WCHT targets specific properties that it considers “endangered,” due to development or neglect, and works with stakeholders to move in the direction of preserving and restoring the property. The Trust produces educational materials related to historic preservation and, in some cases, assists in the restoration of properties. WCHT is currently working with the City of Hagerstown and the Antietam-Conococheague Watershed Alliance to restore the Saylor House in Kiwanis Park, which will then become the joint headquarters for these two organizations.
Often related to local preservation organizations are museums used for public outreach and research. Washington County has nearly 25 museums ranging from the Rural Heritage museum to the Museum of Fine Arts. Many of the Towns have their own museums and historical societies which also host collections for the public to enjoy. Washington County will continue to collaborate with these entities.

Up to this point, this element has discussed federal, State, local and even private entities and their impact on historic resources in Washington County. However, it is important to point out that most historic resources in the County are under private ownership. This means that to preserve and maintain the County’s historic resources for the future, efforts must start at the individual level.
By choosing to preserve historic resources, property owners are providing a service to the community. Environmental sustainability is positively impacted as the continued use of a property greatly reduces the consumption of new materials, thereby reducing landfill waste. Above all, present and future generations are able to connect to a shared heritage through a collective immersion in historic resources that still exist for people to enjoy today.
If preservation of historic resources is to succeed, adults and children must be educated about the stewardship of historic and cultural resources and their importance to Washington County. In addition to individual property owners, groups such as realtor's and developers also need to be educated in the advantages and opportunities in preserving existing structures. Therefore, although the historic preservation groups and organizations previously mentioned have a role in educating the public, it is ultimately up to the individual to learn about the history and benefits available to them regarding their specific resource.
Planning for future repairs and maintenance is vital in budgeting to take full advantage of programs in place. Maintenance costs on historic structures are often perceived to be much higher than a new structure. This can act as a deterrent to owning, retaining, or purchasing an historic structure. Regardless of building age, maintenance is both a necessity and a guarantee. Many times, ordinary maintenance can prevent system failures which could lead to the loss an historic resource or its usefulness. Ordinary maintenance is discussed in the County’s Design Guidelines for Historic Properties which can be referenced by any homeowner.
As previously discussed in the policy section of this element, tax credits and other financial incentives are used as a tool by each level of government to promote historic resource protection. Tax credits provide a positive impact on the economy at the State and local level and should be considered an investment rather than a burden. They are an important tool specifically for revitalization of blighted properties and maintenance for ongoing resource preservation efforts. In 2020, the estimated qualified rehabilitation expenditures for Federal Tax credits in Maryland totaled over 200 million dollars in private investment. To date, the federal program has had over 100 billion in estimated rehabilitation investment nationwide1. The use of tax credits also spurs other positive economic benefits such as:
• Raising local and state tax assessment. Property owner investments generate more revenue for the future. For every dollar of commercial tax credits, it is estimated that there this is an $8.53 return on that investment.
• Increase improvement feasibility. An estimated 3/5 of residential property owners stated that they would not have attempted renovations without the credits.
• They generate jobs. For every $1 million spent on renovations, there is an estimated 72.5 jobs created during the construction period.2
Locally, tax credits are administered in the same manner as State and federal tax credits; however, County credits are only available up to 10% versus the 20% provided at the State and federal level. While local tax credits can provide the same economic impacts, the program is typically underutilized. Most projects that have used this program include repair of roofs, chimneys, porches, and windows.
One of the economic benefits of a community with plentiful historic resources intact is Heritage Tourism. Protection efforts have been expanded over time to not just merely preserve resources but to also give them context and provide utility to citizens. Using and displaying resources in a way that is interactive provides a more meaningful experience and can lead to more interest in preservation of other resources. For example, rather than just saving a building or structure for people to view from a distance, the building could be opened for citizens to walk through and view the resource on a more intimate level thus creating a contextual basis for people to connect to the resource.
1 Federal Tax Incentives for Rehabilitating Historic Buildings: Annual Report for Fiscal Year 2020. https://www.nps.gov/subjects/taxincentives/upload/report- 2020-annual.pdf
Listed as a key component of Western Maryland Historic resource planning by Preserve Maryland II, heritage tourism is defined as “traveling to experience the places, artifacts and activities that authentically represent the stories and people of the past and present” and “heritage tourism can include cultural, historic and natural resources.1 Promoting this form of tourism has benefits for both the residents of the County as well as visitors. The programs, which encourage and promote the importance of historic resources, enhance the quality of life for residents and provide unique experiences for tourists. The Plan also encourages the protection of scenic vistas and gateways to small towns. The County currently has policies in place such as the Antietam Overlay to address these types of issues.
Tourism associated with the many National Park Service Sites in Washington County provide a large economic opportunity. According to the Maryland Heritage Area Program Impact Report 2020, the Heart of the Civil War Heritage Area (HCWHA), across 3 counties, had nearly 4 million tourists in 2019. The Heritage area supported and sustained more than 6,000 jobs and had a $450.2 million impact. The HCWHA generated $60.3 million in tax revenues.2

In addition to positive economic impacts, there are also positive environmental and land use impacts that occur by encouraging renovation of existing structures rather than demolition or new development. From an environmental perspective, renovation of a historic structure rather than demolition causes a reduction in waste thereby saving landfill space. Rehabilitation in Maryland generates up to 2,500 tons less debris relative to total demolition and new construction for every $1 million invested in historic tax credit programs.3
Retaining historic structures can also provide a return on investment through energy efficiency. Often, historic structures are incorrectly described as energy inefficient simply because of their age. In fact, many historic homes have been sited and renovated through passive measures such as window replacements or added insulation to make them more efficient than some modern homes.
1 NationalTrust for Historic Preservation.{Preservation Glossary} Todays Word: Heritage Tourism. https://savlngplaces.org/storles/ preservatlon-glossary-todays-word- herltage-tourlsm#.V-viUSgrLRY. 28 Sept 2016.
2 Heart of the Civil War Heritage Area Makes an Impact, December 2020 https://www.heartofthecivilwar.org/media/media/download/3309
3 The Abell Report, Heritage Tax Credits: Maryland’s own stimulus to renovate buildings for productive use and create jobs, an $8.53 return on every state dollar invested. P.3 Vol 22 No 1March 2009.
According to the National Park Service, Technical Preservation Services, “Generally, buildings constructed before the 1920s included energy-conserving features in the original design. These features often still exist in historic buildings but may have been altered over time. Energy Conserving Features Inherent in Older Homes1 helps identify historic features that have the potential to conserve energy use once again”2 Renovation of existing structures also promotes more sustainable growth and land use patterns. Reuse of buildings help protect greenfields and limit sprawl. It also provides an opportunity for savings related to infrastructure costs.
The County has more than 50 identified rural villages, however, only 12 have completed surveys. Additional survey areas such as Park Hall are not rural villages but are significant clusters of identified resources through survey. The County needs to continue to seek funding and research the remaining rural villages. Adoption of the resulting surveys will enable the Historic District Commission to continue review of changes to identified contributing resources and new construction which may adversely affect those resources. At the time of adoption of this Comprehensive Plan, the Historic District Commission will have approval/denial authority of permits affecting contributing resources and new construction in all of the survey areas listed in Table 3 as well as those previously in place in the 2002 Comprehensive Plan listed in Table 4. New construction, properties listed individually, but within a Rural Village zoning designation and demolitions will be reviewed for recommendations by the HDC unless new policies are adopted.
According to Preserve Maryland II, the inventory currently has more than 4,000 historic resources, however, when examining structures more than 50 years of age, a key National Register qualifier, there may be over 22,000 that have not been evaluated. The original large survey efforts in the County completed in the 1970’s did not consider resources after the 1920’s so there is a significant lack of 20th century structures on the inventory. The 20th century resources need to be researched and included on the inventory when and where appropriate.
The County also has not explored the area of thematic inventory updates. Examples of thematic updates include resources which are associated with specific populations, industries or events. Many of the resources currently on the inventory are associated with architecture themes rather than thematic categories. It is important that inventory updates consider thematic surveys because these focused surveys are opportunities to engage citizens while improving documentation for resources.
The current status of resource documentation for properties in Washington County included on the MIHP is highly variable. Some resources have no pictures or descriptions and do not meet the current MHT Guidelines and Standards. The variation in documentation often inhibits the review by both citizens and County staff when changes to resources are proposed. It should be a priority to update the existing documentation to include photographs, descriptions and documentation to the current standards whenever possible.
The Historic District Commission has also expressed interest in creating a local historic property inventory rather than relying on the MIHP. The MIHP is meant to catalog what exists that is older 50 years and examine it for National Register qualification. A property with little integrity, architectural value, or historic value may be on the inventory merely as a result of the processes surrounding historic review at the federal, State or local level. Prioritizing County resources by having a local inventory may lead to easier implementation of local land use regulations protecting historic resources. It would also enable outreach regarding resources to be targeted and more effective. The ability to provide updated and complete documentation would also be a benefit of a County based inventory. This inventory would potentially start with the properties already identified through the Historic Preservation Zoning Overlay, National Register of Historic Places or State historic preservation easements processes and expand to other properties as they participate in local incentive programs such as historic tax credits.
The County also acknowledges that the MIHP is a mechanism for review at the federal and State level so any creation of a County inventory should be consistent and concurrent with updates to the MIHP to ensure continued protection of resources at all levels. If surveys are completed by the County they should continue to be to the Standards and Guidelines adopted by the Maryland Historical Trust. The MIHP should continue to be a tool for resource identification in County policies but it should not be the sole source for County historic resources.
Washington County strongly encourages the retention and preservation of historic buildings, structures, sites and objects. In 1990, a demolition policy was adopted by the Board of County Commissioners, which enables collaboration between property owners and the Historic District Commission and Planning Commission ensuring demolition alternatives and mitigation have been explored. Any demolition permit in Washington County that involves a property on the MIHP or is more than 50 years old in the Antietam Overlay (AO) or Rural Village (RV) zoning districts will require HDC review for support of the permit. The HDC reviews, for approval, demolition within the Historic Preservation Zoning Overlay. As part of the Design Guidelines used by the HDC, demolition is reviewed against preferred alternatives to demolition such as incorporating the structure into future plans to the less preferred demolition mitigation which may be documentation and salvage based.
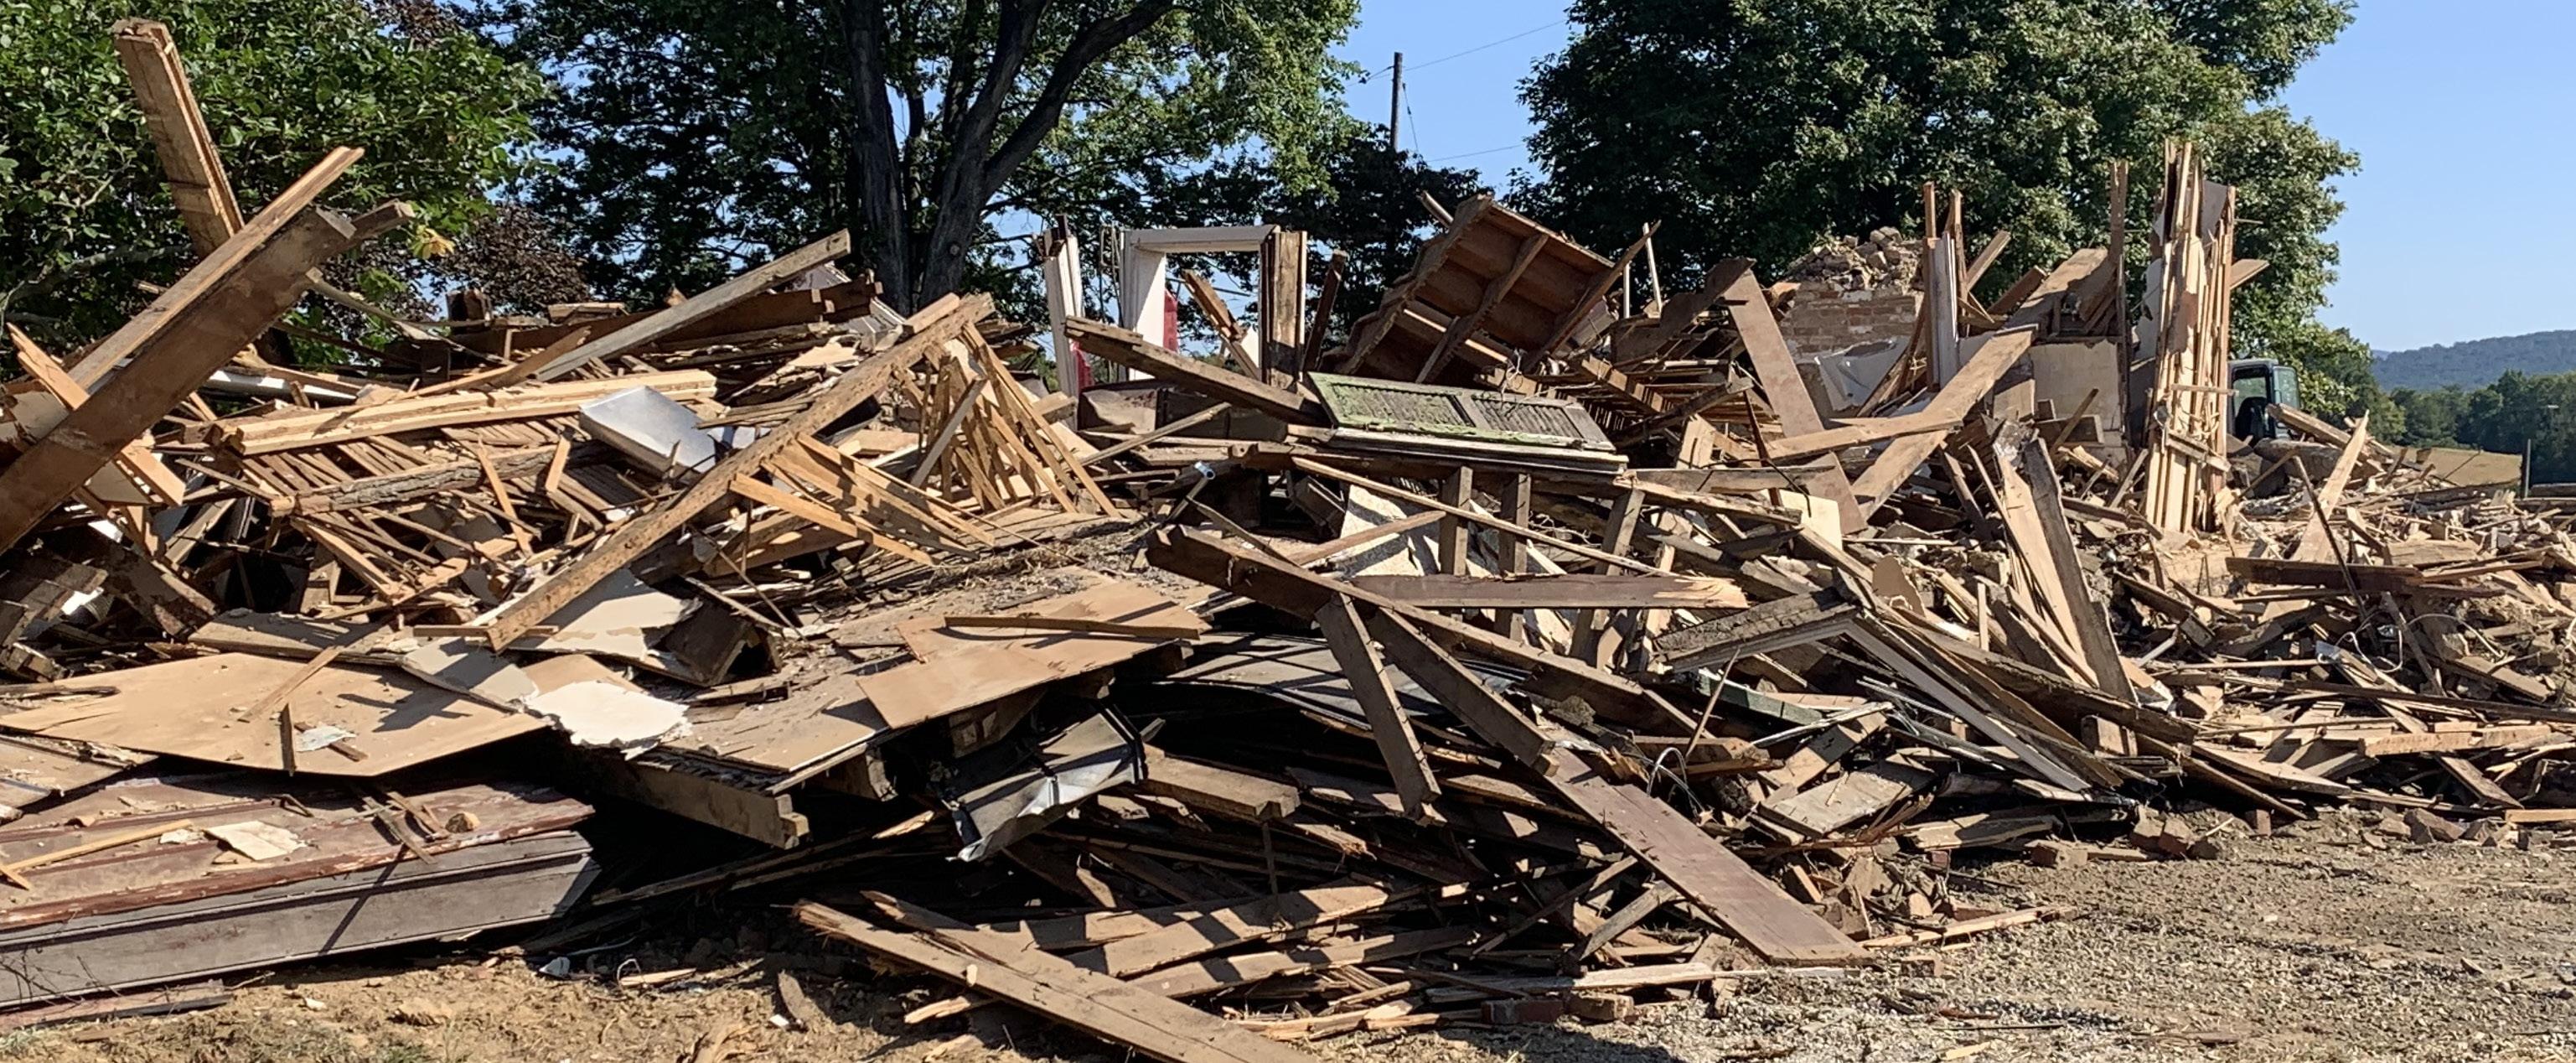
On average, between 2000 and 2022, Washington County issued sixty-five (65) demolition permits per year. Because not all demolitions involve historic structures, there were an average of only 3 demolition permits reviewed by the Historic District Commission each year during that same period.1 The primary reasons for demolition permit review by the HDC are to ensure all demolition alternatives have been explored and any mitigations have been evaluated and executed. Again, the policy, except in the case of the Historic Preservation Zoning Overlay, does not allow for the HDC to deny the issuance of a demolition permit. The existing demolition policy from 1990 also does not have any penalty for demolition without a permit or demolition by neglect. The lack of approval authority, demolition without a permit, and demolition by neglect have been topics for updates to the existing demolition policy several times since the adoption of the previous Comprehensive Plan, however, the 1990 policy remains in effect.
Described as a situation in which a property owner intentionally allows a historic property to suffer severe deterioration, potentially beyond the point of repair. Property owners may use this kind of long-term neglect to circumvent historic preservation regulations. The Historic District Commission sends targeted mailings regarding incentive programs to properties threatened by demolition by neglect.
In order to confront the issues of demolition and demolition by neglect, the County should avoid assigning future land uses which conflict with the continued use of a historic resource. The protection of historic landscapes to retain resource context should continue to be a priority. Education regarding ordinary maintenance, adaptive reuse and improved incentive mechanisms available to individuals will also continue to be priorities for the County to combat these issues.
The protection of scenic corridors, especially those associated with small towns and villages, is important to historic resource protection. Preserve Maryland II encourages the protection of scenic vistas and gateways to small towns. Deteriorated corridors can detract from the context of nearby historic resources and also reduces the goal of immersion that heritage tourism strives to achieve. As discussed previously, the County protects the approaches, viewshed and Antietam National Battlefield proper with Antietam Zoning Overlays. To a lesser degree, there are Historic Rural Villages which have adopted surveys that also have review standards aimed at protecting the context of the contributing resources.
The Historic Preservation Overlays aim to protect context by including not only the historic resources themselves, but an area surrounding the resources large enough to retain the resource’s context. There are many other areas in the County that have clusters of valuable resources which could benefit from similar overlay protections. These include areas along historic roadways, Rural Villages not yet surveyed, Historic Rural Village approaches, and properties on the National Register of Historic Places. Studies to determine areas and roadways where historic context would benefit from expanded land use protections, such as screening, setbacks and other design standards should be completed.
The majority of historic resource regulations within the County are found in the Zoning Ordinance. The inclusion of the Historic Preservation Overlay and enabling language for the Historic District Commission in that ordinance were a requirement of the Certified Local Government application in the 1990’s. At the time, the Zoning Ordinance was an appropriate mechanism, however, historic resource protection has evolved at the State and county level. Multiple ordinances, policies and programs with varying language and terminology must be referenced to determine impacts on resources on a specific property. Confusion also occurs between naming conventions such as the Rural Village zoning designation and the Historic Rural Villages, which require Historic District Commission review.
Modernization of historic preservation efforts through a dedicated ordinance would enable the County to tailor land use policies such as, historic context and scenic vistas, as well as update language and terms for consistency. A dedicated ordinance would also allow for a more proactive and elaborative approach to issues affecting historic resources which can be hindered by the structure of the Zoning Ordinance. Other stand-alone ordinances such as the Subdivision Ordinance, which have specific provisions for historic resources should be examined to ensure that they provide adequate tools for resource protection. It is also important for citizens to understand the policies, programs, and regulations in place and their role within them to make sure there is less confusion on the federal, State, county and individual property owner’s authority.
As previously discussed, the County has an Ordinance to Provide Property Tax Credits for Improvements to Specified Historic Structures which was adopted in 1990. The Ordinance has not been updated to take full advantage of the maximum percentages allowed by State law. The local tax credit program is also extremely underutilized. The program has only seen 38 issued credits over the span of its existence with the majority being in the City of Hagerstown. For a homeowner, the 10% credit on applicable construction is often not enough to justify the documentation required. The tax credit program also requires the owners to have the money to complete the projects, which is often not feasible for large expenses.
Another hurdle for property owners is the narrow definition of qualified areas. In the County, a rezoning is often required to even qualify. While the rezoning cost is deferred by the Department of Planning and Zoning, this adds additional time to project timelines which might deter applicants. The County should continue to expand qualifying areas for tax credits, streamline documentation requirements, and maximize the credits allowed by State legislation. The County should also examine adjacent jurisdictions programs and other existing County programs which could be leveraged or modified for additional historic resource protection and incentives such as grants.
Ì Expand and update the historic resource inventory by continuing to support updates to the Maryland Inventory of Historic Properties and evaluating existing inventory documentation for updates. The County may also pursue a local resource inventory.
Ì Improve the framework for historic resource preservation by ensuring that existing incentive mechanisms are robust and new alternatives are explored.
Ì Minimize factors which negatively impact historic and cultural resources by balancing growth and providing education opportunities which promote historic resource appreciation.
Ì Identify and protect additional scenic corridors or areas with a high integrity of historic context through land use policies.
Ì Modernize and create a separate Historic Preservation Ordinance that consolidates terminology for review areas to reduce confusion and also addresses topics specific to Historic Preservation such as demolition and demolition by neglect of historic resources.
Ì Collaborate with historic resource interest groups and connect with new audiences by promoting historic resources and improving cooperative relationships with historic resource interested parties.

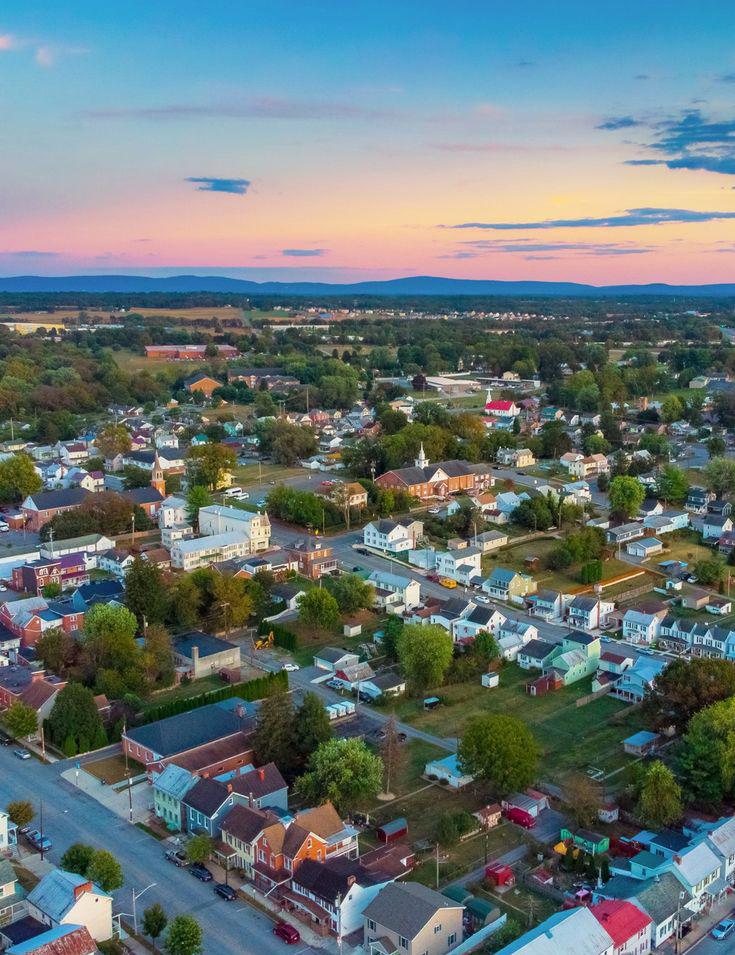

The provision of housing is a foundational element in determining the character of a community and the quality of life experienced by its residents. Historic events have left a unique range of housing types and styles across the rural and urban landscapes of Washington County. Advancements in technology and personal transportation have enabled people to live, work and obtain goods or services separated by spatial distances unimaginable to past generations. These advancements have impacted the location, quantity, and quality of new housing units constructed in the County. The spatial freedom has necessitated the rise of growth management strategies at the municipal, county and state levels in order to maintain coherence in the locally built environment. Managing the substantial costs that arise from the provision of public goods and services being dispersed throughout different areas of settlement has become a challenge at all levels of government. It is in response to such trends that Washington County has long followed the Statewide practice of encouraging development within planned growth areas to most efficiently meet the needs of local residents within the limits of fiscal constraints. In rural areas, Washington County uses tools such as its robust land preservation programs to incentivize the retention of working agricultural lands and keep a key local industry viable in the long-term. Zoning and the targeted provision of public infrastructure are key regulatory tools which help govern the rate and location of new growth.
It is the focus of this section to identify strategies that balance personal housing choice and growth management objectives in providing for the housing needs of Washington County. This chapter will identify key issues and trends related to housing using US Census data and other informational resources which help to address fundamental concerns, such as the provision of affordable, workforce and low-income housing to serve the needs of all County residents. Overall land development patterns across urban and rural areas will be examined. Finally, housing needs and projections are accounted for by employing data analysis across spatial boundaries and by examining the County’s progress on housing since its previous Comprehensive Plan.
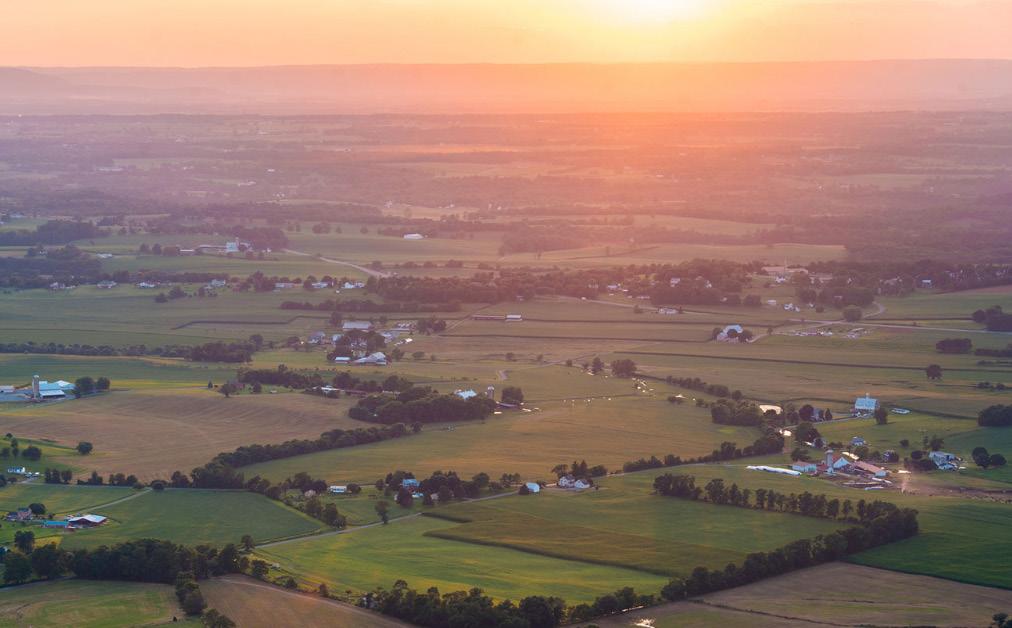

To project future housing needs it is important to first offer a snapshot of existing housing conditions in Washington County. Building upon the data outlined in the Existing Conditions chapter of this Plan, including changes in total population, household size and composition and household income, a baseline survey of the existing housing supply in Washington County is described below. These tables account for the occupancy, tenure, age and type of all housing units within the County.
Occupancy and tenure statistics provide a broad overview of the inventory of housing stock currently available to meet demand. Changes in rates of homeownership, in particular, are indicative of the ability of the local jurisdiction to meet the needs of its residential tax base and provide an affordable cost of living. They also provided a window into the overall ability of the available housing stock to meet varied lifestyle preferences and attract new residents. Trends in these two measures are summarized in the data below.
Table 6-1, below, describes occupancy and tenure measures between 2000 and 2020 in Washington County. Total housing grew by 8,649 units or 16.3% during the time period surveyed. The percent of owner-occupied housing units remained largely steady at roughly 2/3 of all housing units throughout these two decades. Total vacant housing units also increased by more than 2% by 2010 before stabilizing in the next decade. Similarly, rental vacancy rates rose by 3% from 2000 to 2010, before declining to historic rates by 2020. Homeowner vacancy rates have held steady just above 2% since 2010.

Age is another important characteristic to consider in judging the adequacy of the existing housing stock to meet present and future needs. Table 6-2 displays the age of existing housing units in Washington County by the number of units built in each decade. The table shows that a relatively similar number of dwelling units were constructed in each decade with a few exceptions. When the age of the housing stock is further broken down according to tenure (owner v. renter occupied), the percentages built by decade generally varied by only 1-2% or less. Therefore, findings from the overall housing stock age include:
• The largest number of units built in a single decade occurred between 2000-2009. This corresponds with the building boom which occurred during much of the period. The second largest number of units was built during the 1990s, another period of national economic expansion, further reinforcing how local housing trends mirror the larger economy.
• A considerable number of housing units remain in use that were built prior to 1940. This figure demonstrates the County’s extensive history of modern settlement. The smallest number of units built in a single decade occurred during the wartime period of 1940-1949.
There are some caveats that should be noted to the data presented in Table 7-2. First, there are anomalies in the data in which the number of housing units actually increase in the next Census survey. For example, the number of housing units built between 1950 to 1959 rose from 6,487 in 2000 to 7,393 in 2010. These can likely be explained by the changing survey methods conducted by U.S. Census Bureau between 2000 and 2010 with the introduction of the American Community Survey, which now provides continuous estimates of social, economic, housing, and demographic data every year. Therefore, there is variability in the data between decades even when using the same tables. As a result, the loss or gain of structures within ten-year survey periods is likely as attributable to data collection methods as it is to the issuance of demolition permits.
It should also be noted that the age of a dwelling is not always the best indicator of its condition, as maintenance and other factors can keep older structures viable for a considerable amount of time. However, another common Census measure used to judge housing conditionsOccupied Housing Units Lacking Complete Plumbing or Kitchen Facilities - did not show significant change during the twenty year period surveyed, ranging between a few tenths of a percent to below 1% throughout that time.
Another key indicator of housing diversity and affordability is the number of units in a structure. Having a diverse inventory of housing units serves varied lifestyle preferences and income levels in a community. Chart 6-1, below, again demonstrates the predominance of detached single-family homes among the County’s housing stock, which consistently hovered around 60% of all housing units from 2000 to 2020.
Other notable trends that can be observed in Chart 6-1 include an increase in the number of single-family attached dwelling units, and a decline in the percentage of nearly all other housing unit types. Single-family attached units (i.e. - townhomes) have become an increasingly attractive and affordable housing option for many individuals and families in Washington County, now making up more than 15% of all housing units. Conversely, nearly all other unit types either remained flat or declined, both in the number of units and as a percentage of total units. In particular, housing types containing between 2-4 units saw notable declines in number and as a percent of total housing stock during the last twenty years.
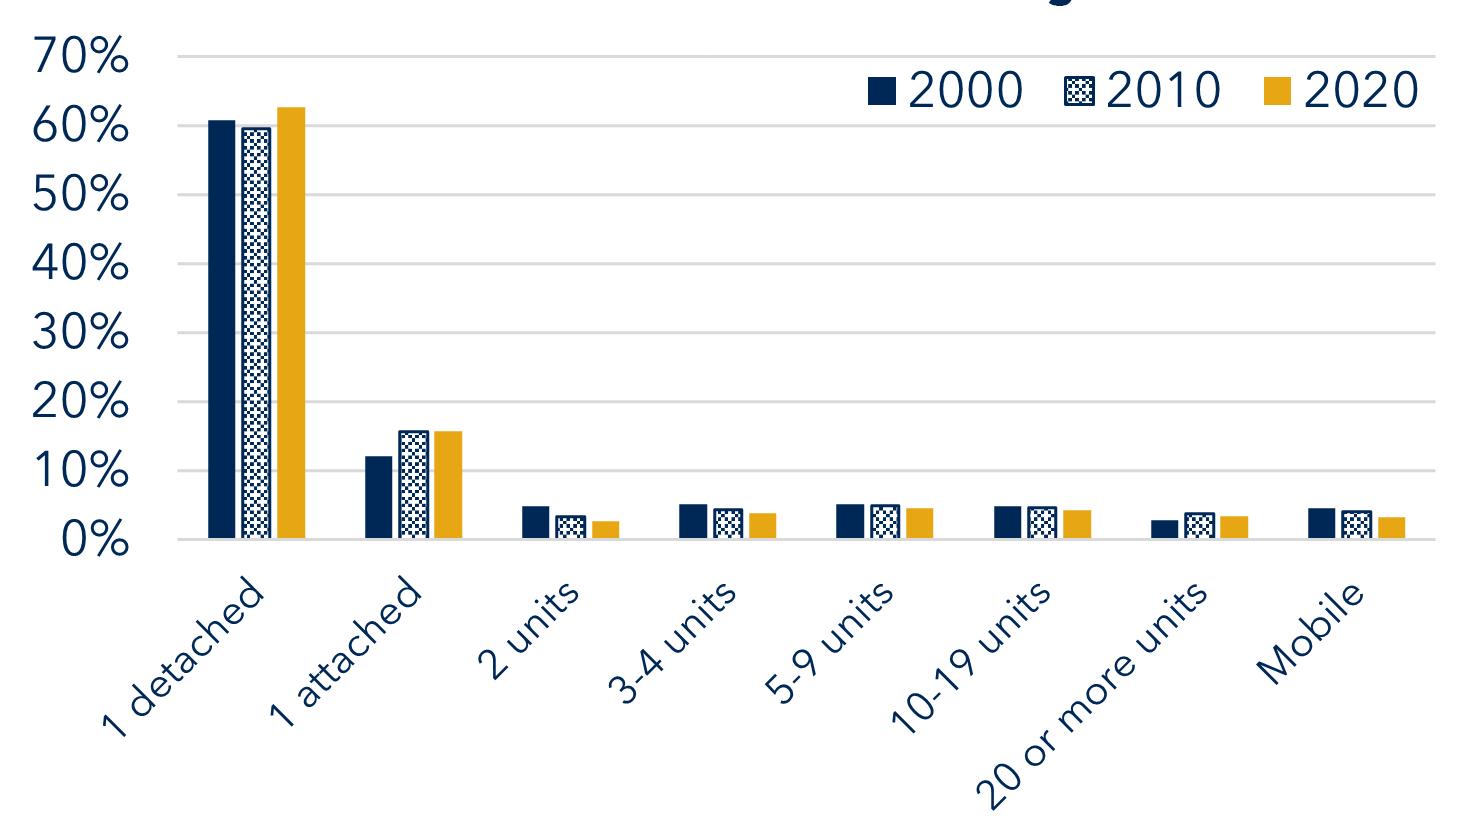
Housing costs are expensive throughout the State of Maryland. A recently published report by the National Low Income Housing Coalition ranked Maryland as the 9th most expensive in the U.S. for rental housing costs for households. According to the report, a full-time worker (working 40 hours per week, 52 weeks per year) would need to earn $28.93 per hour ($60,183 annually) in order to afford Fair Market Rent for a two-bedroom rental home, without paying more than 30% of income towards housing costs. Fair Market Rent (FMR), which provides an estimate (determined by HUD) of the cost of rent and utilities for a modestly priced rental unit, is $1,510 in Maryland.
In Washington County, rental housing costs are less severe, but still concerning for working class households. Here, a household must earn $18.69 per hour, or $38,880 per year to avoid spending more than 30% of their income on rental housing. The report estimates the hourly mean renter wage in Washington County is $13.78 per hour. Two-bedroom FMR was $972 per month at the time of the report.1 Public comments collected during outreach meetings for the update of this Plan also expressed concern that there was a widening gap in the average sale price of homes in Washington County relative to median household incomes.
Statistics such as these make clear that, although Washington County is comparatively less expensive than many other counties in Maryland, affordable housing remains an essential consideration in planning for the County’s present and long-term needs.
State legislative action targeting the provision of affordable housing has grown over time in response to the recognition of escalating housing costs throughout Maryland. As noted in Chapter 2, Maryland has incrementally increased requirements for affordable housing planning by local jurisdictions. These legislative efforts include:
Established a Work Force Housing Grant Program, which can be used by local jurisdictions that have a Work Force Housing element in its comprehensive plan.
Any new Plan adopted after June 1, 2020 must include a Housing Element and address the need for workforce and low-income housing within its boundaries.
Requires all housing elements for municipalities and non-charter counties to “affirmatively further fair housing ” as of January 1, 2023. HB 90 defines affirmatively furthering fair housing as, “taking meaningful actions… to:
• Overcome patterns of segregation;
• Foster inclusive communities free from barriers that restrict access to housing and opportunity based on protected characteristics;
• Address significant disparities in housing needs and access to opportunity;
• Replace segregated living patterns with truly integrated and balanced living patterns; and
• Foster and maintain compliance with civil rights and fair housing laws.”
The Annotated Code of Maryland provides definitions for both affordable and workforce housing within the Housing and Community Development Article 4-1801 under the Workforce Housing Grant Program.
Affordable means that “housing costs do not exceed 30% of household income”
Workforce housing is defined as:
• “rental housing that is affordable for a household with an aggregate annual income between 50% and 100% of the area median income; or”
• Homeownership housing that:
“Is affordable to a household with an aggregate annual income between 60% and 120% of the area median income; or”
In target areas that are recognized by the Secretary for purposes of administering the Maryland Mortgage Program, is affordable to a household with an aggregate annual income between 60% and 150% of the area median income.
Using the above definitions as a guide and pulling from Census data covering a twenty-year period, a profile of housing affordability measures is offered in the section that follows below. These measures include monthly household spending on housing, home values, and median rent.
Chart 6-2 offers a comparison of the percentage of households devoting 30% or more of monthly housing costs in Washington County versus the State of Maryland overall between 2000 and 2020. The percentages are shown for both households with a mortgage and those who are renting.
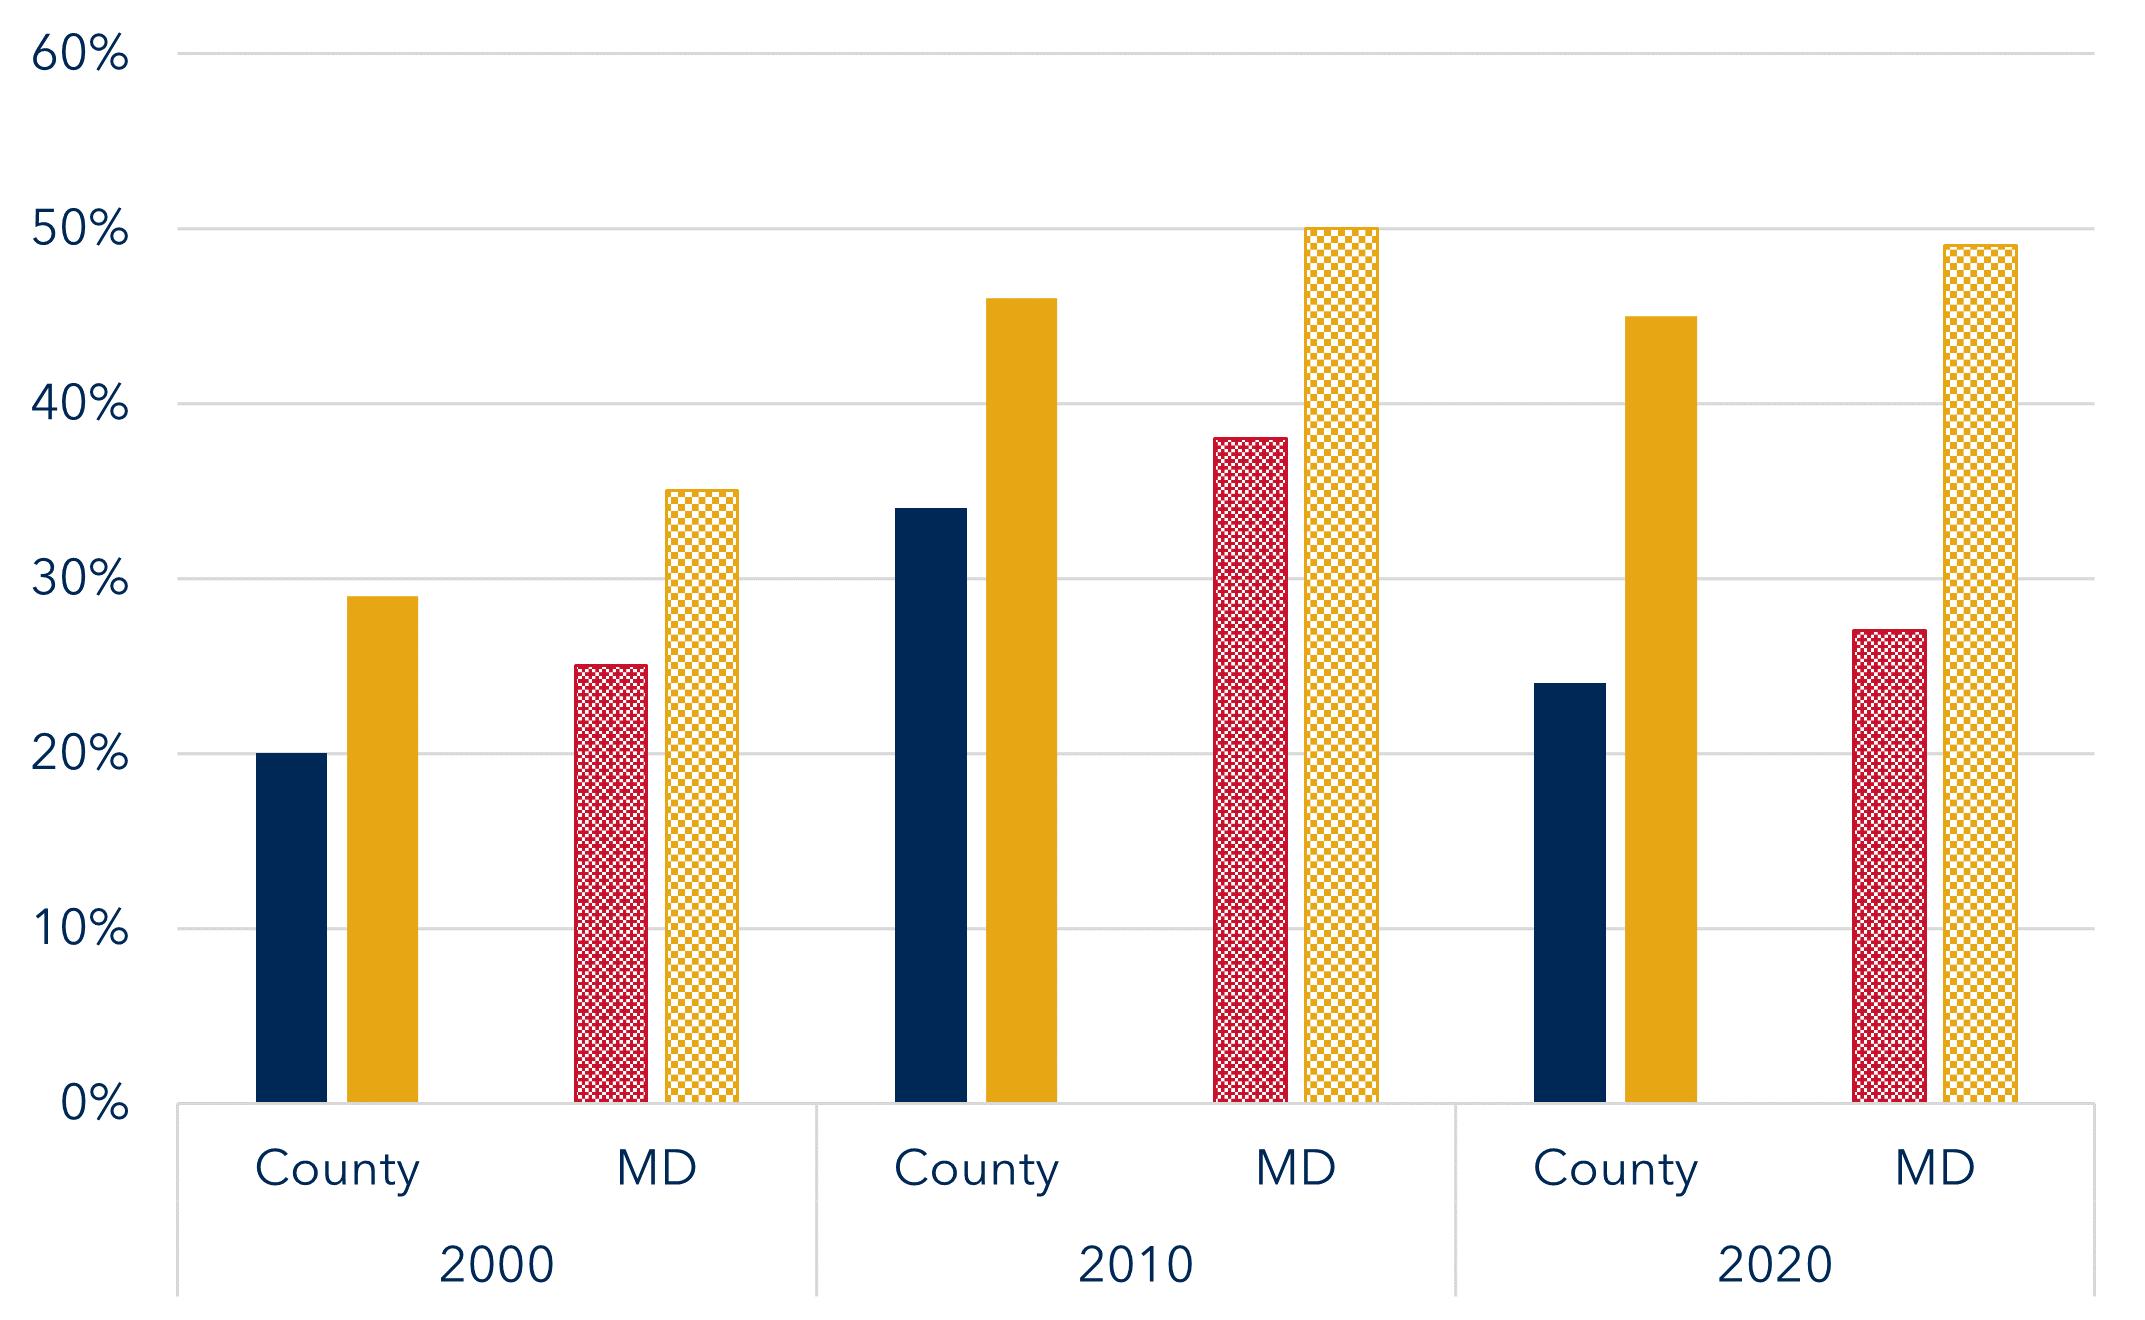
Immediately evident in this chart is the relative affordability of housing in Washington County in comparison to the state overall. 10% - 20% fewer total households in the County spent less than 30% of their monthly household income on housing in comparison to the State as a whole from 2000-2020.
The chart also indicates the differing fates of owners and renters over this period. Those owning a property have fared far better than those renting since 2010. Between 2000 and 2010, the percentage of both owners and renters spending more than 30% of their monthly household income on housing costs increased by similar percentages locally and across Maryland. After 2010 however, the percentage of owners facing this housing cost burden decreased by at least 10% in the County and State, while the percentage of renters exceeding the 30% standard remained essentially unchanged. Nearly half of all renting households spend more than 30% of their monthly household income on housing both at the County and State levels.
Area median income (AMI) is a key metric in affordable housing. Area median income is defined as the midpoint of a specific area’s income distribution and is calculated on an annual basis by the Department of Housing and Urban Development (HUD). HUD refers to the figure as MFI, or median family income, and bases its calculations on a four-person household.
This metric is important because many of HUD’s housing programs are based on the value for a metropolitan statistical area or MSA, impacting renter eligibility determinations among other uses. To be eligible for a Housing Choice Voucher, for example, household income must be at or below 50% of the AMI. Because the HUD figure is tied to a four-person household, these values are not absolute and can be adjusted depending on the size of a household. For an affordable housing community which reserves units for households earning 50% of AMI, a twoperson household would have a lower threshold than a five-person household.
Information on household income was presented in Chapter 4 and is revisited here for the purposes of housing costs. Table 6-3, below, looks at the percentage of County households earning between 0% and 120% of the AMI in 2020, in accordance with definitions for Affordable and Workforce Housing at the State and Federal levels. Four categories within this range are noted in the table: Extremely Low Income (0% to approximately 30% of AMI), Very Low Income (30% - 50% of AMI), Low Income (50% to 80% of AMI), Moderate Income (80% to 120%). In 2020, HUD put the MFI in Washington County at $79,800.1 Therefore, these limits were as follows in 2020:
Census Data for Household Income, unfortunately, is not reported according to these exact income ranges however, so the following ranges are substituted for the categories noted above to provide a further picture of housing costs faced by Washington County Households:

As indicated in the table above, 40.4% of all households in Washington County would fall within the modified Low Income or Extremely Low Income parameters defined in the prior paragraph. Therefore, many of these households would potentially qualify for housing assistance due to the cost burden faced to meet their housing needs.
Chart 6-3, below, provides a look at owner-occupied home values between 2000 and 2020 in Washington County. As is apparent from the chart, home values have increased dramatically during the last 20 years locally, mirroring the national trend. Median home values in Washington County have essentially doubled during this period, rising from $115,000 in 2000 to $221,000 as of the 2020 Census. Correspondingly, the chart below notes that the greatest percentage of owner-occupied homes surveyed in Washington County are now valued at $200,000 to $299,999. In 2000, nearly 40% of all homes were valued at under $150,000.
Median rent has shown a similar pattern to home values during this same time period in Washington County, as displayed in Chart 6-4 below. According to Census Data, median rent has grown from $482 in 2000 to $931 in 2020, nearly doubling in the process. This increase is in line with what has happened in Maryland overall, where median rent has grown from $689 in 2000 to $1,415 in 2020.

Washington County’s Adequate Public Facilities Ordinance (APFO) ensures that there is adequate infrastructure to serve new development. The APFO requires that new development mitigate impacts upon existing infrastructure concurrently when the impact occurs. The APFO’s concurrency requirement applies to impacts upon roads, schools, water and sewer systems, and in some areas, fire protection systems.
In the case of school capacity, when the effect of a proposed residential development causes existing enrollment to exceed State Rated Capacity (SRC), the developer may choose to pay the Alternate Mitigation Contribution (AMC) to offset the impact on school capacity, thereby removing a significant obstacle to the project’s approval by the County. The AMC remains a mitigation option unless the impacted school district exceeds 120% of SRC.
In cases where one school in an attendance zone is over capacity but another school adjoining district at the same grade level is at least 20% under the SRC, the Board of Education (BOE) may determine that a redistricting is warranted to meet adequacy standards, if requested, by the applicant instead of paying the AMC.
If neither option is successfully pursued, and the developer cannot work out an alternative arrangement with the Board of Washington County Commissioners (i.e. - dedicating a site for a new school within the development) the final subdivision or site plan shall be denied, effectively putting a moratorium on residential development for major subdivisions in that district until the school capacity issues are resolved.
In reality, proactive long term facility planning by the Board of Education (BOE) (in consultation with the County) and the ability of developers to pay the AMC have effectively prevented a delay in issuing approvals for residential plans and building permits because of capacity issues in County schools. Elementary school attendance zone realignments, the creation of portable classrooms and school consolidation at the elementary school level have also helped further alleviate potential roadblocks, as each have been successfully pursued by the BOE during the last ten to twenty years.
Nevertheless, when significant sustained periods of residential development occur (such as in the early 2000s in Washington County) school capacity can quickly become an issue. In that type of economic climate, development costs (such as the AMC) to bring existing infrastructure up to adequate standards may be significant and be passed on to individual homebuyers as developers seek to gain a return on their significant financial investments in the project. Thus, it is helpful for projecting impacts on housing costs to take at least a snapshot of current school capacity in Washington County Public Schools (WCPS) as they are directly impacted by residential growth.
According to the BOE’s June 2022 Enrollment Report , 16 of 25 elementary schools exceeded the Local Rated Capacity (LRC) used by the APFO to determine adequacy for that grade level. Seven of those sixteen schools exceeded the LRC which also surpassed the SRC. At the middle school level, 1 of 8 schools currently exceed the SRC, which is the capacity standard for middle and high schools. Only 1 of 7 high schools currently exceed the SRC, however both South and North Hagerstown High Schools are projected to be at or above SRC in the next 5 years, according to the BOE’s 2021 Educational Facilities Master Plan (EFMP).
The overcapacity concern at the elementary level of WCPS is tempered somewhat by the recent economic downturn that affected the County in the last several years, due both to the recession and COVID-19 Pandemic. Recent years have seen significantly fewer housing starts than during the housing boom of the early to mid-2000s. Slowed residential construction in tandem with a recent decline in birthrates has therefore resulted in a static or declining elementary school enrollment for the last several years.
This trend at the elementary school level has been counterbalanced somewhat by the creation of the pre-K program at Funkstown Elementary, which has seen significant enrollment as it does not have an attendance zone that limits enrollment to accepting students from specific areas. Accordingly, elementary enrollment growth is expected to remain largely static for the next 5 years. Capacity impacts on the middle and high school levels should then be manageable for the next 5-10 years and can likely be mitigated through alternative means rather than a comprehensive new high school in the immediate term.
Thus, the enrollment conditions described above, in tandem with recent facility improvements made system-wide by WCPS, paints a moderate picture of the effect of APFO fees on housing costs in Washington County in the next 5-10 years.

A variety of entities representing the non-profit, public and private sectors, work to address housing related issues in Washington County. A non-exhaustive list of housing providers, housing support service organizations and housing improvement incentives is included in the Appendix.
Residential and commercial building activity can be analyzed using the County’s online development tracking system, Accela Automation. This program allows staff to input and monitor data that can be used to evaluate land development patterns in the County. This program (and its predecessor Permits Plus) has been used to track data since August, 1994. Trends can be identified from this data that offer insight into where County housing policies and development regulations may be able to help support the stability and affordability of the local housing market.
Chart 6-5 lists land development data for approved new lot subdivisions, site plans and combined preliminary plat-site plans (PSPs) between 2000 and 2019, in five-year intervals. The years since 2019 have been omitted from the chart to keep the five-year comparisons intact and because of effects of the COVID-19 Pandemic skewing data on land development activity in numerous respects.
The primary trend made evident by Chart 7-5 is the steady decline in building activity from the beginning to the end of the survey period. The local housing market boom of the early to mid2000s began tapering off by the latter part of that decade, particularly in the amount of new subdivisions. Subdivisions dropped by 1/3 during the 2005-2009 period in comparison to the 2000-2004 time frame (from 655 to 430).
Approved site plans also dropped off notably after 2005, but less steeply than subdivisions. There were 17% fewer approved site plans during the second half of the 2000s (356 to 294). Site plans in Washington County are primarily submitted for non-residential development projects. Construction of single- family, two-family or semi-detached housing units don’t require a site plan. Thus, the Chart demonstrates a substantial decline in both residential and non-residential building between 2000 and 2019.
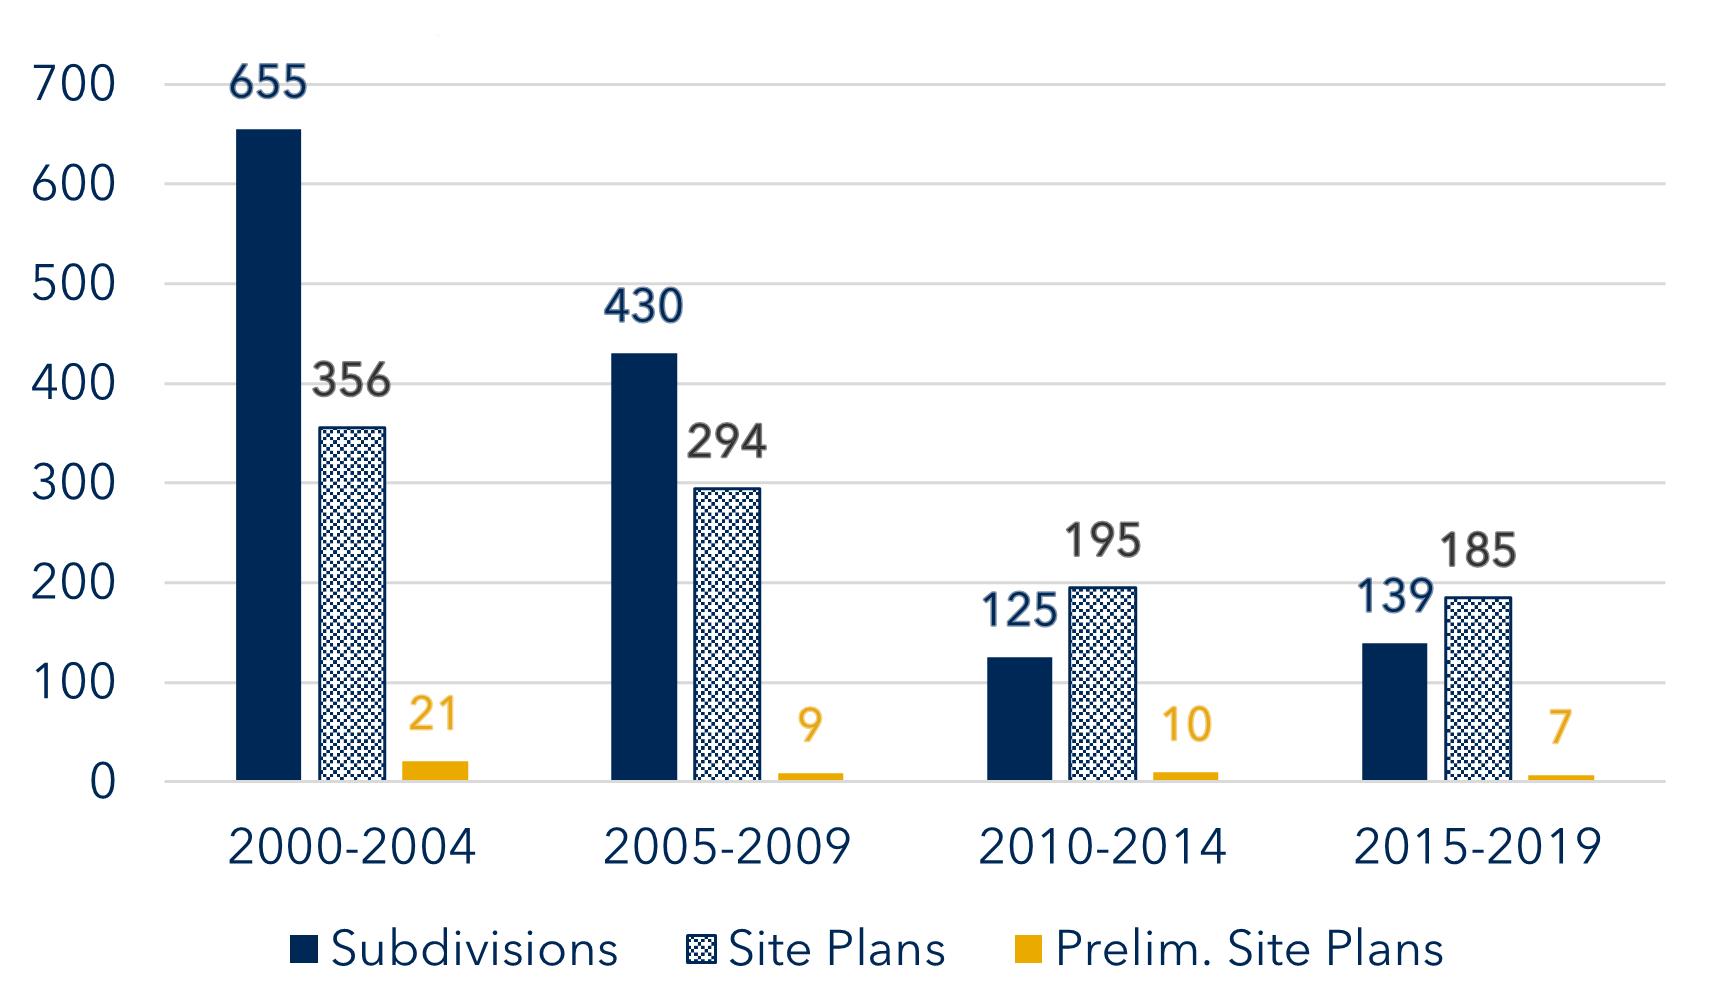
Table 6-4 displays approved residential permits between 2000 and 2019 according to the type of dwelling unit. This table serves to reinforce not only the trends identified in Chart 6-5, but also the Census data related to dwelling unit types in Chart 6-1.
Regarding dwelling unit types, Table 6-4 clearly demonstrates the predominance of single family housing in the building permit activity during the last twenty years. Single-family detached dwellings comprised 64.6% of the 7,515 total residential building permits collected by the County from 2000 to 2019. 53% (2,587 of 4,857) of these single family building permits were approved in just a five-year period from 2000-2004.
In addition, residential permit activity for all dwelling types declined heavily after 2009. Markets for townhomes and two-family dwellings appear to have rebounded somewhat after steep declines in building permits for those unit types during the early 2010s. Permits issued for apartments and mobile homes, which often provide affordable housing options, all but ceased by 2010 but have seen a slight uptick since 2015. All the condominium permits issued during this period, from 2005 to 2009, were associated with a single phase of a planned unit development, Rosewood Village.
Clear trends in housing activity are identified in the charts above during the first two decades of the 21st Century. It is important to have context, however, to understand why the local housing market has trended in this direction for the last twenty years. Both national economic trends and local changes in land use policy and regulation have played significant roles in creating the present housing market in Washington County.
In terms of local land use policy changes, Washington County undertook a comprehensive rezoning of its Rural Areas in 2005 followed by Urban and Town Growth Areas in 2012, and 2015 respectively. These comprehensive rezonings were recommended within the County’s 2002 Comprehensive Plan. The intent of these regulatory measures was, in simple terms, to more directly influence the location and pace of growth in Washington County.
Washington County has long pursued a strategy of seeking to attract development where it is desirable (in planned growth areas where infrastructure needed to serve development already exists), while limiting its spillover effects in areas where it is less desired (in rural areas where agriculture is the primary land use and sensitive environmental resources are found in greater abundance). The mechanism for directing growth in this manner was a significant reduction in the permitted density of residential development in the Rural Area in 2005, followed by corresponding changes to the Zoning Ordinance in 2012 and 2015 which allowed for higher density development in the Urban and Town Growth Areas that surround the larger established communities in Washington County. As the Zoning Ordinance had not been comprehensively updated since its inception in 1973, and a nationwide housing boom was underway in the early to mid-2000s, these measures sought to address rapid land use changes that threatened to fundamentally alter the County’s overall character and bring incompatible adjacent land uses into greater conflict.
While the County pursued these needed growth management strategies as directed by its adopted 2002 Comprehensive Plan, the housing boom noted above was abruptly halted due to an economic recession that affected the global economy. As a result, new housing supply and demand both declined as mortgage lending was tightened and profits for large scale residential housing were less certain than in previous years. Finally, further uncertainty has been brought to the housing market as a result of the COVID-19 Pandemic, which continues to affect numerous aspects of the housing market. The unforeseen circumstances of these combined events contributed strongly to the overall decline in residential land development and permit activity during the last 20 years highlighted in the preceding data.
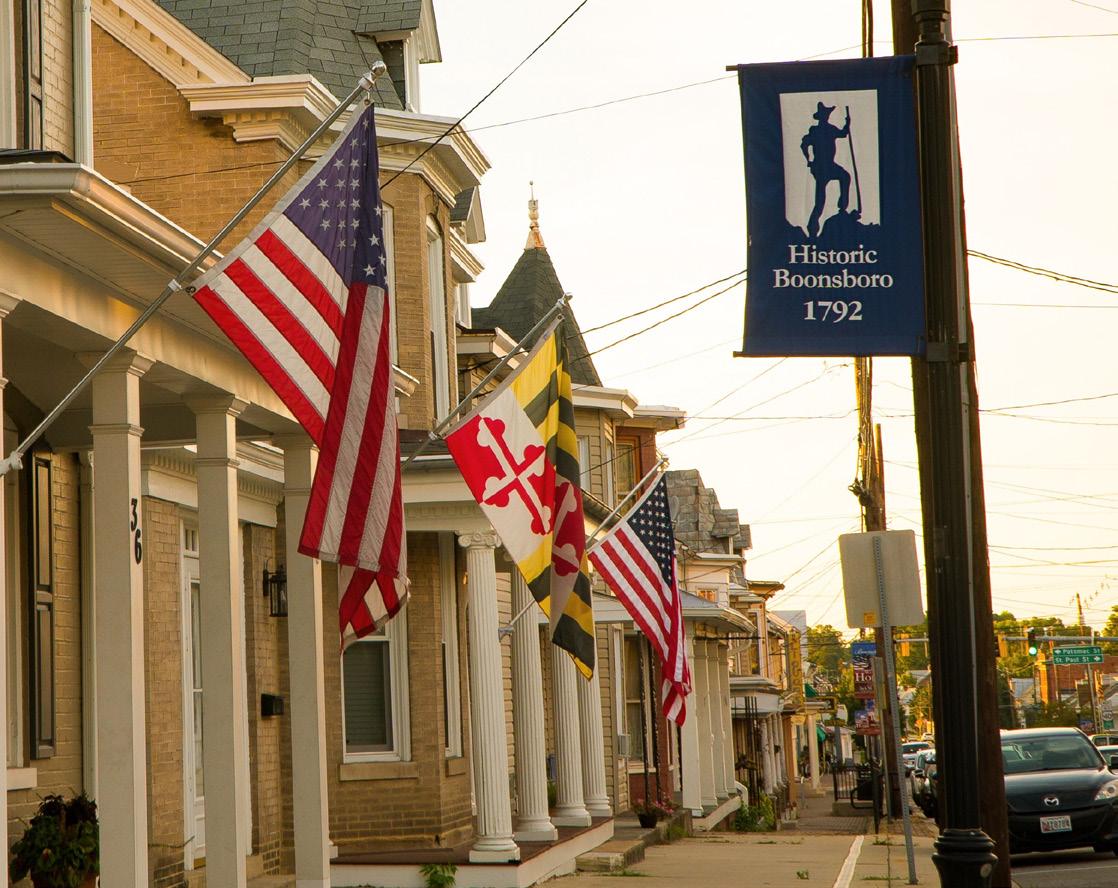
In addition to the type of housing being constructed, the location where housing is being built plays a significant role in efficient patterns of land use. As touched on in Chapter 2, Washington County has long practiced a strategy of utilizing a variety of regulatory tools to direct the bulk of development to planned growth centers and away from rural areas. This is done to avoid conflicts from incompatible land uses, maximize the efficient allocation of public infrastructure and services, and to protect sensitive natural resources. This approach aligns well with Maryland’s Smart Growth approach to growth management, which seeks to accomplish similar objectives statewide.
To encourage and measure whether overarching Smart Growth objectives were being met, tools such as Priority Funding Areas (PFA) were developed. Priority Funding Areas, also defined in Chapter 2, are existing communities and places designated by local governments that indicate where they want State investment to support future growth. These areas often overlap with locally designated Growth Areas. Their ability to capture the bulk of residential and non-residential development is a key indicator of the overall effectiveness of local land use planning and regulation in terms of its ability to effectively steer development to locations where growth is desired. Development inside and outside of PFAs is therefore a primary metric in annual reporting to the Maryland Department of Planning (MDP). The County’s Priority Funding Areas are displayed on Map 6-1, below.

In the section that follows, County and State levels of development occurring inside and outside of PFAs is presented through a series of charts and tables to analyze the effectiveness of existing regulations to promote desired land development patterns in Washington County.
Looking first at County level PFA data pulled from Accela Automation, Table 6-5 includes all subdivisions and new residential permits approved between August 8, 1994 (when modern development tracking began in the County) and December 31, 2019. This data does not include those collected by Washington County on behalf of the incorporated towns within its jurisdictions, as nearly all the acreage within the towns fall inside of a designated PFA. As noted in previous sections of this document, PFAs were not adopted into law until 1997 so some of the very early data has been extrapolated to be included in the subsequently defined areas.
The final column in the table refers to Comment Areas. Comment Areas are places where PFA boundaries designated by the local jurisdiction are disputed by MDP because they may not have met all criteria necessary to qualify as being part of the PFA. Most but not all Comment Areas have been subsequently resolved and PFA boundary lines have been largely agreed upon since 2012.
Since 1994, 28.2% of all subdivisions in the County occurred inside a PFA, while 72% occurred outside a PFA. A number of factors help explain this seemingly negative development trend. First, there is far more land available to further subdivide outside a PFA in comparison to that which remains inside a PFA. In addition, development outside of a PFA consists of fewer new subdivision lots than those within a PFA. Therefore, while the number of subdivisions may be high outside of PFAs, the number of new lots is typically lower than those created inside a PFA.
Second, regulatory changes at the State and local level to limit development outside of PFAs occurred during the survey period, not before. The State “Septic Bill” and County comprehensive rezonings, for example, only took effect within the last ten to fifteen years. Therefore, the impacts to development patterns as a result of these regulatory changes are still playing out presently. Indeed, recent Annual Reports submitted to MDP demonstrate that from 2016-2021, the share of residential growth inside a PFA has been between 74% to 94%. So, it appears that over time, these regulatory changes have had (and should continue to have) the intended effect of directing development into designated growth areas and PFAs.
Since 1994, 53.8% of all new residential permits have been associated with developments inside a PFA, while 46.5% were for projects outside of a PFA. Besides the factors previously cited above, the higher percentage of permits occurring inside of PFA’s in comparison to subdivisions may also simply be due to the ability of development to access existing public infrastructure needed to support residential growth more readily in the more developed areas. This infrastructure is not present to nearly the same extent outside of PFAs, thereby limiting potential development in rural areas. The intentional limitation of extending public infrastructure and services to such areas is a direct result of local land use policies.
County GIS Staff have developed additional mapping resources that enable us to more clearly visualize the growth of residential development in the County since 1994. The Planning and Zoning Department hosts and updates a Development Tracker webmap and Storymap on the County’s central website. These public facing tools utilize subdivision data collected within Accela Automation to provide an interactive look at where both residential and commercial activity is taking place.
Map 6-2 on the following page, depicts total residential development (approved and under review) from 1994-2023. Non-residential development has been excluded from the map due to this chapter’s focus on housing. The map makes clear that the vast majority of major subdivisions (greater than 7 lots) for residential development in Washington County have occurred in the designated Urban Growth Area of Washington County which surrounds the incorporated municipalities of Hagerstown, Williamsport and Funkstown. The largest dots represent subdivisions of 125 lots or greater, while the smallest gold dots represent minor subdivisions of less than seven lots.
The map shows that the most intense residential development is primarily occurring in locations such as:
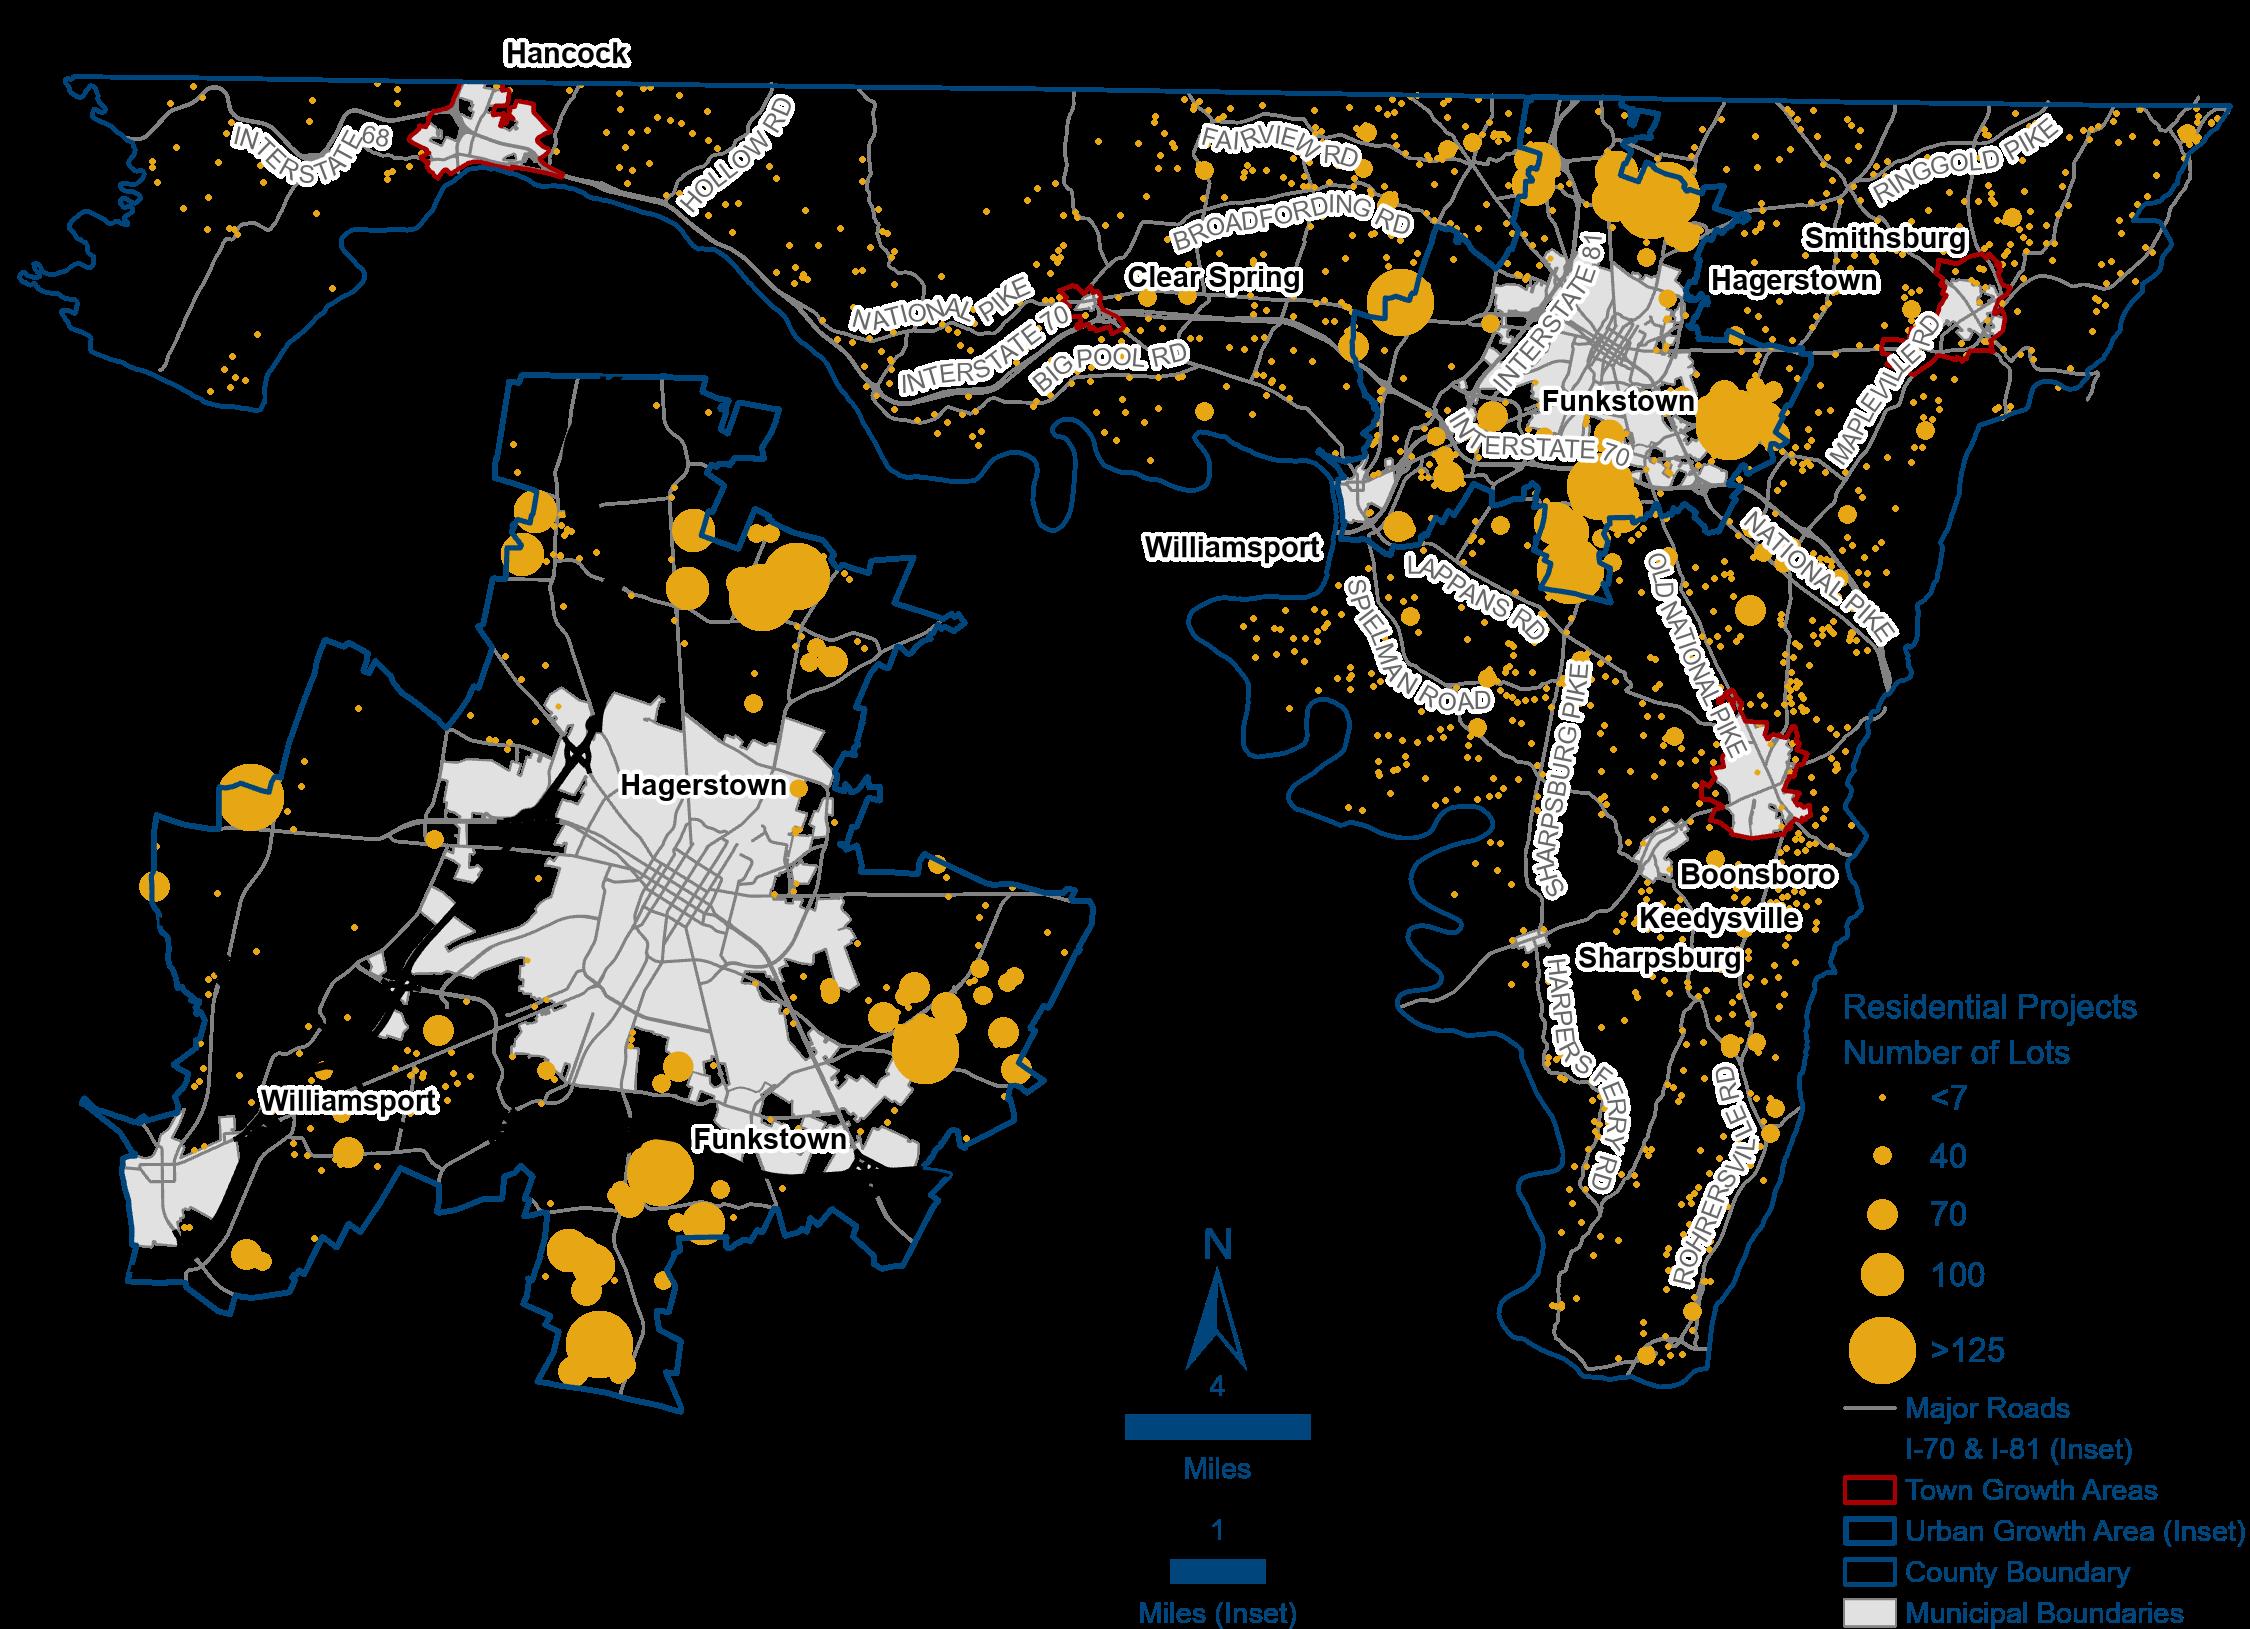
• Near the intersection of I-70 & I-81 between Halfway and Williamsport;
• Along Sharpsburg Pike immediately south of the I-81 interchange;
• Bordering Robinwood Drive in the vicinity of Hagerstown Community College and Meritus Medical Center;
• In the immediate vicinity of Longmeadow Road and Maugans Avenue near the I-81 interchange or near the intersection of these two roads and other major local collector roads such as Pennsylvania Avenue, Marsh Pike and Leitersburg Pike.
As most of these large residential developments sit in proximity to employment centers or major transportation facilities, this pattern of residential development appears positioned to positively catalyze concentrated economic development in the Urban Growth Area over time.
Additional data collected by MDP offer other ways to look at the amount of residential development inside and outside of Washington County’s PFAs over an even longer time horizon. Although PFAs were not formalized as a concept in Maryland until legislation was passed in 1997, MDP has overlain the PFA boundaries established by each jurisdiction onto past recorded development to establish trends in how much land has been improved for residential development inside and outside of PFA boundaries between 1940-2012. These measures include the number and acreage (total and average per parcel) of improved singlefamily residential parcels inside and outside Washington County’s PFAs.
As previously detailed, County land use regulations have changed to a significant degree since 2012. Comprehensive Rezonings of the Rural, Urban and Town Growth Areas took place in 2005, 2012, and 2015, respectively. Therefore, local land use regulations pushing residential development more forcefully to planned growth areas would not be fully captured by the 2012 end date of MDP’s data. The charts that follow do nevertheless show the cumulative effects of modern land use regulation to direct growth to desired locations.

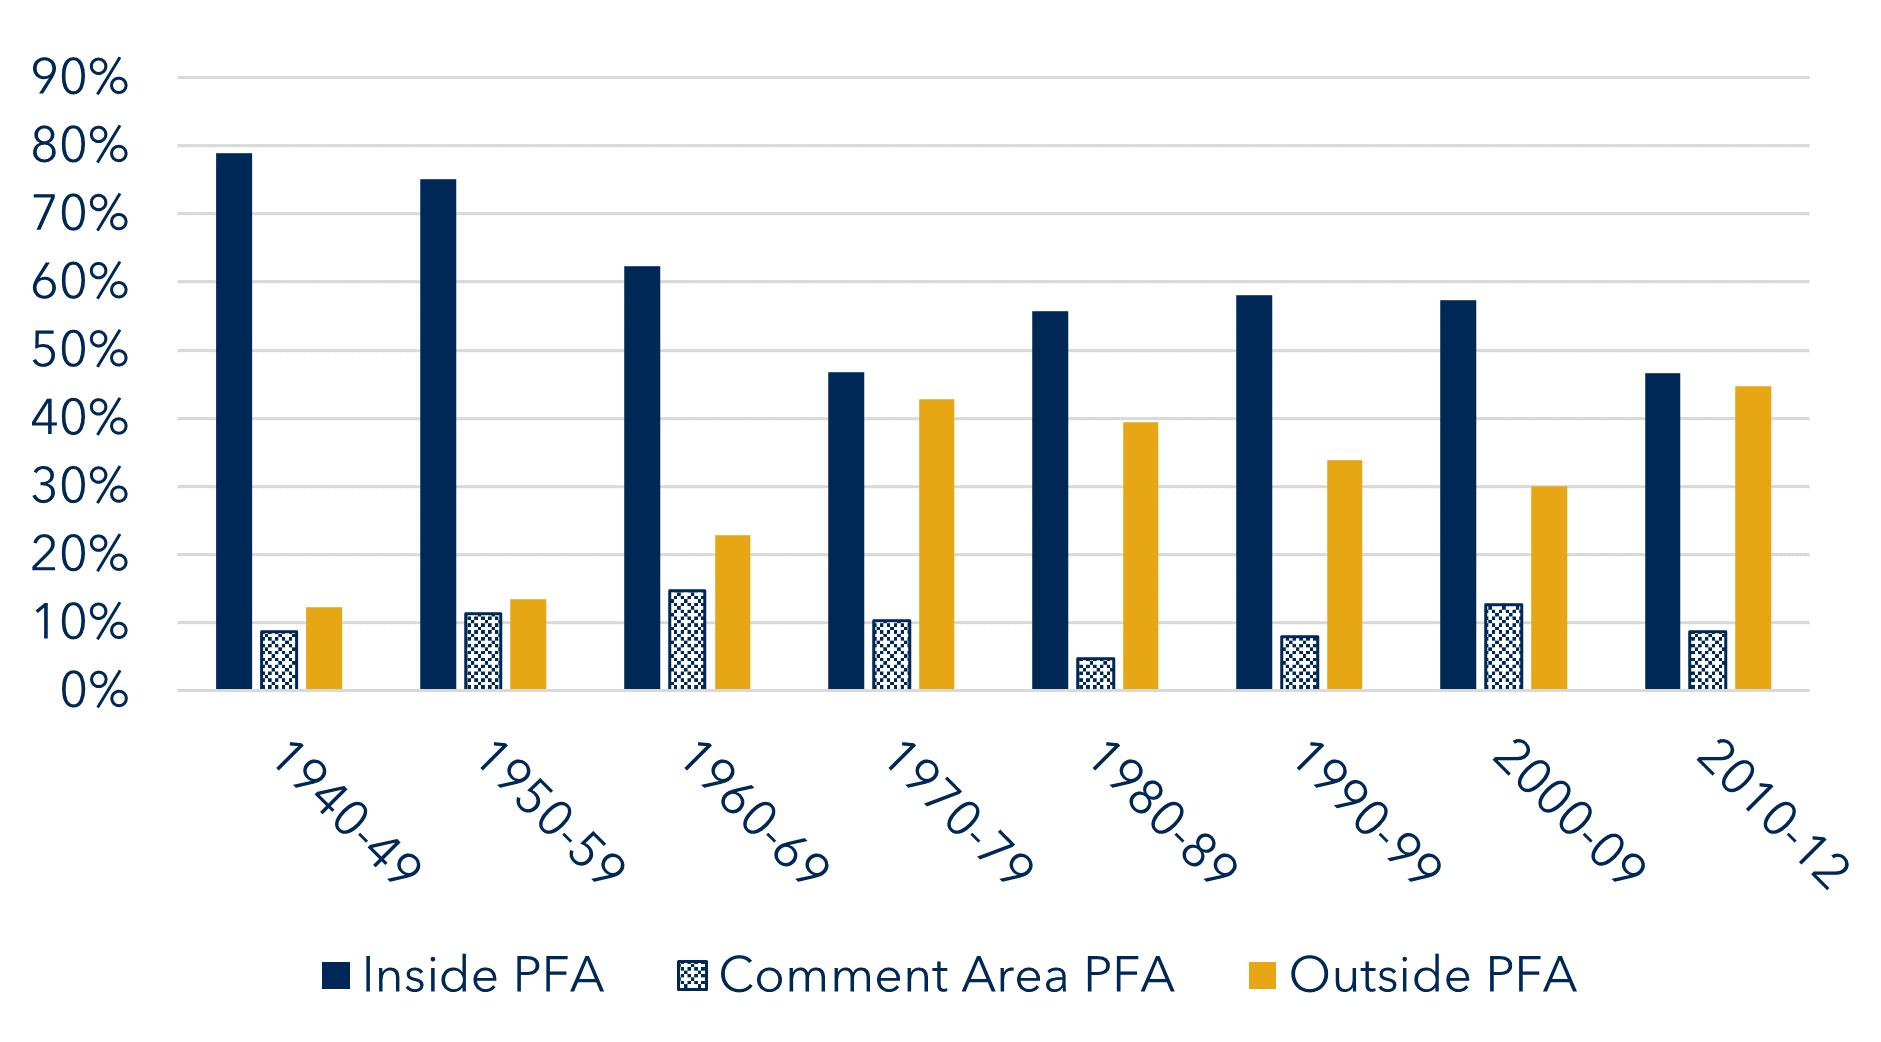
Chart 6-6, below, shows the total percentage of single-family residential (SFR) parcels developed inside and outside of Washington County’s PFAs, by decade, between 1940 and 2012. As one might expect, the highest percentage of SFR parcel development inside of modern PFA boundaries was reached between 1940 to 1959 at 75% to 78%. At this time, advances in transportation and road building technology had not yet enabled the widespread disbursement of residential development across the entire County. As a result, most building occurred in existing urbanized communities and not in the rural area.
Conversely, the percentage of SFR parcel development inside a County PFA dipped to its lowest level between 1970 and 1979. By that time, interstate highway systems had been completed through Washington County and automobile ownership was widespread, enabling the rise of longer distance commuting to job centers.
For the most part, the percentage split between SFR parcels developed inside and outside of a PFA in Washington County has stabilized during the last thirty years of the period surveyed. The County reached an equilibrium at roughly 55% to 58% inside and 30% to 39% outside, according to the chart above.
In total, between 1940 and 2012, 60.3 % of all SFR parcels in the County were developed in a PFA, 29.3% outside, and 10.4% in Comment Areas according to MDP. Statewide patterns for SFR development inside of PFAs was approximately 10% higher, per decade, in Maryland overall versus in Washington County between 1940 and 2012.1
Chart 6-7, below, shows the percent of acreage developed inside and outside of the PFAs in Washington County between 1940 to 2012. This chart demonstrates that after 1960 to 1969, the vast majority of SFR acreage development occurred outside of a PFA. As the County’s population continued to grow in the post-war period, available land in the urbanized portions of the County started to become scarce. As a result, developers began looking to the County’s ample rural lands to meet demand. Paired with the advancements in transportation noted above, a trend was firmly established that resulted in approximately 75% to 80% of parcel acreage being developed outside of a PFA in the last 40 years.
In total, between 1940 and 2012, 25.5% of all SFR acres in the County were developed in a PFA, 69.5% outside, and 5% in Comment Areas.1 The statewide cumulative percent of SFR acres outside of PFAs displayed very similar trends to those noted in Washington County in the chart above and stood at approximately 74% in 2012, according to MDP.2

Chart 6-8, below, displays the trend in average acres per parcel for SFR development inside and outside Washington County’s PFAs between 1940 and 2012. Average SFR parcel acreage inside a PFA peaked between 1970 and 1979 at almost .6 acres, while the highest average acreage outside the PFA was reached during the 1980s at 2.92 acres. Average SFR acres developed inside and outside of the PFA have both declined continually since the 1980s as much of the available land with development potential has already been subdivided to the extent permitted by current State and local land use regulations.

Overall PFA Conclusions
The County’s relatively low population density and low cost of living, in comparison to the more heavily developed portions of Maryland, likely had a strong influence throughout much of the 20th Century in encouraging less concentrated development. These factors, in combination with transportation improvements cited above, made the settlement of rural lands highly attractive in Washington County to a degree which likely exceeded Maryland’s more settled regions to the east, where undeveloped land was in more limited supply and therefore more expensive to obtain and develop. Only in the aftermath of growth management measures at the State and local levels was this trend beginning to reverse course by the end of the last century. Recent data reported to MDP suggests the County has begun transitioning to a more consistently concentrated development pattern in the 21st Century.
To achieve desired land use patterns, Washington County utilizes a variety of regulatory tools. The most impactful of these regulatory and enforcement mechanisms are briefly discussed below.
Zoning is the primary regulatory device which affects the amount, location, character and density of buildable land available for development. Aside from the effects of recent Comprehensive Rezoning of the County’s Urban, Rural and Town Growth Areas on permitted densities in various zoning districts, existing language within the Zoning Ordinance positively supports affordable housing in other ways such as:
• Individual zoning districts enable increased numbers of buildable lots or variations in minimum lot sizes when certain criteria are met. For example, the Historic Preservation District Overlay allows approved properties to create two additional lots in addition to the lot surrounding the historic structure.
• Minimum lot sizes are reduced for properties connecting to public water and sewer systems in all applicable districts, as the absence of an on-site septic system allows for increased building density.
• Mixed use development is permitted in the Rural Village, Special Economic Development and Mixed Use Zoning Districts.
• The conversion of a building, existing at the time of the Zoning Ordinance’s enactment to accommodate two or more families, is permitted in many residential districts.
• Clustering provisions in many rural and residential districts enable greater amounts of land to be devoted to open space and recreation areas that improve the overall quality of life in many residential developments.
Short term rentals are an increasingly visible issue in land use planning, as they present a double-edged sword for local jurisdictions grappling with their increasing popularity. From an economic development perspective, they can function as an alternative income source for property owners who wish to rent out property in areas that may be attractive to tourists. The popularity of home or property sharing platforms such as Airbnb, VRBO and Hipcamp testify to the market demand for alternative lodging facilities for tourists in the 21st century.
In housing markets where demand outstrips supply, however, the conversion of an excess number of rental properties from long-term leases to short-term rentals can have significant effects on local housing affordability. For this reason, short-term rentals are often given different treatment by zoning than accessory dwelling units, which are intended to function as affordable housing units for the local population.
In a market such as Washington County, where housing costs are not prohibitive for most existing residents, there is less concern presently over the threat posed by the conversion of housing to
short-term rentals. However, being a location fortunate enough to include a number of nationally recognized tourist attractions, such as Antietam National Battlefield, The Appalachian Trail and the C & O Canal National Historic Park, there is certainly a possibility that housing in gateway communities such as Sharpsburg, Williamsport and other small towns could be converted to short-term rentals.
Accordingly, Washington County amended several sections of its Zoning Ordinance in 2021 to regulate this type of residential land use. A definition was created for a “Short-Term Residential Rental” which, among other provisions, limits rentals to no more than a 30 day period per client/reservation, requires 1 parking space per bedroom, and limits onsite signage that can be posted identifying the property. They do not require the submission of a site plan.
In rural zoning districts, short-term rentals are permitted as a principal permitted use in the Agricultural (Rural), Environmental Conservation and Preservation Zoning Districts. A special exception is required in Rural Village zoning districts, which encompass some of the towns referenced above that could be impacted.
In urban zoning districts, short-term rentals are permitted as a principal permitted use in the Business, Local, Business, General and Special Economic Development Districts. They are a special exception in the Residential, Multi-Family; Residential, Suburban; Residential, Transition and Residential, Urban Zoning Districts.
The implementation of the Water and Sewerage Plan is one of the most direct methods by which public policies shape the character of development in Washington County. The plan sets policies, which are consistent with the County’s Comprehensive Plan as well as State and Federal regulations, that delineate existing, planned and programmed service areas for water and sewerage facilities throughout the County for a twenty-year time horizon. In addition to advancing policies that protect citizens from health and safety issues that can result from inadequate water and sewer facilities, one of the Plan’s stated objectives is “to encourage and guide residential growth to those areas which are served or planned to be served with community water and sewerage systems to provide opportunities for new and adequate housing at reasonable costs for the citizens of Washington County.”
In keeping with long-range planning goals previously described, the Water and Sewerage Plan focuses on encouraging growth within the Urban and Town Growth areas with public facilities, maintaining the existing footprint and limited growth within Rural Villages, and correcting problematic individual systems in Rural Areas of the County.
Washington County’s Adequate Public Facilities Ordinance (APFO) ensures that there is adequate infrastructure to serve new development. The APFO requires that new development mitigate impacts upon existing infrastructure concurrently when the impact occurs. The APFO’s concurrency requirement applies to impacts upon roads, schools, water and sewer systems, and in some areas, fire protection systems.
These requirements serve not only to mitigate the overall impacts of development on public infrastructure, but also to serve as a regulatory hurdle that influences the location, timing and scale of development. In the case of school capacity, for example, when the effect of a proposed residential development causes existing school enrollment in the affected district to exceed the State Rated Capacity (SRC), the developer must work through mitigation options
in order to gain final plan approvals. In cases where the proposed residential development causes affected schools exceeds 120% of SRC, the potential exists for a development moratorium on major residential subdivisions until such time as sufficient school capacity can be achieved.
The Washington County Division of Permits and Inspections and the Hagerstown Department of Code Administration and Permitting conduct inspections for building conditions, code violations and other unsafe structural conditions to protect the health and safety of the community.
An extensive discussion of Federal, State and local policies, programs and regulations aimed at protecting historic structures in Washington County, including those used for housing, can be found in the Historic Resources Element of the Comprehensive Plan.
To define future housing demand in Washington County, dwelling unit projections are presented below.
The anticipated number of dwelling units that will be needed by 2045 in Washington County is projected in Charts 6-9 and 6-10 below. Both the Maryland Department of Planning (MDP) and Washington County’s Department of Planning and Zoning project population and housing data to at least 2045. The projected number of dwelling units is then arrived at by dividing the projected population figures (less group quarter projections) by the average household size (2.5 persons as of the 2020 Census as noted in Chapter 4) and by factoring in current and historic vacancy rates. In addition to data collected by MDP and the U.S. Census Bureau, County projections also consider historical trends in population growth and housing trends between 1940 and 2020 to arrive at its internal figures for these measures.
Charts 6-9 and 6-10 (following page) utilize County and MDP population projections to arrive at the projected number of dwelling units. Using 2020 MDP population projection data to calculate dwelling units, it’s anticipated that a 17.8% increase in the projected number of dwelling units will be added in Washington County during the 25 year period from 2020 to 2045 to a projected total of 75,125 dwelling units. This works out to roughly a 0.7% increase in the number of new dwelling units that will be needed annually to keep pace with projected population growth using their figures.
County projections for dwelling units also extend to 2045 and are notably higher than MDPs as observed in comparing Charts 6-9 and 6-10, above. By 2045, the County is projecting that there will be 85,559 dwelling units. MDP, by comparison, projects only 75,125 dwelling units by 2045, which is 13.9% below the County’s 2045 projection.


These discrepancies between State and local projections can be explained by the County’s assumption, drawing from historic data, that its population will only grow by a rate of 0.71% between 2020-2030, which is approximately two-thirds of its historic annual growth rate. Washington County projects that the normal average an annual growth rate of 1.15% will resume after 2030 as it recovers more fully from the effects of the recent Great Recession and the COVID-19 Pandemic. MDP, conversely, uses a more modest average annual growth rate of 0.83% over the entire period, giving greater weight to more recent data tracking natality, mortality and domestic migration rates.
To provide context, prior to the recession in 2008, the County’s 1.15% growth figure was largely consistent during the 70 year period between 1940 and 2010. This led to the conclusion that the dip in the growth rate experienced by the County in 2008 was somewhat of an anomaly, given past trends. Further, while there may be variation in the past factors that contributed to this historic growth rate, such as an increase in international migration to offset declining domestic migration, the mix of data measures described above plus others seems to support continued use of the 1.15% growth rate in the County’s projections.
Throughout the projected period between 2020 and 2045, the County has assumed a roughly 5.35% vacancy rate of all available dwelling units. This rate is again based upon historic data that tends to identify the 8.4% vacancy rate from 2010 as an anomaly for Washington County that is unlikely to continue. Therefore, the total number of vacant dwelling units in 2045 is projected to be 4,577.
The dwelling unit projections offered above are a first step in examining future needs for housing in Washington County. This analysis is expanded upon in the Land Use Chapter of this Plan, where potential residential buildout according to what is presently allowed by County Zoning is examined. More specifically, the Development Capacity Analysis included in that chapter gives us a theoretical look at the number of potential dwelling units that could be built on undeveloped or underdeveloped land in each zoning district based on constraints by each district’s individual density restrictions. Suffice to say for the purposes of this chapter, based upon that Analysis, there is every indication to believe that the County has sufficient capacity to meet its future housing needs.
Housing affordability and the potential for additional housing services was also projected by looking at the projected growth of age dependent populations and by examining anticipated changes in the demographic makeup. As shown in Chart 6-11, those aged 65 and older are projected by MDP to exceed 20% of the total population of Washington County by 2030. This projection represents a nearly 5% increase in this population group from 2015. This projected growth indicates that the needs of seniors, many of whom will no longer be in the workforce and will require specialized housing and health services, will be an increasingly significant consideration for various decision-making entities in Washington County.
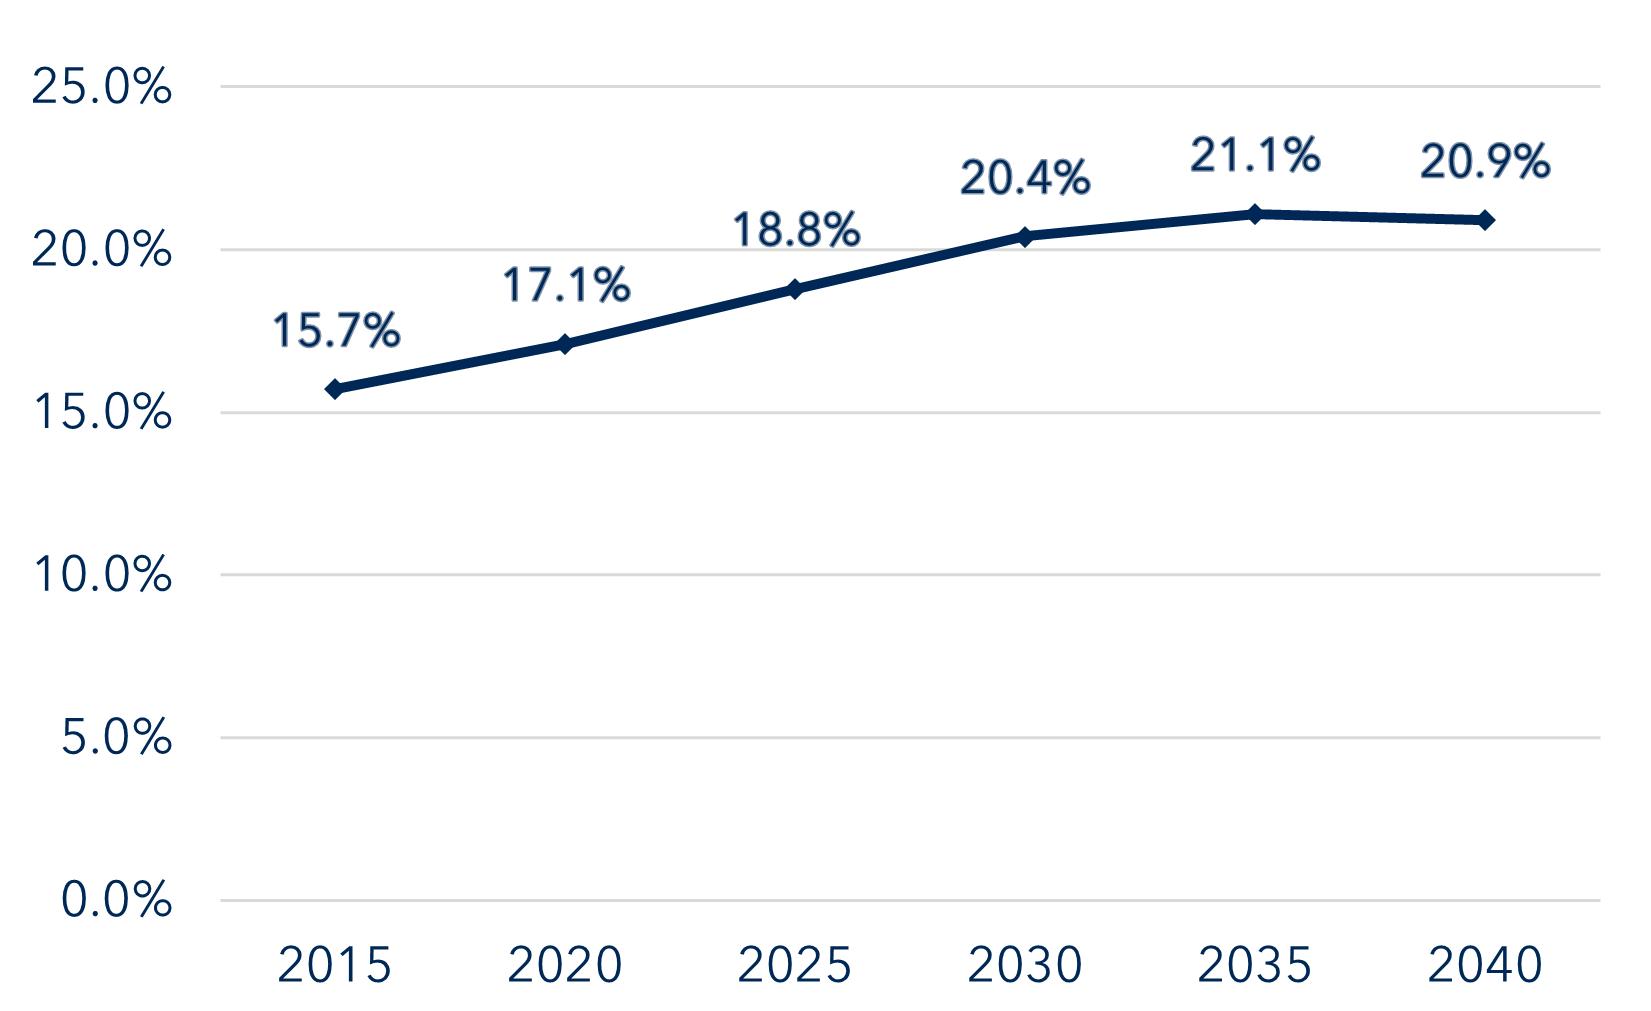
Chart 6-11: Projected Percent Population Over 65

The most recent County-wide analysis of housing needs was prepared by RPR Economic Consultants in 1991 for the Washington County Department of Housing and Community Development. The study evaluates the ability of the private market to address County housing needs between 1990 and 2010 and offers recommendations for the County to assist in ensuring these needs are met. A comprehensive study of housing needs for Washington County, outside of comprehensive plan updates by the City or County, has not been undertaken since this report. The County should work with local housing partners to produce or contract a new comprehensive housing study that expands upon the findings of this Comprehensive Plan update to determine whether or not the type and cost of new housing units being built is meeting the affordability needs of all County residents, offering further policy considerations to address any shortfall.
“As-of-right” or “by-right” development is a regulatory streamlining approach by which development projects that meet local zoning requirements are administratively approved without the need for a public hearing or local legislative action. This method shortens the review process prior to approval, thus reducing development costs that are often passed on at the end to the consumer. While Washington County does not require approval by its Planning Commission or Board of County Commissioners for most development projects, greater regulatory streamlining for those projects that currently do require these approvals is worth investigating, particularly for projects within PFA’s or planned growth areas.
One existing example in the County of regulatory streamlining is its Express Procedure. The Express Procedure offers relief from some of the requirements of the County’s Forest Conservation Ordinance to development projects that meet specific criteria. The Procedure allows simultaneous submission and review of the forest stand delineation and forest conservation plan, in addition to automatic eligibility to select the payment of lieu of planting fee without Planning Commission approval. Projects subdividing seven lots or less, and those where no subdivision is proposed, with a planting requirement of 2 acres or less and no disturbance of priority areas are eligible to undertake this streamlined route without prior departmental approval. The County recognized such small planting requirements do little to address forest conservation and water quality goals on-site, and therefore could achieve more in concert with other off-site plantings. Therefore, the strategy offers benefits to both the County and developers.
Expanding on the “by-right” approach noted above, the use of expedited review and permitting for affordable, infill and sustainable building projects is being pursued by many communities around the Country. New technologies can be employed in service of shortening the project review and adding certainty to development fees and timelines that can significantly reduce end costs. Streamlining approaches can also help serve many other planning objectives such as historic preservation, transit-oriented development or energy efficient building design.
Through zoning and other land use policies, enable the creation of diverse housing types within individual development projects and planned communities to encourage the mixing of income levels and social classes to promote overall community cohesion. New federal housing projects and many other private housing developments oriented towards affordability have long moved away from building new communities consisting of uniform housing types due to a variety of unintended social consequences resulting from the creation of homogeneous communities.
The Hagerstown Housing Authority (HHA) has implemented two recent projects that have successfully utilized the mixed-income community model to revitalize Hagerstown’s West End neighborhood. In 2001, Gateway Crossing replaced the 210-unit Westview Homes Public Housing Project with 352 new homes on an expanded site area. The site design wove together the new rental and homeownership components and integrated the new housing development into the surrounding neighborhood of single-family homes. Urban design elements such as landscaping, street lighting, and sidewalks serve to provide a pedestrian-friendly environment and connect the development to a brand new 20,000 square foot Elgin Station Community Center.
Using Gateway Crossing as a model, the McCleary Hill Development created another new mixed income community on a newly acquired site in 2019. The community is a mix of single-family, duplex and townhomes with a community center and other amenities. In tandem with the creation of this project, the existing Noland Village community in southwest Hagerstown will have reduced density and be redeveloped as a mixed income community, with 140 Public Housing Units being transferred to McCleary Hill. These developments have successfully met the HUD’s Affirmatively Furthering Fair Housing rule and Maryland’s HB 90.
Presently, although all urban zoning districts in the County allow at least two-family dwellings, the creation of such communities are only truly possible with the establishment of a new Mixed Use Zoning District. The creation of a new Mixed Use Zoning District requires a full rezoning of the property - a process that is lengthy, costly and does not come with a guarantee that it will be approved.
The County’s Zoning Ordinance currently promotes a fairly strict separation of permitted residential densities and land uses which tends to result in development patterns that are less efficient than they could be if greater flexibility was permitted. In particular, the County should investigate locations where greater mixing of residential densities could be achieved, such as in urban zoning districts that fall within designated Urban and Town Growth Areas. Public infrastructure and services in such areas are typically either already sufficient, or can be upgraded or extended at a manageable cost, to handle the increased demand. The end result would likely be a significant step towards providing broader access to quality affordable housing that acts as a stepping stone to upward social mobility for individuals and families.
In addition to promoting communities that mix residential densities through varied unit types, the County should also investigate opportunities to allow more mixed-use developments which combine multiple land use types in a single structure or location. Mixed-use developments, such as where residential and commercial uses occupy different portions of the same building or are located on the same development site, foster more compact and sustainable land use and lifestyle patterns, particularly when reinforced by intermodal transportation improvements.
Rural Village Zoning Districts offer an existing example where there are opportunities to pursue mixed uses on a parcel in a structure. Within specified limitations and development regulations, zoning in these districts allow for properties to combine residential and non-residential uses. Due to historic patterns of settlement in these communities, this development type may be more likely to fit within the historic context of the built environment than single-purpose buildings.
Zoning districts in the designated Urban and Town Growth Areas, where there is already infrastructure to serve intensive land uses, should also be targeted for the creation of such developments. Specifically, mixed use developments should be encouraged along major transportation routes where a high amount of rezoning activity has already resulted in blended patterns of residential and commercial development. Stretches of Virginia Avenue between Hagerstown and Williamsport or Robinwood Drive near Hagerstown Community College already exhibit these characteristics. In such areas, the market has already shown a tendency towards a transition in land use that could be harnessed to promote desired development patterns. In more stable communities along such routes, encouraging land use transitions may be less appropriate. Both residential and commercial zoning districts in targeted growth areas should be considered for mixed use development.
Through the streamlined review and permitting process mentioned above, the County should encourage infill and redevelopment projects that promote compact patterns of land use. In addition to offering the advantage of access to existing infrastructure and services previously discussed, infill and redevelopment projects slow the expansion of an area’s overall developed footprint into greenfield lands on the urban periphery where growth may be less desired for a variety of factors. Streamlining review and permitting processes inside designated growth areas and in Priority Funding Areas would encourage new development of all types, including residential projects, to look first at available lands in these areas before breaking new ground nearby where infrastructure and services have to be extended at significant cost to the project and community.
Off-street parking requirements in many places are often outdated standards that result in the waste of developable land that could be generating tax revenue, fragment built-environment connectivity, and reinforces automobile dependency. These requirements may make more sense in the less developed portions of the County where personal transportation is the only viable option for accessing goods and services. In existing communities however, which are served by transit, or can be navigated by walking or bicycling, reducing or eliminating parking requirements yields a multitude of benefits. Parking reductions promote more efficient site designs. They also assign the costs of parking to those residents or businesses that need it, instead of those that do not, promoting a sense of fairness. Many communities have specifically pursued policies such as reducing or eliminating parking requirements near transit stops and for affordable housing within reach of public transportation.
Due to many factors such as the recent recessions, the high costs incurred in obtaining a college education and the rising cost of living in relation to wage growth, many families are finding themselves caring for children and seniors under the same roof at the same time. Accessory dwelling units offer one solution to this issue, particularly areas zoned primarily for single-family housing where density could be increased without changing fundamental neighborhood character. Article 4.10 of the Washington County Zoning Ordinance presently prohibits the use of accessory structures as living quarters. If authorized by zoning, building code standards for accessory dwelling units could be updated to ensure that such units met essential health and safety standards.
Density bonuses incentivize the creation of affordable housing by granting developers the ability to construct a greater number of market rate units than would typically be allowed in exchange for guaranteeing a certain percentage of the overall development is devoted to affordable housing units. Typically, the standard applies to larger housing developments where significant affordable housing units can be gained in the process.
Washington County’s Zoning Ordinance does presently contain a Residential Multifamily zoning district which permits a maximum of twelve dwelling units per acre. The reduction of off-street parking requirements within such districts, particularly if long-range transportation planning encourages transit investments or transit-oriented development near multi-family residential unit clusters, offers a potential path to strengthen the impact of this zoning district on achieving overarching land use goals of concentrated development in planned growth areas.
Inclusionary zoning requires or encourages the inclusion of affordable units in new residential development projects. Such policies expand the amount of affordable housing available through a method that helps lessen public opposition while simultaneously providing better educational outcomes for low-income children who then have access to better schools.
The City of Philadelphia offers real estate tax abatement for up to 30 months during the construction of affordable housing. The abatement of taxes at this phase allows residential development of many price ranges to become more affordable while providing more financial certainty to the developer by lessening upfront costs.
Housing affordability is often viewed solely from the standpoint of initial costs to the producer and consumer without fully considering whether that cost-effectiveness can be retained in the long-term. The energy efficiency of housing is one such measure by which affordability is put to the test. In addition to promoting land use regulations that improve the locational efficiency of housing, the efficiency of the structure itself should be maximized throughout its lifespan.
For existing housing, this can be achieved through incentivizing home repairs and improvements that increase energy efficiency. A number of state and local housing support providers (detailed in the Appendix) already offer such enticements to local homeowners. There may be additional opportunities to expand such programs to encourage energy efficient improvements to existing rental housing that could extend the affordability benefits of these improvements more broadly across the housing market.
For new housing, there are now numerous programs which provide guidance and/or certification for incorporating green building features into new development. LEED certification is the most well-known of these programs which enhance livability by addressing a wide range of environmental concerns through building and site design measures such as air quality, water quality, human health, and energy efficiency. Green building practices promote the adoption of renewable energy and water conservation, reduce stormwater runoff, discourage the use of toxic materials and reduce waste streams that result from building and habitation. The reuse of materials and incorporation of rehabilitated structures already existing onsite may also benefit additional planning objectives such as historic preservation and adaptive reuse. Finally, as alluded to above, more broadly applied sustainable building practices that account for neighborhood and community design, and which tie into intermodal transportation and community facility investments, extend the reach of these efforts beyond individual developments, resulting in substantial public benefits.
Whether through grants, tax incentives, changes to the building code or by other regulatory tools, the County should investigate ways to extend the lifespan of new and existing construction to promote affordability that durably withstands the test of time.

Transportation networks are among the primary elements which determine a community’s character. Transportation planning serves as a primary catalyst for determining the location, pace, and timing of development activities in a given location because transportation facilities provide direct access to land and serve as the gateway to many other infrastructural improvements that support economic growth. Accordingly, it is imperative that thoughtful consideration be given to the end goals of transportation investments in the planning, design, and implementation of an overall transportation network in order to achieve a system which serves all users throughout Washington County.
Above all, transportation investments should serve the needs of people and communities. Due to the importance of the automobile in daily travel in the United States, this larger objective can sometimes get lost in the focus to pursue strategies to alleviate the negative effects of congestion on our busy roadways. This focus on motorized transportation modes can sometimes lead to transportation planning which places a greater emphasis on mobility than accessibility.
Transportation planning in Maryland, however, increasingly recognizes that the most effective model for creating a functional transportation system is one which offers choices to its users through the provision of an interconnected multi-modal network. Such a network balances the needs of different user groups and creates transportation facilities which account for the local context of the area that the investment is attempting to serve. The end goal of this multi-modal network is to realize a sustainable pattern of land use that creates opportunities for growth in accordance with a community or region’s desired long-term vision.
To achieve this desired vision, transportation planning must be integrated with many other elements of long-range planning. In the context of the Comprehensive Plan, this includes consideration for transportation plans within other key elements such as the land use plan, economic development strategies, housing provisions, community facility siting and in the conservation of resource lands.
The Transportation Element strives to serve the goals and objectives of the Plan by identifying the strengths and opportunities for improvement in Washington County’s current multi-modal transportation system so that future needs can be projected and met in a timely manner. Existing plans produced by State and local transportation planning entities heavily inform the priorities identified in this chapter. The policies and recommendations contained in the Transportation Element reinforce the County’s commitment to these priorities so that funding sources can be identified to achieve their completion in capital planning.
One of the most significant movements nationwide in transportation policy and design during the last 20 years to achieve equitable transportation networks is the Complete Streets approach. Complete Streets is a comprehensive, integrated transportation policy that requires roads and adjacent rights-of-way to be planned, designed, operated and maintained in a manner that facilitates safe and convenient travel for users of all ages and abilities, regardless of their mode of transportation. The potential benefits of Complete Streets are myriad including improved safety for all users; expanded transportation choices; providing better bike, pedestrian, and transit connections to activity centers where people access essential facilities and services; promoting healthy lifestyles and recreational opportunities; and creating more livable communities.
The Complete Streets concept does not stipulate specific street standards, but instead encourages a context-sensitive design approach, fitting roadway design within the character of the neighborhood or community, recognizing that all streets are different and user needs should be balanced. Accordingly, the infrastructural elements comprising a Complete Street in a rural area, for example, will likely differ markedly from a Complete Street in a highly urban area. A Complete Street may include some or all of the following elements: sidewalks, bike lanes (or wide paved shoulders), special bus lanes, comfortable and accessible public transportation stops, frequent and safe crossing opportunities, median islands, accessible pedestrian signals, curb extensions, narrower travel lanes, roundabouts, and more. The following figure provides a sample depiction of a Complete Street:
Sidewalks should be smooth, wide, feel safe and have appropriate transitions to the street, making them easy to walk on or use a wheelchair on.
Simple pavement markings creating a dedicated bike lane make both motorist and bicycle movement more predictable, and therefore safer for both. They increase the likelihood of casual riders using bicycles for transportation.
One lane car traffic going in each direction with a twoway-left-turn-lane (TWLTL) in the center would reduce the amount of car crashes by providing turning vehicles a refuge from through traffic, while keeping through traffic moving efficiently.

Clearly marked crosswalks allow pedestrians and wheelchair users to cross streets safely, while making sure cars know where to expect them.
Planting
Street landscaping may slow traffic, improve the aesthetics of the roadway, provide shade and create a buffer between cars and people, making a more inviting environment for pedestrians.
Parks and public green spaces create a destination encouraging community interaction and providing rest from the surrounding environment.
Once adopted by local bodies, a Complete Streets policy requires applicable transportation planning entities to routinely consider and incorporate complete streets criteria for all travel modes into all transportation projects, both new and retrofitted, so that the entire transportation system better meets all user needs. The Hagerstown/Eastern Panhandle Metropolitan Planning Organization adopted a Complete Streets Policy in 2018 and has incorporated Complete Streets principles into its Long-Range Transportation Plan.
The following organizations and plans are integrally involved in setting priorities for transportation investments in Washington County:

HEPMPO is the federally designated Metropolitan Planning Organization (MPO) for the Hagerstown, MD—WV—PA urbanized area. This area includes Washington County, Maryland, Berkeley and Jefferson Counties, West Virginia and a small portion of Franklin County, Pennsylvania. The MPO is responsible for developing the regional Long-Range Transportation Plan (LRTP), which is the guiding document for future multi-modal transportation needs over a 25-year planning period, and the Transportation Improvement Program (TIP), a four-year program of short-range projects. The development of these plans is a prerequisite for Federal funding assistance for implementing transportation projects in a metropolitan planning area. LRTPs are updated every four to five years with Direction 2050 serving as the current LRTP. The MPO also produces or commissions a range of other plans and studies that address specific topics or issues related to the provision of multi-modal transportation.
The County’s Capital Improvement Plan (CIP) is the means by which future infrastructure needs for all County Departments are forecasted and prioritized. The program enables such improvements to occur in a timely and costeffective fashion. Projects are prioritized based on established criteria that includes County plans and policies. The Plan is flexible and covers 10 years with the first year being the Capital Improvement Budget. Funds for each project are allocated from Federal, State, and local sources by the Board of County Commissioners.
The primary regulatory tool employed by the County to ensure that new development is served by a suitable road network is its Adequate Public Facilities Ordinance (APFO). Adequacy standards for new public roads are contained in the Washington County Engineering Department’s Specifications or in design and construction specifications adopted by the State Highway Administration (SHA). The type of new road, if required, is based upon projected traffic volume as determined by the County Engineer or SHA, often stemming from a required traffic impact study provided by the developer. Standards for adequacy of existing public roads impacted by new development are contained in the Washington County Engineering Department’s publication entitled “A Policy to Determine Adequacy of Existing Highways.” If needed, roads are planned for improvement by various public and private entities as part of the development review process. If roads cannot be made adequate for the proposed development, the application may be denied.
The Maryland Transportation Plan (MTP), produced by the Maryland Department of Transportation (MDOT), creates a 20-year multi-modal vision which identifies the State’s most critical transportation needs and challenges, provides a framework for Statewide goals and objectives, and identifies strategies to help MDOT meet the goals.
MDOT updates the MTP and the Maryland Bicycle & Pedestrian Master Plan concurrently every five years. Progress toward achieving the MTP’s goals and objectives is evaluated and reported in an Annual Attainment Report.

The MTP informs Maryland’s six-year Consolidated Transportation Program (CTP), which programs funding for individual transportation investments based upon input from State and local authorities as well as the general public. The CTP is heavily informed by projects identified in the Highway Needs Inventory. This Inventory identifies highway improvements to serve existing and projected population and economic activity in the State as well as address safety and structural problems that warrant major construction or reconstruction. Priority Letters from local jurisdictions are submitted to the State annually to establish an internal ranking of multimodal projects for funding consideration.
The CTP is further refined in the Maryland Statewide Transportation Improvement Program (STIP), a four-year, fiscally constrained, and prioritized set of transportation projects, compiled from Statewide, local, and regional plans. The STIP contains Federally funded projects plus regionally significant State and local projects. This program is a requirement to receive Federal funds for transportation.
MDOT is the parent organization for many sub-departments involved in the provision of transportation Statewide including the Maryland Aviation Administration, Maryland Port Administration, Maryland Transit Administration, Maryland Transportation Authority, Motor Vehicle Administration and State Highway Administration (SHA). It also analyzes alternatives to manage waste including waste reduction, recycling, and energy recovery alternatives. The Plan is updated every three years.
To project future transportation needs for the County, it’s important to have a snapshot of how and where County residents travel presently. To accomplish this, overall travel metrics such as travel mode shares and commuting patterns are taken from data collected by the U.S. Census Bureau or contained within the HEPMPO’s LRTP. This portrait will be further refined in later sections of this element which analyze existing and future travel needs according to the mode of transportation.
Travel mode is the means of transportation utilized by individuals to carry out their daily activities, such as by motor vehicle, transit, walking or bicycling. The U.S. Census Bureau collects data on transportation through the lens of various commuting related measures, including means of transportation, vehicle availability and travel time to work. These measures are described below.
Chart 7-1, below, displays statistical data for this measure in Washington County between 2000 and 2020. The preferred mode of transportation has changed little in Washington County in the last 20 years. Slightly more than 80% of County residents drove a car, truck or van alone to work throughout the period surveyed. Approximately 12% of commuters carpooled. One to two percent of residents took other means of transportation including public transportation, walking, bicycling, taxi or other methods of travel. Approximately 3% of respondents reported working from home throughout the period, which may change going forward as a result of the shift to remote work for some jobs due to the COVID-19
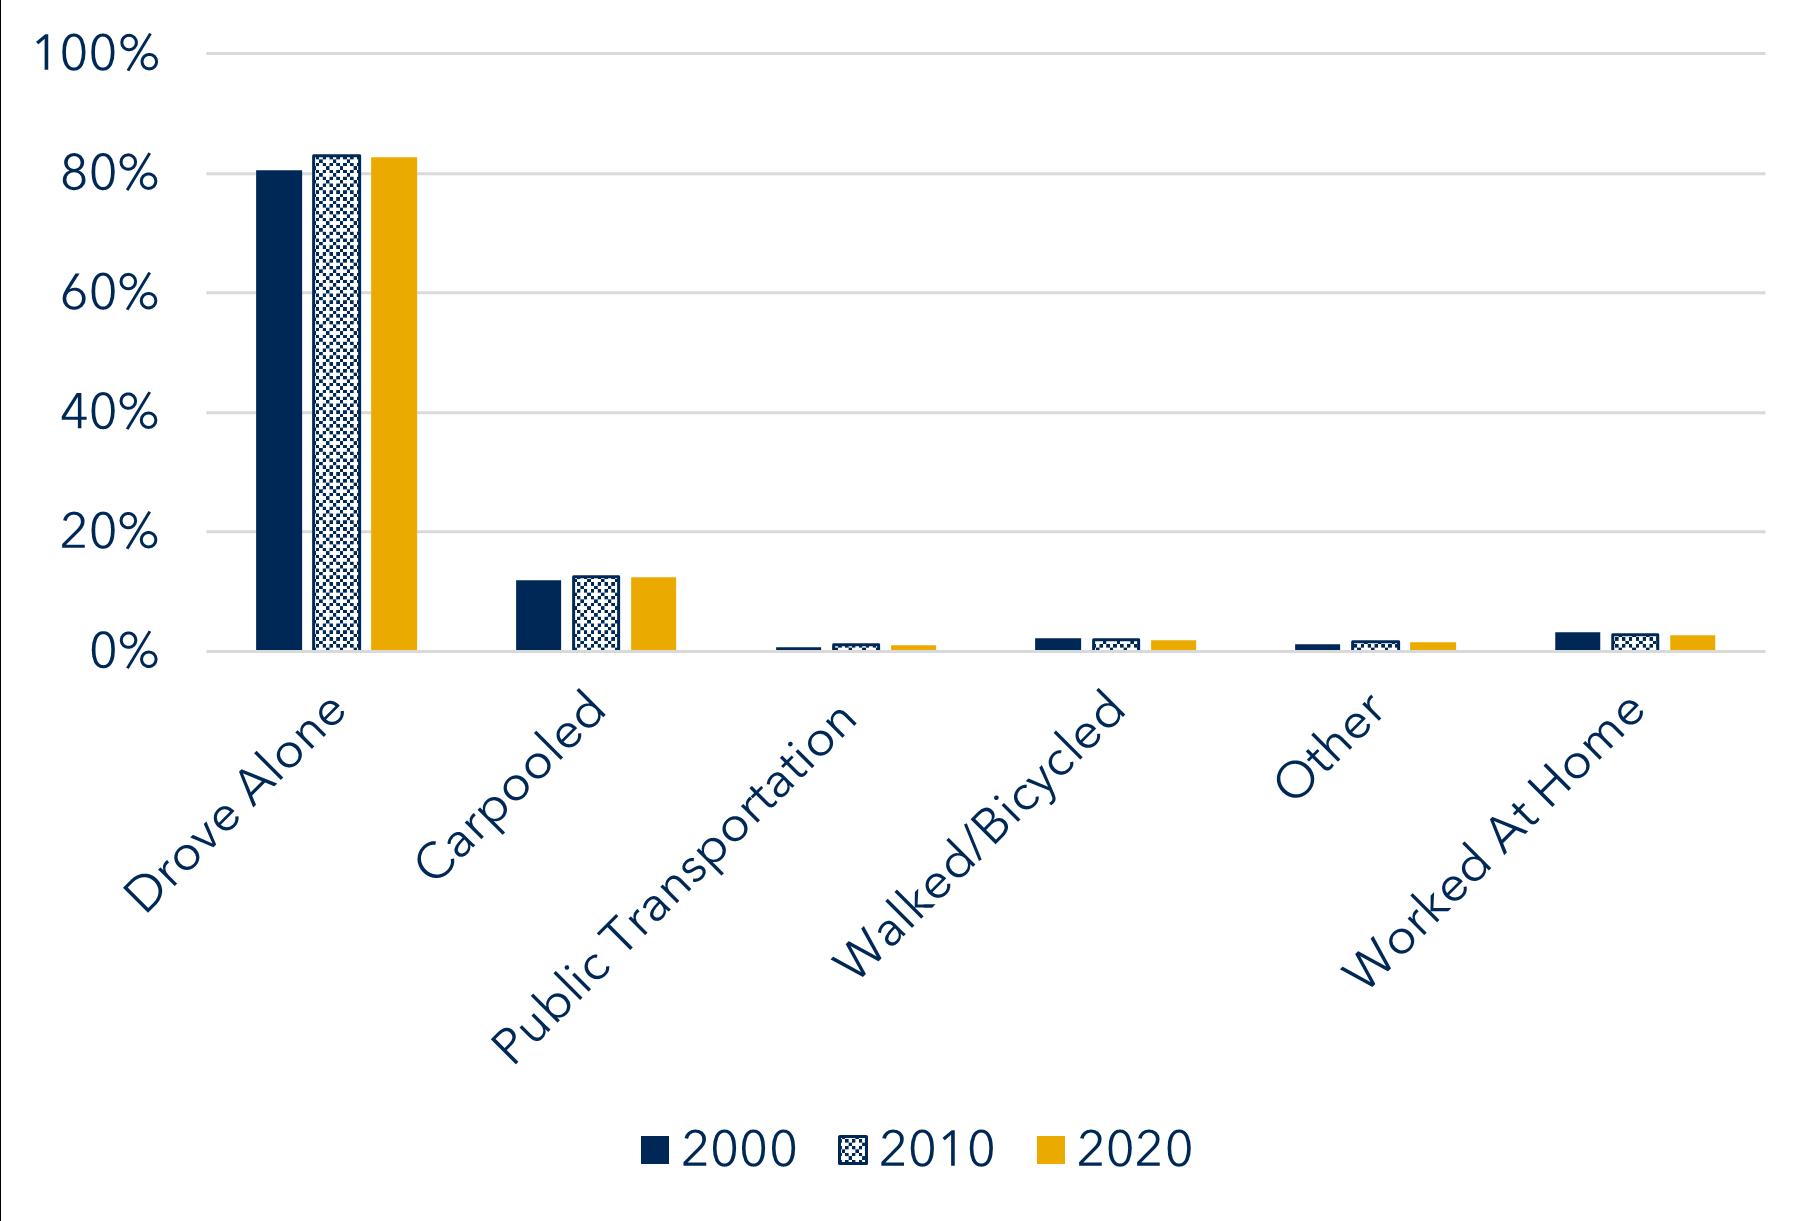
Vehicle availability data collected by the U.S. Census Bureau offers another measure of a populace’s mobility. Vehicle ownership, particularly in rural counties where the lower population densities make the feasibility of achieving a comprehensive public transportation network more difficult, is critical for residents to access essential goods, services and employment. Chart 7-2, below, shows the number of vehicles available to workers over the age of 16, by selected means of transportation, between the years 2010 and 2020.
The chart seems at first to largely reinforce the conclusions drawn above about the County’s preferred modes of travel, when looking at the means of transportation for all workers aged 16 years or greater. In 2010 and 2020, the majority of respondents had two or three vehicles available for commuting to work. Less than 5% of these workers reported having no vehicle available for commuting to work. Among workers who reported commuting by public transportation, however, vehicles are significantly less available. 34% of workers aged 16 years or greater who commute to work by public transportation did not have a vehicle available for this purpose in 2010.
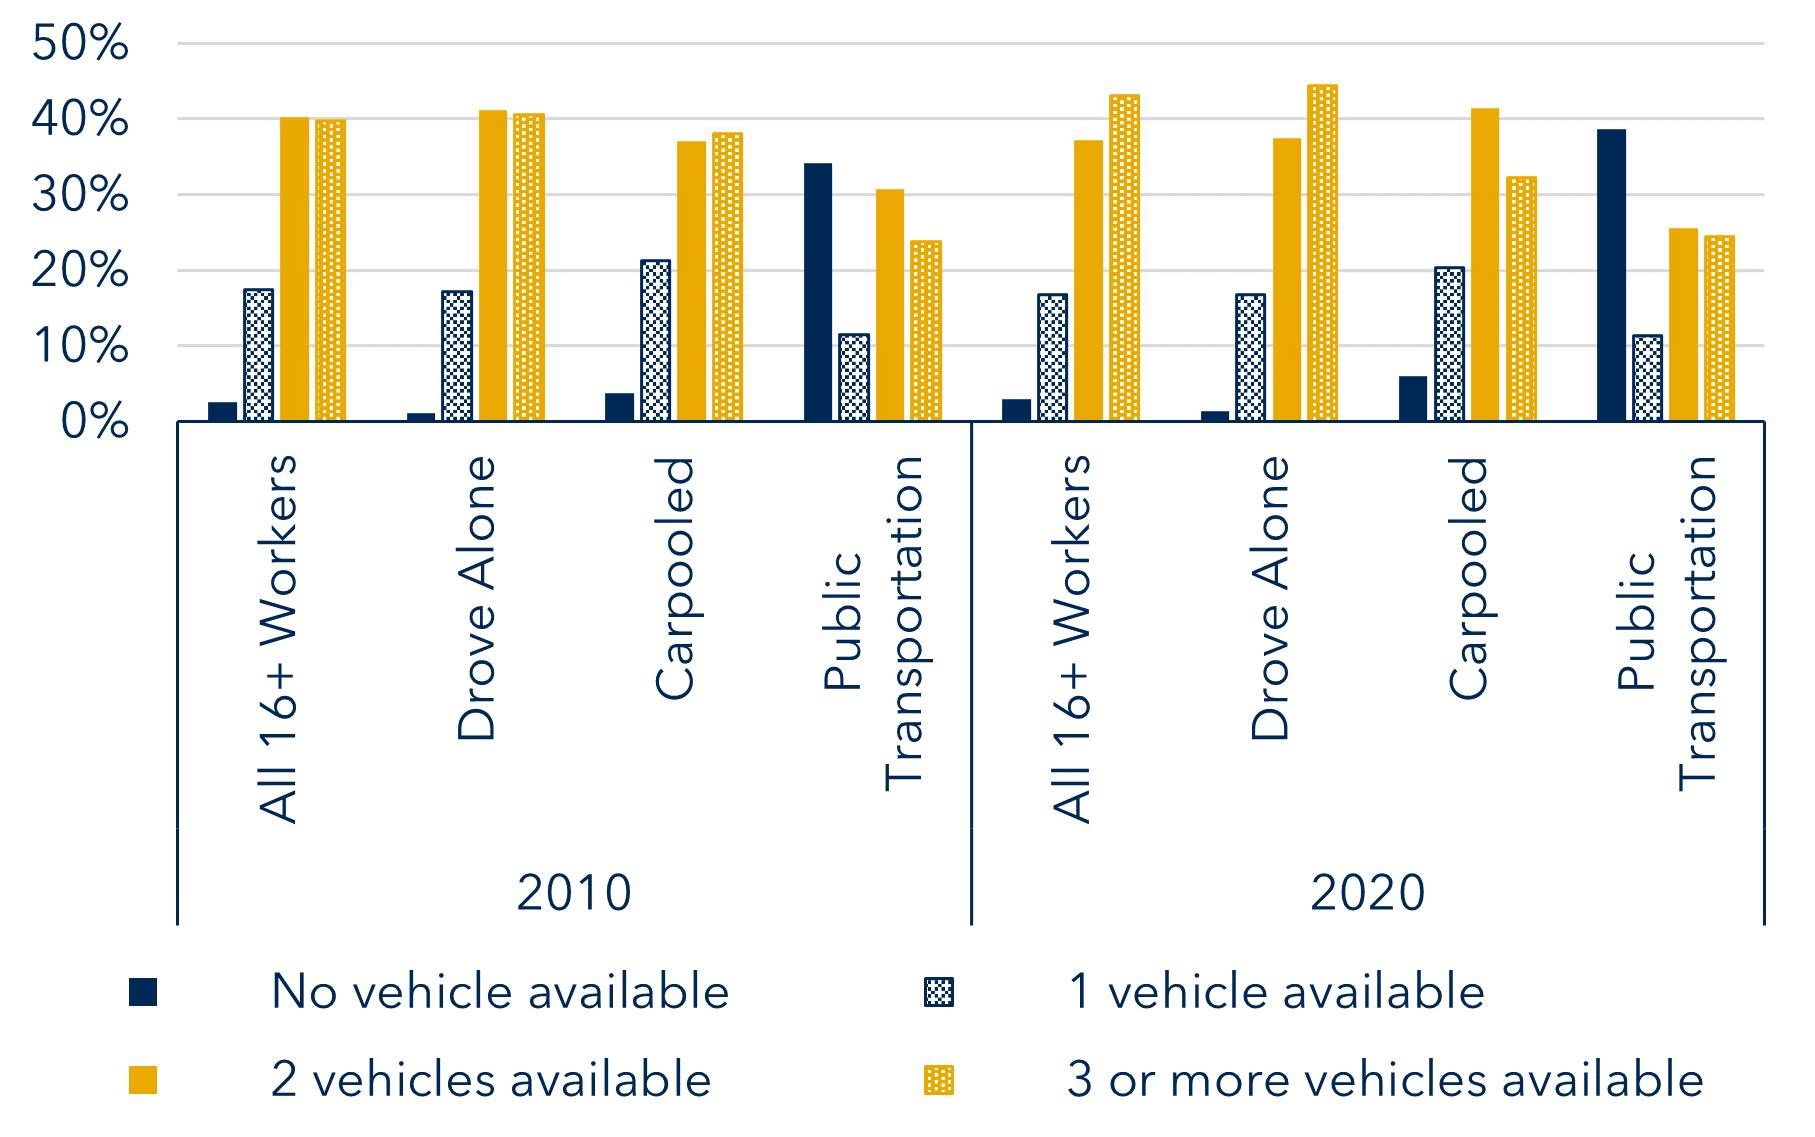
This figure was 39% by 2020. This trend should continue to be monitored as lifestyle preferences change and overall living costs, including those associated with transportation, continue to increase.
Travel Time To Work
Chart 7-3, below, displays the travel time to work for those workers (who did not work at home) aged 16 years and over in Washington County between 2000 and 2020. What stands out most about this chart is that a greater percentage of workers aged 16 years and over are spending more time commuting now than they did 20 years ago. In 2000, 56.3% of these workers commuted between 10-29 minutes. By 2020, only 49.5% of workers completed their commute in less than 30 minutes.
There is a corresponding increase in longer commute times in 2010 and 2020, according to Chart 7-3. The percentage of those commuting between 30-60 minutes, or more than 60 minutes, have both increased during this period. The percentage of workers commuting less than 10 minutes, by contrast, fell just under 4% by 2020.
Altogether, these trends suggest that a significant number of Washington County residents are commuting to employment destinations outside of the County’s borders. Further, an increasing share of workers are traveling for long enough that they may be employed at regional centers in the Beltway Corridor, or across State lines. These preliminary conclusions will be examined further in the section that follows which looks at commuting patterns.
Chart 7-3: Travel Time to Work (2000-2020)
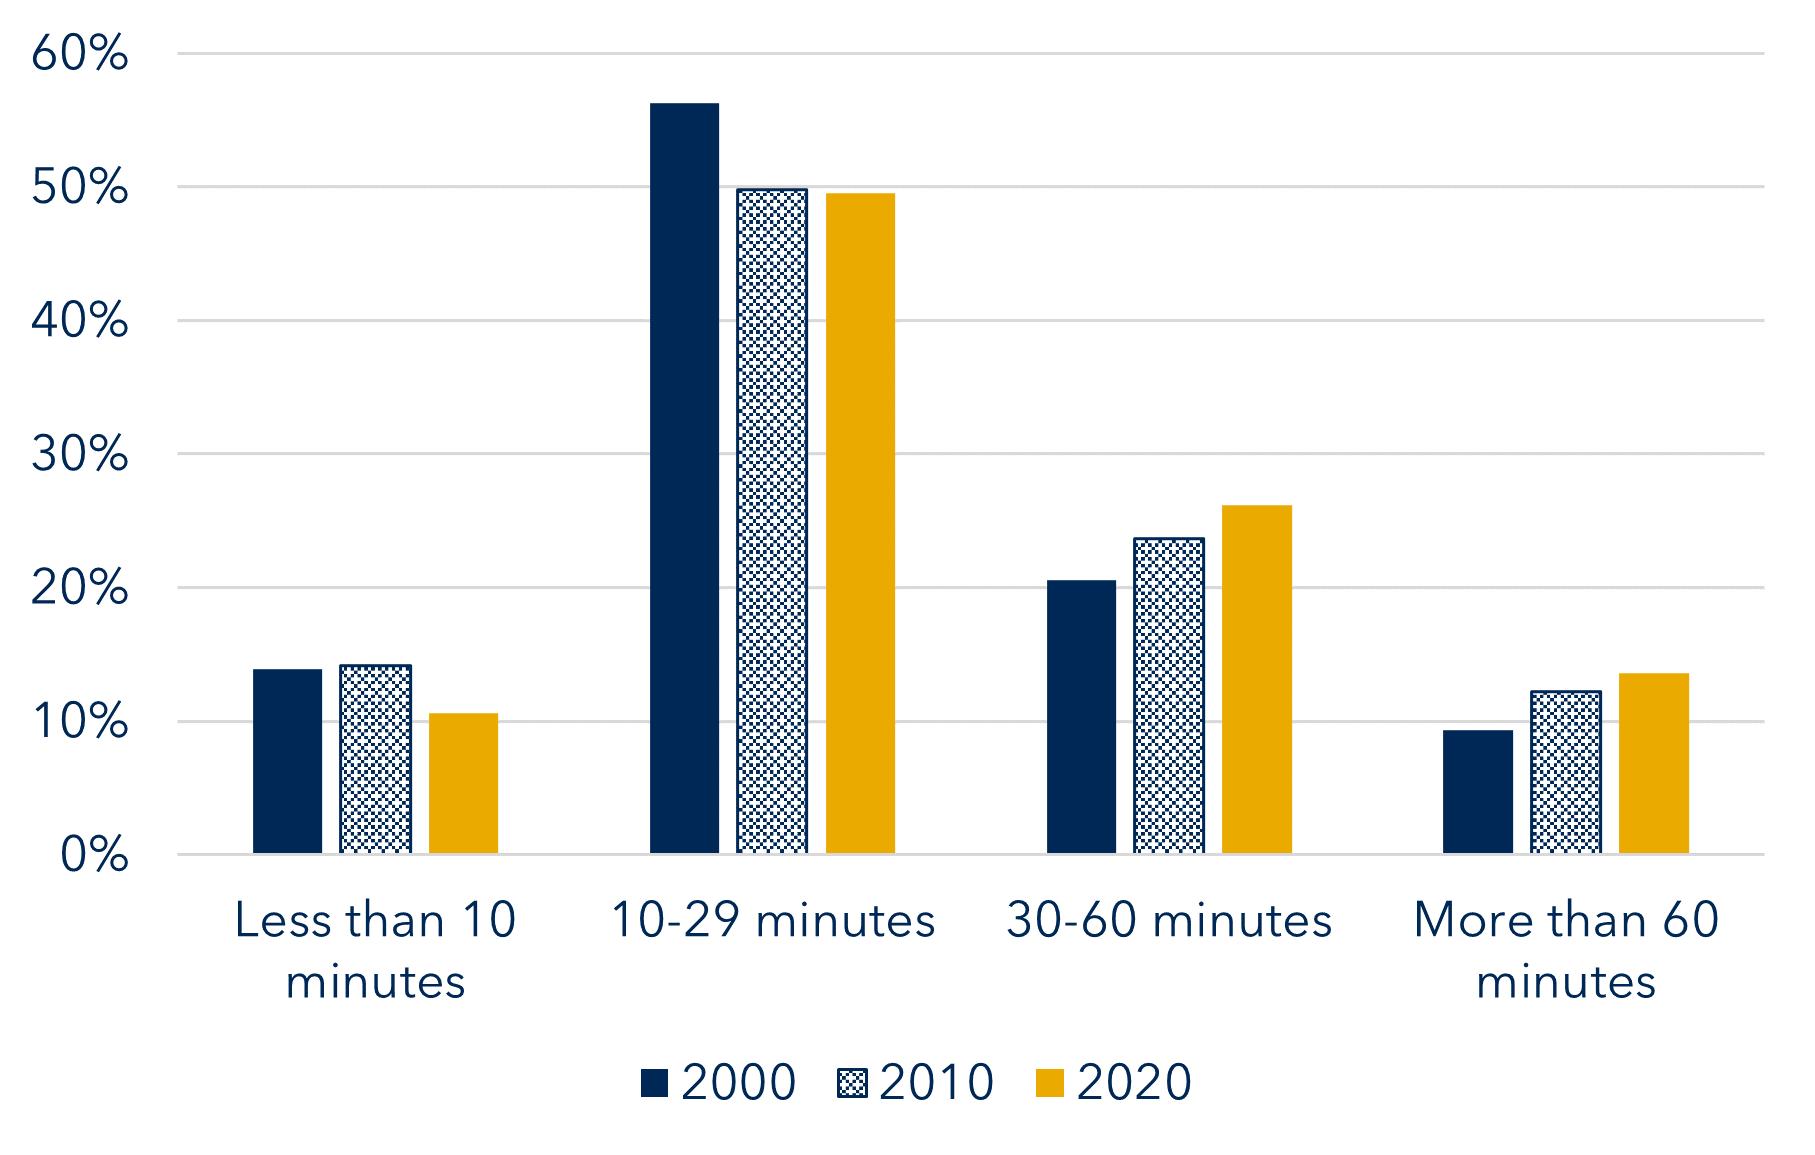
Source: U.S. Census Bureau SF3 (P031), 2010 & 2020 5-Year ACS
Commuting flows, which describe trip origins and trip destinations for Washington County workers (aged 16 years and over) as they carry out employment related travel, can be understood using information pulled from the U.S. Census Bureau’s On the Map 2020 dataset. This information is captured below on Map 7-1.
The Map first displays where Washington County workers reside, revealing that:
¾ 49% of all County workers also live in Washington County
¾ Franklin County, PA and Berkeley County, WV make up the most common points of residence for Washington County workers who do not live in our County
The lower portion of Map 7-1 then illuminates where Washington County workers journey for employment:
¾ 49% of all County workers work within Washington County
¾ Frederick County, MD is the most prevalent place of employment for those working outside of Washington County
¾ Washington County is within a reasonable driving distance of major regional employment centers found in the Beltway Region, such as Montgomery County, MD, which is the 2nd most common place of employment for our workers
A number of indexes have been developed which measure the true affordability of a place based upon measures of significant household costs which are assigned to specific categories. In the Housing chapter, for example, this was done through the use of U.S. Census data to determine what percentage of County households spend more than 30% of their annual household income on housing costs. Transportation spending represents another major expenditure that significantly affects the financial flexibility of households to meet their basic needs.
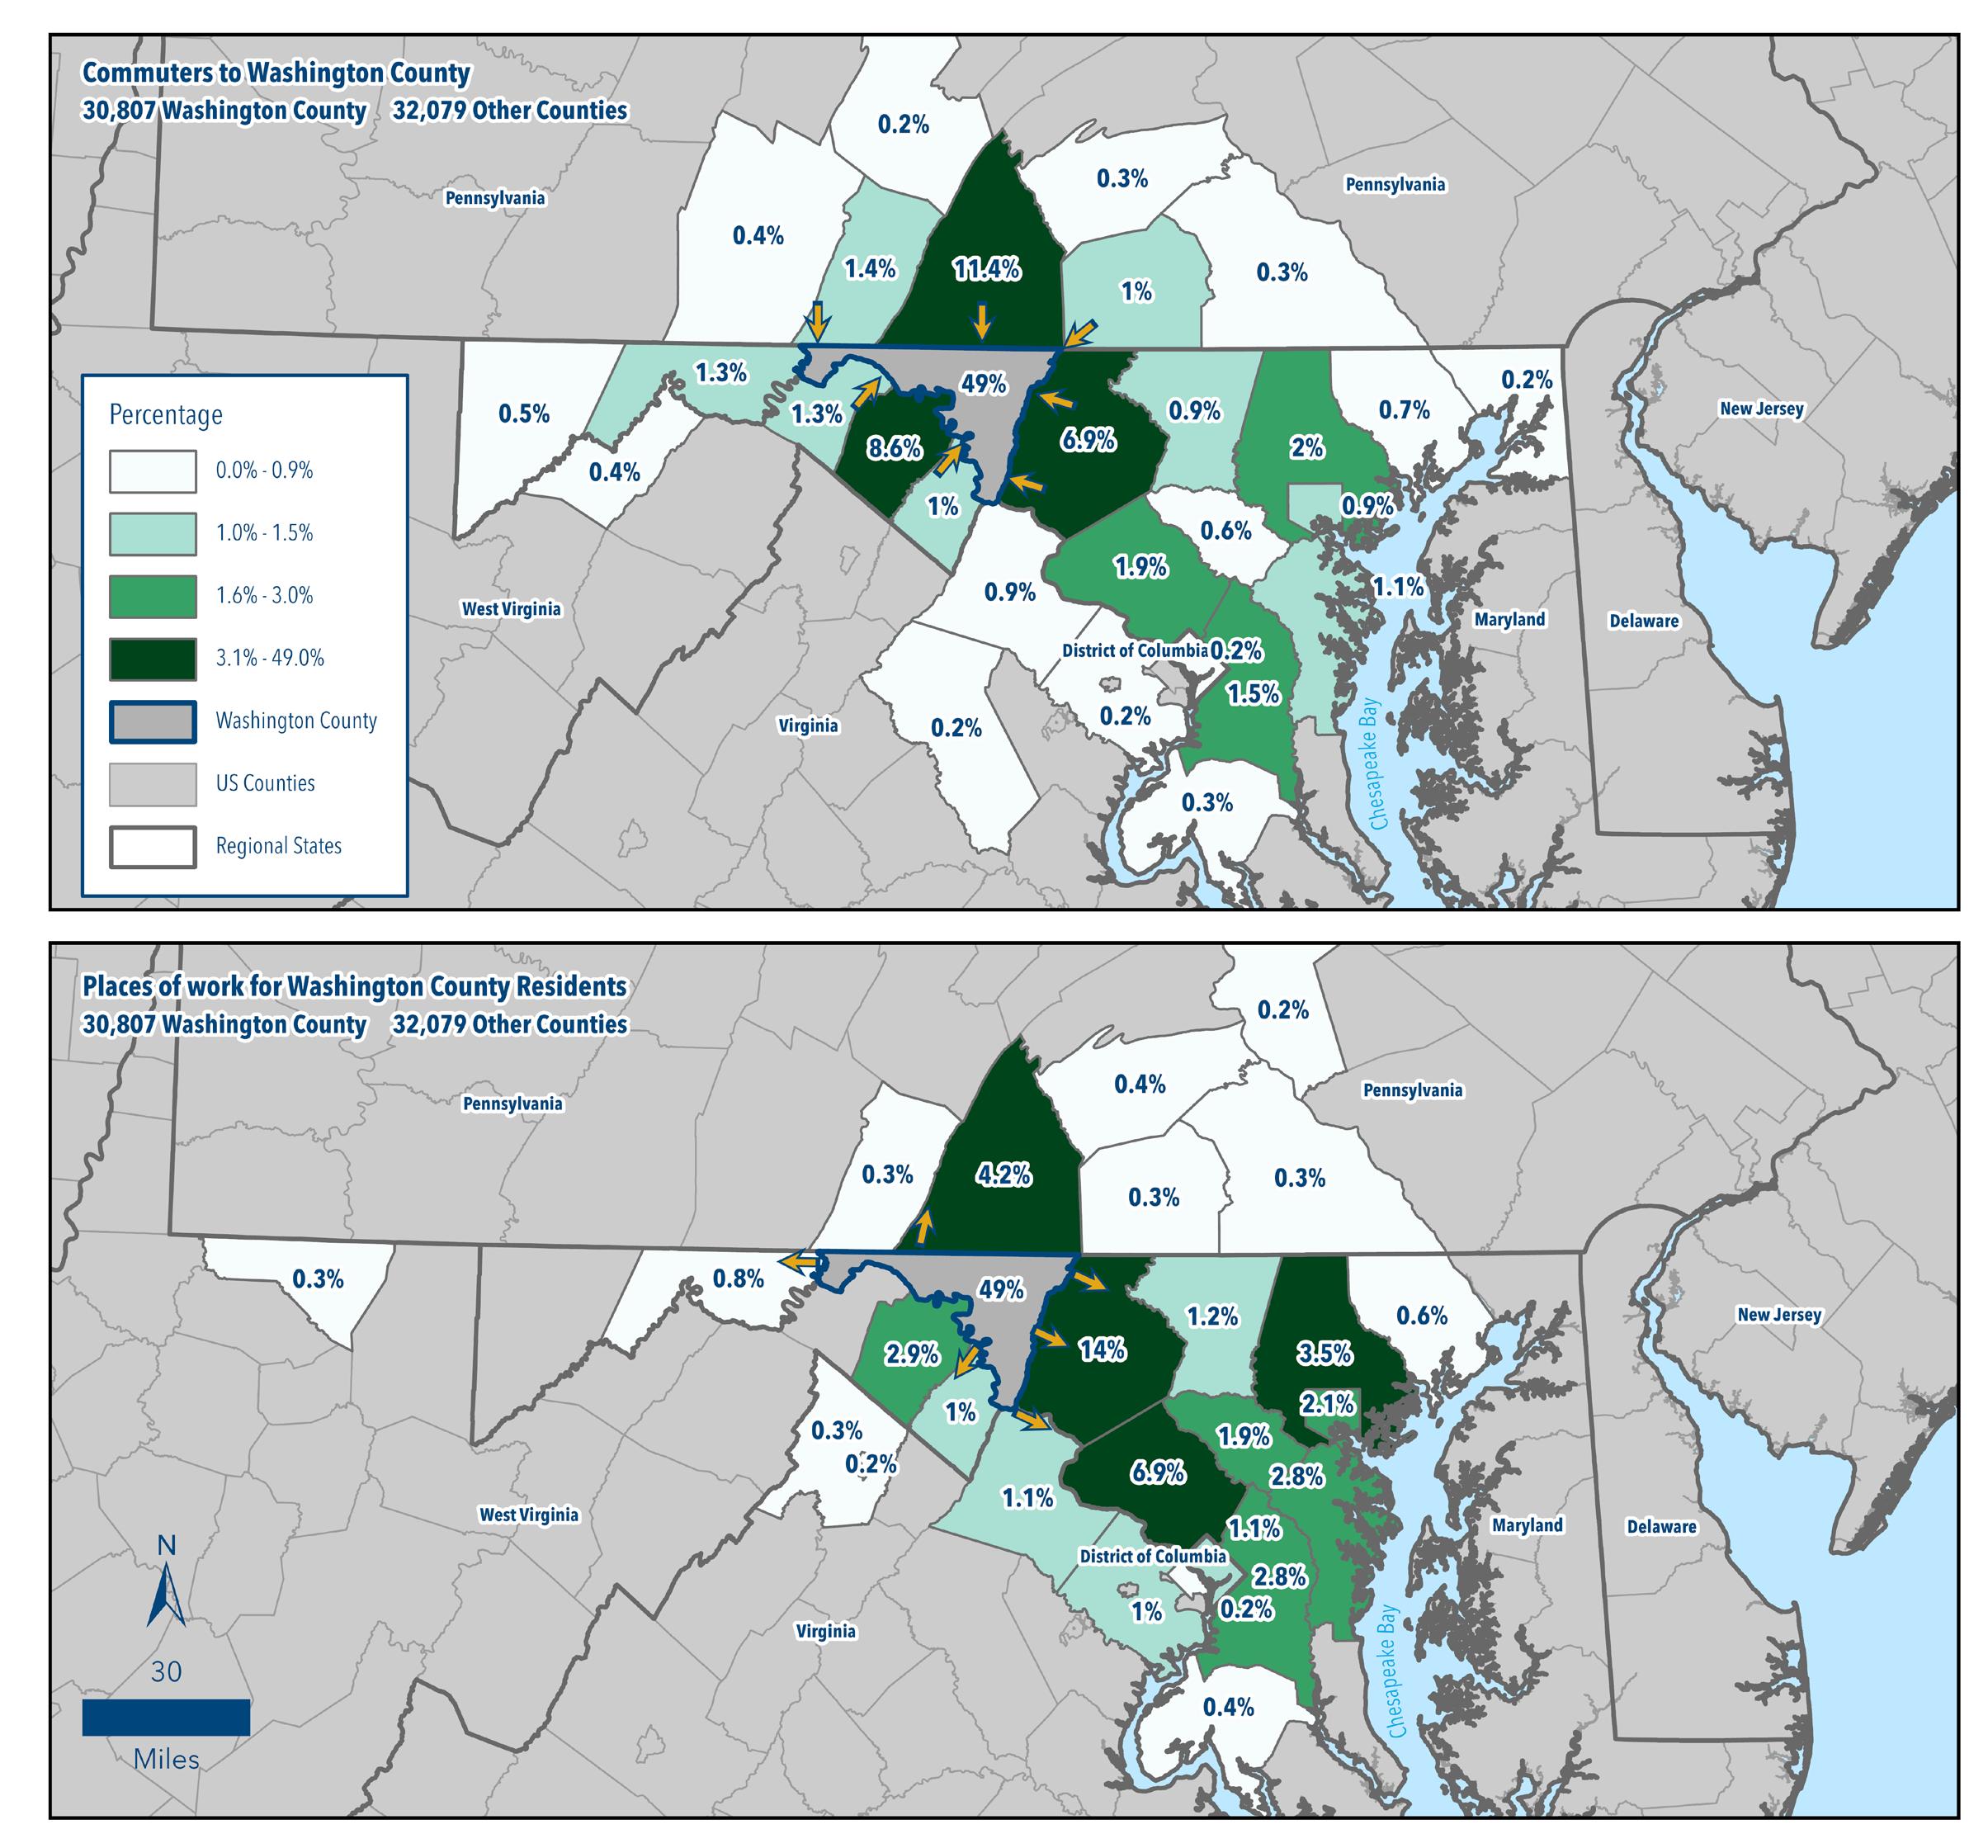
One of these indexes is the Center for Neighborhood Technology’s Housing and Transportation (H+T®) Affordability Index. The model uses a variety of data measures surrounding interrelated variables such as residential density, household income, auto ownership, auto use, and transit ridership to arrive at a benchmark for location affordability. The Index assigns a benchmark of affordability to no more than 45% of household income being spent on combined housing and transportation costs. The 45% annual household income limit assumes the 30% standard for housing expenses mentioned above plus an additional 15% towards transportation expenses. The model’s output is captured on the maps and table below.

Source: Center for Neighborhood Technology
Map 7-2, above, shows household transportation costs as a percentage of annual income. The map indicates that most households in Washington County spend far more than 15% of their annual income on transportation costs. As one might suspect, transportation spending is less for households within the municipalities of Washington County, where residential density is higher, and more transportation options exist to choose from. Correspondingly, transportation spending is higher in rural areas where the opposite characteristics exist. The average percentage of annual household income spent on transportation in Washington County is 23% according to data computed by the model. Select transportation statistics computed by the model are captured below in Table 7-1 below.
Source: Center for Neighborhood Technology
Map 7-3 then combines both annual housing and transportation spending for households into a single image to capture an overall measure of location affordability for Washington County. This map arrives at similar conclusions to the one above in that the overall 45% affordability standard for annual spending on these two costs is exceeded by the majority of County households. Forty-Nine percent is the average spending for County households on combined housing (26%) and transportation costs (23%) annually, according to the model.
Source: Center for Neighborhood Technology

For sake of comparison, the model computes the following combined housing and transportation costs for the neighboring counties listed below:
Allegany County, MD: 53%
Carroll County, MD: 49%
Frederick County, MD: 38%
Berkeley County, WV: 50%
Jefferson County, WV: 35%
Franklin County, PA: 48%
Overall, the statistics presented in this section depict Washington County as similarly affordable to other Counties in the region, most of which are also predominantly rural and auto-dependent in character. The annual household costs devoted by Washington County households to transportation and housing are, however, fairly high and likely burdensome to many residents.
The planning, design, construction, operation and maintenance of multi-modal transportation facilities represents a process that involves collaboration between Federal, State, regional and local entities. Standards and design concepts for such facilities are typically established at the Federal or State levels of government and then adapted to fit the local area’s travel conditions. Key concepts and standards for multi-modal facilities are included in the Appendix.
Being proximate to several major cities, particularly Washington D.C. and Baltimore, MD, Washington County contains several major interconnected transportation routes that serve motorists throughout the region. I-81 and U.S. 11 both run parallel to one another in a northsouth direction through the Great Hagerstown Valley in eastern Washington County. I-81 serves as the principal alternative to travel on I-95 and it is increasingly utilized by truck traffic looking to avoid congestion on I-95 while transporting goods throughout the eastern United States. Interstates 68 and 70 and U.S. 40/National Pike serve as the principal east-west transportation routes through the region. They connect Washington County to the Beltway Region in the east, as well as Western Maryland and cities throughout the Allegheny Region in the west. I-81 and I-70 intersect within the County’s designated Urban Growth Area, halfway between Hagerstown and Williamsport, spurring travel and economic activity throughout the region. State routes radiate from the center of the County towards the smaller towns and rural villages, providing numerous connections to neighboring jurisdictions.

The following section discusses the existing conditions of roadways in Washington County according to trends in travel, land use and safety. These measures incorporate data from the MPO’s most recent LRTP’s (Direction 2045 and Direction 2050) as well as Maryland’s current statewide transportation plan (2040).
The above referenced Plans provide insight on trends in vehicle miles traveled (VMT) in relation to population and/or employment growth. These indicators are typically correlated with each other and provide insight on travel choices Statewide, including Washington County. Chart 7-5, below, shows trends among these three measures in Washington County from 2000-2015.

Between 2000 and 2015, the 2045 LRTP describes a 10% growth rate in annual VMT during the 15-year period in Washington County. About 40% of that growth occurred on I-81 and I-70. Berkeley County, by comparison, saw annual VMT increase by 30% during the same period. The traditionally strong links between VMT, population and employment growth were less pronounced during this same 15-year period. During the height of the recession between 2007 and 2010, both VMT and employment experienced significant declines, while population continued a steady upward trajectory in Washington County.
The 2050 LRTP does not correlate VMT with population and economic growth, examining only trends in the latter two measures in regard to future travel demand and congestion. That Plan does note a resumption in population and economic growth in Washington County since 2015, which is projected to continue to 2050, as reinforced elsewhere in this Comprehensive Plan update. Continued monitoring of these three interrelated trends in response to changes in travel habits, lifestyle preferences and commuting patterns in the aftermath of the COVID-19 Pandemic will be necessary during the study period of this Plan.
SHA provides data on Average Annual Daily Traffic Volumes (AADT) which are counted at major intersections, entrances/exits, and other key routes that have been mostly consistent in their location throughout this study period.
As seen in Chart 7-5, below, notable changes have occurred at several of the survey points during the study period. For example, significant fluctuations in AADT counts occurred on I-70 at the Frederick County border between 2000 and 2010, on I-70 at the Pennsylvania border in 2000, and on I-81 at the Pennsylvania border between 2010 and 2020.
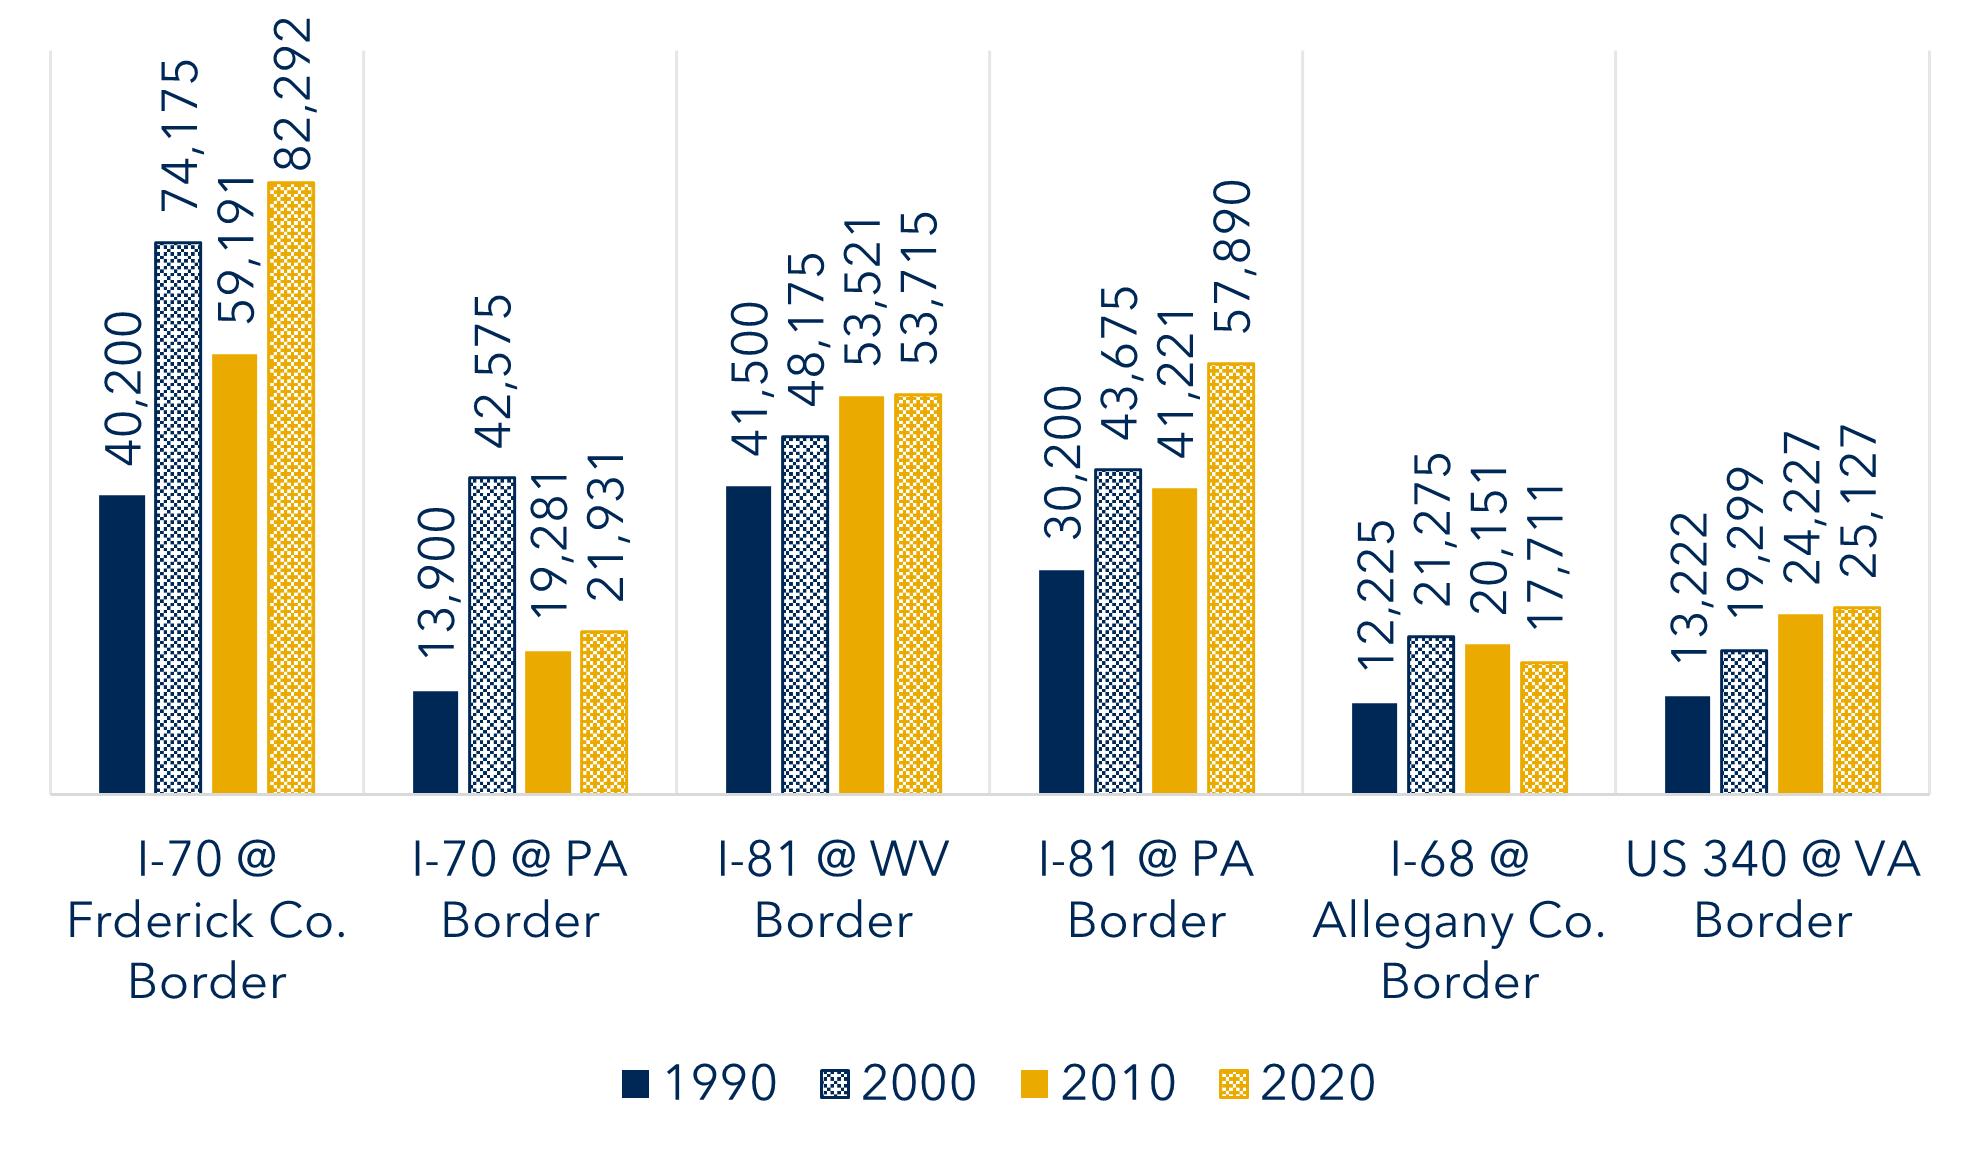
It’s important to distinguish between trends and spikes in AADT counts at these locations. For example, at the Frederick County border of I-70 and the Pennsylvania border of I-81, there are clear prevailing trends toward a steady, if temporarily interrupted, increase in AADT. The Pennsylvania border of I-70, in contrast, shows a one-time spike in AADT in 2000, before returning to historic count levels in the next decade. Traffic counts at specific locations can vary significantly due to numerous factors, including economic trends, major road construction projects, changes in employment and industry that influence commuting patterns and many other variables. Further, it should also be noted that these counts are for the major entrances/exits of the County where counts may fluctuate more significantly than at different count locations surveyed along the same roadway.
Chart 7-5 also helps to provide a general indication of traffic that is captured by or flows through Washington County. Most interstate traffic tends to enter Washington County from the east (on I-70) or the south (on I-81). Counts on these same interstate highways are much lower once they reach the Pennsylvania border, indicating that some traffic then either remains in Washington County or diverts onto other travel routes leading from these arterial roads to points inside or outside the County. Of the traffic that stays in Washington County, the 2050 LRTP indicates that the top vehicle trip connections are almost entirely found within the County’s designated Urban Growth Area surrounding the City of Hagerstown. Trips leaving the region are most frequently heading to Frederick County, MD or Franklin County, PA, according to the LRTP.
Maryland is tied with the State of New York for the longest commuting time in the nation with an average commute of 32.3 minutes.1 While much of this congestion is heavily centered around the Baltimore/Washington D.C. areas, Washington County is also experiencing increasing issues with delayed travel times, particularly on I-81 and I-70.
The MPO’s 2045 LRTP indicates that 40% of the increase in annual vehicle miles traveled (VMT) between 2000 and 2015 occurred on these two major transportation routes. Interstate travel on I- 81 and I-70 accounted for 50% of average daily VMT in 2015. By 2040, the MTP projects a 50% or greater increase in the Travel Time Index (TTI) along the entire length of I-81 through Washington County and on I-70 from the County’s eastern boundary to its intersection with I-81 near Halfway. TTI measures congestion conditions on individual road segments by comparing travel times with and without congestion. A TTI of 2.0 or above describes a 10-minute trip in light traffic that would take 20 minutes in heavily congested conditions. Lesser, but still significant increases in TTI, are expected for the remainder of I-70 from the I-81 intersection to its junction with I-68 near Hancock. Map 7-4 shows the projected increase in TTI throughout Maryland by 2040.
Source: Maryland Statewide Transportation Model 2015

Accordingly, due to both of these congestion projections as well as associated safety concerns for motorists, interstate widening and interchange improvements on these two major transportation routes are top priorities in the County’s 2022 Priority Letter to MDOT for consideration in its current CTP. Specifically, the 2022 letter discusses phased widening of the entire length of I-81 through the County and interchange improvements at the intersection of I-70 and MD-65. Significant amounts of both residential and commercial development have occurred in the immediate vicinity of this interchange in the last 20 years, particularly the completion of a second Walmart in Hagerstown as well as the steady buildout of the Westfields subdivision. This development has positively contributed to the County’s tax base, but has also increased congestion at and around this major intersection to a notable degree. The top congested corridors were noted in the MPO’s 2050 LRTP and displayed in the table below.
Source:
In 2019, the MPO completed a Regional Traffic Safety Study of the Hagerstown/ Eastern Panhandle Metropolitan Planning Area. The Study was done to monitor and assess regional traffic safety using the latest available crash data and public input, building upon the goals and strategies of the Maryland and Washington County Strategic Highway Safety Plans. The conclusions of this study, as well as further safety monitoring efforts, are incorporated into the short and long-term needs identified in the MPO’s TIP and LRTP.
Using five-year crash data from MDOT and from the National Highway Traffic Safety Administration Fatality Analysis Reporting System, the Study offers a wealth of information on corridors and intersections with safety concerns that affect land use planning decisions. Map 7-5, shows the top 10 corridors and intersections with safety concerns due to the total number or rate of crashes, injuries or fatalities.

Traffic corridors with major safety concerns are shown on the map and table above. These corridors include U.S. 40 eastbound (between Tracy’s Lane and Mt. Aetna Rd), I-70 eastbound (near the I-81 interchange), Halfway Boulevard (from Virginia Avenue to the I-81 entrance/exit) and Sharpsburg Pike (just north of the Town of Sharpsburg by Antietam National Battlefield). Those corridors highlighted in red in the table have been identified for improvement projects in the MPO’s TIP and LRTP.

Functional classification is the process by which streets and highways are grouped into classes, or systems, according to the character of the service they intend to provide in moving the public through the transportation network. The goal of this hierarchy is to facilitate transportation movement in an efficient and cost-effective manner.
Classification is based upon the mobility and accessibility of any given roadway. As alluded to previously, mobility is measured by the ability of traffic to pass through a defined area in a reasonable amount of time. Accessibility is measured in terms of the road system’s ability to provide access to and between land use activities within a defined area. Other factors, such as trip length, speed limit, traffic volume and vehicle mix also play a role in a road’s functional classification.
According to Federal guidelines, there are three primary classification categories that are used: Arterial, Collector, and Local. In general, the difference between Arterial, Local and Collector roads in terms of mobility or accessibility can be described by the following characteristics. Arterials provide a high level of mobility. Local roads provide a high level of accessibility. Collectors strike a balance between mobility and accessibility. These terms are more precisely defined in the classification below:
Washington County’s Functional Classification system is shown on Map 7-6 and defined on the accompanying table of Highway Standards below:
Map 7-6: Functional Classification of Roadways

new property access points. Street jogs less than 150’ not permitted
(1) Engineering data listed herein shall be considered a guide only. Specific design requirements are contained in the appropriate Washington County design standards.
(2) Mean traffic is expressed in ADT (Average Daily Traffic) or the number of vehicles passing a given point in both directions within a 24-hour period. Values shown are typical ranges only and are not to be used to determine particular road classifications. Existing and/or projected volumes are to be used to determine the number of traffic lanes required for a particular road.
(3) Standards for access spacing and right-of-way widths are enforced through the Subdivision Regulations. Right-of-way wider than the minimum may be required especially when accommodating multi-lane highways.
(4) Residential properties are generally restricted to one access per lot. A second access may only be permitted if reviewed and approved by the County Engineer due to extenuating circumstances.
Access management involves proactively controlling vehicle access to land adjacent to roadways of various classifications in order to achieve efficient and safe traffic flow. This management encompasses a range of spacing, design and location strategies such as limited access points on major arterials, driveway consolidation, dedicated turning lanes, roundabouts, median treatments, right-of-way preservation, and many others. By reducing the number of conflict points along a roadway, the friction between local and through traffic is lessened, improving the overall functionality of the transportation network.
Access management standards on streets and highways are detailed in the table above. Access points location criteria are also described in Article 4 of the Washington County Subdivision Ordinance (Article 405.2). Right-of-way preservation is also discussed in Section 4.7 of the Washington County Zoning Ordinance.
Map 7-7, below, shows priority roadway projects identified within various State, regional and local transportation plans, including Maryland’s CTP, the MPO’s LRTP and TIP, and the County’s CIP. These projects include intersection improvements, new or reconstructed roads and road widening.
Map and Key 7-7: Highways Plan

The MPO’s Fiscal Constraint Plan requires the identification of projects that are reasonably expected to receive funding during the time frame of the LRTP (Direction 2050). Not all of the region’s project needs can be included in the Fiscal Constraint Plan as a result of the funding gap between project costs and anticipated funding. Therefore, the prioritization results and year of expenditure project cost estimates are critical in determining the constraint portion of the plan. The Fiscal Constraint Plan is displayed in the table below.

Being proximate to several major cities, particularly Washington D.C. and Baltimore, MD, the Washington County Transit Department (WCT) provides public transit for the County, primarily through the County Commuter bus system. The system runs 19 vehicles along nine fixed routes, shown below on Map 7-8, that originate in Hagerstown and serve destinations in Funkstown, Halfway, Long Meadow, Maugansville, Robinwood, Smithsburg and Williamsport. In addition, WCT provides transportation for the elderly and persons with disabilities through a ride assist voucher program and ADA compliant Paratransit Service for individuals with disabilities who cannot access fixed-route service. Total yearly ridership for all programs totaled 516,543 passenger trips and more than 518,385 miles, prior to the COVID-19 Pandemic.1 Ridership was at approximately 75% of pre-Pandemic levels at the time of the County’s 2022 Priority Letter to MDOT.
Source: Washington County Transit Department

Regional transportation connections are also available from Washington County Transit facilities or services. Greyhound bus service picks up at the Washington County Transit Center in Hagerstown and from the Hancock Truck Plaza providing connections to numerous places in the region. Additionally, the Premium Outlets route of the County Commuter makes a stop at the Motor Vehicle Administration Park and Ride near the Walmart on Sharpsburg Pike. From this Park and Ride lot, residents can pick up the Maryland Transit Administration Route 505 commuter bus service that operates between Hagerstown, Frederick, the Shady Grove Metro Station and Rock Spring Business Park in Bethesda, Maryland. In addition, the Bay Runner Shuttle, a private shuttle service which makes a stop at the County Commuter Transit Center in downtown Hagerstown, takes passengers from across the State to BWI Airport, BWI Amtrak and the Baltimore Greyhound Bus Station.
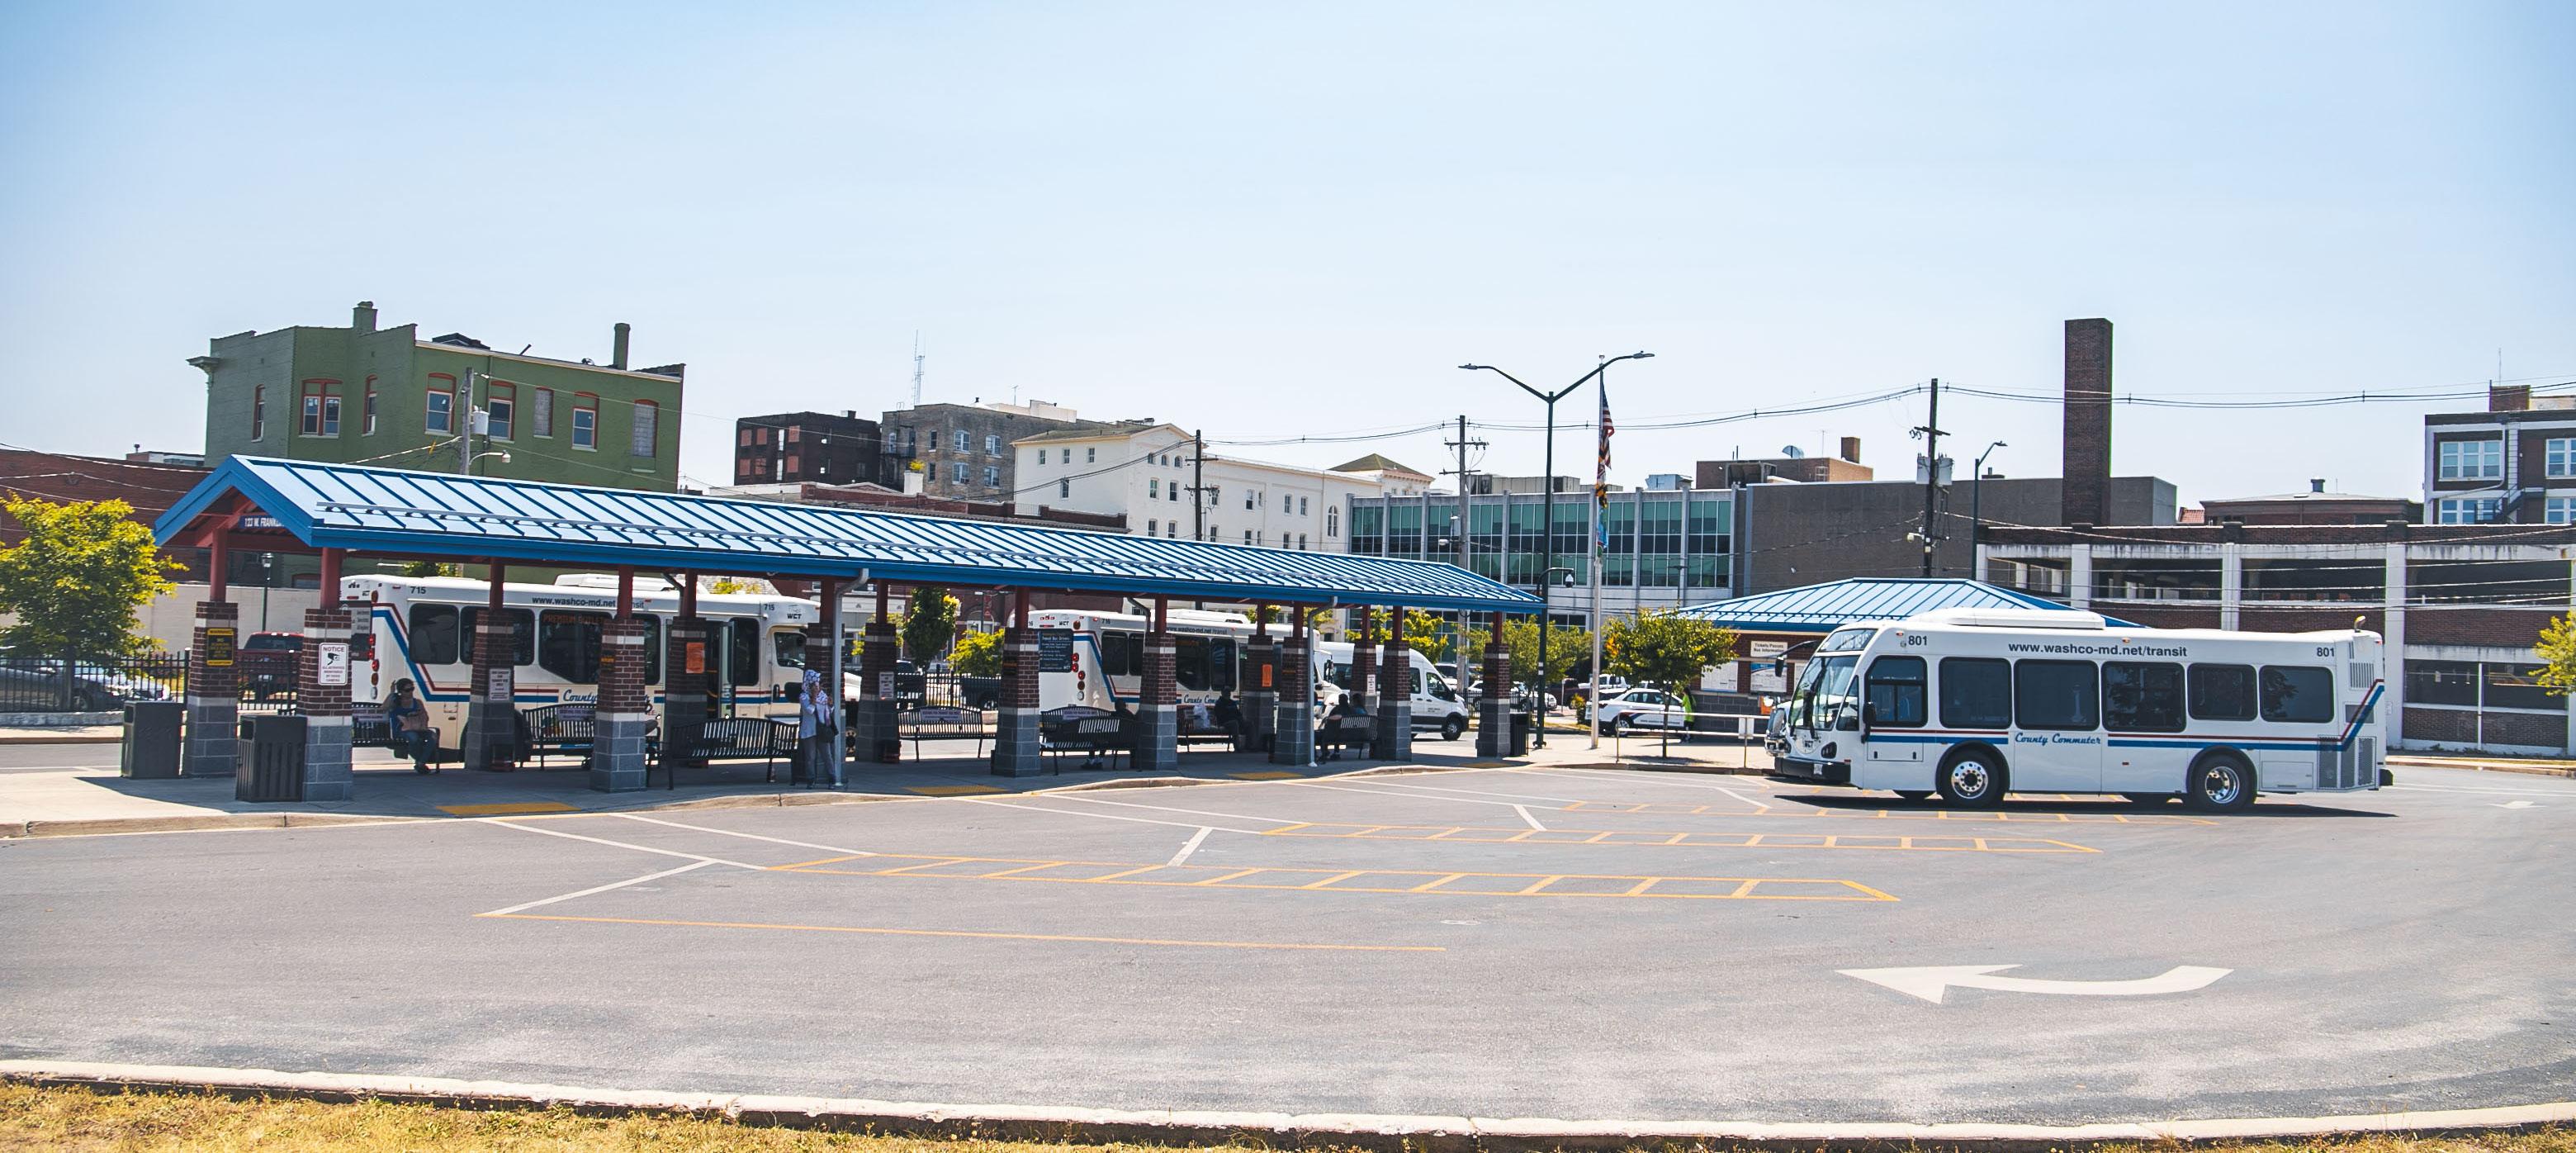
In addition to Washington County Transit, numerous other organizations provide human services transportation to transit-dependent populations. These organizations include the ARC of Washington County, Easter Seals Adult Day Services, Horizon Goodwill Industries, United Cerebral Palsy of Central Maryland, Washington County Commission on Aging, Washington County Department of Social Services, Washington County Health Department, Washington County Mental Health Authority and the Washington County Community Action Council.
The Community Action Council, for example, provides employment, disability and medical appointment transportation for the elderly, low-income individuals, and individuals with disabilities through its Community Action Transit (CAT) program. This program includes free employment shuttle service, The Hopewell Express, which serves employees of Hopewell Road businesses from downtown Hagerstown. This shuttle service to one of the County’s major employment centers operates hourly, 24 hours per day, Monday – Friday with final drop offs occurring early Saturday morning. Transportation is provided by the CAC to both local medical appointments and Baltimore and Washington D.C. hospitals.
Washington County does not offer passenger rail service. It is, however, within less than an hour’s drive from a number of commuter rail stations in Frederick County, Maryland on the MARC Brunswick Line in addition to the Harpers Ferry and Martinsburg, West Virginia stations.
In 2020, the MPO updated its Transit Development Plan to analyze current public transportation services, project future needs and identify areas for improvement over a five-year planning period. The Plan makes numerous recommendations concerning transit service improvements for Washington County, including the identification of where transit needs are the highest. These areas are displayed on Map 7-9, located below.
Source: Washington County Transit Development Plan (2020)

The areas with the highest need for transit were heavily centered in the County’s designated Urban Growth Area that surrounds the City of Hagerstown. Specific locations of need identified on the map include several census tracts within Hagerstown, the Robinwood and Fountainhead-Orchard Hills areas, and the Towns of Funkstown, Smithsburg and Williamsport. Other areas of the County which currently have no transit service, such as western and southern Washington County, also showed great need when looking at specific measures within the larger Transit Dependence Index.1 The transit needs assessment was done at the Census Tract and Block Group levels according to the following characteristics:
• Population Density
• Auto less Households
• Elderly Population
• Youth Population
• Below-Poverty Level Population
In addition to those areas identified in the Transit Development Plan, the MPO’s LRTP also identified service gaps during peak or all-day periods between Hagerstown and Clear Spring, Hagerstown and Boonsboro, and near the I-70/MD-65 interchange where considerable development has occurred recently.
The 2020 Transit Development Plan offers the following recommendations for service improvements to Washington County Transit, assigned to short, medium and longterm time horizons:
• Enhance on-time performance through interlining bus routes (ShortTerm)
• Enhanced marketing to better promote transit services (Short-Term)
• Hire additional transit staff (Medium-Term)
• Incorporate Hopewell Express into Washington County Transit (MediumTerm)
• Develop Smartphone Payment App (Long-Term)
• Introduce Sunday Service (Long-Term)
• Create Boonsboro to Hagerstown Route, with potential to serve points beyond (Long-Term)
• Provide system-wide evening service (Long-Term)
Human services transportation refers to meeting the mobility needs of people with disabilities, senior citizens, veterans, individuals with low incomes and young people without access to transportation. Human services transportation plans are created to receive Federal funding for these needs in order to provide transportation for these target populations beyond what is provided by traditional public transit and paratransit services.
In 2019 a study was prepared for the Maryland Transit Administration to address human services transportation for the Western Maryland Counties of Allegany, Frederick, Garrett and Washington. The study identified the following needs for Washington County:
• More wheelchair-accessible vans and better coordination among agencies to access the existing fleet of accessible vans.
• Expanded transit availability to access employment opportunities, including evenings, weekends, and holidays.
• Improved communication and coordination between provider agencies and clients to better plan, schedule and operate trips based on available capacity.
• Additional administrative funding to support expanded operations.
• Supervisory body over coordinated services to ensure funded projects are being implemented.
• Additional transit options to meet transit needs outside of the current County Commuter service area, including some new residential developments.
• Expanded transit availability for all trip purposes on weekends.
• Additional operational funding, including potential cost sharing between the City and County for County Commuter Services.
• Additional marketing and advertising program for County Commuter.
• Additional funding programs for people who do not qualify for specific governmental assistance programs, including a taxi voucher program.
• Additional transit services in the evenings for all trip purposes.
• Additional transit availability for the Hopewell Road area, where several distribution centers have been built.
• Additional transit availability for dialysis trips.
Washington County is fortunate to have an extensive network of facilities serving bicyclists, pedestrians and recreational trail users throughout its borders. Significant investments have been made by Federal, State and local entities to provide on and off-road infrastructure for these travel modes. These facilities are displayed on the map below and described in greater detail in the sections that follow.
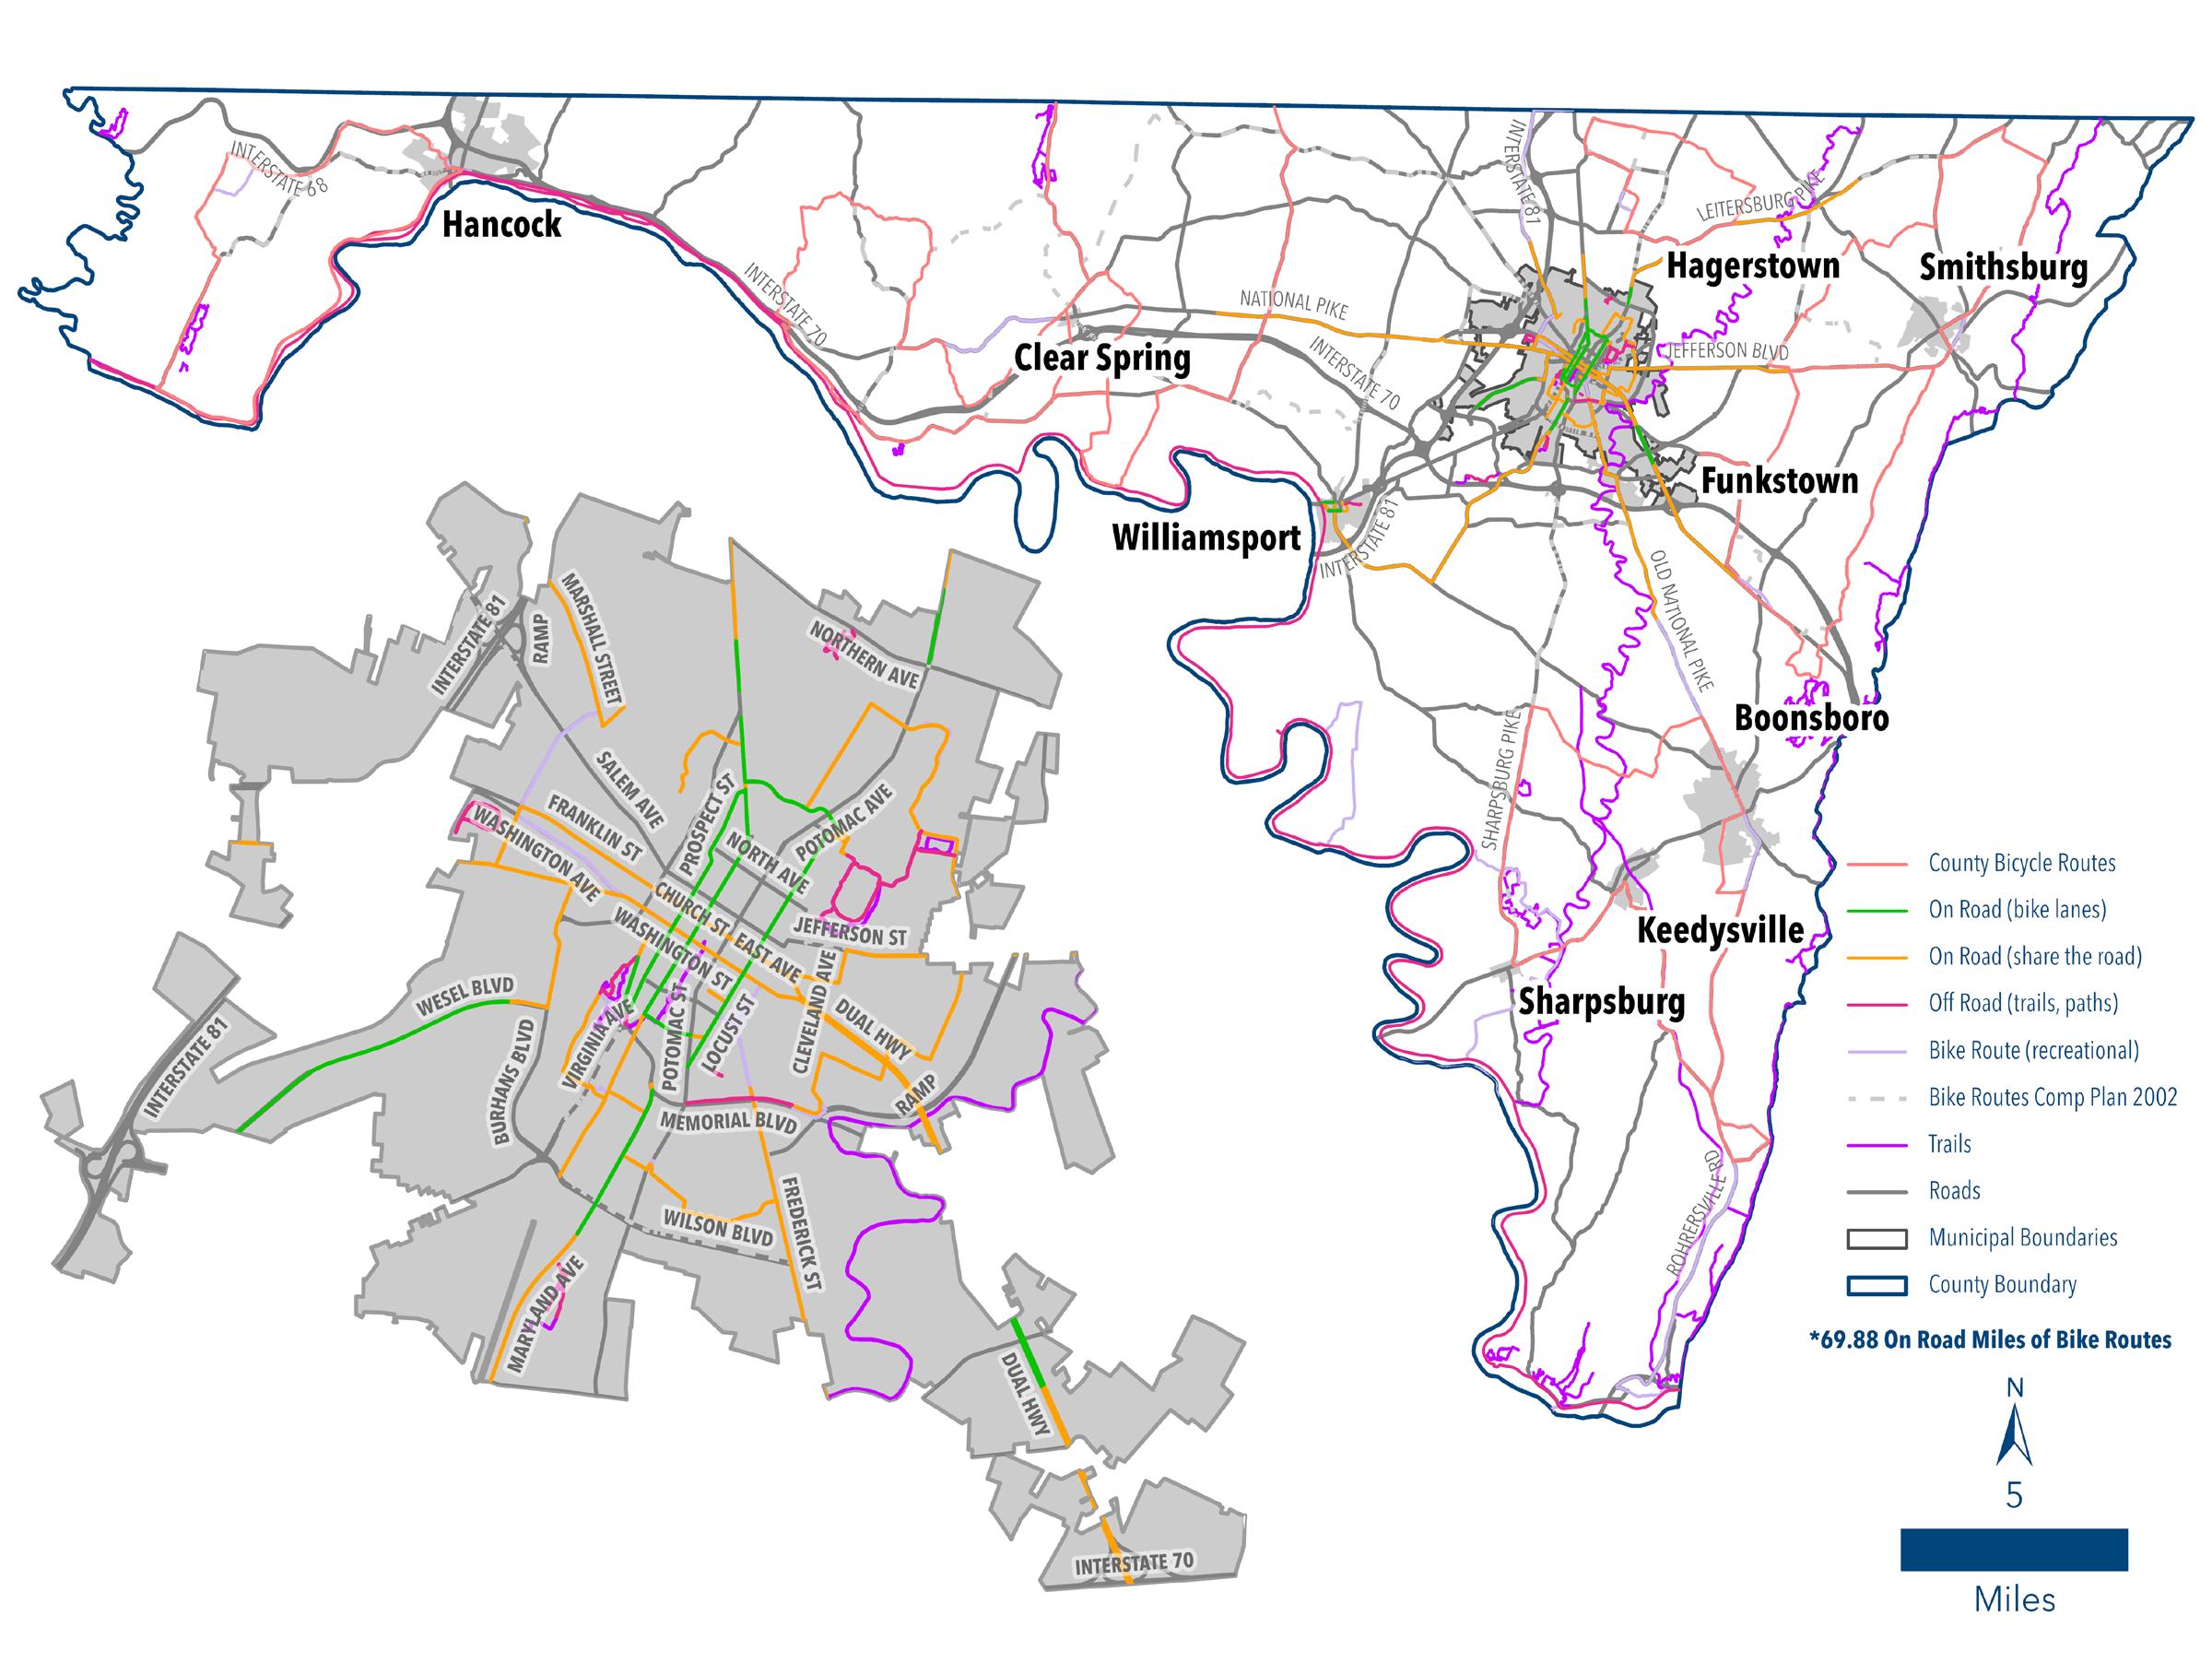
Washington County is home to two U.S. Bicycle Routes, one National Scenic Trail reserved for pedestrian travel, and a nationally recognized multi-use trail that is part of a linear historic park. These facilities include:

• U.S. Bicycle Route 50 – Signed multi-state bike route that runs through Washington County as it travels between Washington D.C. and San Francisco, California.
• U.S. Bicycle Route 11 – Signed multi-state bike route traveling northsouth from the Washington County/Pennsylvania border to northwestern North Carolina. USBR11 has been designated since 2014, but the preferred route is still being finalized.
• Appalachian National Scenic Trail – 41 miles of the trail’s more than 2,000-mile length between Georgia and Maine, run along the County’s eastern boundary atop South Mountain.
• C&O Canal Towpath – Multi-use trail running through the linear C&O Canal National Historic Park, roughly 80 of the 184-mile trail runs through Washington County between Sideling Hill and Sandy Hook. The C&O Canal Towpath connects with the Great Allegheny Passage (GAP) Trail in Cumberland, Maryland, where it continues another 150 miles before terminating in Pittsburgh, Pennsylvania.
• Harpers Ferry National Historic Park and Antietam National Battlefield – While primarily parks whose mission is focused in providing historic preservation and interpretation, Harpers Ferry and Antietam offer more than 30 miles of hiking trails, as well as connections to longer distance trails like the Appalachian Trail and C&O Canal Towpath.
The State of Maryland retains jurisdiction over on and off-road bicycle facilities along State highways and select abandoned rail corridors. The State also has a robust network of recreational trails in the State Parks found throughout Washington County. These facilities include:

• The Western Maryland Rail Trail in Hancock - A plan to extend the Western Maryland Rail Trail could be approved by the National Park Service by August with construction of a portion of the extension possibly beginning later this year. The entirety of the present 23 mile off-road, converted rail trail occurs within Washington County between Fort Frederick State Park and Sideling Hill Ridge near Hancock. The trail is open to cyclists and pedestrians.
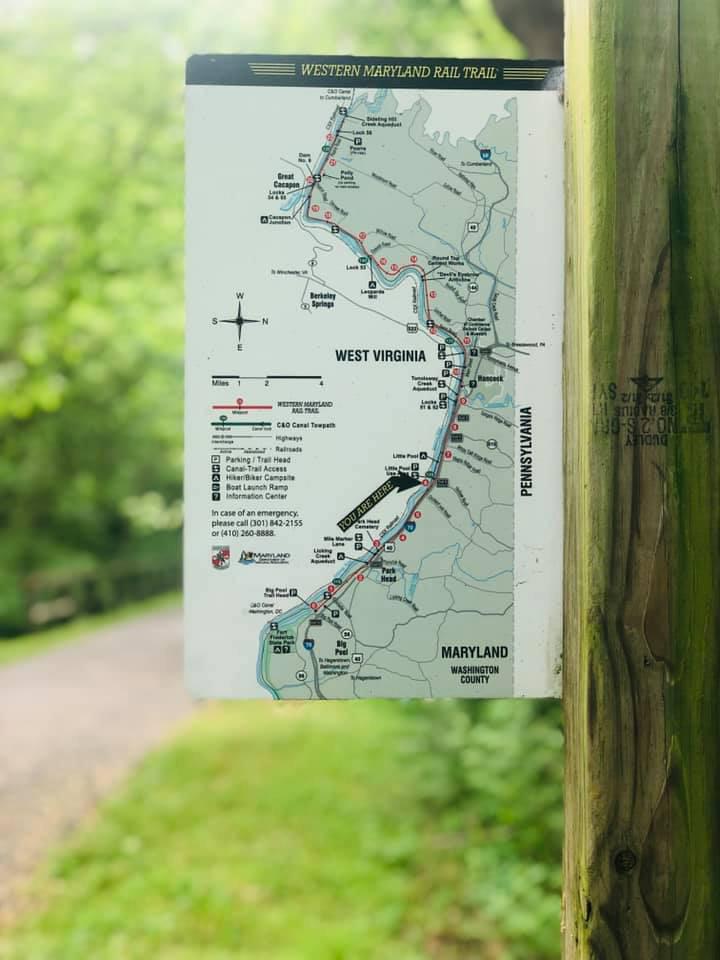
• On-Road Bicycle Facilities - Outside the City of Hagerstown, many State highways provide shared road space for bicycles. These include MD 60, MD 64, MD 68, MD 632, U.S. 40, and U.S. Alt-40. While these facilities are classified as ‘shared lanes’, a de facto bike lane is created by the wide paved shoulder present on portions of the above roadways. At present however, only the connection between Hagerstown and Williamsport along MD 632 and MD 68 provides dedicated shoulder space the entire way between two distant municipalities. There are approximately 61 miles of paved shoulders with space for bicycle usage along these State routes in Washington County.
• State Parks – Fort Frederick, Gathland, Greenbrier, South Mountain, South Mountain Battlefield and Washington Monument State Parks are all contained partially or completely within Washington County. These parks offer dozens of miles of hiking trails within their borders as well as connections to long-distance multi-use paths such as the C&O Canal Towpath, Western Maryland Rail Trail, and the Appalachian Trail. Mountain biking is allowed on the trails at Greenbrier State Park. State Wildlife Management Areas (WMA) and Natural Resource Management Areas (NRMA) found within the County, such as Indian Springs WMA and Woodmont NRMA, also offer some trails that are open to the public.
The City of Hagerstown provides on-road bicycle facilities of various types, multi-use paths and a robust network of pedestrian facilities. These facilities occur on or along City streets, State highways that run through the municipality, and within City parks. Hagerstown, as noted earlier, was named a “Bicycle Friendly Community” by The League of American Bicyclists at the Bronze level in 2014. The City had approximately 28 miles of existing bicycle infrastructure by 2016, which represented a 50 percent increase since 2010. Hagerstown has also designated a signed 10-mile bike loop within its boundary that utilizes on-road and off-road bicycle infrastructure, dubbed the Hub City Bicycle Loop.
Existing bicycle, pedestrian and recreational trail facilities under the jurisdiction of Washington County tend to occur within residential neighborhoods in the Urban Growth Area or within County parks. The County has also designated eight recreational bicycle routes comprising a 186-mile network of rural roads which provide an outstanding look at the scenic and historic nature of the local landscape. These routes are not currently signed, but a brochure produced by the Hagerstown and Washington County Convention and Visitors Bureau maps the routes geographically and provides detailed directions and descriptions of each tour.
The County’s partnership with the Maryland Public Access, Water Trails, and Recreation Planning program has been used to build upon existing water trails designated by the State of Maryland. The most prominent water trail is the Upper Potomac River Water Trail which spans from Shepherdstown, WV to Cumberland, MD. This trail provides an invaluable resource for paddlers, boaters, and anglers. Most of the nine primary tributaries that drain into the Potomac River have sections which are navigable as well. Among these tributaries, the County has focused its greatest efforts to develop true Water Trails along the Antietam and Conococheague Creeks. Of these two waterways, development of the Antietam Creek Water Trail has advanced the furthest with access to the Creek being provided at 11 different points throughout the County.
Aside from the long-range transportation plans already referenced throughout this chapter that briefly cover active transportation modes as part of their intermodal survey, a number of studies specifically looking at bicycle and pedestrian needs within Washington County have been conducted by the MPO or the City of Hagerstown. These are briefly described below.
Dual Highway Speed Management Study (2022)
Following a number of pedestrian fatalities along the Dual Highway in Hagerstown, Maryland, a pedestrian road safety audit (PRSA) review process was undertaken. The study limits were between Cannon Avenue and Redwood Circle in Hagerstown. A PRSA is a formal procedure for assessing accident potential and safety performance for an existing roadway section. The PRSA review process consisted of a multidisciplinary audit team of professionals representing City and County engineers and planners, SHA representatives from highway, planning and pedestrian sections, as well as City, County and State law enforcement, the Hagerstown/Eastern Panhandle MPO and its consultants. The study recommended numerous short and long-term improvements, including curb extensions, crosswalk markings, pedestrian signals, education and enforcement campaigns and more.
In 2022, another study of Dual Highway aimed to identify safety recommendations to reduce traffic-related serious injuries and fatalities. Study limits were from Cannon Avenue east to Cleveland Avenue along US40/Dual Highway in the City of Hagerstown. Turn movements, pedestrian counts, traffic analysis, land use context and signal timing were all evaluated, along with various design interventions. This Study was one of the recommendations for further investigation in the 2020 Hagerstown Bicycle and Pedestrian Priority Area Plan detailed below.
HEPMPO developed the Regional Bicycle Plan to outline bicycle needs and priorities for the region. The Plan identified mobility and safety needs, evaluated existing conditions, recommended specific improvements for key linkages, and highlighted anticipated costs and potential implementation funding sources.
Hagerstown is recognized as a “Bicycle Friendly Community” in Maryland and this updated Plan looked to build on the momentum generated by their 2010 Bicycle Master Plan. The Plan was a collaborative effort between the City of Hagerstown and HEPMPO that sought to introduce new ways to evaluate the City’s existing and proposed bicycle infrastructure and amenities, such as bicycling comfort and potential demand, as well as identifying implementation strategies for priority projects.
The concept of Bicycle and Pedestrian Priority Areas (BPPA) was created to emphasize planning for areas with a high potential of bicycling and walking. The purpose of the Plan was to identify bicycle and pedestrian existing needs, safety concerns, challenges, and potential improvements within the study area of Hagerstown’s urban center. This Plan was developed by the MDOT SHA in partnership with the City of Hagerstown and HEPMPO. Existing conditions of roadways, bicycle facilities and pedestrian facilities were assessed, along with analysis of recent crash history. Assessments and analysis led to site-specific recommendations, identification of best practices, detailed discussion on sidewalks and facility-type descriptions.
The League of American Bicyclists, a national bicycle advocacy organization, has developed a “Bicycle Friendly” designation for communities, businesses, and universities. This certification is awarded by the organization only to communities that have made substantial commitments to bicycling through a multi-pronged framework of design and policy interventions known as the Five “E’s”. The Five “E’s” stand for: Engineering, Education, Encouragement, Enforcement, and Evaluation. Equity was recently added as the sixth “E” to this framework.
Interested parties work to complete an extensive application and questionnaire which encompasses a range of “Bicycle Friendliness” with the hope of being awarded this designation. The achievement of this certification is useful not only as a marketing tool, but also as a framework for making measurable progress towards improving conditions for bicyclists. Feedback provided in response to the submission of an application illuminates deficits in existing conditions for bicyclists and how they could concretely be improved through various methods.
As noted, the City of Hagerstown achieved bronze level certification as a Bicycle Friendly Community in 2014 and is working towards the silver level designation. Though the “Bicycle Friendly” designation is not available for counties, it could still be an excellent way for Towns, colleges and businesses in Washington County to improve conditions for bicyclists while pursuing the award. The six E’s approach is an outstanding way to promote inter-jurisdictional cooperation by involving many entities from the public, private, and non-profit sectors who can work to collaboratively address the provision of non-motorized transportation options that enhance local quality of life.

Numerous sources exist for local jurisdictions to apply for Federal or State funds to help plan, design and build bicycle and pedestrian projects throughout Maryland. Discretionary grant programs administered by MDOT include the Transportation Alternatives Program, Maryland Bikeways Program, Recreational Trails Program and Maryland Highway Safety Office Grant. Other MDOT funding programs for these travel modes include the Sidewalk Reconstruction for Pedestrian Access, New Sidewalk for Pedestrian Access, and Bicycle Retrofit funds. Other State grants can be obtained through the Community Legacy Program, Program Open Space, Community Parks and Playgrounds and Maryland Heritage Areas Programs. Prominent Federal grant opportunities are offered through BUILD Grants, the Rivers, Trails and Conservation Assistance Program and Federal Lands Access Program.
In recent years, the City of Hagerstown and Town of Williamsport have been successful in receiving significant grant funding from the Maryland Bikeways and Federal Lands Access Program to support bicycle infrastructure improvements within their jurisdictional limits.
Washington County’s Subdivision and Zoning Ordinances have design requirements for bicycle and pedestrian facilities. Design guidelines for sidewalks, crosswalks, and block lengths are specified within the Subdivision Ordinance. Sidewalks are not required along streets as a part of the subdivision process “unless deemed necessary by the Planning Commission for pedestrian safety or convenience.”
Certain zoning districts, such as Residential Multi-Family, Planned Business, or MixedUse Districts, require a cohesive and comprehensive network of pedestrian paths that provide access to dwellings, parking areas, recreational amenities, community buildings, auxiliary or recreational vehicle parking areas, solid waste disposal, mailboxes, and on-site public transportation stops. The County’s Zoning Ordinance also specifies requirements for bicycle parking and pedestrian access in Article 22. Language in this section also details required types and locations of racks or lockers for bicycles as well as appropriate design and access points for pedestrian facilities such as sidewalks, crosswalks and walkways.

The following bicycle and pedestrian needs, priorities or concerns for Washington County have been identified in various planning documents as detailed below:

¾ HEPMPO Regional Bicycle Plan (2016)
Source: HEPMPO
¾ HEPMPO Direction 2050 LRTP
Source: HEPMPO Direction 2050 LRTP
Washington County’s location at the junction of several major arterial road corridors and railroad lines has long made it a major regional hub along the supply chain which moves freight throughout large portions of the United States. This is increasingly true as a result of heightened consumer expectations for on-time delivery from various E-commerce retailers. These heightened expectations have made the role of hub communities even more important as critical links in the global supply chain network. Long range planning to ensure that the County has adequate transportation infrastructure and associated facilities to support its role in this interconnected network is essential.
The MPO’s 2050 LRTP notes that in 2017, the HEPMPO region was responsible for shipping and receiving 23 million tons of freight valued at over $20 billion. Much of the trade taking place is between domestic partners (Maryland, West Virginia, Virginia, Pennsylvania, and Kentucky), with a strong emphasis on raw materials such as aggregates, and non-metallic minerals as well as foodstuffs being shipped into the region. Finished goods, with a relatively greater value per ton, such as machinery, mixed freight, and chemical products are shipped outbound from the region to regional trade partners. Most of the region’s international trade activity is with Europe and Asia, for goods related to machinery, metals, and electronics. To source and ship these goods, the region relies on the Ports of Baltimore, Norfolk, and New York-New Jersey.
It is expected that from 2017 – 2050, the volume of freight moving into, out of, and within the region will grow by nearly 29 million tons. This represents a little more than doubling in the volume of activity over the 33-year period, or 2.5 percent growth in volume per year.1 Future economic growth in the region will therefore demand more from freight movement on both the road and rail networks.
A substantial amount of freight is transported to and from Washington County along its major roads, including I-81, I-70, I-68, U.S. 40 and U.S. 11. As the principal north-south alternative to I-95 for highway freight, I-81 is the most critical of these major corridors for the movement of goods. Freight generation along these routes reflects both industries that consume and produce goods within the region as well as material flows that support transportation sectors and wholesale/retail locations spread across the region.
Recent Federal legislation has weighted available fiscal resources toward serving the movement of goods along these critical corridors as well as the connecting routes that help support them. Connecting routes such as Halfway Boulevard from I-70 to MD 63, MD-63 from I-70 to Elliott Parkway, Oak Ridge Drive and MD-65 have all been designated as Critical Urban Freight Corridors in Washington County by the HEPMPO Interstate Council.
¾ Highway Freight Issues
• Truck Traffic
The projected 29-million-ton increase in the volume of freight moving into, out of, and within the region noted above is anticipated to be transported primarily by truck traffic. As shown in the chart below, the volume of freight moved by trucks will double from just under 20 million tons to more than 40 million tons.
Correspondingly, Direction 2050 notes that daily truck traffic on the two vital freight corridors is forecasted to grow as follows from 2018 to 2045:

» I-81 would see an additional 13,800 daily trucks in the region north and west of Martinsburg, with an additional 8,600 daily trucks southwest of Hagerstown.
» An additional 7,400 daily trucks would appear by 2045 on the I-70 corridor in western Washington County.
This projected increase in truck traffic will also worsen current truck parking issues unless mitigating strategies are implemented. Currently, as seen on the map below, the highest concentration of truck parking in Washington County is located near the I-81/I-70 junction. Ample truck parking is also located on I-70 near the Town of Hancock. Outside of these two major concentrations, most other truck parking facilities in the County tend to have fewer total spaces, thereby preventing additional accommodation across notable portions of the County.
Source: HEPMPO Direction 2045 Long Range Transportation Plan, MDOT Truck Parking Study (2020)
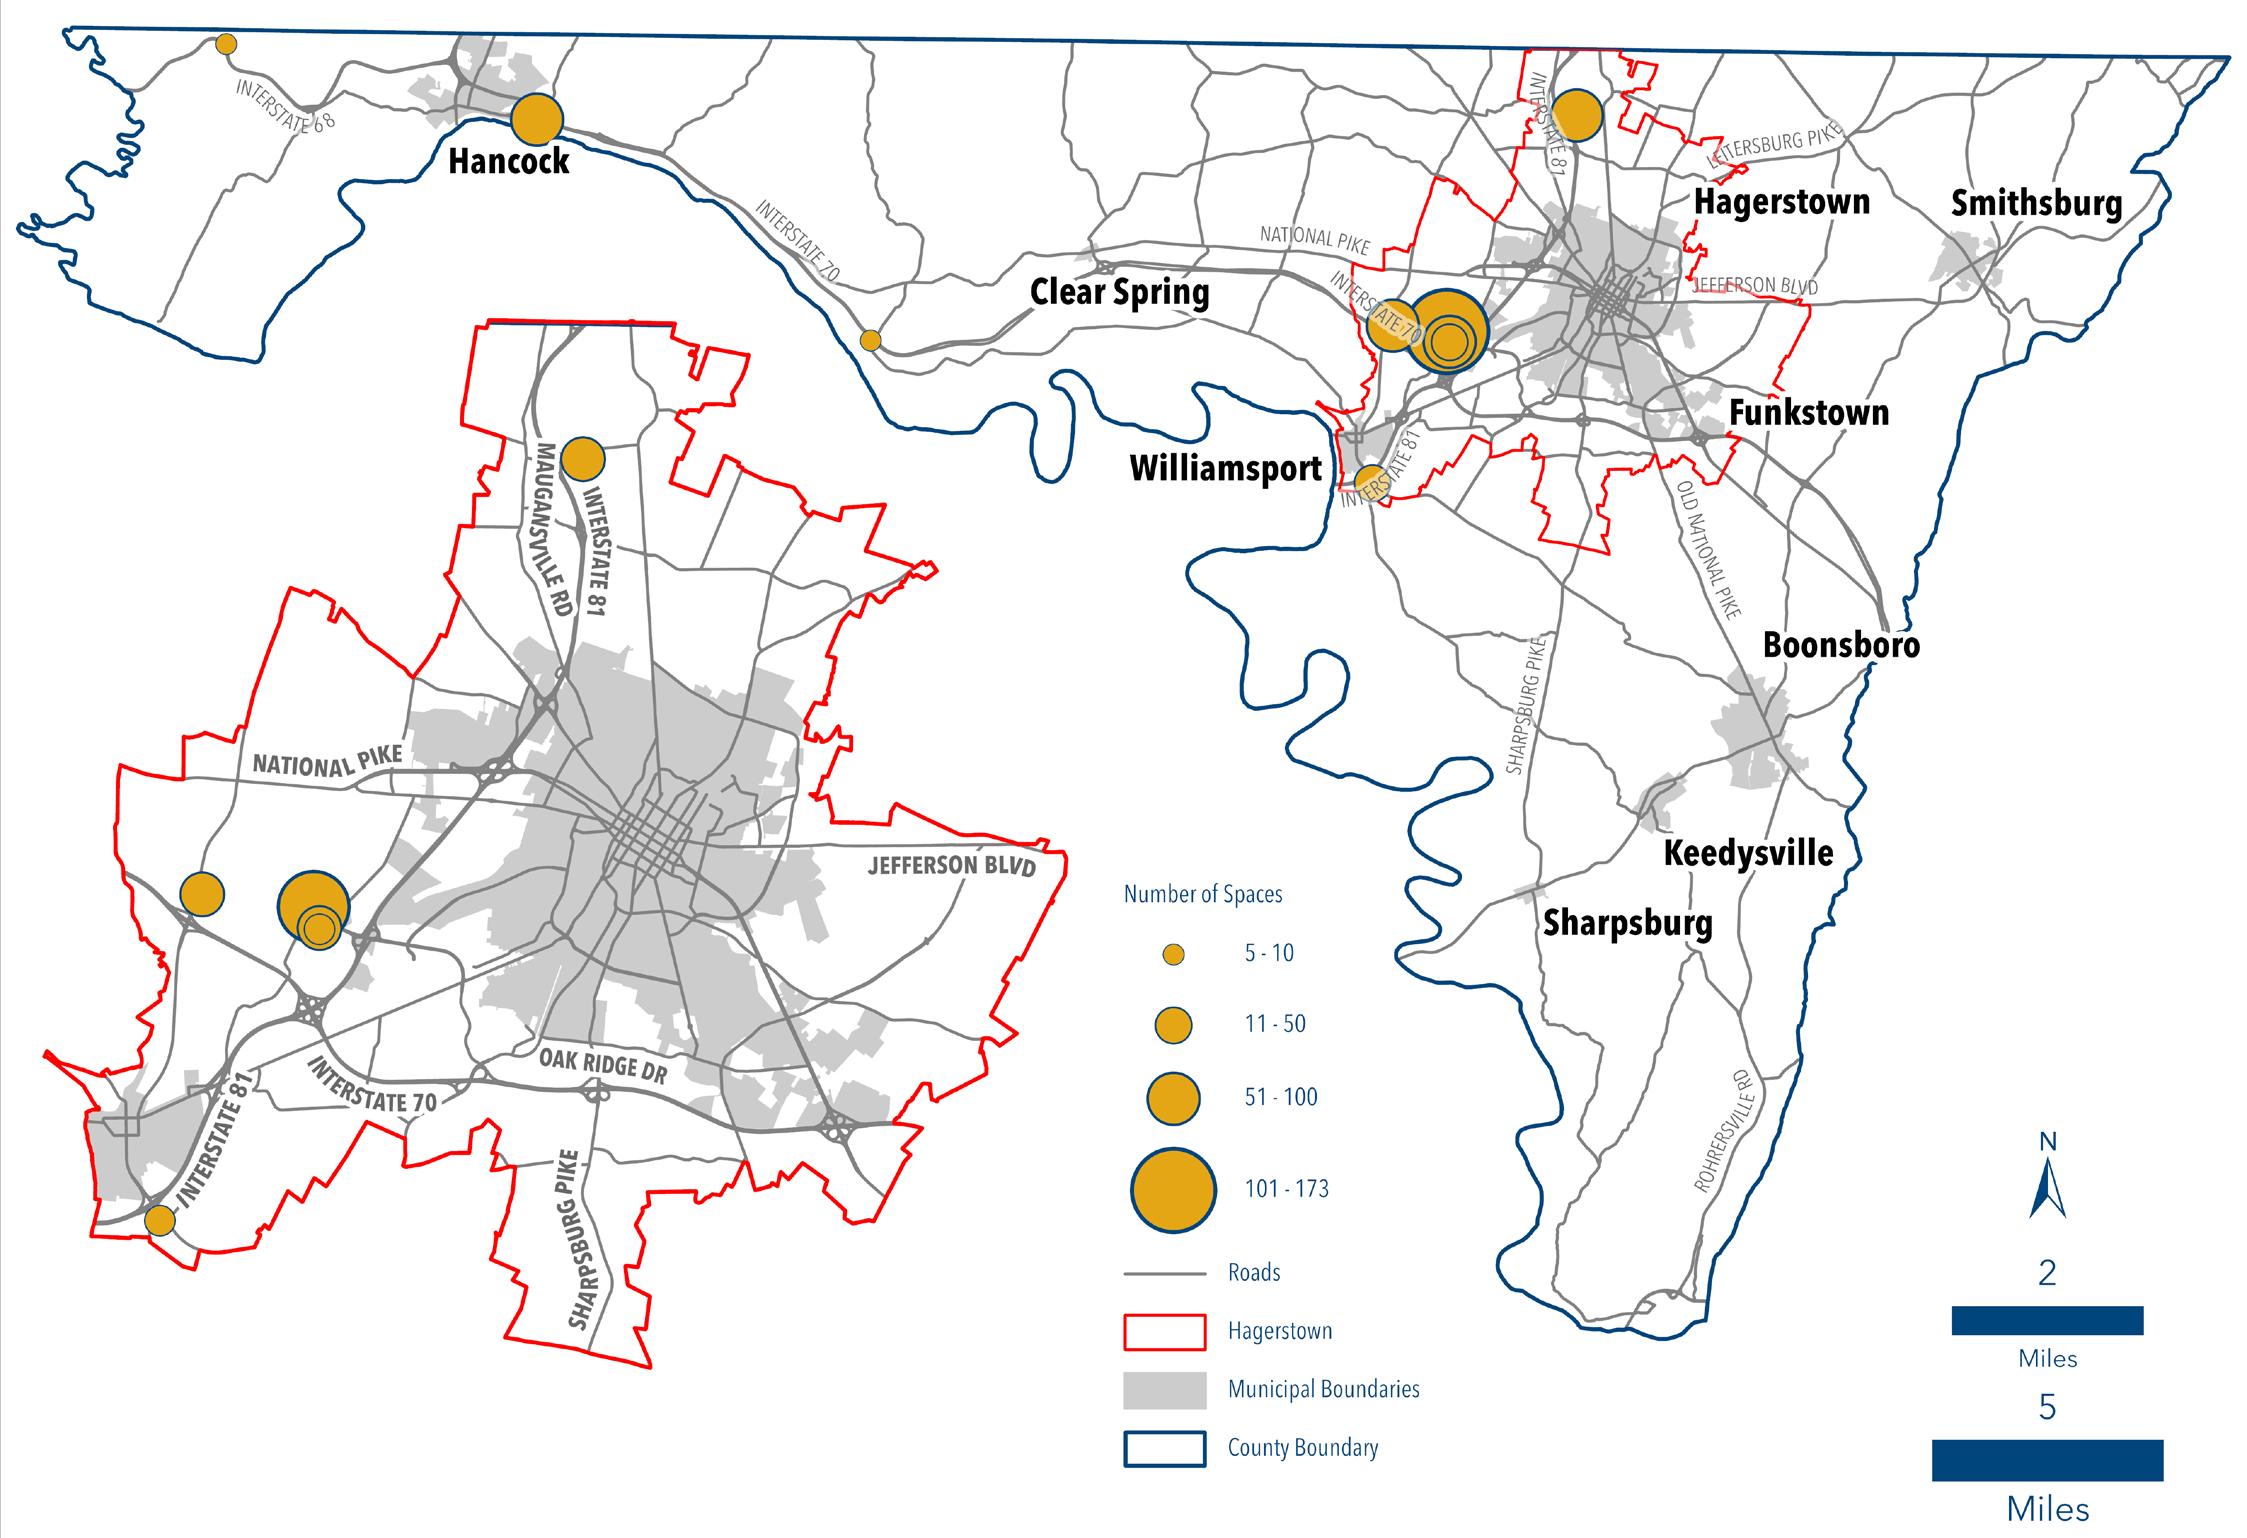
MDOT completed a Truck Parking Study in 2020 that recommends additional parking at or near:
» Exit 1 on I-81 in Williamsport
» Exit 24 on I-70 at Greencastle Pike
» I-70 Welcome Center in Fulton County, PA (just across the MD state line)
The additional challenge in local land use planning, when adding new truck facilities, is to ensure that impacts on adjacent residential areas from noise, emissions and other associated byproducts are mitigated to the greatest extent possible through buffering, setbacks, site design and other regulatory methods. Considerations for these impacts are noted in the recommendations at the end of this chapter.
Washington County’s long history as a railroad hub has been previously detailed in the Historic Resources Element. While there is currently no passenger rail service in the County, railroads do move extensive amounts of freight to larger markets in the Mid-Atlantic, Northeast, Midwest and Southeastern portions of the Country. CSX and Norfolk Southern are the primary rail owners and operators in Washington County. CSX primarily transports goods east-west between the Beltway region and northwest Ohio through Pittsburgh. Recent investments by CSX along this line have enabled it to now handle double-stack containers. Norfolk Southern has lines which parallel I-81 that run between the Southeastern United States and Harrisburg, Pennsylvania before hitting destinations further afield. Winchester and Western also operates a short line railroad from Gore, Virginia to Hagerstown, Maryland that runs mostly along I-81. The County does not host any intermodal facilities, however, there are three intermodal facilities just across state lines: two in Pennsylvania located on I-81 (Greencastle and Chambersburg), and one in Virginia off I-66 (Front Royal). The County’s active rail lines are shown on Map 7-12 below.
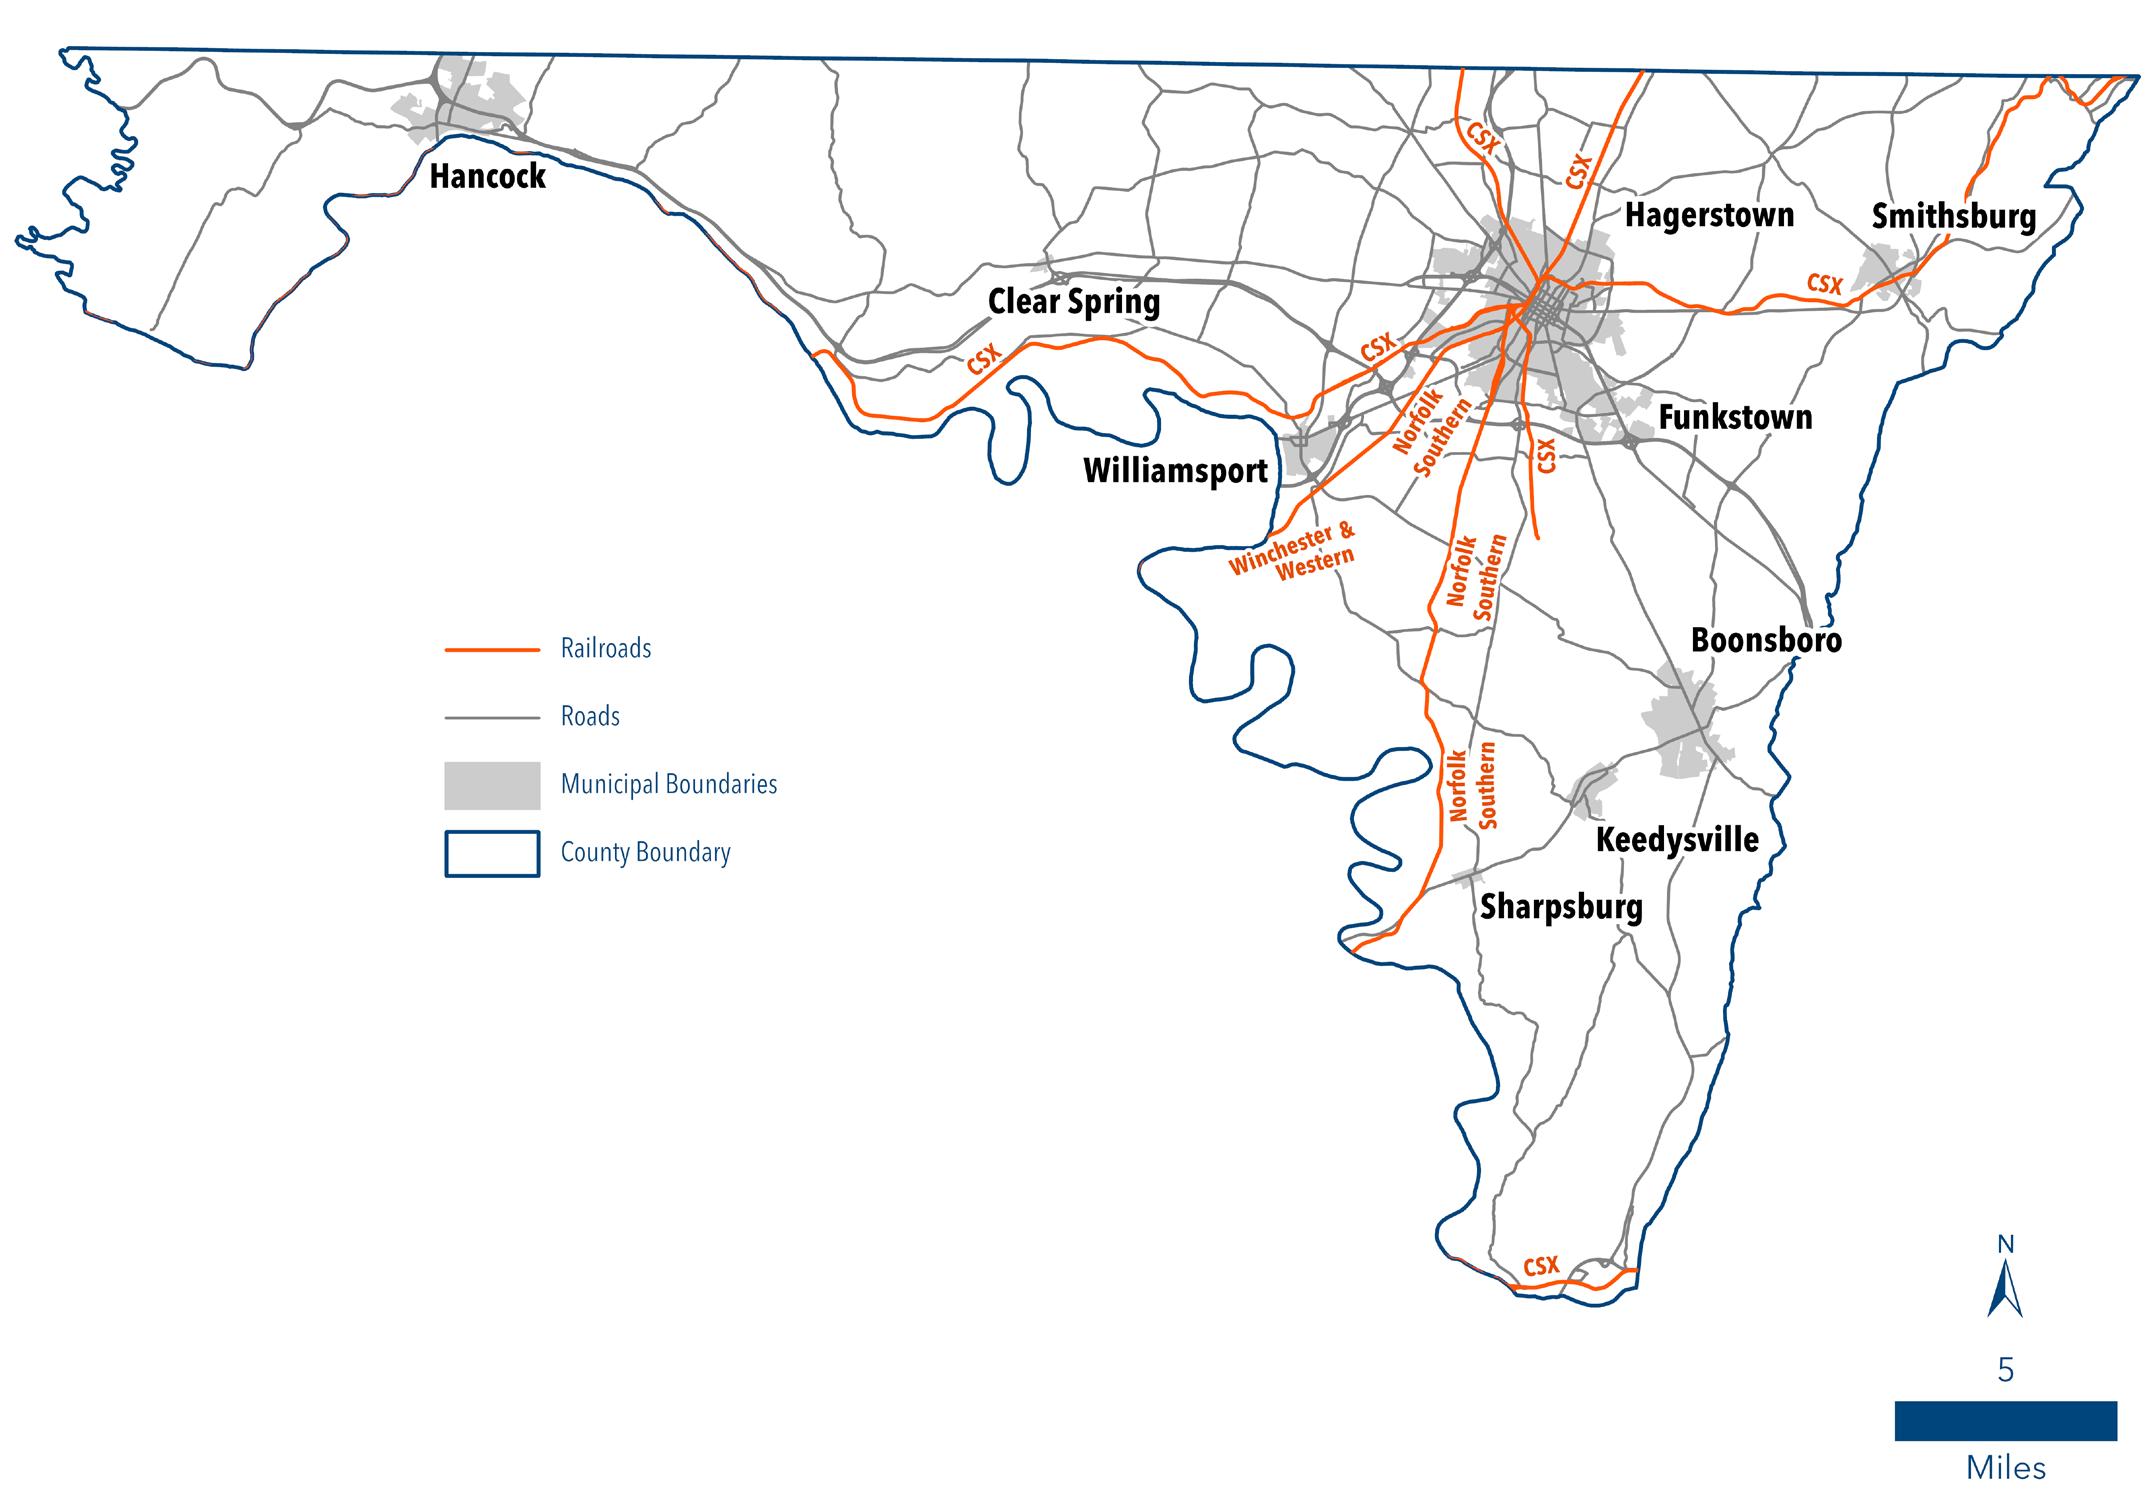
There are currently no major rail investments planned within the region. Elsewhere within Maryland, however, significant progress to improve the Howard Street Tunnel in Baltimore, to allow for double-stack containers, is moving toward implementation in a bid to compete with other ports for container traffic. While the development takes place outside the region, it could spur added demand for rail traffic involving the port.
The spillover effects of E-commerce traffic on local communities associated with the movement of goods throughout the supply chain is an interrelated land use issue noted at the beginning of this section of the chapter. First, although E-commerce reduces the number of household trips to commercial locations, it requires more trucks on roadways to deliver goods. Second, increases in the number of delivery trucks from distribution centers put additional impacts on the local road system, increasing traffic congestion, the demand for short-term parking and drop-off zones and raising various safety issues. Third, E-commerce centers attract commuting trips from larger numbers of employees working multiple shifts, often outside traditional transit service areas. Thus, the timing of trips and demand for transportation services does not always conform to standard hours of operation. Finally, land use planning must ensure that the locations of distribution centers are acceptable to communities in relation to adjacent residential communities, sensitive resource areas and more.
Mitigating these myriad impacts will be an important issue in transportation planning moving forward. Recommendations at the end of this chapter begin looking at policies to tackle these challenges.
The 2045 LRTP recommended conducting a regional freight study focusing on the identification of freight needs, trends and issues, high freight growth areas, Federal and State planning initiatives, regional commodity flows, and FAST Act performance measures. The study hopes to provide industry insight and foster collaboration among stakeholder groups in order to develop strategies to meet regional needs.
Operated by the Washington County Division of Public Works, the Hagerstown Regional Airport—Richard A. Henson Field (HGR) is one of the primary commercial airports serving the tri-state panhandle region. The 400-acre facility is located on US 11, adjacent to I-81, three miles north of the City of Hagerstown. The Airport supports general aviation and corporate services, with capabilities up to and including 727 sized jets. HGR has an air traffic control tower (one of only two municipal airports in Maryland), state of the art navigational aids, and the second longest runway in the State of Maryland. An extension of the runway over U.S. 11 was completed in 2007, enabling growth in passenger and business travel to the Airport. HGR has the capacity to house four airline carriers and several car rental agencies.
The Airport is the centerpiece of a major office/industrial park. Numerous private commercial businesses are located on the larger airport property. These include a fixed base operator offering large commercial and corporate hanger rentals, a maintenance repair operation and a suite of onsite passenger services and amenities; a post-secondary aviation school, restaurant, and a variety of other corporate entities offering aviation related services. A 2015 study by the Maryland Aviation Administration found that HGR was second in business revenue and income impact among Maryland’s 35 public use airports. HGR generated $108.9 million in business revenue and collected $8.4 million in State and local taxes. The business activity generated by the Airport helped to employ 1,500 people and bring in $79.6 million in total personal income.
Currently, Allegiant Airlines offers year-round flights to Orlando Sanford (SFD), Florida and seasonal service to St. Petersburg/Clearwater (PIE), Florida and Myrtle Beach (MYR), South Carolina. Hagerstown Regional Airport has provided service to a combined total of 386,869 passengers as of May 12, 2022, according to information posted on their website.

Until October 2019, daily commercial air service was also provided by Southern Airways to Pittsburgh (PIT) and Baltimore/Washington International (BWI) Airports. At that time, the United States Department of Transportation announced the termination of the Essential Air Service (EAS) Waiver eligibility for Hagerstown, contending that HGR no longer met minimum requirements to receive the Federal subsidy. Subsidy requirements included a minimum number of enplanements (a person getting on a plane) per service day, and an average cost per passenger threshold. Washington County was unsuccessful in its appeal of the DOT’s decision to the U.S. Court of Appeals in Washington D.C., with the Court ruling against the County in April of 2020. Additional remedies through the court system were judged unlikely to succeed by the County Attorney’s Office, ending the County’s effort to restore the Federal subsidy. The County’s geographical position within roughly 80 miles of three large hub airports in Washington D.C. and Baltimore presented a significant hurdle in its case for the Essential Air Service Waiver. 1
Despite the setback outlined above, the County has made a number of notable improvements to the Airport in recent years with more planned for the future. Private entities operating at the Airport have also continued to invest in business expansions or in service improvements at HGR. Significant projects planned or recently completed at the Airport are noted below.
• A $6 million terminal expansion project at Hagerstown Regional Airport was completed in March 2021. This project added a 5,000 square foot addition to the hold room, doubling the size from 150 passengers to 300 passengers. Restrooms were also relocated, and the TSA check-in was moved.
• Design for the approximately 4,800-square-foot terminal expansion that will allow for additional ticket counters, baggage processing, and ground service vehicle storage has also commenced.
• HGR is finalizing acquisition of approximately three acres for the design and construction of a project to promote both the clearance of the Runway Visibility Zone and the Runway Object Free Area to improve safety on the airfield.
• The relocation and reconstruction of Taxiway ‘F’ that will greatly improve safety on the airfield will begin in FY23.
Ì Seek diverse funding sources to plan, design and construct priority projects identified in the MPO’s current LRTP and in the County’s Capital Improvement Program.
Ì Develop a localized functional road classification similar to the Federal classification system with an emphasis on adequate right of way and access spacing needs.
Ì Coordinate with other jurisdictions and transportation planning entities at the Federal, State, regional and local levels to efficiently and cost-effectively create transportation improvements in a timely manner.
Ì Consider formally adopting a Complete Streets Policy for County roads to ensure that multi-modal transportation options are routinely considered as a part of all new or retrofitted road projects, or during road resurfacing.

Ì Encourage multi-modal interparcel connections between commercial businesses to preserve capacity of collector and arterial roads. Strip development with access onto major public roads should be discouraged as much as possible.
Ì In residential areas along major transportation routes, encourage or require driveway consolidation or provide frontage roads that divert traffic to safe, controlled points of access.
Ì Investigate the creation of an inventory and ranking system of Rural Roads with scenic, historic or environmentally significant resources. Consider regulatory changes and/or create corridor management plans that protect highly ranked road corridors with these resources in abundance to maintain the County’s rural character and heritage.
Ì Transportation investments within rural areas should focus on safety improvements to existing facilities and avoidance of sensitive resource lands rather than adding lane capacity. Transportation facilities in rural areas should also minimize impacts on agricultural land targeted for permanent retention in Priority Preservation Areas.
Ì Identify roads vulnerable to natural or man-made hazards or incidents and develop long-term strategies for their improvement, relocation, or realignment to avoid preventable damage to people and property.
Ì Where possible, design road projects to minimize new impervious surface cover to meet regulations related to water quality and stormwater management.
Ì Consider the potential opportunities, effects and land use implications of emerging transportation technologies such as on-demand ride sharing, connected and autonomous vehicles, alternative fuel vehicles in comprehensive planning and capital investments.
Ì Make certain that transit, human service transportation and/or on-demand public transportation provide access to critical services such as health care, grocery stores, childcare, and community facilities.
Ì Investigate the feasibility of expanding County Commuter hours of operation, particularly to include at least limited service hours on Sundays and systemwide evening service.
Ì Determine feasible options to provide public transportation to Towns and rural areas of the County outside of planned growth areas that are not currently served by the County Commuter, but which exhibit enough potential ridership to warrant at least occasional transit service to and from the County’s Urban Growth Area.
Ì Provide transit service to within a reasonable distance by non-motorized means of travel to all major subdivisions and major employment centers in the Urban Growth Area. Work with major employers to incentivize ride sharing and transit usage to discourage commuting by singleoccupancy vehicles.
Ì Identify opportunities to utilize Transit Oriented Development principles to create sufficient density around transit facilities to encourage the provision of cost-effective service to those locations.
¾ Identify areas where higher-intensity, mixed-use development could be encouraged around major mass transportation facilities (i.e.- transfer centers or other major transit facilities, ridesharing lots, trailheads for multi-use paths in urban areas, etc.) to promote efficient land use patterns and encourage mode switching for some trips.
Ì Coordinate existing transit routes to better connect the County Commuter to park and ride facilities and regional commuter services in order to provide expanded travel options for residents to reach regional employment centers while residing in Washington County.
Ì Look for opportunities to increase the number of park-and-ride lots and/or spaces to promote ride sharing.
Ì Improve passenger amenities at County Commuter stops where there is high passenger demand with special attention to increasing the number of bus shelters.
Ì Consider amending the County’s Adequate Public Facilities Ordinance to include the provision of bicycle, pedestrian and/or transit facilities for new development or redevelopment within Urban or Town Growth Areas to accommodate and capture new traffic flow from the proposed development by non-motorized means.
¾ To prioritize the use of funds collected or directed to this purpose, identify gaps in the current Bike/Ped infrastructure network and prioritize projects that fill those gaps to create a comprehensive and functional system of facilities for non-motorized travel.
Ì Conduct Pedestrian Road Safety Audits to identify corridors, roads/streets and intersection locations where a high number of crashes between bicyclists and motor vehicles, or pedestrians and motor vehicles occur.
¾ Implement recommendations of such audits that may include traffic calming measures or new or improved bicycle or pedestrian facilities that include dedicated user space and improved safety features for non-motorized travel.
Ì Identify activity centers where housing and jobs, schools, commercial uses, transit, community facilities or public spaces occur in close proximity. Strengthen bicycle and pedestrian connections between these places where those facilities are absent.
¾ Strengthen first and last mile connections to transit facilities by providing bicycle or pedestrian infrastructure linkages between housing, activity centers and transit.
¾ Promote and pursue bicycle and pedestrian connections to schools through the Safe Routes to Schools program.
¾ Incentivize the creation of end-of-trip facilities for bicyclists at activity centers in planned growth areas such as bicycle parking, lockers and/or showers to promote increased bicycle commuting and modal switching.
¾ Equip County Commuter buses with bicycle racks to facilitate multi-modal travel.
¾ Target areas noted in the HEPMPO Regional Bicycle Plan as possessing a high latent demand for facilities such as in Halfway, Funkstown, Robinwood, and Hancock.
¾ Investigate opportunities for State designated Bicycle and Pedestrian Priority Areas and Short Trip Opportunity Areas.
Ì Encourage infill and compact, mixed-use development within planned growth areas that creates inherently “walkable and bikeable” communities through policy and regulation.
Ì Incorporate consideration for the creation of on-road bicycle facilities into resurfacing projects to allow for routine expansion of the bicycle network in a cost-effective manner.
Ì Review parking requirements to determine whether they encourage the transportation by nonmotorized means and do not unnecessarily decrease available land for property improvements, particularly within urbanized areas. Parking reduction measures support other transportation demand strategies that help reduce traffic congestion. Eliminating or reducing minimum parking requirements in select areas such as in Town or city centers is a potential option.
Ì Consider “road diets” along streets that may have excess capacity to calm traffic and examine the potential of replacing the excess travel lane with space for bicyclists, pedestrians or transit.
Ì Ensure multi-modal transportation options are available which connect Town and Urban Growth Areas.
¾ Support the provision of dedicated shoulder space, as well as “Share the Road” signage, for bicyclists along State highways and along County roads wide enough to include such facilities in service of the above objective.
¾ Use floodplains and railroad right-of-way to improve bicycle and pedestrian connections between Towns and the City of Hagerstown. The use of utility corridors is also being explored by some jurisdictions.
Ì Solicit Town “wish lists” for dedicated bicycle and/or pedestrian facilities on County roads for inclusion in capital budgeting.
Ì Pursue context sensitive design and implementation of all transportation facilities in Rural Villages to preserve community character while also accommodating modern multi-modal transportation needs.
Ì Provide signage, pavement markings and wayfinding for the County designated bicycle route network to promote active transportation and tourism in rural areas. Where feasible, add dedicated shoulder space to make these routes more bicycle friendly.
Ì Identify opportunities to make bicycle and pedestrian facility connections between publicly accessible preserved lands and adjacent Towns that serve as gateways to these recreational resources, where they are currently absent, by multi-use paths and other bicycle or pedestrian facility types.
¾ Connections such as these promote public health, facilitate economic development through heritage tourism and create contiguity among protected lands, amplifying their benefits to people and environmental systems.
¾ Program Open Space funds could be applied for to achieve projects such as these as well as other State and Federal grant programs.
Ì Conduct a feasibility study and gain additional public input on the creation of the Civil War Railroad/ Weverton Roxbury Corridor Rail Trail, as identified in Maryland’s Land Preservation and Recreation Plan, to link the Urban Growth Area with existing long-distance multi-use paths (i.e. - C&O Canal towpath) and promote increased active transportation. If the project is judged feasible, a section of the trail could be piloted in a location where public support indicates the potential for facility demand and usage.
Ì Incorporate walking or bicycling trails into the development of all new County parks to promote lifelong fitness. Trail development in existing parks with unused recreational space should also be considered.
Ì Identify and target priority corridors and lands for acquisition or protection through land preservation programs and ordinances, donated easements (i.e.-floodplain corridors) or using various Federal or State transportation alternatives grant funding.
Ì Design bicycle facilities to accommodate the safety and comfort needs of novice cyclists providing dedicated space where feasible.
Ì Adopt design standards for on and off-street bicycle facilities and multi-use trails within County road design manuals.
Ì Utilize emerging measures, such as Level of Traffic Stress, to determine the appropriate new facility type or design intervention for bicyclists on a given road segment to promote rider comfort in addition to traditional measures such as Bicycle Level of Comfort.
Ì Develop programs and strategies to increase bicycling and pedestrian activity through Encouragement, Education, Enforcement, Equity and Evaluation efforts in addition to Engineering improvements (The Six E’s Model).
Ì Continue ADA compliance with sidewalk and other transportation system improvements, particularly at intersections.
Ì Continue to expand access to water trails along Antietam and Conococheague Creeks.
Ì Evaluate priority locations for new truck parking facilities along major arterial routes and pursue opportunities for their development in context appropriate locations to facilitate the intermodal movement of goods and support economic development goals.
Ì Facilitate land use practices that encourage goods to be transported by rail to the maximum practical extent to preserve road capacity on arterial routes and improve safety.
Ì Ensure that zoning and infrastructure along rail lines supports industry needs to move and distribute freight in or through the County by that mode of transportation.
Ì Consider identifying Freight Movement Protection Corridors for priority trucking routes and rail lines to ensure the efficient movement of goods and the creation of support services and facilities.
Ì Continue to implement Airport modernization and improvement projects identified in capital planning and long-range transportation plans that promote safe and efficient airport operations, enhance passenger amenities, and solidify the position of the Airport as a hub for economic development in Washington County.
Ì Pursue the location of businesses within the Airport Overlay Zone that are compatible with airport operations and support industries. Continue to provide support for the growth and expansion of existing private businesses operating within the larger Airport industrial/office park.
Ì Consider future needs to expand airport operations in land acquisition and capital planning.
Ì Continue to investigate opportunities to restore commercial flight service connections from Hagerstown to major regional airports to ensure that airline travel for business and commuting purposes remains viable in the County in the long-term.
Ì Consider creating, with input from transportation planning partners, a Bicycle and Pedestrian Plan specifically for County roadways. The plan would identify gaps in the network and prioritize improvements based upon public safety concerns and opportunities to encourage modal switching and reduce traffic congestion.
Ì Evaluate adequacy of evacuation plans and routes in the event of severe weather or a catastrophic event.
Ì Consider alternative fuels or more fuel-efficient options for new County vehicles (transit, staff, etc.) to minimize air quality impacts and reduce energy costs.


The timely and economical provision of community facilities is an integral part of growth management and land use regulation activities undertaken by Washington County to ensure an essential quality of life for residents. The location of community facilities is fundamentally tied to longstanding growth management objectives in Washington County which seek to direct services to planned growth areas where both existing infrastructure and the density of residents enable the efficient provision of essential institutional services.
The types of community facilities provided, as well as the programs and services associated with each, will vary throughout the County according to the differing needs of rural and urban communities. The designation of regulatory place types within County ordinances, plans and policies, such as Urban and Town Growth Areas, or Rural Villages, helps to guide policies embedded within these regulatory documents in determining what types of community facilities are appropriate in different urban and rural contexts. In certain cases, municipalities provide essential public facilities and services to citizens of the County who live outside the corporate limits of the municipality. In others, community facility provision is handled jointly by Municipal and County governmental entities. As a result of such cooperative arrangements, it is essential that coordination occur between entities representing these local governments when creating policies that specify where and how community facilities will be provided.
There are many different plans and policy documents that govern the operation and funding of varied types of community facilities covered within this element. The most directly relevant of these plans or policy documents are noted in the following section.
The County’s Capital Improvement Program (CIP) is how future infrastructure needs are forecasted and prioritized. The Program enables such improvements to occur according to a timely and cost-effective fashion. A major purpose of the CIP is to provide a means for coordinating and consolidating all departmental and agency project requests into one document. The projects can then be examined and prioritized based on established criteria that includes County plans and policies. The resulting document is the CIP. A Ten-Year CIP is developed each fiscal year and includes scheduling and financing of future community facilities such as public buildings, roads, bridges, parks, water and sewer projects, and educational facilities. The plan is flexible and covers ten years with the first year being the Capital Improvement Budget. Funds for each project are allocated from Federal, State, and local sources by the Board of County Commissioners.
The Capital Improvement Plan not only accounts for the acquisition, expansion, and rehabilitation of infrastructure and other capital assets, but it also incorporates the following basic underlying principles of the County:
• Capital projects are targeted to support the goals of the Comprehensive Plan and other County functional plans.
• Capital investments are made for economic development.
• Existing assets are preserved and maintained to ensure continued service.
• External funding possibilities are considered when reviewing and prioritizing projects.
• Intergovernmental funding is sought for regional projects.
• Debt is used carefully and managed in accordance with the goals and objectives of County policies.
Hagerstown Regional Airport - Terminal Bridge

The Adequate Public Facilities Ordinance (APFO) has been in place since 1990 in Washington County and is a primary regulatory tool for the provision of community facilities outside of incorporated municipalities. Each municipality has autonomous authority to manage infrastructure within their incorporated boundaries.
The APFO was enacted to ensure “that public facilities and services needed to support new development shall be available concurrently with the impacts of such new developments”1 “Adequate Public Facilities” are defined by the Ordinance as “those facilities relating to roads, sewerage disposal systems, schools, water supply and distribution systems, and interim fire protection systems meeting established minimum standards.” Adequacy standards for each of these facility types are described within the APFO Ordinance. Authority is granted to the Planning Commission to determine when adequacy has been met in the approval or disapproval of an application for development. Phased development, particularly with larger projects that may cause substantial new demand for public infrastructure or services, is an integral method by which this concurrency is attained to spread out the impacts of development over a manageable and cost-effective timeline.
The Washington County Water and Sewerage Plan is the primary policy document governing the quality, supply and capacity of water and sewer facilities within the County for a twentyyear time horizon. As noted within the Plan, “the planning and implementation of water and sewerage facilities constitute the most physically direct method of guiding development within the County.”2 The Water and Sewerage Plan sets policies regarding the provisions of these services, which are designed to implement, and be consistent with, the policies of the Comprehensive Plan. The Water and Sewerage Plan inventories existing service areas as well as those programmed to be served in the future. The Plan also serves to link local water and sewer provision with Federal and State regulations governing their operations, including the Clean Water Act, Maryland’s Watershed Implementation Plans, Chesapeake Bay Total Maximum Daily Load limits as well as other regulatory tools.
The Educational Facility Master Plan (EFMP) is a long-range (ten-year) planning document that is produced annually by the Washington County Board of Education. Within the document are analyses of Washington County communities, the physical and functional state of each school facility, and student enrollment trends. This analysis is then synthesized into a Master Plan for facilities that meet the needs of Washington County Public Schools (WCPS). This Plan helps inform the public, and various County and Municipal officials, about the short- and longrange needs for school facility improvements, including prioritization of the identified needs. Implementation of the Plan is accomplished through the development of an annual Capital Improvement Program request for funding which mirrors the plan set forth in the EFMP, which is submitted to both the County and State governments for project funding approval. The CIP request includes both the current funding year, as well as the next five (State) to ten (local) years of estimated funding needed to accomplish the master plan.1
The purpose of the Land Preservation, Parks and Recreation Plan is to evaluate current open space opportunities, analyze future impacts from growth, and develop a coordinated plan to address future open space needs. The Maryland Program Open Space (POS) laws and the Federal Land & Water Conservation Fund Act of 1965 require that all Counties in the State of Maryland produce and maintain an Outdoor Recreation and Open Space Plan. As noted in these laws, all land acquisition and park development funded through these programs must be consistent with the approved State and County Land Preservation, Parks, and Recreation Plans. The County’s use of POS funding requires such a plan to be updated every five years.
This document outlines the County’s plan for the management of the present and future solid waste and recyclables generated within its borders for a ten-year period. This Plan examines the existing solid waste management systems in place including projections for waste streams. It also analyzes alternatives to manage waste including waste reduction, recycling, and energy recovery alternatives. The Plan is updated every three years.
The purpose of the Multi-Hazard Mitigation Plan is to prevent or reduce loss of life and injury and to limit future damage costs by developing methods to mitigate or eliminate damage from various hazards. Local Mitigation Plans follow a planning methodology that includes public involvement, a risk assessment for various hazards, an inventory of critical facilities and at-risk residential areas, a mitigation strategy for high-risk hazards, and a method to maintain and update the Plan. Mitigation Plans are required to be updated every five years in accordance with the Federal Disaster Mitigation Act of 2000. States and incorporated local communities are provided funding under this Act to carry out the planning process. The Washington County Division of Emergency Management is the primary County agency in charge of leading the planning process.
The Plan provides a framework for government and private entities to mobilize resources and conduct activities in response to public emergencies. It provides a unified structure for public/ private emergency response operations to ensure a coordinated and effective operation. The Emergency Operations Plan describes how various agencies work collaboratively to respond to incidents that threaten life, property, public safety and the environment in Washington County. In addition to emergency response, the Plan also seeks to reduce future vulnerability to such events within the County through timely and coordinated disaster response, and through regional planning and training activities. The design of the Plan was based upon the functional structure of the National Incident Management System and the Federal Response Plan which recognizes that, for some disasters, State and Federal assistance may be required to achieve a total response.1 The Washington County Division of Emergency Services has been delegated primary responsibility for coordinating County emergency preparedness, planning, management and disaster assistance functions.
Washington County Free Library Strategic Plan
The purpose of the Strategic Plan is to chart the direction of the Washington County Free Library for the next four years. The Plan outlines the Library’s blueprint for services in the identified areas of education, workforce development and civic engagement.
Infrastructure Assessment for Washington County & the City of Hagerstown (2013)
Infrastructure is a key element for communities to attract and retain both residents and businesses. This report provides a snapshot of current infrastructure in Hagerstown and Washington County including water, sewer, transportation, electricity, gas and telecommunications. It focuses on describing existing conditions within nine Economic Development Regions where the land is zoned for Business, Industry, Institutional Uses and Commercial Development. The nine areas were selected by the Hagerstown-Washington County Economic Development Commission’s Infrastructure Committee because of being the largest areas where significant room for economic growth or redevelopment exists as a result of already possessing the basic infrastructural elements necessary to support such growth. The nine areas, which include the Airport Region, Maugans Avenue/I-81 Region, Friendship Business Park, Fort Ritchie/Cascade Town Center, City of Hagerstown, Interstate Business Park Region, Hopewell Valley Region, North Hopewell Valley and the Technology and Research Park, were given a numerical score based on the readiness of each infrastructural element to support sustainable economic growth.
The provision of public water and sewer is an integral part of implementing many of the land use policies of the Comprehensive Plan. It facilitates the most direct method of guiding development within the County. Development is dependent upon access to these facilities, which also ensure the health of citizens and the local environment. This level of planning goes beyond the generalized goals of the Comprehensive Plan and is given a higher level of analysis and priority as part of the Water Resources Element of this Plan and the separate County Water and Sewerage Plan. The main office for the Department of Water Quality is located at 16232 Elliot Parkway, just outside of Williamsport.
Parks and Recreation
Residents and visitors alike are fortunate to have access to a wide variety of public lands dispersed throughout Washington County that serve many different recreational user groups. The quantity and quality of recreational facilities in Washington County serves to meet the needs not only of local neighborhoods but also to draw visitors to Washington County from around the globe.
Federal Parks and Recreation Facilities
There are four Federal parks located within Washington County: Antietam National Battlefield, Harper’s Ferry National Historical Park, the Chesapeake and Ohio National Historical Park and the Appalachian National Scenic Trail. The primary intent of the first three parks is to protect and interpret historic sites and landscapes through educational programming while also offering some active recreational opportunities. The Appalachian Trail is a long-distance footpath which extends more than 2,100 miles through the Appalachian Mountain from Georgia to Maine. Forty miles of the trail are in Maryland, all of which are found in Washington County. These facilities are owned and managed by the National Park Service with the assistance of local groups. Federally owned parklands total approximately 8,300 acres, or 23% of public recreation land in Washington County.
State Parks and Recreation Facilities
The State of Maryland also owns and maintains lands in Washington County that include eight State parks and four Wildlife Management Areas. The developed State parks include Fort Frederick, Gathland, Greenbrier, South Mountain (includes Appalachian Trail), South Mountain Battlefield, Washington Monument, Woodmont, and the Western Maryland Rail Trail. Fort Tonoloway State Park is an undeveloped historic site near Hancock. Wildlife Management Areas include Box Turtle, Indians Springs, Sideling Hill, and Prather’s Neck. There is a wide variety of passive and active recreational opportunities in these areas including biking, hiking, camping, horseback riding, walking/jogging, swimming, and playgrounds. Other State lands include the Albert Powell Fish Hatchery, Brownsville Pond, Roundtop Hill Natural Heritage Area, and two fire towers. State owned parks and wildlife management areas are located in the eastern and western sections of the County and total approximately 23,300 acres, or nearly 65% of public recreation lands.
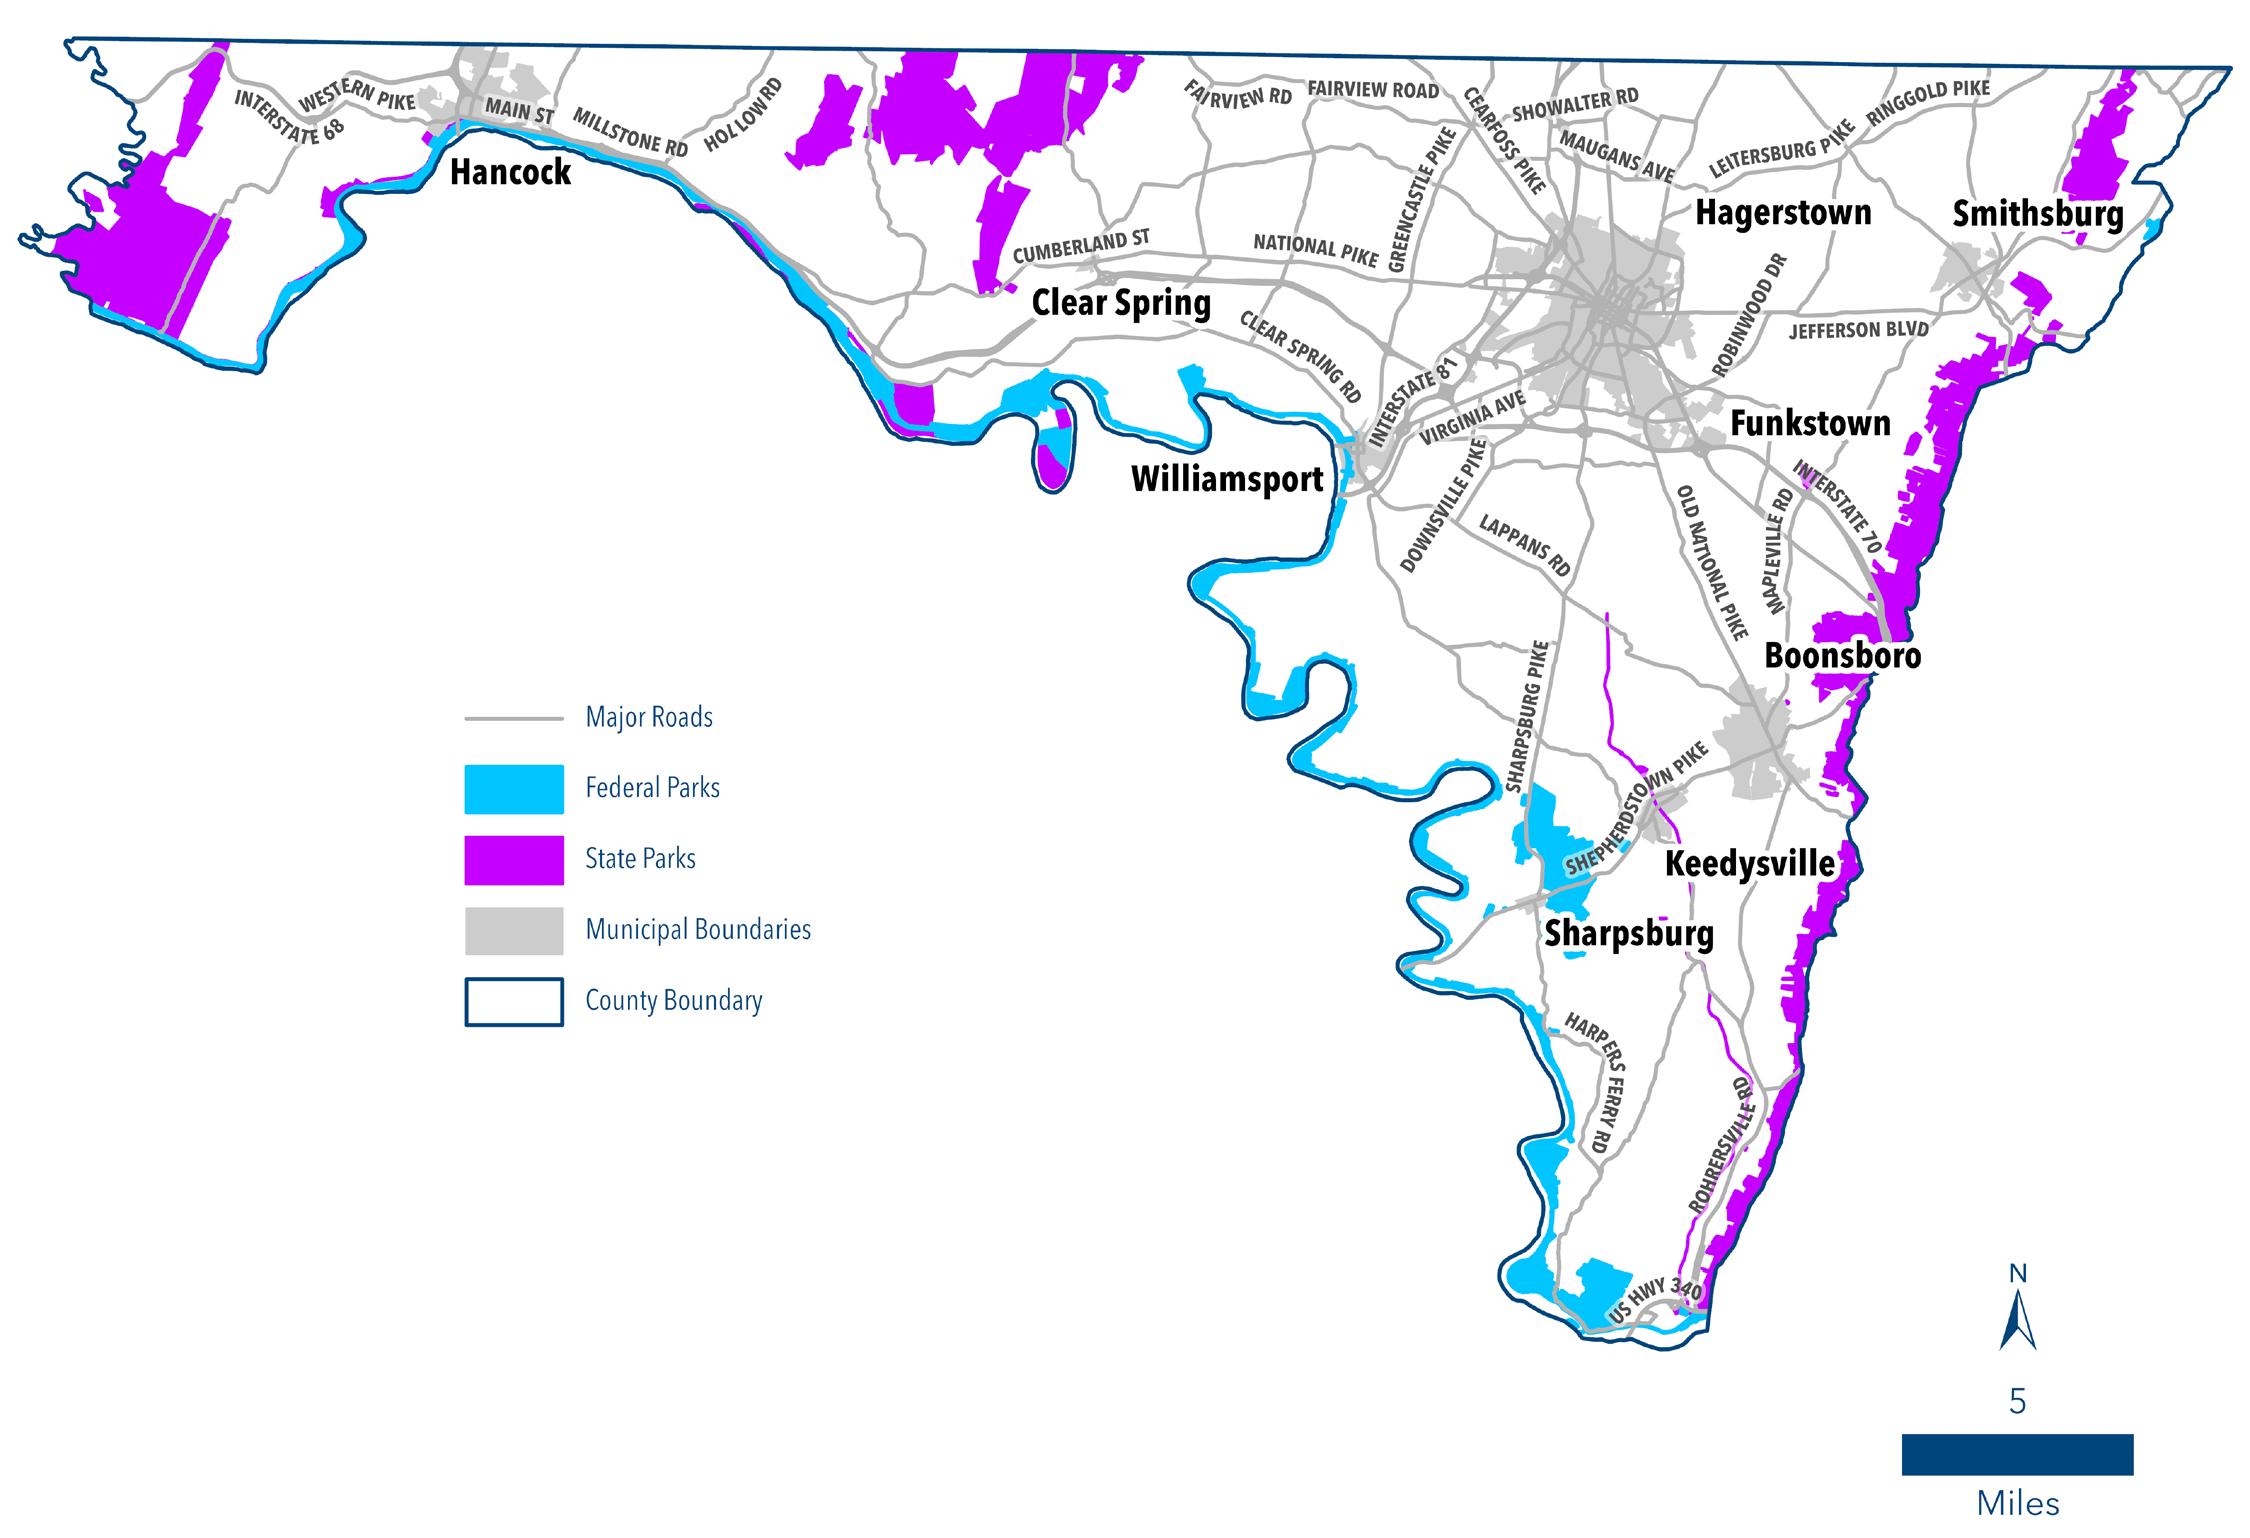
Washington County parks include a variety of facilities to serve the varied recreational needs of the County’s residents. County owned parks serve as host to a range of uses from the weekly summer concerts at historic Pen Mark Park, softball leagues at Pinesburg Softball Complex, fishing and canoing on Antietam Creek at Devil’s Backbone Park, to providing a connection to our agricultural heritage through the numerous events held at the Agricultural Education Center and Rural Heritage Museum. These and many other County parks and recreational facilities offer ample opportunity to engage in active or passive recreational pursuits throughout the County.
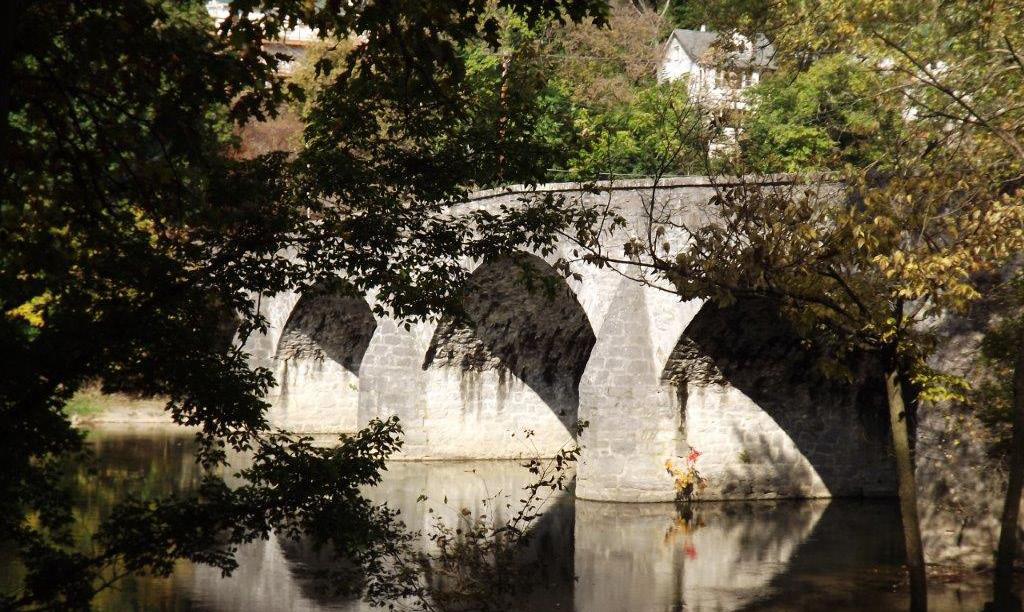

Included within the County parks and open space system are school recreational land and special use parks. School Recreational Land includes sites owned and maintained by the Board of Education and serve to provide for the school’s recreational needs as well as limited community needs. The school recreational land consists of formal athletic fields and playground equipment with the primary focus on scholastic sports and in- school recreational activities. An agreement between the Board of County Commissioners and the Board of Education allows additional funds to be provided to build an expanded gym, storage areas, recreation rooms and offices to support Recreation Centers which are open to the public when school is not in session. These Centers are managed by the County’s Department of Parks and Recreation.
Special Use Parks are areas that are generally oriented toward a single purpose use such as public golf courses, including protection of unique features such as historic or cultural sites, stream access, wetland areas, and habitat management areas. Examples are Mount Briar Wetland, located near Rohrersville, and Wilson Bridge over the Conococheague Creek.
The County Parks and Recreation Department now manages 22 park facilities County- wide consisting of approximately 895 acres of open space and recreation land. This total represents 2.5% of the public lands acreage in Washington County.
While not owned or administered by Washington County, there are nine (9) incorporated municipalities within the County that also provide parks and recreational opportunities to residents within their jurisdictional boundaries. Those municipalities include the City of Hagerstown (21 parks) and the Towns of Boonsboro (1 park); Funkstown (1 park) Hancock (3 parks); Keedysville (1 park); Sharpsburg (1 park); Smithsburg (2 parks); and Williamsport (2 parks). The Town of Clear Spring has no municipal parks but does contain Clear Spring County Park. Municipal parks serve a similar purpose to those provided by the County in offering mostly active recreation areas but also some passive recreation facilities.
Map 8-2: Local Parks and Recreational Facilities

Washington County Public Schools (WCPS) serves more than 22,000 students at 46 school facilities. Educational facilities under jurisdiction of Washington County Public Schools include elementary, middle and high schools, special programs and administrative facilities. Private educational institutions also provide educational services to residents of Washington County.
School facility needs are determined by projecting school enrollment system-wide, and at various grade levels. The forecasting of school enrollment in Washington County requires the analysis of multiple data sources including birth rates, local and regional housing trends, educational program changes, boundary changes, the local economy, and an understanding of the individual communities within the County. School population projections are most reliable when enrollment is projected for large geographic areas for one or two years in the future. System-wide projections for near years have a higher degree of certainty than the estimates for later years. Additionally, the accuracy of the projections diminishes as the geographic area becomes smaller. Maryland Department of Planning guidelines require enrollment forecasts to be prepared or updated annually.
In June of 2015, the BOE approved an attendance zone realignment that took effect during the 2016-2017 school year. This realignment did not significantly alter any existing middle or high school attendance zones, but did make changes to the elementary attendance zone boundaries of several schools. These realignments were needed as a result of the opening of one new elementary school and the closure of two others in the 2015-2016 school year. Attendance zone realignment also seeks to balance enrollment amongst all schools to the greatest extent possible.
The closure of Conococheague and Winter Street Elementary Schools, whose facilities had become obsolete, and the concurrent opening of Jonathan Hager Elementary School resulted in a decrease of 83 seats at the elementary level using the State Rated Capacity (SRC). Jonathan Hager Elementary was, however, sited and designed with future expansion in mind to absorb future growth within its service area. A new, larger Bester Elementary facility was opened in August of 2014, replacing the original, smaller facility. A new Sharpsburg Elementary facility also opened in August 2020, replacing the original facility that dated back to 1936.
Washington County Public Schools currently operates 26 elementary schools. Most elementary schools in the Washington County school system are organized in a kindergarten through Grade 5 format. In some cases, elementary service areas are combined and split between two schools, such as at Funkstown (Pre-K) and Emma K. Doub (Grades 1-5), and Ruth Ann Monroe Primary (Pre-K to Grade 2) and Eastern Elementary (Grades 3-5). Twelve schools offer pre-kindergarten classes. Several elementary schools have been newly constructed since the last Comprehensive Plan including: Bester, Jonathan Hager, Maugansville, Pangborn, Rockland Woods, Ruth Anne Monroe, and Sharpsburg.
As of September 2020, the SRC for County elementary schools totaled 11, 577 students according to BOE 2020-2021 Facilities Fact Sheet. In total Washington County had 9,996 equated elementary school children enrolled (Equated - defines kindergarten and prekindergarten students as half full-time equivalents) as of that same date. Therefore, as a whole, the elementary school system was at 86.3 percent of SRC. Adequate capacity for elementary schools is capped at 90% of State Rated Capacity (SRC) under Washington County’s Adequate Public Facilities Ordinance. Elementary schools and their districts are shown on the map below.
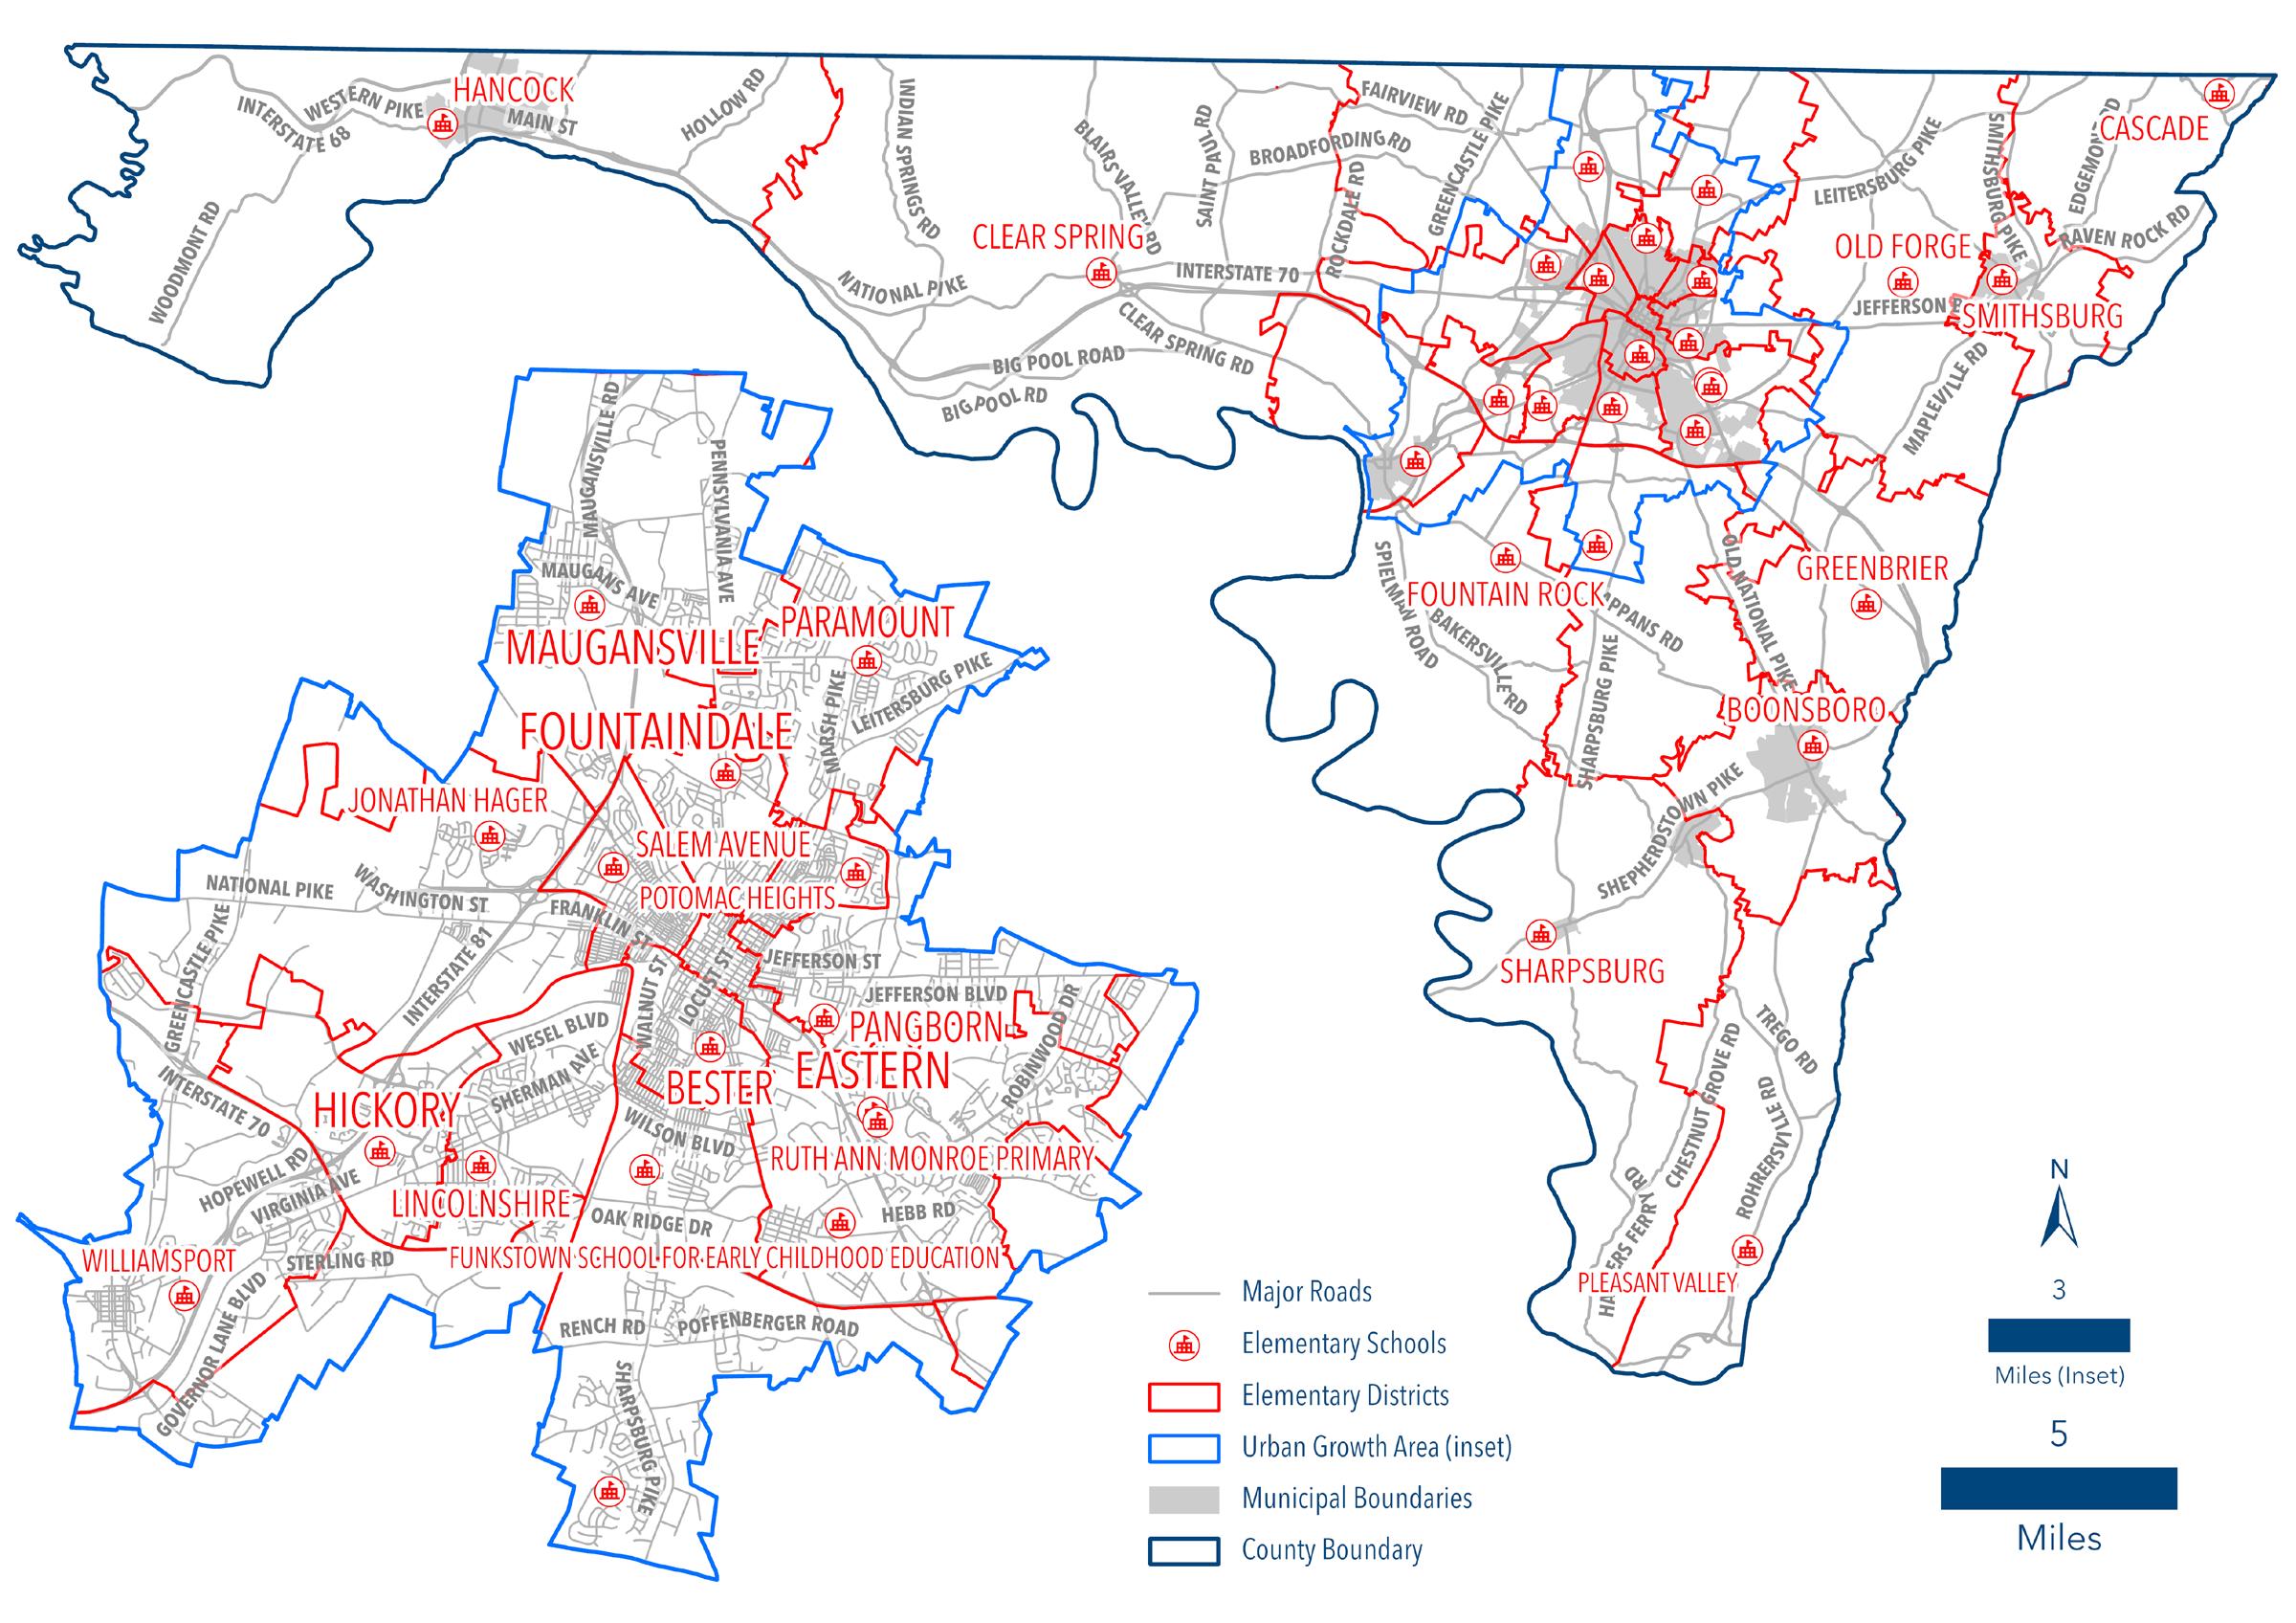
The Washington County Public School system operates seven middle schools covering grades 6 through 8. An eighth school, Hancock, is located within the same facility as Hancock High School with grades 6 through 12 being served. All but Western Heights Middle School are located on the same campus as high schools, thereby permitting some use of shared facilities and transportation.
System-wide, as of September 2020, Washington County had 5,044 middle school students enrolled. Total SRC for the seven County middle schools was 6,162 students as of that same date. Therefore, the middle school system was at 81.9 percent of SRC. The location of public middle schools and the boundaries of the districts are shown on the map that follows.

Students in grades 9 through 12 attend one of nine Washington County high schools (including Hancock Middle/High School). System-wide as of September, 2020 Washington County had 6,824 students enrolled in grades 9 to 12 with an overall SRC of 8,194 students. Therefore, the high school system was at 83.3% of SRC. The location of individual high schools and their respective districts are shown on the map 8-5.
A notable addition to the County’s high school network in the time since the County’s last Comprehensive Plan was made when the Barbara Ingram School for the Arts (BISFA) was opened in the renovated former Henry’s Theatre on South Potomac Street in Hagerstown in 2009. The school offers rigorous arts instruction and training in six different areas of concentration and collaborates with other neighboring institutions in downtown Hagerstown such as the Maryland Theater and the University of Maryland Hagerstown Center to share facility space. The school now serves as the center of arts programs for County schools and has been recognized as one of the top arts schools in the country.1
Another unique high school in the County system is the Boyd J. Michael, III Technical High School , located near South Hagerstown High School and available to students in grades 11 and 12. In addition to a more typical core high school curriculum, technical high school students can take courses in nineteen different career and technology programs ranging from carpentry to criminal justice to digital communications. Some courses provide college credit through agreements with Hagerstown Community College and other two- and four-year institutions. The school has been open since 1972 and currently enrolls 642 students as of September 2020.
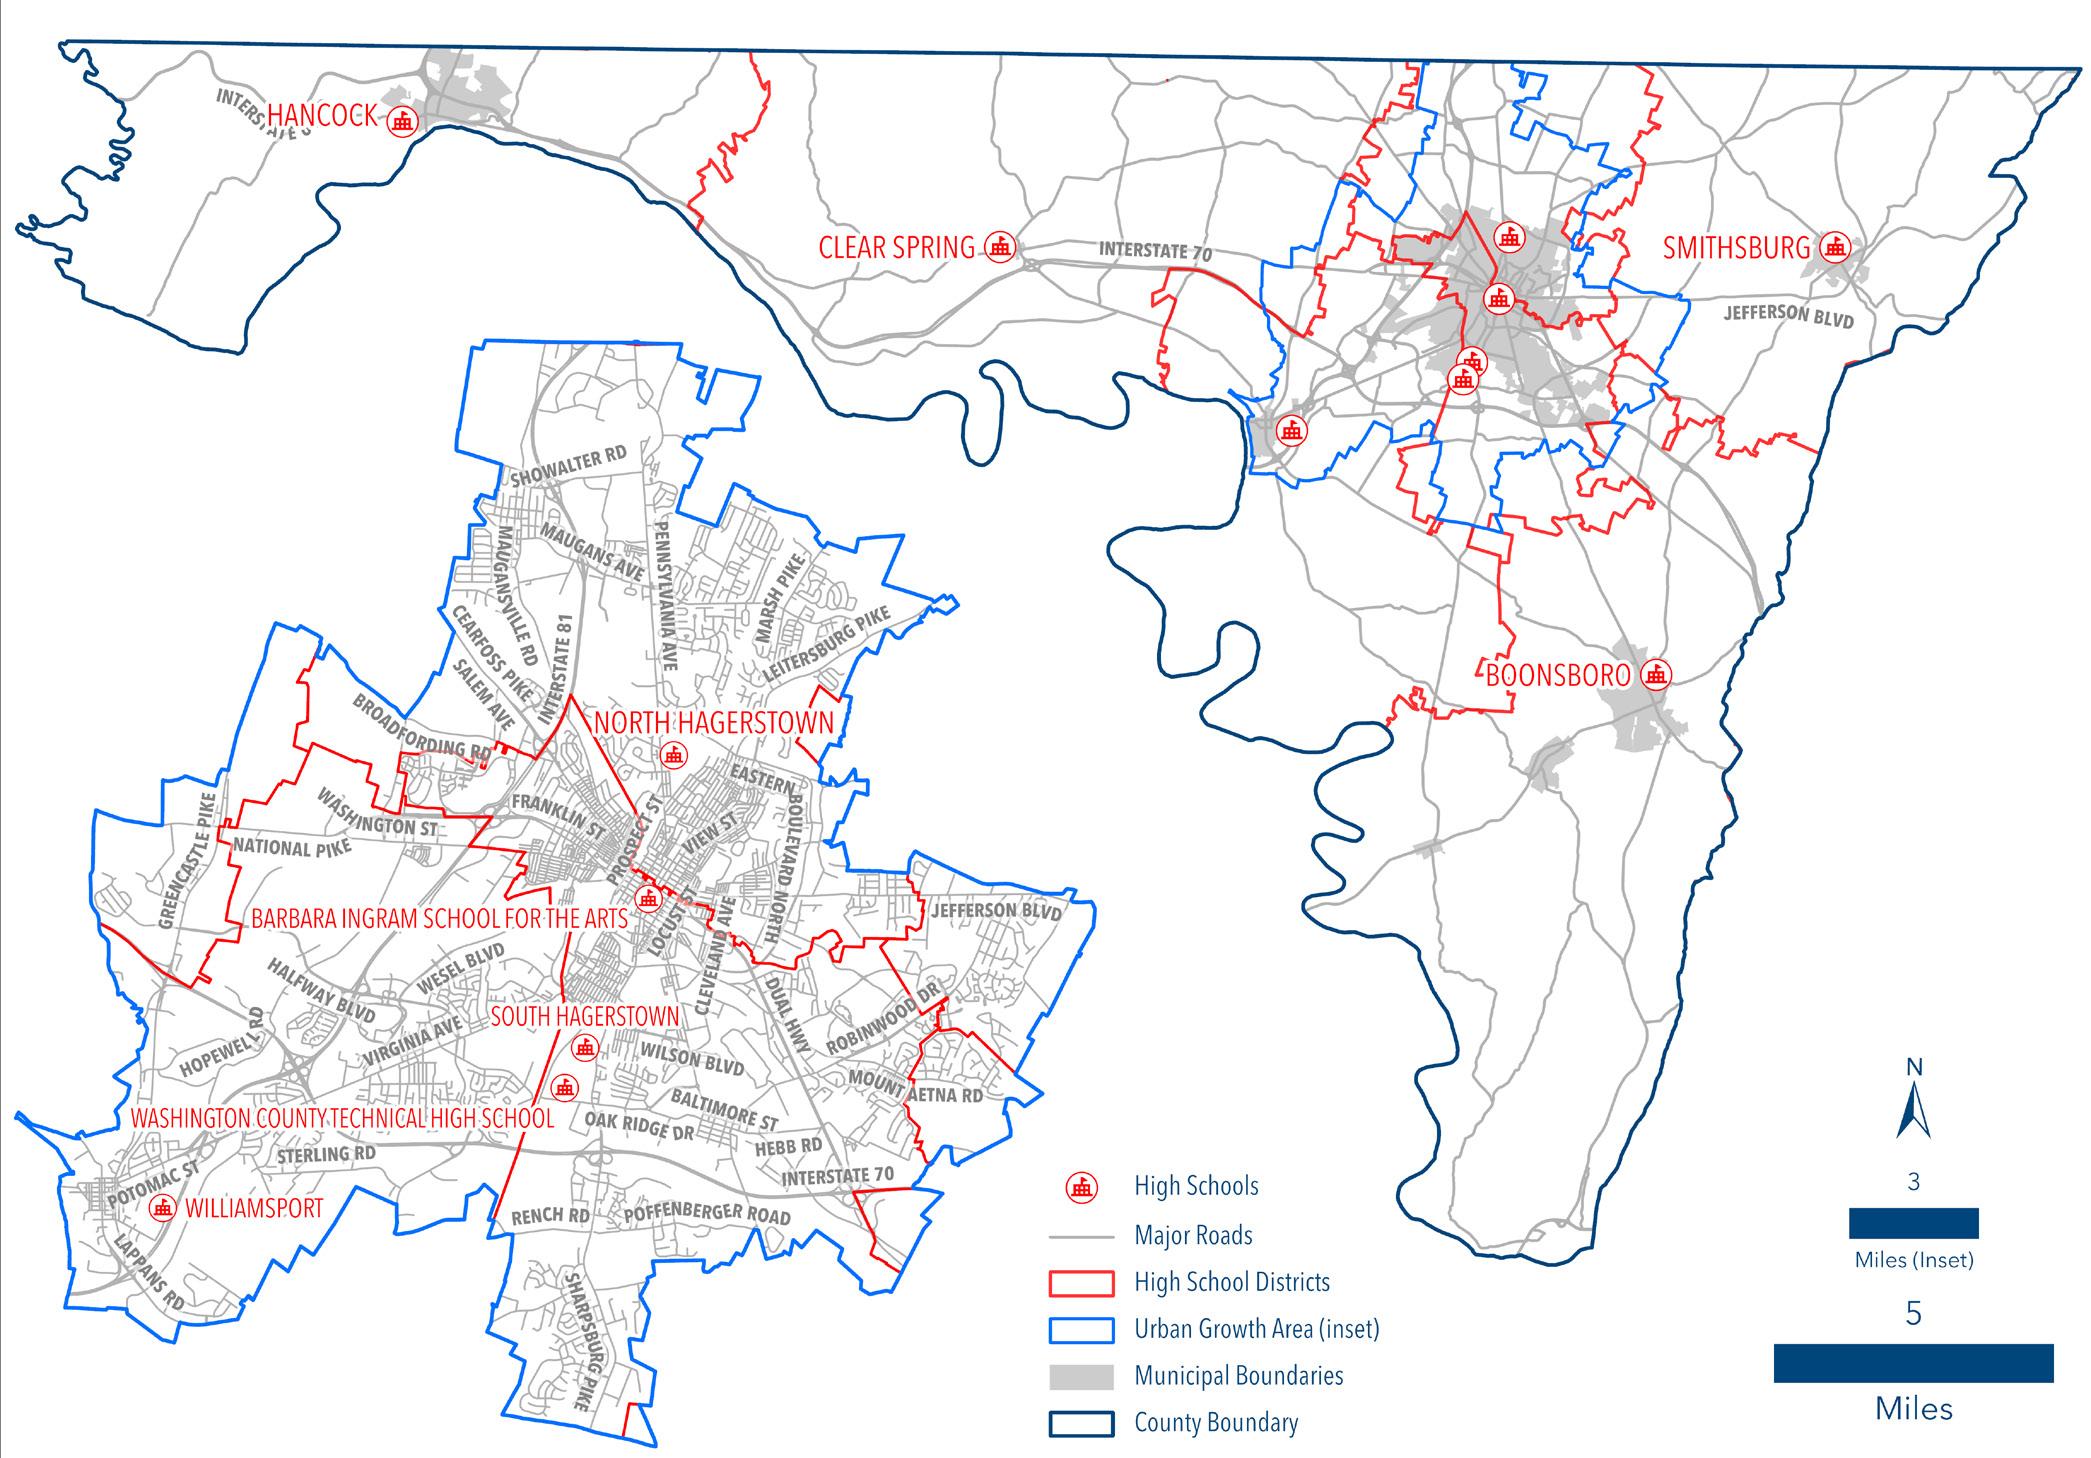
“The Washington County Job Development Center Program (JDC) serves the vocational training needs of special needs students ages 14 to 21. The students live at home and are served educationally through this public school program. Each student is placed in the JDC program through Special Education guidelines and placement process. All students receive vocational training and academics including language arts, math, computer skills and handwriting. They also receive life and work skills training including food service, housekeeping, building maintenance/woodworking, horticulture/grounds keeping, industrial assembly, work preparation/job placement skills, adaptive physical education and other individualized instruction designed with the student’s needs in mind. Students receive an educational program designed to enable them to earn a Maryland public schools high school certificate.”1
The Marshall Street School serves students with developmental, intellectual or learning disabilities, autism, or orthopedic impairment from ages 3-21. Both schools are based at the Marshall Street School in Hagerstown’s West End. Combined, the two programs serve 75 students as of September 2020 - 41 at Marshall Street School, 34 at the Job Development Program.
The Claud E. Kitchens Outdoor School at Fairview provides environmental education for 5th grade students who spend three days at the school near Clear Spring High School. The annual trip is available to all 5th graders in the Washington County Public Schools system as a part of their regular school year.
Antietam Academy, located near the South Hagerstown school complex, provides an alternative educational facility for students demonstrating difficulties in the areas of behavioral and emotional adjustment to the traditional school setting. The Evening High School Program allows students to earn up to two credits toward graduation requirements each semester.
Magnet Programs are provided for highly gifted and talented students, covering a variety of subjects, at a number of elementary, middle and high schools throughout Washington County Public Schools. Students must be invited to apply to these highly competitive programs.
Administrative Facilities
Washington County Public Schools (WCPS) administrative offices are located at 10435 Downsville Pike in Hagerstown. The WCPS Office of Information Services notes staffing levels of 214 administrative employees, 1,772 teachers and 1,236 support staff, as of 2022, on the WCPS website.
Private Schools in Washington County
According to the Private School Review, the private school enrollment in Washington County for the K-12 population was 3,064 students in 2022. This represents 12 % of the overall K-12 student population in the County. There are 22 private schools in Washington County, the majority of which are religiously affiliated.2
1 Washington County Public Schools, Marshall Street School/Job Development Program. http://wcpsmd.com/schools/special-pro-
2 Private School Review, Washington County Private Schools. http://www.privateschoolreview.com/maryland/washington-county, 2022.
The Washington County Public Schools Educational Facilities Master Plan (2021) provides an overview of the last 20 years in enrollment trends noting that from 2000-2006, a housing boom for the County, enrollment increased by 1800 students. 2014 and 2015 saw decreases in enrollment for the first time since 2000. Between 2016 and 2019 enrollment increased annually due to the expansion of Pre-K programs. However, in 2020 during the COVID-19 pandemic the school system saw a decrease of more than 1,000 students. Prior to the pandemic the population could be considered “static” for grades kindergarten through twelve.
The table below, taken from the Washington County Educational Facilities Master Plan, shows the projected surplus and deficit in seats from 2020-2027.
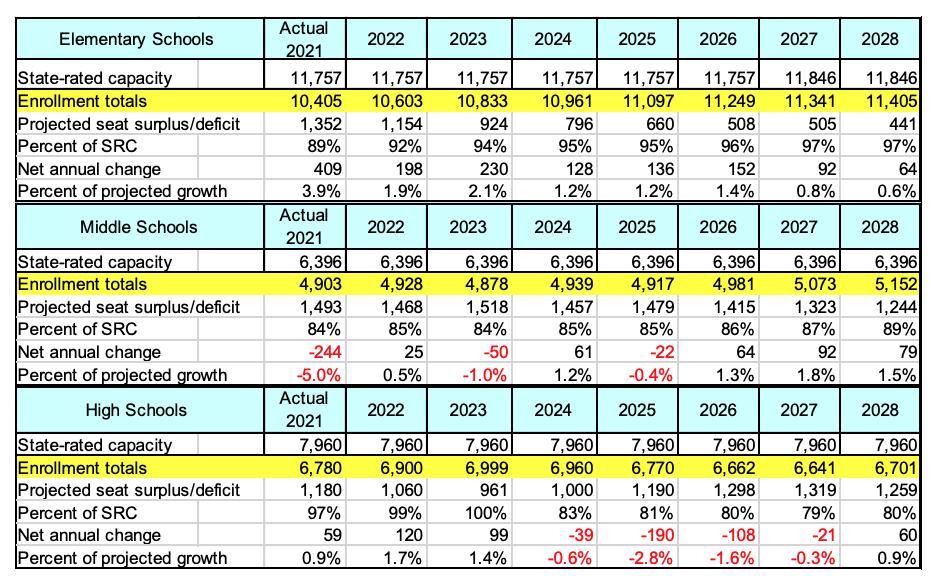
Table 8-1: Projected School Capacity 2020-2027
Middle school capacity appears, at first glance, to be of least concern according to these projected enrollment figures, as enrollment generally hovers around 90 percent of SRC during the time period surveyed.
Elementary and high school capacity is shown to be of greater concern according to these projections. The County’s APFO restricts elementary school capacity to 90 percent of SRC. In seven of the years surveyed, the projected or actual enrollment of the overall elementary schools system exceeded 90 percent (Percent of SRC in the chart. High school capacity is expected to reach 100% during the projected period before declining through 2027 to 81%.)
The seating capacity shown at the middle and high school level is a bit misleading because of where many available seats are located. A large number of available seats are located at Hancock Middle/High School, making redistricting impractical to fill those seats from elsewhere in the County. In addition, previous increases in elementary enrollment during the early to mid2000s will matriculate through the middle and high school grade levels in future years. As a result, several middle schools are expected to see enrollment growth, including Western Heights and Springfield which are anticipated to exceed SRC for the foreseeable future.1
A rebounding housing market locally has spurred renewed interest in the potential buildout of a number of larger subdivisions at various stages of development.2 Strong residential and commercial development in the southern portion of the Urban Growth Area, in particular, must be closely monitored for potential impacts on County Schools. South Hagerstown High was already at 111 percent of SRC in September 2020 according to the BOE Facilities Fact Sheet. These trends provide some indication that additional capacity at the high school level will have to be created at some point in the relatively near future.
The BOE’s Report listed the following schools as exceeding SRC:
Elementary – Boonsboro, Emma K. Doub, Fountain Rock, Fountaindale, Hickory, Paramount, Potomac Heights.
Middle – None
High – North Hagerstown High and South Hagerstown High
The EFMP lists projects for the public school system including new school construction, additions, modernizations, and systemic renovation projects. The list currently includes many modernization updates to keep facilities in use rather than build new or replace existing structures. The current County CIP has maintenance in the immediate fiscal years with one new elementary school planned. With 25 of the 47 WCPS centers reaching 50 years of age in the next 10 years, and many of those buildings being inefficient and not up to current education standards, replacement would be recommended. However, the current EFMP states the “current County CIP plan and funding commitment is unsustainable, and will not support Washington County’s long-term community, educational, and economic needs.”3 The figure below illustrates County’s current commitment to the listed projects, which totals $198 million.
Lovelace,
“Housing market’s return leads to potential Washington County Public Schools enrollment increases.” https://www. heraldmailmedia.com/news/local/housing-market-s-return-leads-to-potential-washington-county-public/article_292d8ffc-b5ce-11e7-8e9cb3984b86f027.html.

Hagerstown Community College (HCC)
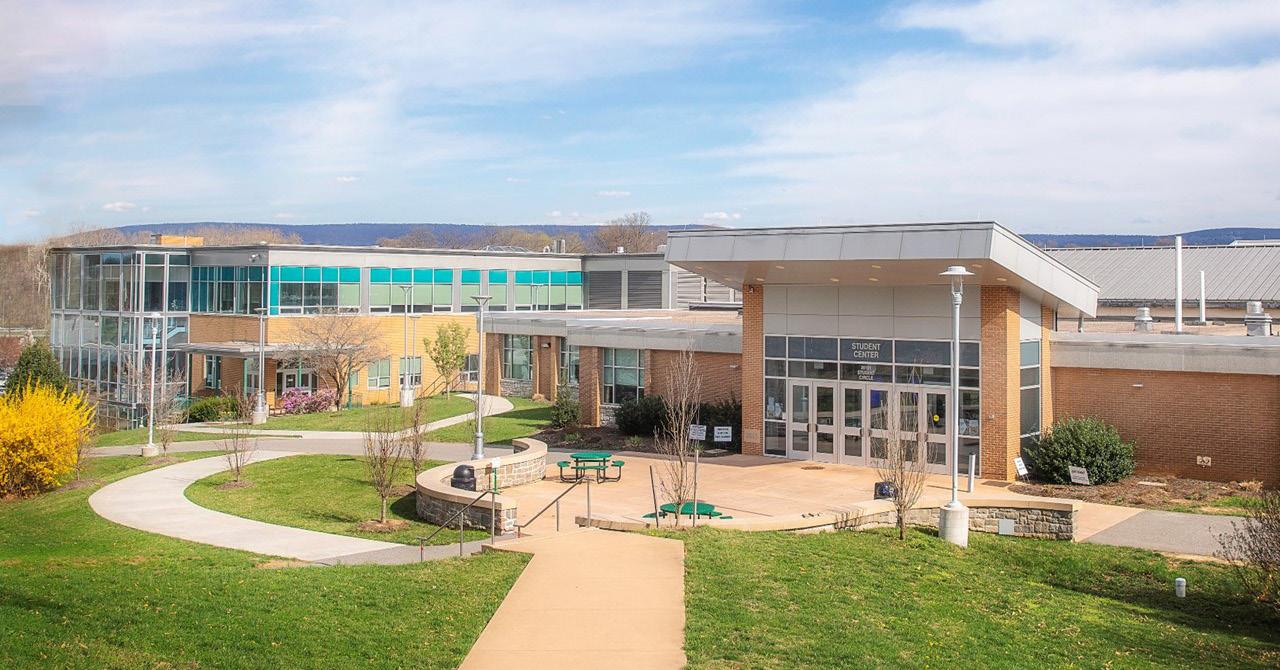
Hagerstown Community College (HCC) is a 319 acre, 18 building campus, on Robinwood Drive in the County’s Urban Growth Area east of Hagerstown’s city limits. HCC awards associate’s degrees, certificates and letters of recognition. HCC offers more than 100 programs of study that are utilized by roughly 5,000 students seeking college credits and another 5,000 students pursuing continuing education classes. More than 900 high school students also take classes at the Community College each year through the ESSENCE Program and the STEMM Technical Middle College.1
A variety of facility improvements are ongoing at the HCC campus. The County’s current CIP (2023-2032) has budgeted $28 million for facility upgrades during that ten year period. These improvements include renovation of the Athletic, Recreation, and Community Center (ARCC) and Advanced Technology Center (ATC) as well as second entrance improvements.
The University System of Maryland at Hagerstown (USMH) is a regional higher education center that currently offers more than 20 programs of study from 5 USM institutions. Participating universities include the University of Maryland, College Park; Towson, Salisbury, Coppin State, and Frostburg State Universities, as well as the University of Maryland University College. All undergraduate programs begin at the junior level, so all undergraduate students transfer in from community colleges or partner universities. USMH occupies a series of renovated historic buildings in the heart of downtown Hagerstown. The renovations, which were completed in 2005, preserved the historic character of the buildings while still adding modern architectural features and facilities that serve 21st century educational needs. The USMH complex includes 44 offices, 22 classrooms, 4 interactive video network (IVN) classrooms, 6 computer labs, 2 nursing labs and a library/ media center over 77,000 square feet. Enrollment in the fall of 2022 was 210 students.
Services affecting public safety including law enforcement, correctional facilities and judicial services are cooperatively provided by local and State entities within Washington County. These entities include the Washington County Sheriff’s Office, Washington County Judicial Services Division, Washington County Detention Center, Hagerstown Police Department, the Maryland State Police, Maryland Correctional Institution, Maryland Judicial System and municipal law enforcement agencies. These facilities are shown on the map below and detailed in the following pages.
Approximately $57.8 million has been appropriated in the current Washington County CIP (2023-2032) for all public safety improvements, including those to police, fire, correctional and emergency services. These improvements include more than $8 million for continued expansion of the centralized training facility for police, fire and emergency services (EMS) personnel to meet the growing demand for trained EMS personnel within the County.

The Washington County Sheriff’s Department is located at 500 Western Maryland Parkway in Hagerstown. Located on the site are the Administration and Patrol Divisions, Narcotics Task Force as well as the Washington County Detention Center. The Washington County Sheriff’s Department provides a variety of law enforcement services to the County, including crime prevention, criminal investigation, patrol and traffic units, courthouse security, school resource officers, two community deputies and more. The Sheriff’s Department also staffs and operates the Detention Center, which houses roughly 425 male beds and 70 female beds with special needs beds.1
As an alternative to incarceration, Washington County Sheriff’s Office’s also provides a Day Reporting Center next to the Detention Center. This facility offers an on-site, nonresidential, program that is designed to change an offender’s adverse thinking patterns and attitudes, improve job skills and job retention. The program blends community supervision with intensive case management, intensive treatment for substance related disorders in group and individual settings, medication assisted treatment using Vivitrol, random alcohol and drug testing, and job training for those with inadequate work skills and lack of stable employment, life and soft skills, financial education, step study, coaching and pro-social supports. The program will refer individuals to community providers for mental health services and medication management. The program is open to Washington County residents who have not committed a violent crime, do not have pending charges, and meet several other criteria outline on the Washington County Sheriff’s Office website.2
The Maryland State Police (MSP) operates twenty-three barracks across the State. Barrack O is in Washington County on Col. Henry K. Douglas Drive near its intersection with I-70 and MD-65. The Maryland State Police work in a cooperative fashion with local law enforcement agencies to address public safety throughout the County. The Field Operations Bureau (FOB) is the division of the Maryland State Police responsible for providing law enforcement services at barracks statewide. Approximately 75 percent of MSP sworn personnel are assigned to this bureau.3 FOB also includes Special Operations and the Transportation Safety Command.
The Hagerstown Police Department (HPD) is located at 50 North Burhans Boulevard, Hagerstown, in the former train station. HPD provides law enforcement services within the corporate boundary of the City of Hagerstown. HPD includes several divisions, including Patrol, Internal Affairs, Crime Analyst, Criminal Investigations, Narcotics Task Force and more. The Patrol Division is the largest division of the HPD and includes four platoons of officers and a K-9 unit. The Downtown Squad of the Patrol Division is housed within the University System of Maryland at Hagerstown complex at 34 West Washington Street, where it often provides law enforcement coverage for special events in the city center. The Burhans Boulevard station is also home to the Western Maryland Regional Crime Laboratory, which provides forensic services for crime scene investigation to Federal, State and local law enforcement agencies.
1
iffs-office-history/, 2022.
2 Ibid. Day Reporting Center. https://washcosheriff.com/day-reporting-center/ , 2022.
HPD and the Washington County Sheriff’s Department cooperatively staff and operate the Washington County Special Response Team (SRT), created in 1999.1 This specially trained and equipped unit of officers and deputies from various units within each agency is designed to respond to and resolve situations requiring skills, training, and equipment not typically available to the average police officer. These non-typical responsibilities include hostage situations, snipers, execution of high-risk drug search and seizure warrants, apprehension of known violent criminals, and protection of V.I.P.’s.
The Maryland Correctional Institution – Hagerstown (MCI-H) is one of three state prisons located on 880 acres of land located just south of Hagerstown off Sharpsburg Pike (Route 65) on Roxbury Road. This medium security facility houses approximately 739 male offenders who stay an average of 97.5 months2. The facility’s operating budget was $53.9 million in FY2020 with an annual cost per capita of $85,6163 with a ratio of 1.4 to positions. In-house services offered by this correctional facility include secondary education and vocational training, plus a substance abuse program for inmates. The facility is also the hub for Federal Immigration and Customs Enforcement hearings and housing and serves as the regional open parole hearing facility.
Nearby, the Roxbury Correctional Institution (RCI) is a medium security facility housing an all-male inmate population of 1,670 offenders according to 2020 Inmate Characteristic Reporting. Its annual budget, according to FY2020 reporting was $58.3 million. The ratio to positions for the facility is 4.42 with an annual per capita cost of $33,342 according to the same report. Inmates, who stay an average of 97.2 months at the jail, produce material for the Maryland Motor Vehicle Administration, provide recycling and agricultural services, and train hard-to-place shelter dogs for placement with families.4
The third correctional facility in Washington County is the Maryland Correctional Training Center (MCTC). MCTC housed 2,672 male inmates who stayed an average of 66.6 months in 2020 according to the same Inmate Characteristic Report. The $83.4 million operating budget reflects a ratio to positions of 4.96 and an annual cost per capita of $29,310 in the 2020 Fiscal Year reporting. The facility provides academic, vocational and job readiness training. The facility is home to the Maryland Correctional Enterprises operation that repairs and re-manufactures cartridges for laser printers, fax machines and copiers, saving the state millions of dollars. Inmates also train service dogs for wounded and traumatized veterans who served in Iraq and Afghanistan.
Washington County is home to three courthouses, all of which are located in downtown Hagerstown within close proximity of one another near Summit Avenue and West Antietam Street. The Washington County Orphan’s Court is a specialized court that handles wills, estates, and other probate matters and limited aspects of guardianship.
The District Court handles the majority of cases in Washington County, which are argued before a judge only, not a jury. Cases heard in District Court include traffic violations and other misdemeanors, domestic violence, peace order petitions, landlord-tenant disputes and civil cases involving limited dollar amounts.
The Washington County Circuit Court generally handles more serious criminal cases, major civil cases, including juvenile and other family law cases such as divorce, custody and child support and most cases appealed from the District Court, orphans’ courts and certain administrative agencies. Cases may be argued before judges and/or juries.
The Washington County Division of Emergency Services includes the Departments of Emergency Communications, Emergency Management, Fire and Rescue Operations, Emergency Air Unit, and Special Operations. The map below shows fire and rescue companies operating in Washington County. The County also has mutual aid agreements with numerous State agencies, all surrounding Counties and has developed working relationships with volunteer organizations including the fire and rescue units that are active in incorporated communities and in rural areas.
Map 8-7: Fire and Rescue Companies in Operation

Washington County has a total of 14 volunteer fire companies and 7 rescue/ambulance companies. While most staffing within these organizations is provided by volunteers, some employees are hired in paid career positions essential to operational administration. The fire and rescue companies operating in Washington County are shown in the table below.
Name Engine
First Hagerstown Hose Company Engine City 1
Antietam Fire Company Engine City 2
Independent Fire Company Engine City 3
Western Enterprise Fire Company Engine City 4
South Hagerstown Fire Company Engine City 5
Pioneer Hook & Ladder Truck City 1
The Washington County Emergency Rehab Unit is currently housed at Station 25 at 17556 York Rd in Hagerstown. The Rehab currently runs a 2011 Freightliner equipped with supplies for the Rehab Sector of an emergency scene they may be needed on. The mission of the Rehab Unit is to respond to assist Fire, Emergency Medical Services (EMS) and local law enforcement by supplying necessary food, fluids, and rehabilitation operations. The unit also supports EMS in the rehab section with materials such as pop-up tents, misting fans, cooling chairs and some additional medical supplies to assist with monitoring patients.
The Washington County Technical Rescue Response and Mitigation unit (Special Operations) provides the county fire and rescue departments and the citizens of Washington County with specialized equipment, training, and personnel in the fields of Hazardous Materials Emergencies, Technical Rescue and Disaster Management. The unit is currently located on Frederick Street in Hagerstown.
Emergency Air Unit
The Washington County Emergency Air Unit provides breathable air support for emergency service agencies and other companies working on different types of incidents such as working fires, those involving hazardous materials, and special rescue operations. The Air Unit is also located at Station 25 on York Road in Hagerstown.
Emergency Communications
The Washington County Emergency Communications Center (911 Center), is located on Elliott Parkway in Williamsport. Emergency communications resources were consolidated at this location, which installed wireless capability in 2005 that more accurately tracks the location of a caller using GPS coordinates, thereby ensuring quicker response times. Next-Generation 911 implementation is ongoing with this facility upgrading equipment to handle text, video and voice for 911 communications.
The Washington County Emergency Management Office (EM), also located at the County’s Administrative Offices in downtown Hagerstown, is the primary entity in charge of analyzing natural or man-made threats to the community. Amongst other responsibilities, EM works with other agencies to develop a Basic Emergency Operations Plan which describes how the community’s resources will be organized and deployed in the event of a disaster. EM works to address mitigation, planning, response and recovery efforts in emergency response situations. The Multi-Hazard Mitigation Plan is a key preventative planning tool spearheaded by the Department which also helps to reduce vulnerability to natural and man-made public emergencies.

Washington County is fortunate to receive the voluntary effort of many local citizens who selflessly donate their time and effort to protect their neighbors from hazards such as fire. However, like many localities who rely on volunteers to provide vital community services such as firefighting in less populous areas, Washington County has seen a measurable decline in volunteerism for these important jobs. Fewer volunteers result in more difficulty in emergency providers meeting industry standard response times.
Accordingly, the County has begun proactively addressing the problem through a multi-pronged approach. Incrementally, the County is looking to increase the number of paid, career positions at fire companies. Hiring more full-time drivers is the first step in this transition towards a more balanced staffing system which is less reliant on volunteers to supply the bulk of the labor.
In addition, the County is also looking to provide increased training and incentives for both paid and volunteer emergency personnel to continue filling these vital roles. A significant investment in achieving these ends is the development of the new Public Safety Training Facility near the Westfield’s development on Sharpsburg Pike in southern Hagerstown. It provides a centralized facility for knowledge, skills and fitness training for emergency personnel throughout Washington County.

Founded in 1898, the Washington County Free Library System is the second oldest county-wide library system in the Nation.1 The System is comprised of eight libraries and a Bookmobile. The central library is located in downtown Hagerstown with branches located in Boonsboro, Clear Spring, Hancock, Keedysville, Sharpsburg, Smithsburg, and Williamsport. The bookmobile was the first mobile library in the U.S. when it opened in 1905, propelled by horse and buggy.2
The Hagerstown library also houses the Western Maryland Room, established in 1968 to preserve historical information about the region. The Room contains approximately 10,000 books and substantial archival material including maps, newspapers, photographs, and other artifacts covering the Cumberland and Shenandoah Valleys, all of Western Maryland, plus Frederick and Carroll Counties to the east. Some material is also included for all Counties adjacent to those five Maryland counties in the three surrounding States of Pennsylvania, Virginia and West Virginia.
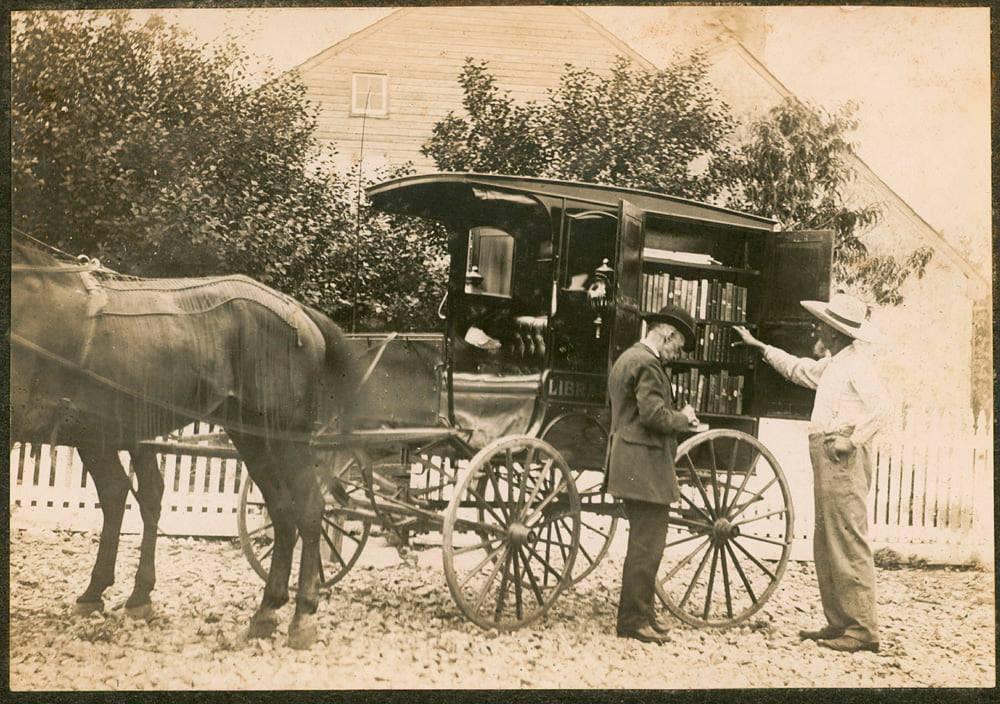
This library also offers genealogy resources for those individuals looking to trace their family history and a variety of informational tools on business and governmental affairs for citizens, officials and students.
The bookmobile carries approximately 4,000 items to schools (public, private and home), daycares, nursing homes, retirement communities as well as neighborhood and community stops. The bookmobile will visit any location that agrees to check out at least 15 materials per month and has space for the vehicle to park and turn around. The bookmobile also offers homebound service for individuals who can’t reach a library branch because of physical limitations, age, or lack of mobility. Patrons must agree to use only the bookmobile to qualify for this service.
The Washington County Free Library System is an independent agency governed by a ninemember Board of Trustees. The System draws operating revenues from the City, County, and State, as well as from fines, fees, donations, capital and endowments. Libraries are staffed by both paid employees and volunteers. According to the library system’s Fiscal Year 2022 annual report for every $1 spent on the system, the community received more than $5 worth of services. More than 50% of residents are cardholders with the library system.
Washington County’s current ten-year CIP (2023-2032) has a budget of $216,492 which includes the planning stage of a Williamsport library replacement. The 8 branches of the Washington County Free Library system are shown below.

The major push in communications technology in Washington County, as it is elsewhere in many parts of the country, is to extend high-speed internet service (broadband) to as much of the County as possible. Much of modern life, including both people’s personal and professional lives, now takes place online. Accordingly, to capitalize on the economic and community development aspects of this technological shift, counties are keen on providing the communications infrastructure necessary to be competitive in attracting new businesses and residents to the area, while also supporting those who already reside here.
There are several broadband providers who collectively supply service to the majority of Washington County. A variety of broadband technologies are provided by these companies, including fiber optic cable, cellular, DSL, and wireless.
There are also “big pipe” carriers with fiber installation running along I-70 and I-81 that could be tapped by companies needing higher speeds and capacity for their business application needs. Several companies maintain large fiber runs connecting to Ashburn, VA; Washington, DC; Philadelphia, PA; and New York City.1
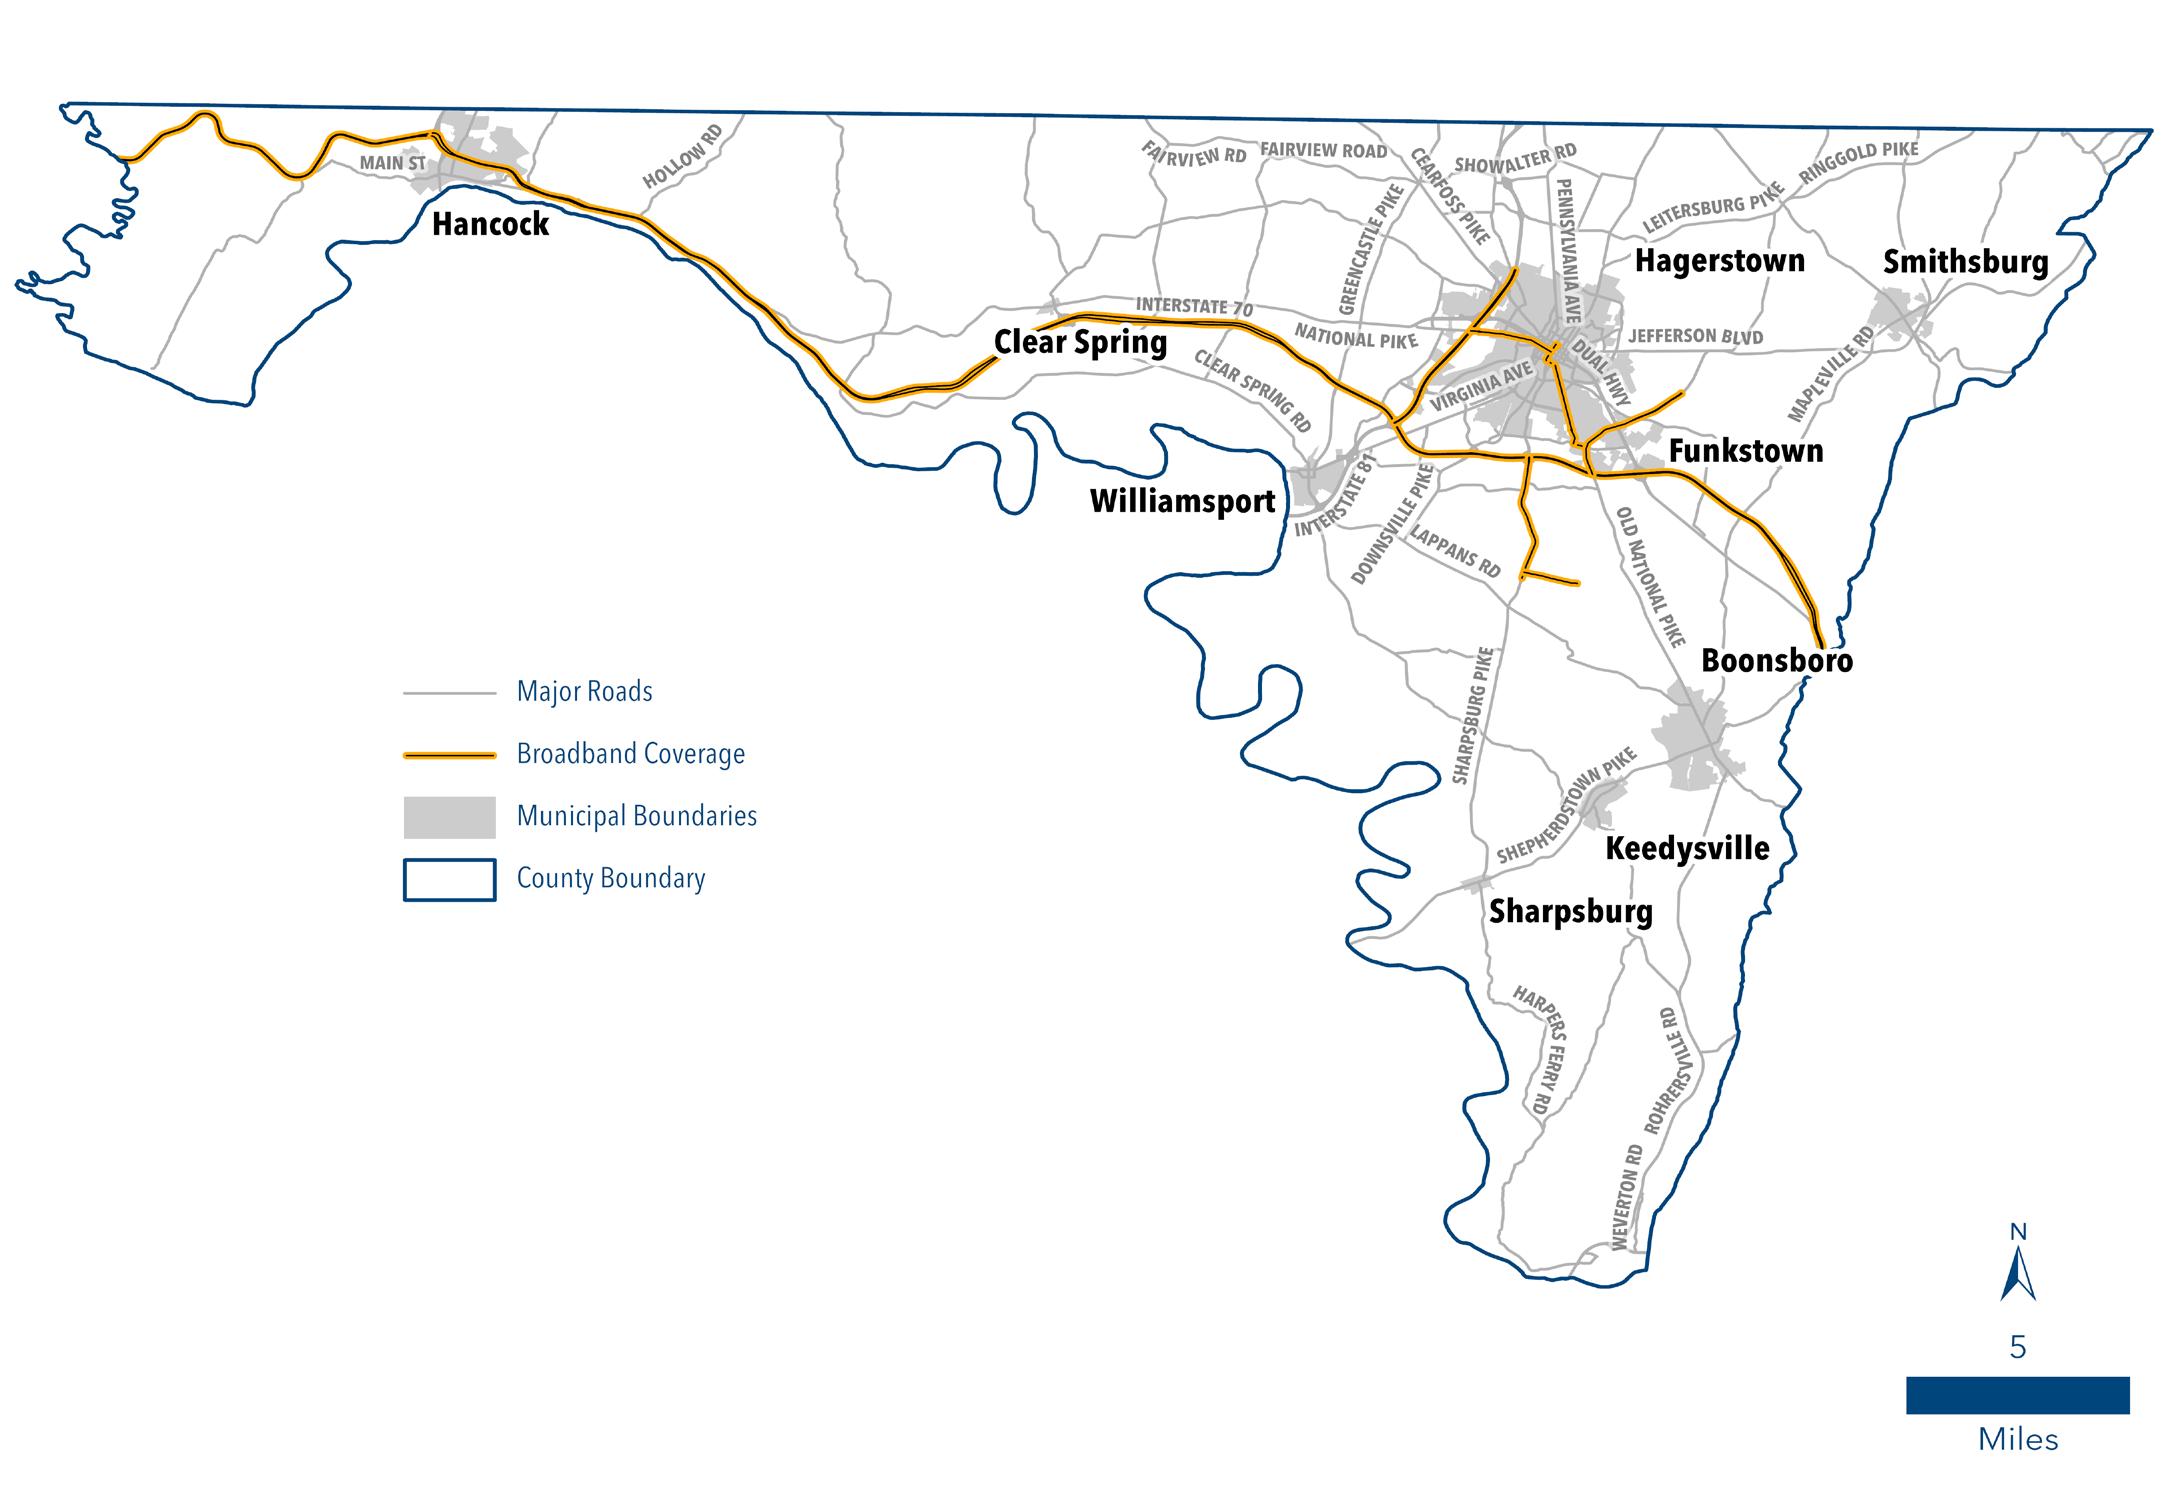
Maryland Broadband Cooperative (MDBC), a public-private partnership, also has broadband infrastructure within Washington County. MDBC is a member-owned and operated universal access, fiber optic network designed to deliver an advanced broadband network across the rural communities in Eastern, Southern and Western Maryland to foster economic development and public service delivery. The MDBC receives funding to build the infrastructure through the Maryland Rural Broadband Coordination Board, which was formed under Senate Bill 753. The map above shows the route of MDBC’s fiber optic network through the County in yellow.
Washington County retains the authority to determine appropriate sites for the location of commercial communications towers. Under most circumstances, the State and local authority over the placement, construction and modification of personal wireless communications services is preserved under the Federal Communications Act of 1996, Section 704. Washington County also took steps in 1999, through the amendment of its Zoning Ordinance, “to minimize the visual impact of towers, to minimize the number of towers through shared use and colocation, to encourage utilization of designs that either eliminate or reduce the need for new towers, and to ensure that all towers are compatible with surrounding natural and man-made land uses.1” The amendment also gives special attention to the siting of towers along the Appalachian Trail, Antietam Overlay zones, and Historic Preservation zoning districts for similar concerns over land use compatibility. Commercial communications towers are considered a principal permitted use in most County zoning districts, except for residential districts, where they are prohibited.
The 400 acre facility is located on U.S. 11, adjacent to Interstate 81, three miles north of the City of Hagerstown. HGR has an air traffic control tower (one of only two municipal airports in Maryland), state-of-the-art navigational aids and the second longest runway in the State of Maryland. HGR has room for four airlines and several car rental agencies. The Transportation Security Administration (TSA) provides passenger security screening and the Washington County Sheriff’s Department provides law enforcement support to HGR. Commercial businesses located on the property include a fixed base operator (FBO) with numerous large commercial and corporate hangars, maintenance repair operations, and some corporate entities. The airport is discussed in more detail in the Transportation element of this Plan.
The Washington County Health Department is a part of the Maryland Department of Health as well as an agency of the County government. The Department is headquartered on Pennsylvania Avenue in Hagerstown. The Washington County Commissioners serve as the official Board of Health. The Department is funded through a combination of Federal, State, and local dollars, plus third-party and private-pay reimbursements.
The major programs offered under the Health Department umbrella include Adult Services, Behavioral Health, Children’s Health, Communicable Disease, Environmental Health, Maternal and Reproductive Health, Teens, Wellness and Health Promotion as well as other services. These programs are targeted towards people of all means, ages, and abilities. The services offered by various organizations under these range of programs include immunizations, health screenings, substance abuse treatment and prevention, health and nutrition support for low income families and/or children, identifying and limiting the spread of communicable diseases, addressing public health concerns by ensuring the provision of clean air, water and food, offering confidential health services to teens, maternal and reproductive health, and providing transportation to Medicaid medical appointments for those unable to travel on their own.
Other Health Department programs are provided at alternative locations throughout the County by various entities, such as the WIC Certification Clinic on Burhans Blvd in Hagerstown, the Jail Substance Abuse Program at the Detention Center on Western Maryland Parkway, and Tri-State Community Health Center in Hancock.
The Washington County Administration Building, Office of Disability Issues enforces Title II of the Americans with Disabilities Act within County Government, to guarantee that all County programs and activities are open to, and usable by, all County citizens. The Office is the official County government liaison with the Washington County Disabilities Advisory Committee (DAC), which provides advice and guidance to the Board of County Commissioners on matters of interest and concern to our citizens who have disabilities.
The Washington County Parks and Recreation Department was established to provide affordable recreation and fitness classes for local residents of all ages. The Department is headquartered on Robinwood Drive in Hagerstown. Parks and Recreation holds a wide variety of classes at a number of facilities throughout Washington County including community recreation facilities at four elementary schools (Maugansville, Pangborn, Rockland Woods and Ruth Ann Monroe), at the Agricultural Education Center on Sharpsburg Pike, Williamsport Community Center, Hagerstown Community College, and the Washington County Parks Department on South Potomac Street in Hagerstown.
The Washington County Department of Social Services, the local office for the Maryland Department of Human Resources (DHR), the State’s primary social service provider, is located on North Potomac Street in Hagerstown. DHR assists people in economic need to independently support themselves and their families, provides preventative services and protects vulnerable children and adults from abuse and neglect.
A number of boards and commissions serve in an advisory capacity to the Washington County Board of Commissioners in health-related matters for specific interest groups within the County. Some of these bodies also provide programs and services and have their own community facilities that help to address public health in Washington County. Others simply meet monthly in the County Administration Building at 100 West Washington Street in Hagerstown.
• Washington County Commission on Aging (535 East Franklin Street, Hagerstown)
• Washington County Commission for Women (County Administration Building)
• Washington County Disabilities Advisory Committee (Administration Building)
• Washington County Social Services Board (122 North Potomac Street)
Meritus Health, a non-profit regional hospital, is the largest health provider in Western Maryland. In December of 2010, Washington County Hospital, at the southern end of downtown Hagerstown, was closed as the Washington County Health System relocated to the Robinwood Professional Center where an expanded medical campus was formed.1 Meritus Medical Center became the flagship facility within this campus in 2011. “Twenty primary and specialty care practices that make up Meritus Medical Group provide nearly 200,000 outpatient
Meritus Medical Center, the primary health care facility on the medical campus, has 300 beds and a variety of advanced health care services. These include a special care nursery, a level III trauma program, a primary stroke center, and a wound center, as well as a cardiac diagnostic laboratory. Other hospital services that address outpatient needs are the John R. Marsh Cancer Center, Total Rehab Care, the Center for Clinical Research, and the Center for Bariatric Surgery. Numerous specialty care services are offered on the medical campus.
Meritus Medical Group also has primary care facilities in North Hagerstown, Williamsport, Cascade, and Smithsburg that offer family, pediatric, adult and internal medicine services. Meritus Urgent Care is located on Crayton Blvd. Meritus is also contracted to provide health care services to students attending Washington County Public Schools. Nurses provide onsite health care to students, including first aid, health screenings for vision and hearing, referrals for more serious health conditions, administer prescription medication and more. The School Health Program serves an average of 500-700 students per month in school health rooms.1
Western Maryland Hospital Center, located at 1500 Pennsylvania Avenue in Hagerstown, first opened its doors in 1957. Owned and operated by the State of Maryland, WMHC is an acute long term care hospital with a 120 bed capacity. The Western Maryland Hospital Center features three programs: Specialty Hospital, Brain Injury and Comprehensive Care. The Specialty Hospital program admits patients who are ventilator dependent, require frequent intervention, rehabilitation, Peritoneal Dialysis, Total Parenteral Nutrition or special isolation. The Brain Injury Program is a dedicated inpatient unit offering short- and long-term acute rehabilitation designed to meet the needs of individuals with a recent diagnosis of stroke, traumatic brain injury or other acquired brain injury resulting in activity limitations and participation restrictions. The Comprehensive Care Program is licensed as a skilled nursing home unit, certified by Medicare and Medicaid, for either short term or longer term residents. A variety of physical and occupational therapy, speech pathology, and therapeutic recreational services help many patients achieve greater levels of bodily independence. The Maryland

Department of Health Master Facilities Plan (2022-2041) Phase I currently includes “Identifying strategic partners to transfer services from Western Maryland Hospital Center in Hagerstown and Deer’s Head Hospital Center in Salisbury to healthcare and community providers;”, which may result in privatization of this facility.
The Community Free Clinic, located on Mill Street in downtown Hagerstown, provides free health care to Washington County citizens who are uninsured. The Clinic is funded solely by grants, fundraisers, community contributions, and individual donations. Washington County contributes money to the Community Free Clinic.
The Hagerstown Veterans Affairs Outpatient Clinic, a division of the Martinsburg Veterans Affairs Medical Center, is located on Eastern Boulevard in Hagerstown. The clinic provides high quality medical services to Veterans in the Hagerstown area. Services include preventative health care and screening, annual physicals, immunizations, management of chronic illnesses, women’s health, educational services and more.
Brook Lane Health Services is a non-profit, continuum of mental health services treating people of all ages. Brook Lane’s main campus is located along the Leitersburg- Smithsburg Road near Leitersburg, Maryland. Outpatient services are also offered at Brook Lane North Village office, located in the shopping plaza near the intersection of Pennsylvania Avenue and Longmeadow Road.
Numerous other private and non-profit entities provide social services independently of, or sometimes in cooperation with, the network of community facilities provided by Washington County. Links to many of these agencies can be found by visiting Washington County’s homepage (www.washco-md.net).
The Washington County Arts Council (WCAC) was formed in 1967 to advance and integrate the arts into local community life. Created by legislation from the Maryland General Assembly, Maryland was one of the first States in the nation to create a State Council for the Arts in order to preserve its culture and heritage.1 In 2001, Hagerstown was among the first group of communities in the State to establish an Arts and Entertainment District, in accordance with further State legislation. Tax incentives were utilized to encourage the placement of arts institutions in municipal downtowns around the State to stimulate the economy and to improve local quality of life.
Currently located in the historic Walker House on South Potomac in the heart of downtown Hagerstown, WCAC is funded by grants from the Maryland Arts Council, Washington County Board of Commissioners, City of Hagerstown, and contributions from various private parties.
The building on South Potomac serves as a gallery and retail shop where area artists can display their work, while also providing revenue for the organization to carry out its mission. WCAC is governed by a Board of Directors comprised of members representing the arts, business and education sectors who serve up to two three-year terms.
Established in 1931, the Washington County Museum of Fine Arts (MFA) is an accredited museum housing more than 7,000 works of art.1 The Museum’s collection leans towards American art, regional art and world cultures. The MFA not only curates and presents pieces from its collection, but also interprets the work through a variety of public events such as educational exhibitions, lectures, films, art instruction and other programs to ensure that residents and visitors of all ages gain greater understanding and appreciation of fine arts. The building housing the museum is a historic structure protected by an easement of the Maryland Historical Trust.
The Washington County Agricultural Education Center is a 54-acre facility that is located 8 miles south of Interstate 70 on MD 65 (Sharpsburg Pike). The multi-use facility that hosts a variety of special events, particularly those related to the County’s agricultural heritage, is open for public rental. The Washington County Agricultural Education Center is part of the Washington County Parks and Recreation Department.
The Ag Center is also home to the Rural Heritage Museum. The Museum consists of three buildings displaying more than 3,500 artifacts.2 The first depicts early rural life in Washington County prior to 1940. The second houses farm equipment and implements that help illustrate the progression from human and horse-powered agricultural technology to the motorized era. Museum three shows modes of transportation used prior to 1940. The Museum also includes a Homestead and Village displaying log homes, brick wood fired bread oven, windmill, gardens, log church, doctor’s office, cobbler, blacksmith shop and other buildings indicative of the County’s pre-modern history.
Originally built in downtown Hagerstown in 1915, the Maryland Theatre has gone through many use incarnations from vaudeville shows to movies to a performance space for music and theater. The Theatre fell into disrepair by 1976 and was nearly dismantled and sold purely for its bricks. Local historic preservation efforts helped to save the Theatre from demolition, and it has been reopened to the public since 1978.1 Today, the Maryland Theater is home to the Maryland Symphony Orchestra. It also hosts the monthly Wind Down events in downtown Hagerstown when streets around Public Square are closed to motor vehicles and opened to pedestrian traffic, food and music vendors. The Theatre is also the performance space for the Barbara Ingram School for the Arts, located next door. A variety of other live performance events are held within the space as well, running the gamut from theater to popular music, to comedy and more.
The Maryland Theatre, Washington County Public Schools and the University System of Maryland at Hagerstown have grown their presence and offerings in Downtown Hagerstown as a part of the public-private partnership fostered by the Urban Improvement Project revitalization effort. A $13 million project resulted in a 30,000-square-foot expansion of the Maryland Theatre, creating a new entrance, performance space, elevator and stair tower and several offices. A plaza and outdoor events space in the rear of the building links to an expanded Cultural Trail. The project also enhanced disabled access, restroom facilities and provided other improvements to the Theatre.
The Hagerstown/Washington County Convention and Visitors Bureau (CVB) is a non-profit organization that seeks to promote tourism derived economic development throughout the City and County through the marketing and promotion of attractions, businesses, events and services. The CVB operates the Visitor Welcome Center just north of Public Square on Potomac Street, where its offices are located. The CVB is guided in its work by a 15-member Board of Directors comprised of members representing various facets of the local tourism and business sectors. The Board has directed that the CVB put 70% of all funds towards operations, marketing, programs, advertising, and publications.2

The majority of the County government’s administration is housed at the Washington County Administration Complex located at 100 West Washington Street in Hagerstown. The complex houses many County offices including the Office of Budget and Finance, Division of Information Systems, Division of Public Works and the Division of Health and Human Services and many more. The Washington County Board of County Commissioners hold their regular weekly meetings at this location. Numerous other boards and commissions meet regularly at the Administration Complex, including the Washington County Planning Commission, Board of Zoning Appeals and Animal Control Board, to name just a few. The Washington County Circuit Court has been joined to the Washington County Building, located immediately south at 24 Summit Avenue, where a variety of land records and other official documents are stored, aside from the judicial services which dominate the building’s use.
Nearby to these two County facilities is the Washington County Office Building, located at 33 and 35 West Washington Street. Within this Building are the County Treasurer, State’s Attorney, Disabilities Coordinator, the Western Maryland Consortium and Alternative Sanctions.

Another major County government facility is the Washington County Administrative Annex located at 747 Northern Avenue. This facility houses the Engineering, Permits and Inspections, and Planning and Zoning offices.

The Solid Waste Department, housed within the Division of Environmental Management, operates the Forty West Landfill on Earth Care Road off of U.S. 40, one mile west of Huyetts Crossroads. The landfill, opened in December of 2000, is sized to meet the waste disposal needs of the County for fifty years. The County also maintains four household recycling dropoff locations: Dargan Convenience Center (Dargan School Road), , Greenburg Convenience Center (Bikle Road, Smithsburg), Hancock Convenience Center (Hess Road, Hancock) and Kaetzel Convenience Center (Kaetzel Road, Knoxville). Residents are also able to drop off expired or unused prescription drugs at the Sheriff’s Office on Western Maryland Parkway twenty-four hours per day, year-round. The County’s Solid Waste and Recycling Plan (20222031) was recently updated and goes into greater detail on the facilities and their management as well as the handling of various waste streams.
Ì Conduct a cost benefit analysis using several different scenarios to determine the most fiscally responsible and feasible option to handle the fluctuating school enrollment numbers.
Ì Assess the necessity and feasibility to expand the public sewerage facilities to the existing and potential areas within the UGA which are not currently served and where existing on-site systems may need improvement.
Ì Attempt to identify areas where new community facilities could be located to serve the needs of residents in an efficient manner.
• Criteria for location should be tailored to facility type but should include things like access to population centers, proximity to multi-modal transportation facilities, and availability of water and sewer infrastructure.
• Existing functional plans should be used to assist in identification of suitable locations or areas of need.

• Site selection should be planned ahead of need to more efficiently use county resources and serve citizens effectively.
Ì Lower impact or APFO fees inside the Priority Funding Areas, near transit or community facilities to foster compact development.


The Economic Development Element serves as a guide for future economic growth and development within the County. It establishes the vision and basic development policies, which should be implemented to ensure the orderly economic growth and development of Washington County. The purpose of this element is to maintain and strengthen the County’s status as a regional center of economic activity by directing job growth where resources, infrastructure, and human capital already exist.
Washington County offers one of the most dynamic and ideal business locations in the Eastern United States. This unique and vibrant economy is driven by many factors including:


Washington County is conveniently located at strategic crossroads of multiple modes of transportation including major interstates and national highways, rail lines and airways. It is also located within a one-hour drive of the international Port of Baltimore and the Washington DC metro area.
The County has a diverse and abundant workforce and a dynamic partnership with local educational facilities to prepare students for future careers.
Washington County has continued to maintain a strong economic base. Currently, the County maintains an AA+ rating from Fitch relating to general obligation bonds, an Aa1 rating from Moody reflecting the County’s strong financial profile, and an AA+ rating from Standard and Poor’s also relating to bonding. These ratings demonstrate Washington County’s commitment to be a leader in fiscal responsibility.
Rich history, scenic vistas, and cultural diversity make Washington County a great place to live, work, and play.
Washington County has a land area of 467 square miles (299,522 acres) and ranks 8th in size among the 24 counties and county equivalents1 in the State of Maryland.2 The County remains mostly a rural area but has experienced modest urbanization over the last several decades.
Jobs
According to the Bureau of Economic Analysis (BEA), Washington County had a healthy increase of jobs between 1970 and 2010 before a slight drop off of jobs between 2010 and 2020. It should be noted that these figures represent jobs in Washington County regardless of where the job holder resides. As shown in Chart 9-1 below, the decades leading up to 2000 experienced increases of 12% to 27% while there was a slight decrease between 2010 and 2020. Some of the latest decrease can likely be attributed to the effects of the COVID-19 pandemic in 2020.

According to the Maryland Department of Planning, the number of jobs is projected to increase again but at a slower rate than previously experienced. The latest estimate by the BEA shows there were approximately 80,588 jobs in the County through 2020. It is projected that the number of jobs in Washington County will rise to approximately 89,400, or 10.9% by 2040.
Source: Historical data from the U.S. Bureau of Economic Analysis, Tables CA25 and CA25N
Projections from 2020 to 2040 prepared by the Maryland Department of Planning, January 2015
1 The City of Baltimore generally possesses the same powers and responsibilities as the counties within the State and is therefore counted as a county equivalent.
2 Source: US Census Bureau TIGER/Geographic Identification Code Scheme, 2010.
Analyzing types of jobs by industry in the community assists local economic leaders and planners to develop strategies for workforce development, land use codes, etc. To help organize, understand and plan for economic growth, a generally accepted method of job classification is the North American Industry Classification System (NAICS). Some form of this classification system has been in place since 1980 and provides a consistent statistical analysis of economic sectors.
As stated previously, there are approximately 80,000 jobs currently spread out over the 20+ economic sectors. Approximately 89% of these jobs are within the private sector while the remaining 11% are located within the governmental sector. When compared with the State, Washington County has a slightly higher ratio of private jobs v. non-private (or government) jobs, as shown in Table 9-1.
Table 9-1; Comparison of Job Sectors - County vs. State (2020)
As shown in Table 9-1, the top three private employment industries in Washington County are Health Care & Social Assistance, Retail Trade and Manufacturing. Over one third of all jobs in the County are related to these three industries. Comparatively, the State’s top three private employment industries include Health Care and Social Assistance, Professional and Technical Services and Retail Trade. Table 9-2 below shows specific major private employers in Washington County that make up the derivation of industry types.
Source: Maryland Department of Labor, Office of Workforce Information and Performance
As shown in Chart 9-2 below, the Maryland Department of Planning projects that the State will see more employment increase in nearly all of the industry classifications than that of the County. Industries that are projected to increase more at the County level than the State level include rural employment industries such as Farming and Mining, as well as Manufacturing, Wholesale and Retail Trades, and Finance and Insurance. Both the County and the State are projected to have greater increases in employment in the Health Care and Social Assistance and the Accommodation and Food Services industries.
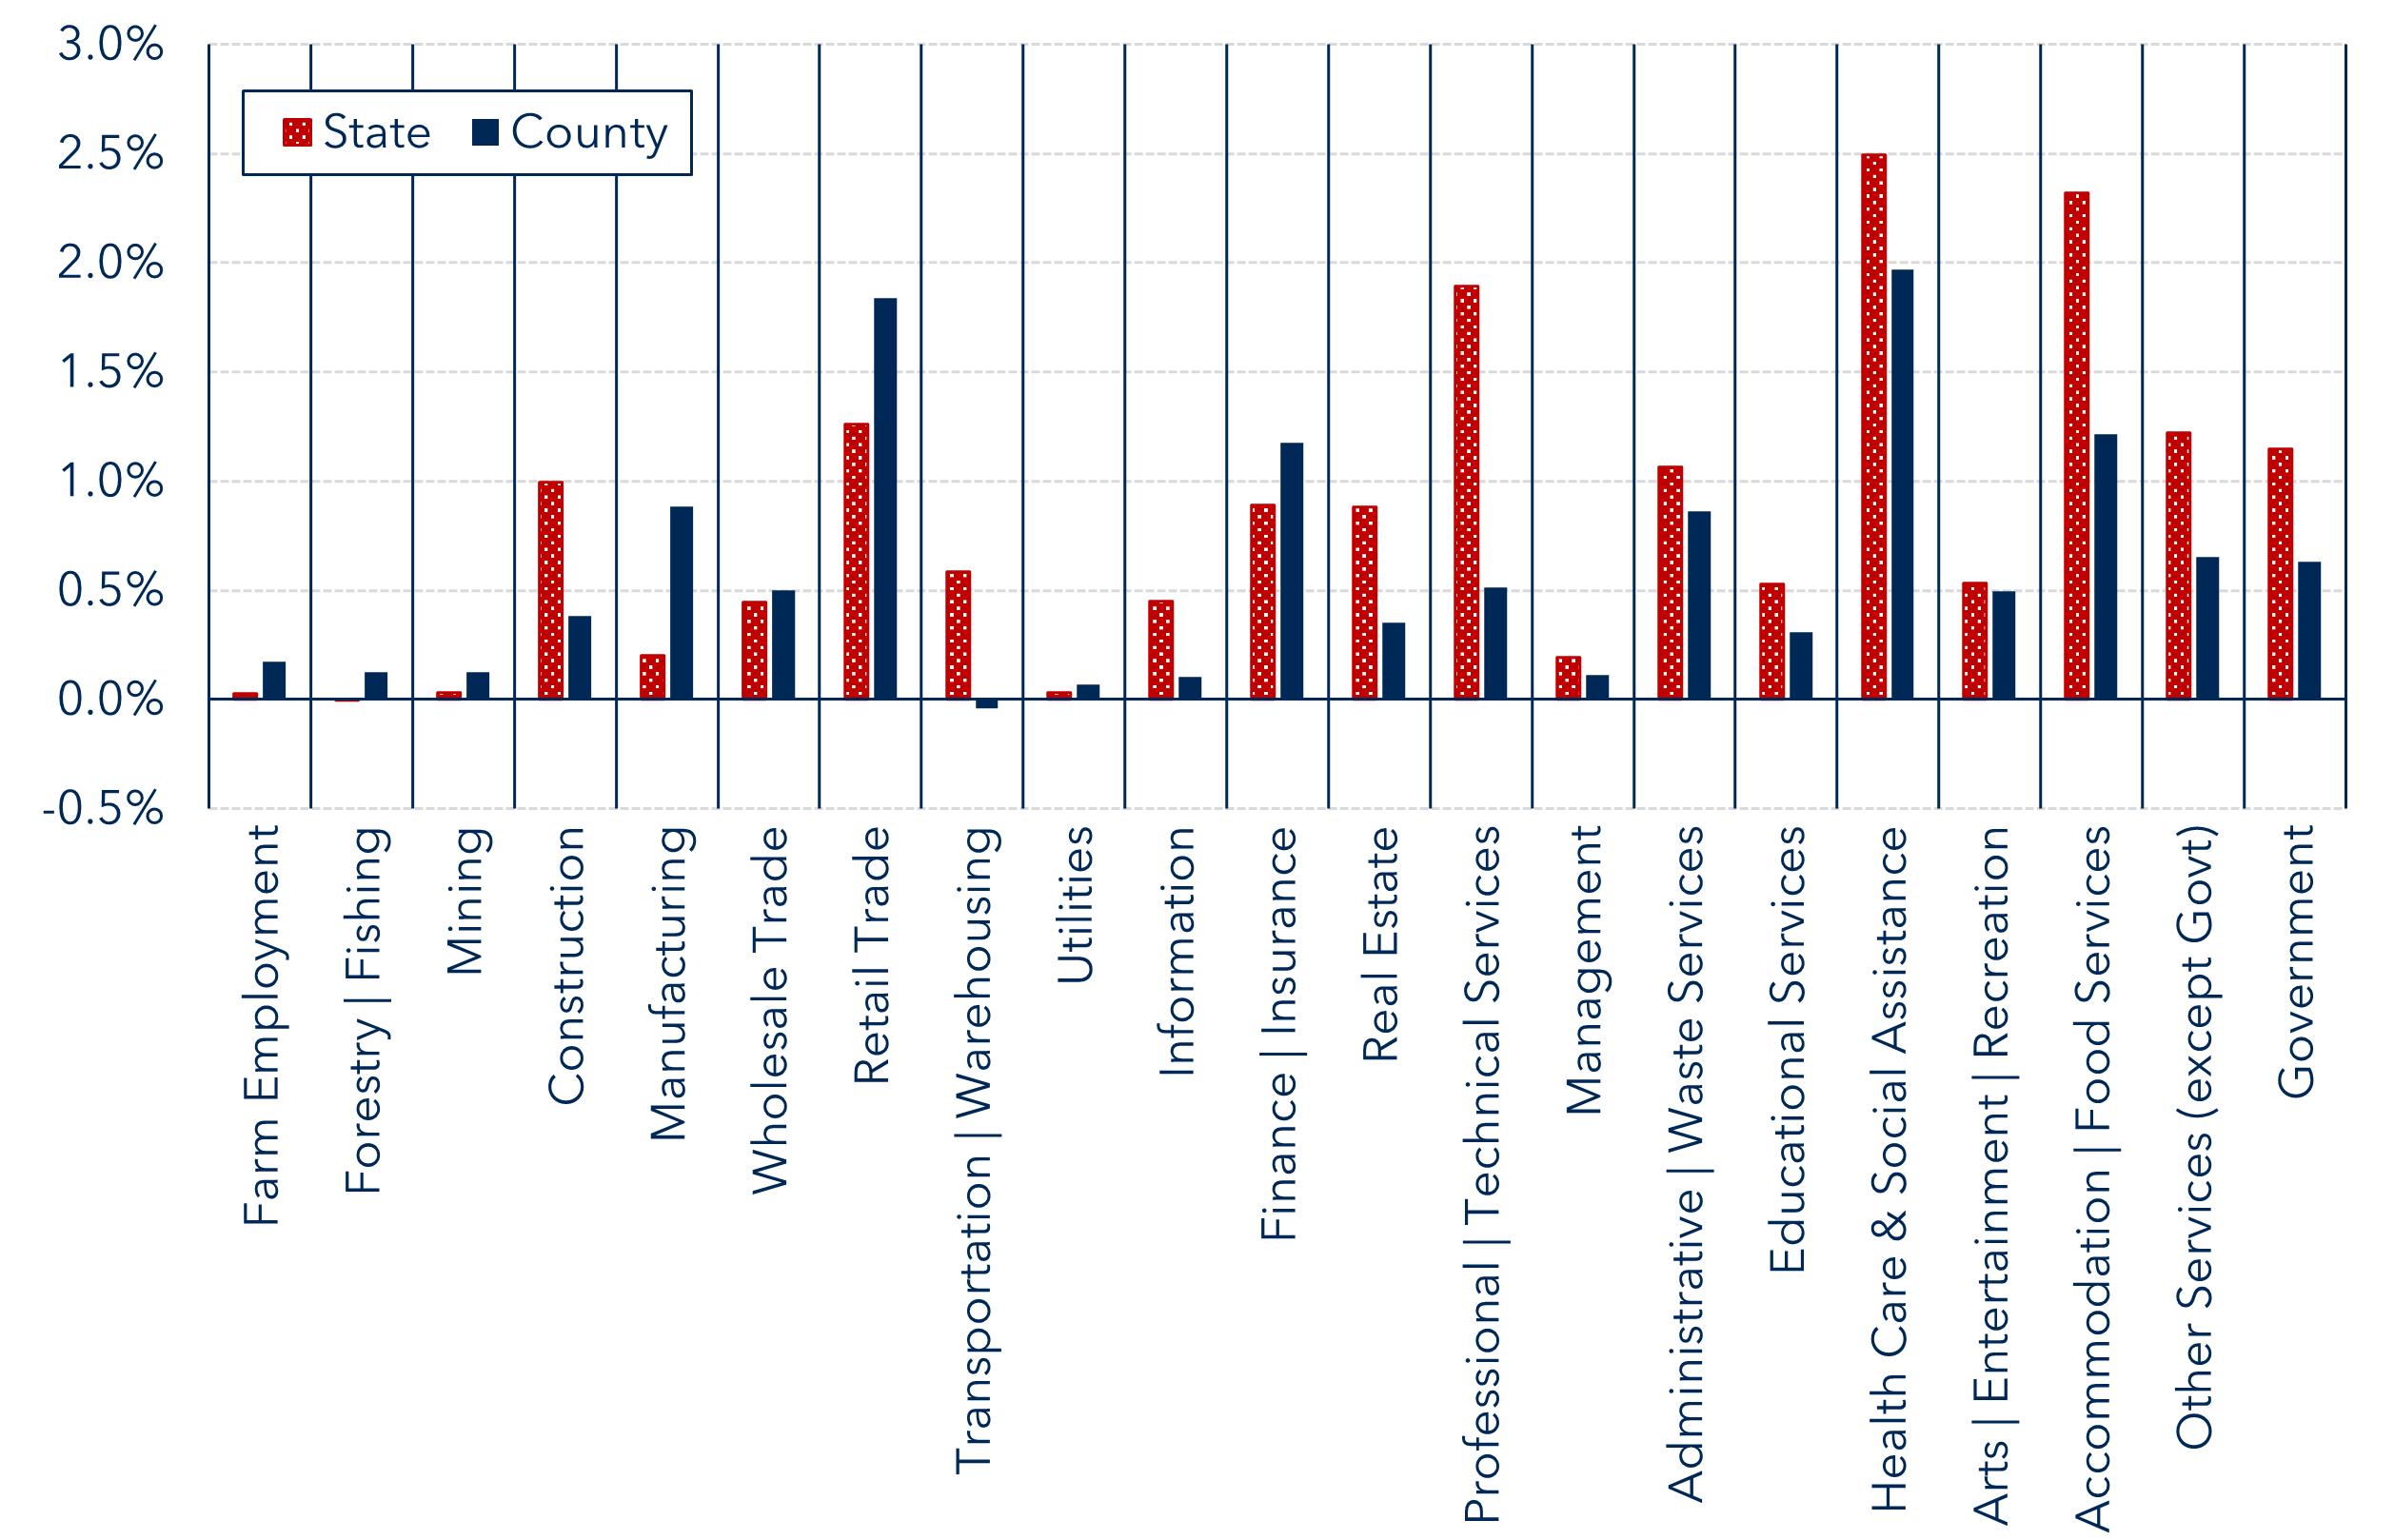
Overall, the County is expected to have the highest level of employment growth in Health Care and Social Assistance, Retail Trade, and Accommodation and Food Services Industry. These projections seem to be in line with national, State, and local trends as well as regional influences, such as our proximity to three (3) interstate systems.
Source: Projections from 2020 to 2040 prepared by the Maryland Department of Planning, October 2022.
Labor force is defined by the United States Bureau of Labor Statistics as that portion of an area’s population that is 16 years of age or older, employed or unemployed, and is neither part of a group quarter or on active duty in the Armed Forces. The review and analysis of labor force trends can give an indication of the availability of personnel that can participate in the workforce. It also gives us a glimpse into the economic health and vitality of our community.
Source: Maryland Department of Planning, Projections & State Data Center, 2018
Since 2000, Washington County has steadily increased its total available labor force by 21%. Comparatively, the County’s population growth was approximately 17.8% over the same period. This is likely indicative of a combination of a greater number of younger people entering the workforce and older people waiting longer to retire. Trends in gender of the labor force show a continued movement toward equilibrium between the sexes.
Given Washington County’s unique geographic location in the State, it is also important to recognize labor force data from neighboring States and Counties. Washington County draws the majority of its workforce from a multi-County, tri-State region which includes Franklin and Fulton Counties in Pennsylvania; Berkeley, Jefferson, and Morgan Counties in West Virginia; and Allegany and Frederick Counties in Maryland. As shown in table 9-3, the combined labor force of neighboring jurisdictions is over 400,000 people.

*Source: US Census Bureau, 2020 Census
1 Source: MD DLLR, Monthly Labor Review, March 2023
2 Source: Workforce WV - WV Labor Force Data Annual Averages 2020
3 Source: PA Workstat, Center for Workforce Information and Analysis, Economic Indicators
Labor Force dependency ratios measure the number of people who are not of working age (dependent) versus those who are of a working age (economically active). The purpose of defining the dependency ratio in a labor force is to measure the pressure on the productive population. A higher dependency ratio means that fewer people are carrying the burden of working and paying taxes to support the dependent population. Higher ratios can mean higher governmental expenditure on health, social security, and education, lower tax revenues and therefore, higher tax rates, labor shortages, and negative impacts on retirement age and pensions.
According to the US Census Bureau, Washington County had a dependency ratio of 0.64 meaning that 63.9% of the County labor force is outside of the typical working ages of 20-64. The majority of the dependency is related to children (35.7%) as opposed to retirement age citizens (28.2%). Comparatively, the State has a dependency ratio of 0.60 and the United States as a whole has a ratio of 0.625. Therefore, Washington County appears to be slightly higher in levels of overall age dependency. Map 9-1 below shows the dispersion of dependency ratios by election district across the County.

Unemployment rates are key indicators of labor market performance. When workers are unemployed, the most obvious implication is loss of wages. The loss of wages means loss of purchasing power that can lead to more unemployed workers. This trend can cause a cascading effect that ripples throughout the economy. These trends tend to be cyclical and can vary greatly from year to year or even quarter to quarter.
Chart 9-4: Unemployment Rate 2005-2020
Source: US BLS. Local Unemployment Statistics
While the cycles of high vs. low unemployment rates can typically be manageable, there have been historic cases of major highs and lows. The most recent example is the recession that occurred in 2008. As shown in the chart above, the County, as well as the State, enjoyed a rather low unemployment rate that averaged around 4.5% in the early 2000s. Once the recession gripped the economy, unemployment rates jumped dramatically to almost 10%. As the economy slowly began to normalize, the unemployment rate began to decline before a spike in 2020 related to the global pandemic.
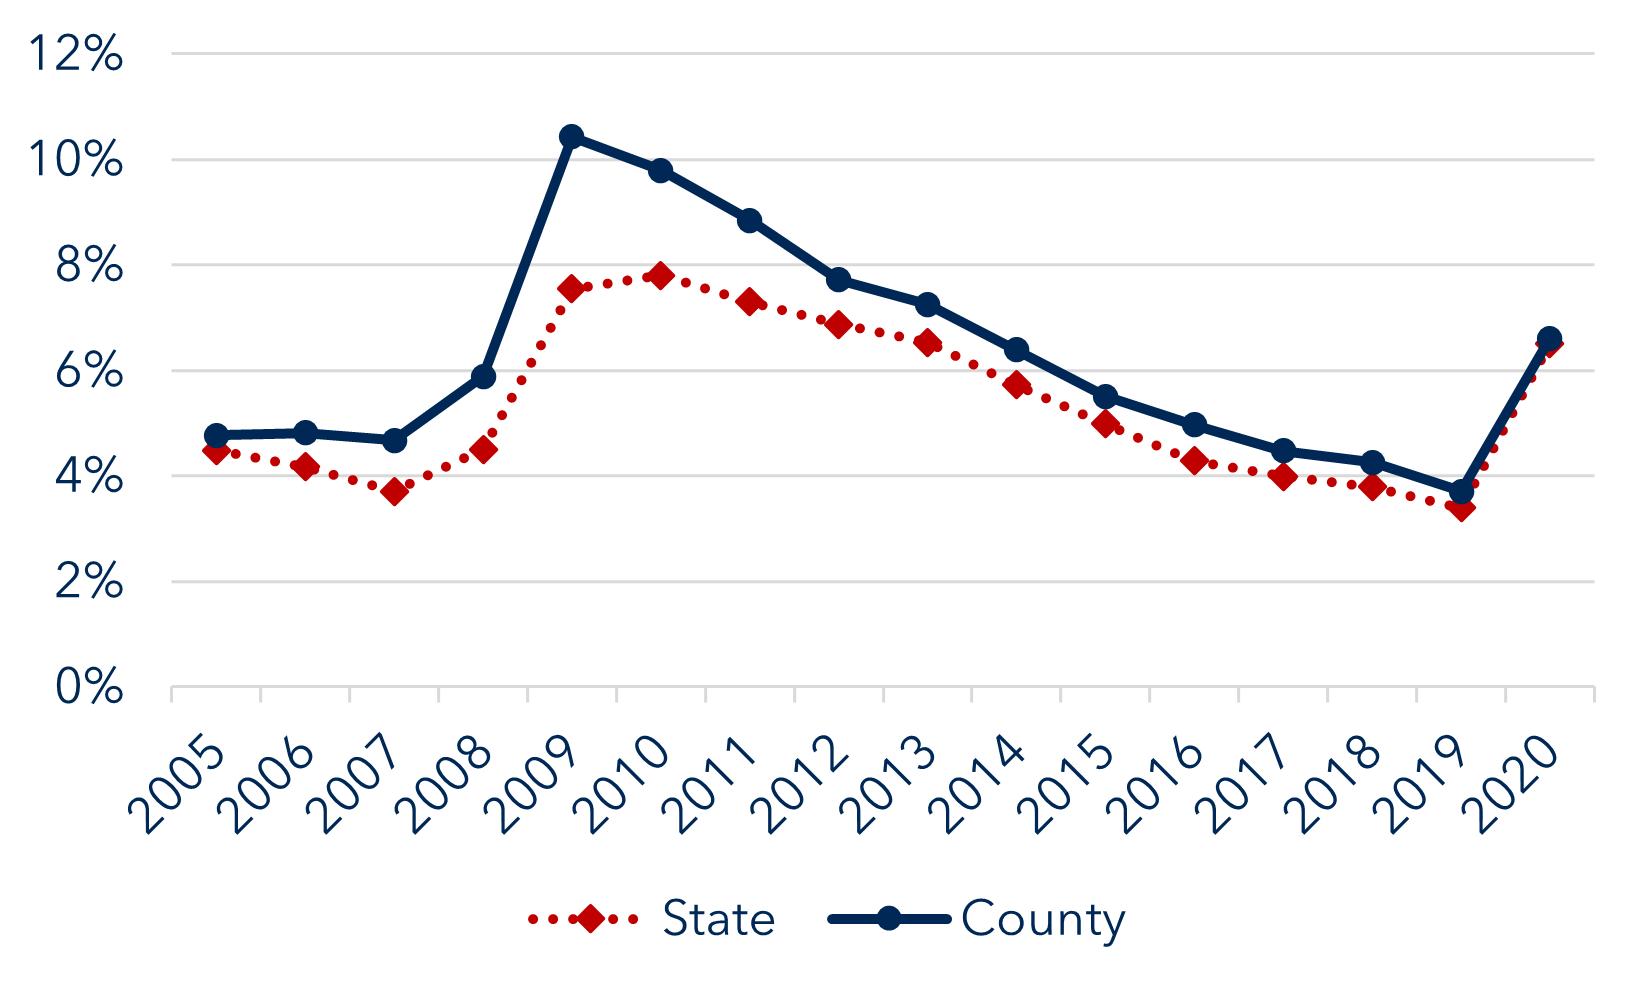
Household income provides another indicator of how the economy is faring. Median household income refers to the income level earned by a household where half of the homes in the area earn more and half earn less. Median income levels are usually preferred in economic analyses instead of average or mean incomes because they give a more accurate illustration of the area’s economic status. Averages can be skewed greatly by anomalies in different income levels.
As shown in the chart below, the median household income in Washington County has remained stagnant between 2010 and 2016 before slightly increasing throughout the rest of the decade. Median household income across the State has constantly risen over the decade thereby creating larger disparities between the overall State median income versus that of the County.
Source: US Census Bureau. Small Area Income and Poverty Estimates, December 2021

Another indicator of overall economic health is poverty rates. There are many factors that can impact the definition of poverty. For the purpose of determining eligibility for financial assistance such as subsidies, benefits and other programs, the poverty level is based upon household size and household income. As shown in the chart below, slightly over 12% of households in Washington County are below poverty level. Comparatively, slightly below 10% of households across the State are below poverty level. Also indicated by the chart below is that Washington County is showing trends toward higher poverty rates than the State overall, thus widening the financial gap between the County and the rest of the State.

There are several ways poverty can affect the economy of an area. The most common effect of poverty is on the supply and demand of goods. By definition, that portion of a population living below the poverty line has less money to spend therefore, there is less demand for goods. This in turn affects the supply side of the economy by lessening the money paid to others to produce, distribute, and sell goods. Poverty levels also affect the demand for government assistance. This means the government may need to increase taxes or run higher deficits.
Source: US Census Bureau, Small Area Income and Poverty Estimates, December 2021
While education and skill attainment can offer a snapshot of the workforce, there are still gaps between what employers need and what the workforce has to offer. To fill these gaps, the Governor’s Office has developed a Workforce Development Board that provides assistance to the various regions of the State. Washington County is part of a three-county regional board known as the Western Maryland Consortium. These Local Development Boards (LDB) work with both employers and job seekers to build connections. They offer services to employers such as information brokering, outplacement services for businesses that are downsizing, recruitment and hiring assistance, and specialized services such as on-the-job training. Services provided to job seekers include career counseling, resource libraries, training and education, equipment access to assist in their job search, and access to the Maryland Workforce Exchange. LDBs also provide youth services such as skills training, academic support, and employment assistance.
To identify strategies to retain and attract jobs in the County, it is important to understand short and long-term industry trends at a national, regional, and local level. Historic data can be used to observe the composition of our local economy in the past. This data helps planners to predict short term economic trends, but long-term trends require analysis of not just local trends but also regional and national trends. To assist the County in comparing the local economy to regional and national industrial trends, a shift-share analysis and a location quotient analysis will be used to project potential changes in future trends.
It is also important to study earnings and income data for different industries. Income levels determine the purchasing power of residents and the degree to which they can contribute to the local economy. This in turn can influence the affordability index as it relates to home ownership, cost of living expenditures and disposable income.
A shift share analysis is a standard model to determine how much of a jurisdiction’s economy can be attributed to national growth trends and how much can be attributed to unique regional factors. The model assumes that changes in employment over time can be explained by three things:
• National Share of growth – This factor assumes that if all things are equal, any changes that occur in the national economy should also be felt at a regional level and distributed across the entire country. Any increase or decrease in the national job average should have an equal impact locally. For example, if the national economy is growing at a steady rate of 3% then any region in the country should also experience overall economic growth of 3%.
• Industrial Mix of employment – The industrial mix effect examines the portions of an area’s economic growth that can be attributed to a specific industry’s growth at a national level. Industrial Mix is calculated by subtracting the fluctuations in a specific industry with changes in overall national growth rates.
• Regional Shift in employment – Regional shifts indicate a locality’s competitive advantage in specific industries. When regional growth outpaces that of national trends, there is an indication that the region has a competitive advantage that causes some industries to thrive in the area. Factors that can generate regional competitiveness include geography, legislation/regulation, population characteristics, infrastructure availability or natural resources.
Once each of these factors is calculated, they are added together to determine actual employment growth for a region.
For this analysis, two different time frames are being evaluated to help understand short and long-term trends in the region. For long-term purposes, an evaluation period from 2000 to 2020 was used, while an evaluation period from 2010-2020 was completed to analyze short term trends.
As shown in the table below, Washington County has experienced a modest amount of employment growth over the long-term period between 2000-2020. The bulk of existing jobs and job growth has been in the Trade, Transportation and Utilities and Education and Health Services sectors. There has also been a marked increase in Leisure and Hospitality jobs.
While this basic analysis is helpful in determining long-term job growth, a shift share analysis helps illustrate what is influencing industry sector job growth in our specific area. As stated previously, there are three factors that are evaluated as part of a shift share analysis: National Share, Industrial Mix and Regional Shifts. By comparing local changes in job growth to national and industry trends, local planners can extrapolate which industries are growing or declining based upon these influencing factors.
According to data obtained from the US Bureau of Labor Statistics (BLS), the national employment rate grew by approximately 16.6% between 2000 and 2020. Applying this information generically to Washington County, there is an assumption that approximately 10,275 of the new jobs created in this County can be attributed to national trends in employment.

Next, job growth per industry sector was calculated and compared to the average national employment growth rate. The difference between these two illustrates the influence of changes in industrial sectors to national averages. As shown in the chart above, Manufacturing, Financial Activities, Trade, Transportation and Utilities and Education and Health Services sectors had large changes over the 20-year period between 2000 and 2020.
Impacts on regional job growth are calculated by determining the difference between the industry changes and national changes in job growth by industrial sector. This calculation separates what affects our region by national and industrial fluctuations in job growth. As shown on the chart, there is a significant regional influence on regional employment due to job growth in several different sectors.
Finally, all three influencing factors are added together to determine the overall change in job growth per industry sector for our County. As shown in the chart, the Manufacturing Industry suffered significant decreases in job growth mainly attributed to industrial level influences. The Trade, Transportation and Utilities and Educational and Health Services industries had large job growth over the period. The Leisure and Hospitality sector also experienced large gains in job growth mostly attributable to industry level influences.
As shown in the chart on the following page, a lower rate of job growth was experienced than over the long-term period. Sharp declines were experienced in the Financial Activities sector showing a decrease in job growth by over 25%. The Information industry sector also shows a significant loss as a percentage, but the total number of jobs lost was relatively moderate in comparison to other industries. To counter these decreases, there were modest increases in the Trade, Transportation and Utilities and Professional and Business Service sectors.
Using the shift share analysis to interpret this data can help illustrate what is influencing industry sector job growth in our specific area. As was the case in the long-term analysis, the short-term analysis shows that the majority of job growth in our area can be attributed to national job growth trends. According to the US BLS, the country experienced a growth rate of approximately 17.8% between 2010 and 2020. Modest job growth came from the National Share and occurred in the Trade, Transportation, and Utilities, and Professional and Business Services sectors.
The Industry Mix component of the analysis shows that the Public Administration sector of the economy experienced a sharp decrease in job growth while Education and Health Services saw a significant increase in growth. The Leisure and Hospitality sector also experienced a modest increase in job growth at the industry level.
Overall, it appears from the short-term analysis that this region is more susceptible to a job recession in the Financial Activities and Public Administration sectors. Job growth in the Trade, Transportation and Utilities and Professional and Business Service, sectors appear to be less prone to recessionary effects.
A location quotient analysis is a popular method of identifying trade flows in a locality. This analysis helps identify exporting vs. importing job sectors by measuring the concentration of an industry in a particular locality and then comparing it to larger areas such as the State or nation as a whole. The location quotient is a ratio of an industry’s share of the local employment divided by its share of the comparable area (State, nation, region, etc.). A location quotient equal to one indicates that local employment in a specific industry matches the proportion of employment in the comparative area. A location quotient less than one indicates that the concentration of local employment is lower than the comparative area and a location quotient greater than one indicates that the concentration of local employment is higher than the comparative area.
The basic uses of industry LQs (and, by extension, for clusters and occupations as well) include these:
• To determine which industries make the regional economy unique.
• To identify the “export orientation” of an industry and identify the most exportoriented industries in the region.
• To identify emerging export industries beginning to bring money into the region.
• To identify endangered export industries that could erode the region’s economic base.
As shown in the chart above, employment by job sectors in Washington County is about the same as those at a State and national level. There does appear to be a slightly higher concentration of jobs in the Manufacturing, Trade, Transportation and Utilities and Financial Activities sectors at both the State and national level and a much higher concentration of Manufacturing jobs compared to the State. These trends are a bit concerning when compared to the long term shift share analysis that show job decreases in both the Manufacturing and Financial Activities sectors. In contrast, the County seems to have a much lower density of jobs in the Professional and Business Service and Information sectors both at a State and national level.
Economic Development strategies need to sustain and expand existing businesses and industries, attract new firms which can diversify the industrial/commercial base, promote increased opportunities as well as economic mobility for the labor force, all while remaining sensitive to high standards of environmental quality. To accomplish these objectives, County economic development strategies have placed emphasis on:
• Increasing efforts to retain and expand existing businesses
• Expanding educational opportunities to facilitate development of a prepared workforce to meet future demands
• Development and implementation of strategic marketing to attract higher technology and higher wage jobs
• Encouraging the development of new industrial parks
• Developing strategic partnerships that can foster economic growth through development of financial and regulatory incentives
• Diversifying the County’s economy to insulate against cyclical economic swings
• Preserving sufficient area to promote agriculture as a viable economic industry
• Promoting recreational and heritage tourism
• Encouraging redevelopment, revitalization, or rehabilitation of existing developed areas or sites where appropriate
• Targeting specific areas for economic development and providing the needed infrastructure to support new development
In the Economic Trends and Analysis section of this element, a detailed analysis was performed to determine which sectors have experienced job growth and the proportionality of specific industries locating to this area when compared to State and national trends. Below is a list of targeted economic sectors in Washington County based on these analyses.

Washington County has had a long rich history of manufacturing industries that continues today. While manufacturing continues to thrive in today’s economy, it is important to note that traditional definitions of processing and assembly line work are advancing with technology. Computers are taking the place of manual labor and we must adapt to those changes in order to continue to thrive. As of 2020, there were over 150 individual manufacturing businesses operating in Washington County. They vary from producing car parts to plastic wares to wood products. Manufacturing is also evolving as a global market. Improved trade routes and freight movement have made manufacturing more competitive than ever. Washington County’s location along two major interstate systems that have both north/ south and east/west connections makes our area prime for new investment and easy transport.
Aerospace and Defense
Hagerstown and Washington County are historically aviation centers that have been a hub of aviation business since before World War II. Once the home of Fairchild Industries, a major manufacturer of airplane parts for Federal government contracts, the Hagerstown Regional Airport (HGR) still has infrastructure in place to support these types of businesses. With an increased demand and decreasing supply of hanger space at major east coast airports, HGR hosts approximately 500,000 square feet of private hangar space and more than 100 acres of available land with runway accessibility for future development.
The County has continued to protect airport resources primarily through zoning and land use regulation. Building height restrictions have been installed at the end of runways and in approach zones. Residential development near the airport has been limited to prevent noise complaints. Most recently, the County adopted a Hazardous Wildlife Attractant Management District. Development that occurs within this designated area receives additional review to determine if the proposed use would attract wildlife that could interfere in airport operations.

The State of Maryland has one of the highest concentrations of biotech and life science industries in the country. There are over 500 biotech companies and over 2,300 life science firms located throughout the State. Washington County is on the outer edge of this growth. It is located only an hour away from Washington DC’s biotechnology corridor and less than 30 minutes from the well-known national biodefense facility at Fort Detrick in Frederick, Maryland. As the biotech industry continues to grow, it is reasonable to expect that Washington County will begin to attract more of these types of businesses.

Located on the campus of Hagerstown Community College, the David W. Fletcher Incubator + Labs is Western Maryland’s largest and most comprehensive technologybased business incubator. The facilities include over 40 office spaces and wet labs, virtual offices, dedicated desks, and hourly access to a commercial kitchen. In addition to providing affordable space for startup companies, the incubator provides access to services such as business counseling, interns from HCC, funding, and marketing services.

While this economic sector does not have a high number of jobs associated with its operations, it remains the primary land use in Washington County. The economic benefits from agricultural businesses are not as expansive as other industries but they have wide-spread impacts on various sectors. One of the key approaches to support the agricultural industry is through the protection of farmland. Protection from both conversion and encroachment are important to protect agricultural operations. Use of land preservation programs and implementation of a County Right-to-Farm Ordinance have advanced the support and protection of this industry. A more in-depth analysis of agricultural assets and economic impact is included in the Agriculture and Forestry Element.
To further the County’s objective of retaining and expanding existing businesses, the County started a program of County Commissioner business visitations. The purpose of these visits is to connect with local businesses on a personal level and hear directly from business owners regarding their successes and challenges. It has also been an opportunity for the County to educate businesses on services provided by the County, such as marketing, advertising, and tax incentives.
Enterprise Zones
This is a coordinated County and State tax credit program that allows property tax credits for businesses that locate within a specified geographic location in return for job creation and investments. Currently, there are two identified zones in the County – the City of Hagerstown/ Washington County Zone and the Town of Hancock Zone. The City/County zone contains 4,947 acres while the Hancock zone contains 1,871 acres. These areas are established based on criteria outlined by the Maryland Department of Commerce related to unemployment rates and low-income/poverty levels in the identified area. These areas are renewed every 10 years, with the City/County zone being updated in 2022 and Hancock due for renewal in 2025.
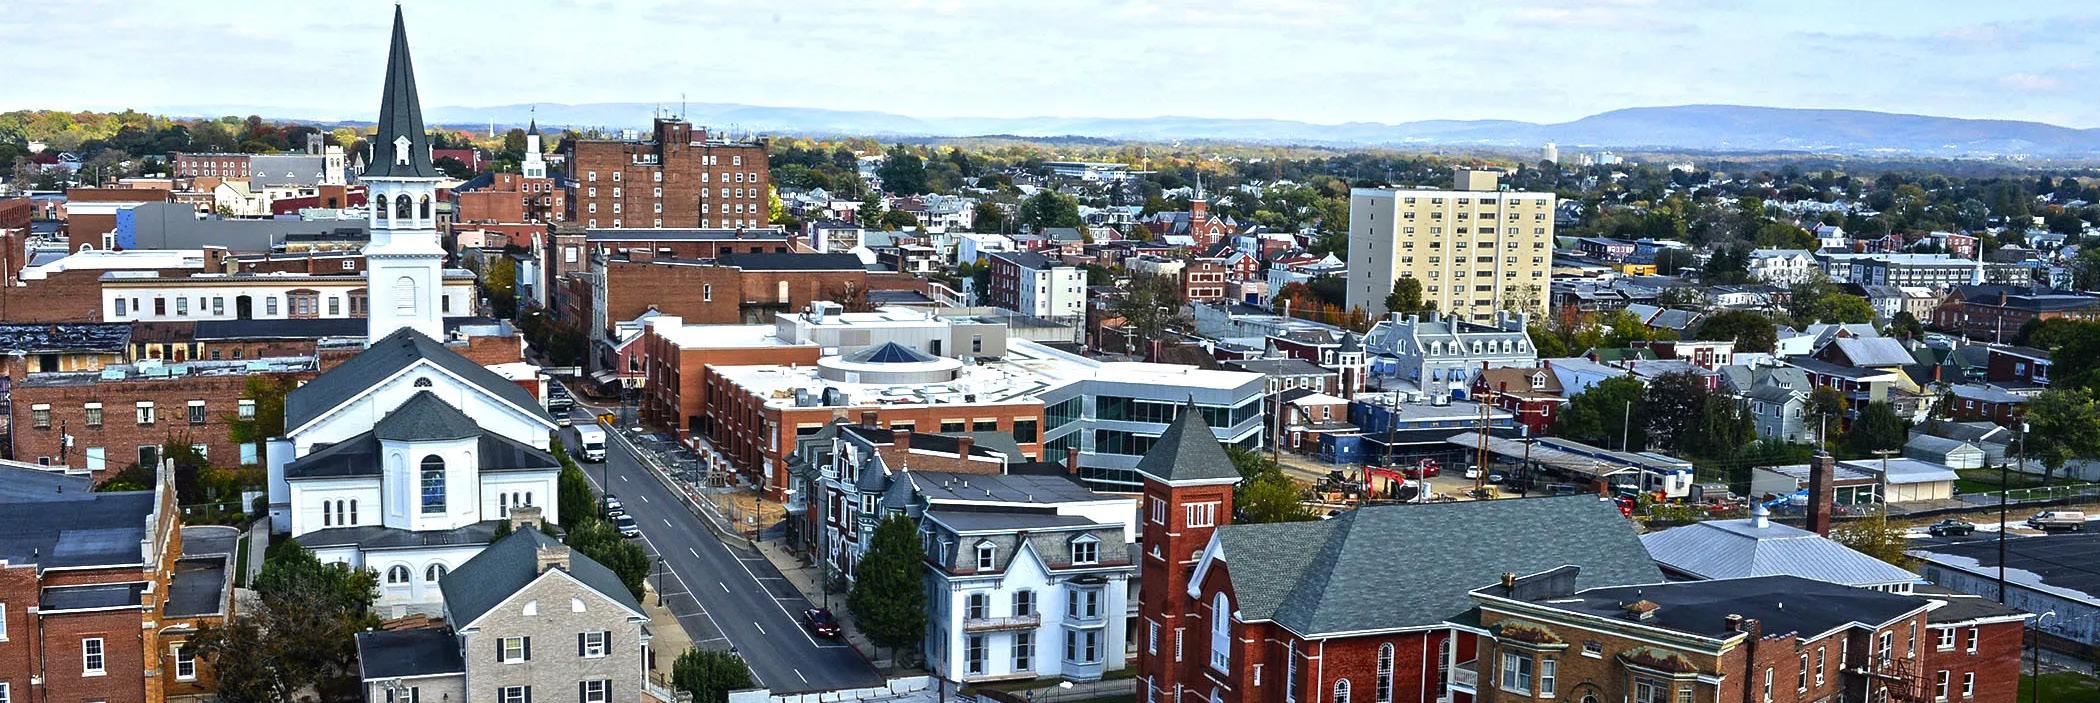
This program can provide property tax credits for up to 10 years on capital improvements. The credits are assessed on the value of increased assessment due to capital investments. The credit starts at 80% of the increase on assessed value for the first five years of the program and deceases 10% annually for the final five years of the program. There are also credits available for new job creation and hiring of “disadvantaged” employees.

FTZs are sites designated by the U. S. Foreign-Trade Zones Board in which special United States Customs Service procedures may be used. These procedures allow domestic activity involving foreign material to take place prior to formal Customs entry. Duty-free treatment is accorded items that are re-exported and duty payment is deferred on items sold in the U.S. market.
Washington County contains one of only four foreign trade zones in the State of Maryland. FTZ #255 is made up of several parcels located in five separate sites in the County including: Hancock, Hopewell Valley, Williamsport and the Fort Ritchie/Cascade area.

This program was initiated by the Washington County Board of County Commissioners to help attract companies and promote expansion of existing businesses that offer well-paying jobs. To be eligible for the program, a business must:
• Either construct or expand its operation in Washington County by a minimum of 10,000 square feet;
• Employ at least 25 persons in new permanent full-time positions located in the new or expanded premises;
• Pay at least half of those new jobs a minimum of 135% of the Average Weekly Wage of a Washington County worker (per reporting from Maryland Department of Labor, License, and Regulation); and
• Be located within a Priority Funding Area
In exchange for meeting these criteria, the County may apply a credit to the County real property tax. Credits may be claimed against County taxes imposed on the assessed value of the new or expanded premises for a period of up to six years.
In addition, if the company is eligible for the County New Jobs Tax Credit they may also be eligible for the State of Maryland Businesses that Create New Jobs Credit. The State program may apply credits against corporate income tax, personal income tax, or insurance premiums tax.
Washington County recognizes the need to establish more energy efficient and environmentally sound development practices.To promote these efforts, the County has implemented the High Performance Commercial Building Tax Incentive Program. The intent of the Program is to incentivize more builders to achieve a Leadership in Energy and Environmental Design (LEED) certification. LEED is the most widely used green building rating system in the world. In exchange for building owners who construct new or renovate old buildings that achieve a LEED Platinum, Gold, or Silver certification, the County will apply a three-year credit against Washington County’s real property tax.

This Bill, passed in 2017, is the cornerstone of former Governor Hogan’s Jobs Incentive. It is intended to incentivize manufacturers to create more jobs throughout the State of Maryland. Under this program, incentives are offered for up to 10 years for the creation of family supporting wages and workforce development programs. The incentives include income tax credits, property tax credits, a sales tax refund and exemption from the State of Maryland Department of Assessments and Taxation corporate filing fees.
One of the reoccurring comments received as part of stakeholder and public input meetings held prior to the development of the Comprehensive Plan is the need for a better prepared workforce. Current education and experience levels in the County may be a limiting factor in the attraction and expansion of businesses. To help improve workforce development efforts, the County has begun to build meaningful collaborations with private sector businesses to define their needs; local educational institutions to provide a wider variety of educational and internship opportunities; and local workforce investment boards to support disadvantaged and dislocated employees in obtaining new and improved skills to reenter the workforce.
First established in 1974, the Western Maryland Consortium (WMC) has been a primary resource for workforce development in Allegany, Garrett and Washington Counties. They have placed an emphasis on working with individuals who have significant barriers to employment, dislocated workers and trade-impacted workers. Services include job search assistance, resume development, interest testing and evaluation, case management, and skills training. The WMC is also a partner in the Washington County Business Resource Network. This network provides resources and support to new startup businesses and entrepreneurs. The partnership is meant to connect businesses with skilled workers in the community. Partners in the Business Resource Network include Washington County Department of Business and Economic Development, City of Hagerstown Department of Community and Economic Development, the Greater Hagerstown Committee, Hagerstown Community College Technical Innovation Center, Maryland Small Business and Technology Development Center, and the HagerstownWashington County Chamber of Commerce.
Hosted by the Washington County Chamber of Commerce, OnTrack is a non-profit coalition of 38 independent community partners who are focused on supporting and improving educational attainment levels in Washington County in order to strengthen our overall workforce and quality of life. The group is broken up into three Teams that focus on primary areas of educational development:
Source: www.ontrackwc.org
Early Childhood Success Team - The focus of this group is to support and improve school readiness. This includes academic, emotional and social development skills to improve kindergarten readiness, reading levels and attendance rates.
School Age Youth Team – This group works to support students with their developmental progress until graduation. They work to engage at-risk youth and families to keep them on the path to graduation and a satisfying career.
Workforce Readiness & Career Success Team – As individuals prepare to enter, or re-enter, the workforce, this group focuses on helping to identify educational and career goals and obtain the necessary training and education to attain success.
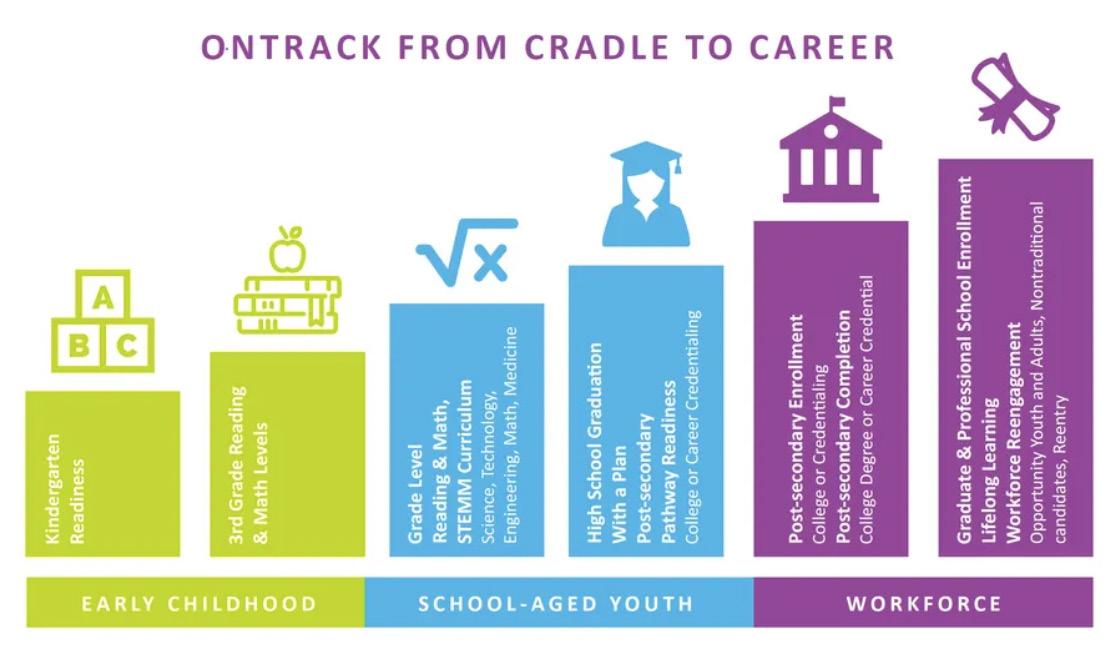
As the business world continues to evolve, so must the educational systems. Education forms the foundation of a qualified and prepared workforce. The Washington County Board of Education has continued its commitment to provide a “work class education” to all students through a variety of coursework and experience. Along with general studies, the BOE has provided opportunities for specialized education including magnet programs, career readiness programs, college preparation and early college programs and advanced placement courses.
In addition to providing students a world class education, the Washington County Board of Education (BOE) also recognizes the need for hands-on job training. Boyd J. Michael III Technical High School provides an instructional program that offers current, relevant, industry-based curriculum in 17 different career and technology programs.

Hagerstown Community College (formerly Hagerstown Junior College) was founded in 1946 as Maryland’s first community college. In its 70 plus years of existence, the college has continued to grow and expand its programs of study. Currently, there are over 100 programs of study available to individuals who want to advance their education for college credit, career preparation, or personal advancement. Accredited by the Middle States Association of Colleges and Schools, HCC can award associate degrees, certificates, and letters of recognition.

In addition to traditional post-secondary programs, local partnerships with the Washington County Board of Education have provided an opportunity for high school students to earn college credits and credentials while completing their high school diploma. STEMM (Science, Technology, Engineering, Math, and Medical) Technical Middle College allows Washington County High School students to earn at least 30 college credits and to complete requirements for certificates and associate degrees.
Another invaluable resource related to HCC is their continuing education and workforce development programs. In partnership with the Maryland Department of Commerce, HCC and other community colleges around the State are participating in Maryland’s WorkSmart program. This partnership is intended to provide customized training for businesses across the State. Each college can coordinate and customize classes that meet employer’s needs. An example of this coordination is the transportation and driver education program. This program provides certified driving courses for individuals seeking driving permits for automobiles, motorcycles, and Commercial Drivers Licenses.
Washington County is home to several post-secondary technical and trade schools that provide specialized education and training in various fields of study. Examples include:

Pittsburgh Institute of Aeronautics – In 2010, the Pittsburgh Institute of Aeronautics (PIA) located an FAA-approved Aviation Maintenance Technician education program at HGR. Ranked by Forbes as the No. 1 Top Two-Year Trade school in 2017 and 2018, PIA graduates acquire skills in aviation, mechanical systems, hydro-mechanical systems, and green technology. This opportunity provides a built-in workforce for aviation businesses looking to locate in Washington County.

Barr Construction Institute – The Barr Institute offers education and training for trades related to the construction industry. They offer craft, maintenance, and apprenticeship training in the fields of carpentry, electrical, HVAC, and plumbing. This training program is recognized by the US Department of Labor, Bureau of Apprenticeship and Training, and is accredited by the National Center for Construction Education and Research.
Source: Google Maps
Planning for the location and expansion of business opportunities is a critical component in economic growth and development in a community. It also necessitates a careful balance between proximity to infrastructure and proximity to workforce.
Targeted Economic Development Areas Map 9-3: Airport
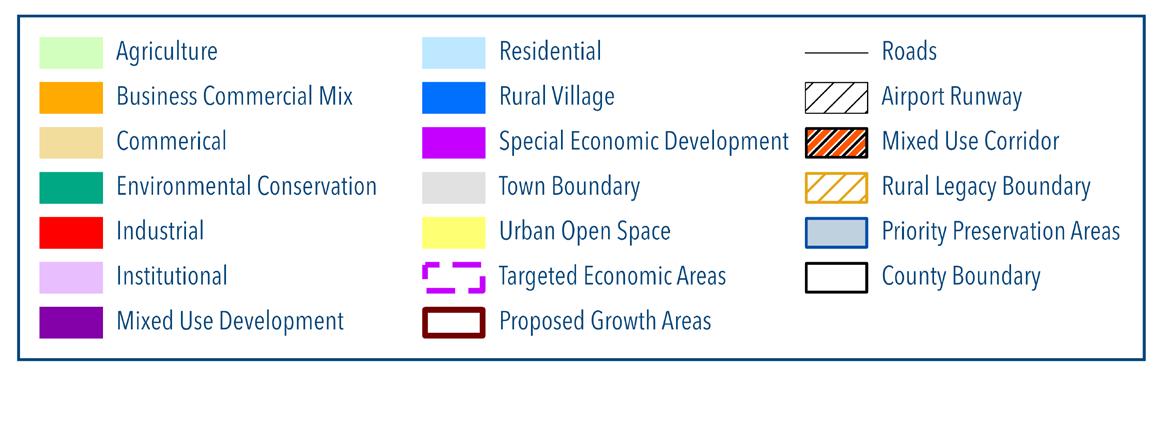
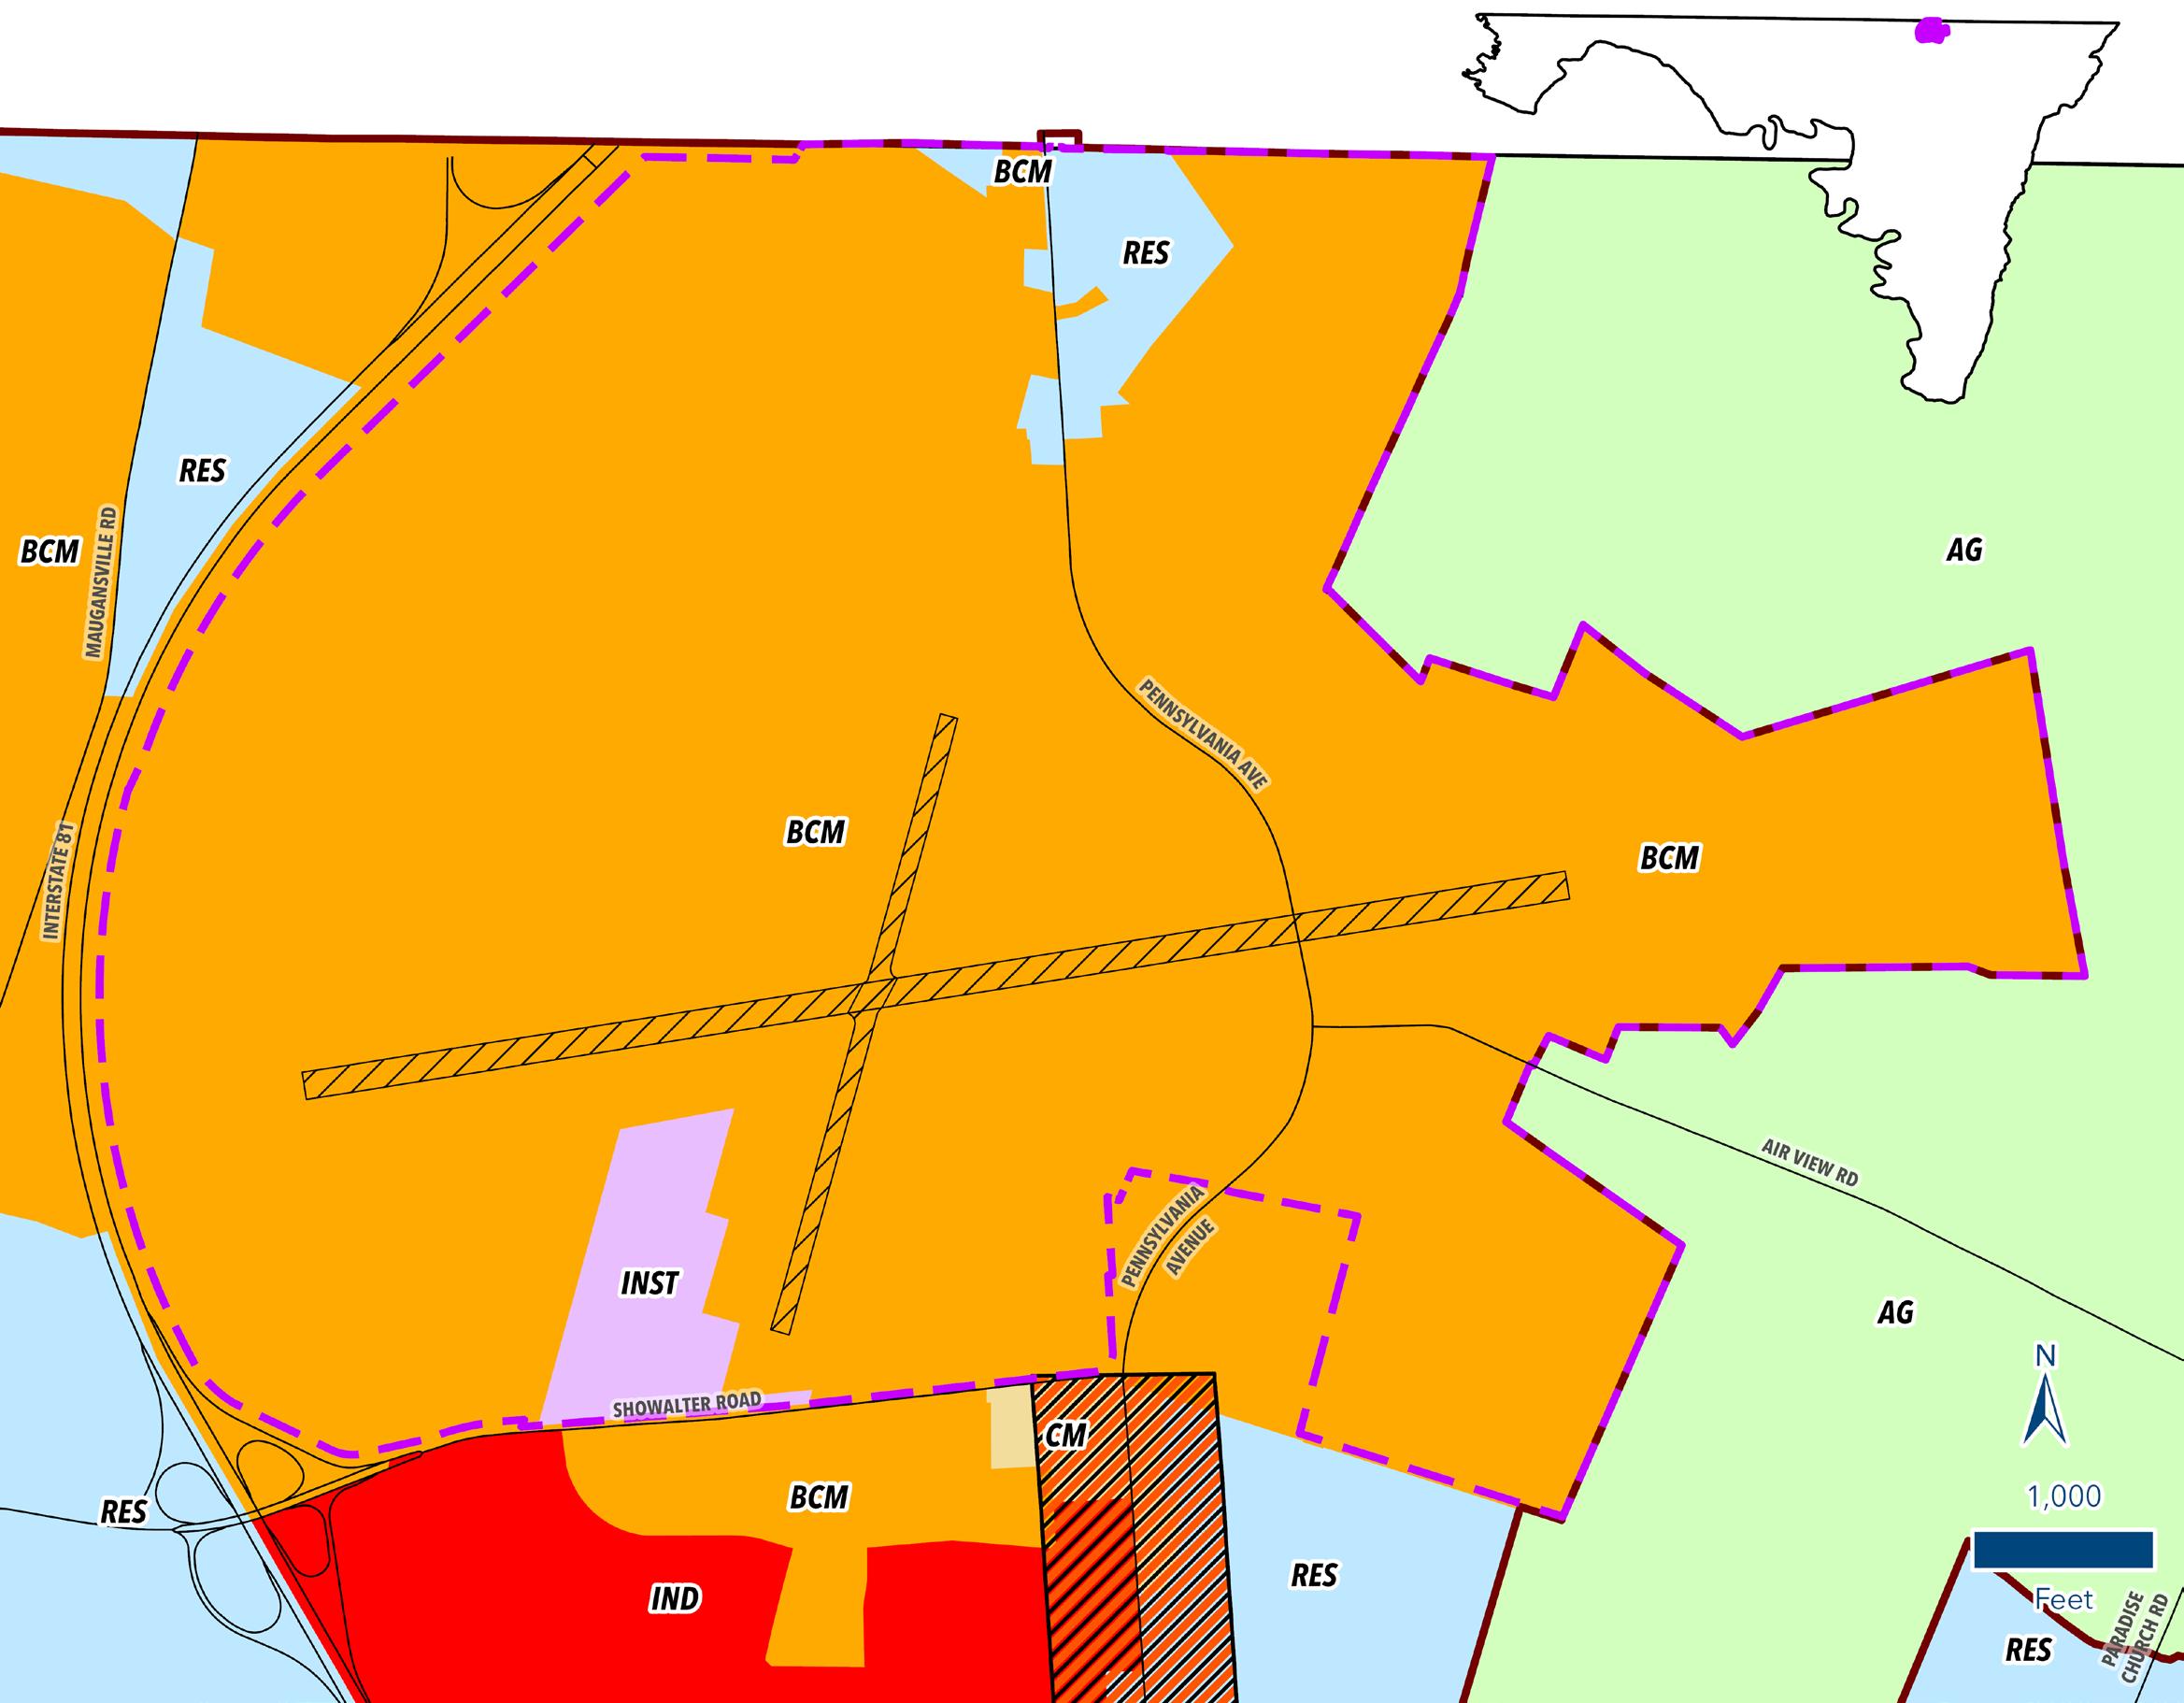
The area including and surrounding the Hagerstown Regional Airport has been a long term targeted economic development area (TEA) for the County. The airport property itself includes nearly 500 acres of land with access to the second longest runway in the State of Maryland. Since the adoption of the last Comp Plan in 2002, the airport TEA has been expanded to include the lands purchased by Washington County to extend the east/west runway 9/27.
The majority of land located within this TEA is in the proposed Business Commercial Mix land use policy area. Primarily, the area is zoned Airport District with permitted uses that are generally associated with manufacturing and support services related to the airport operation. It also contains some areas of Industrial and Highway Interchange Zoning. This area is a prime TEA based upon the abundance of infrastructure available and the amount of vacant land available for development. Infrastructure available in the area includes public water and sewer, natural gas, and broadband internet. Its location between Interstate 81 and US Route 11 also provides excellent access to local and regional transportation routes.
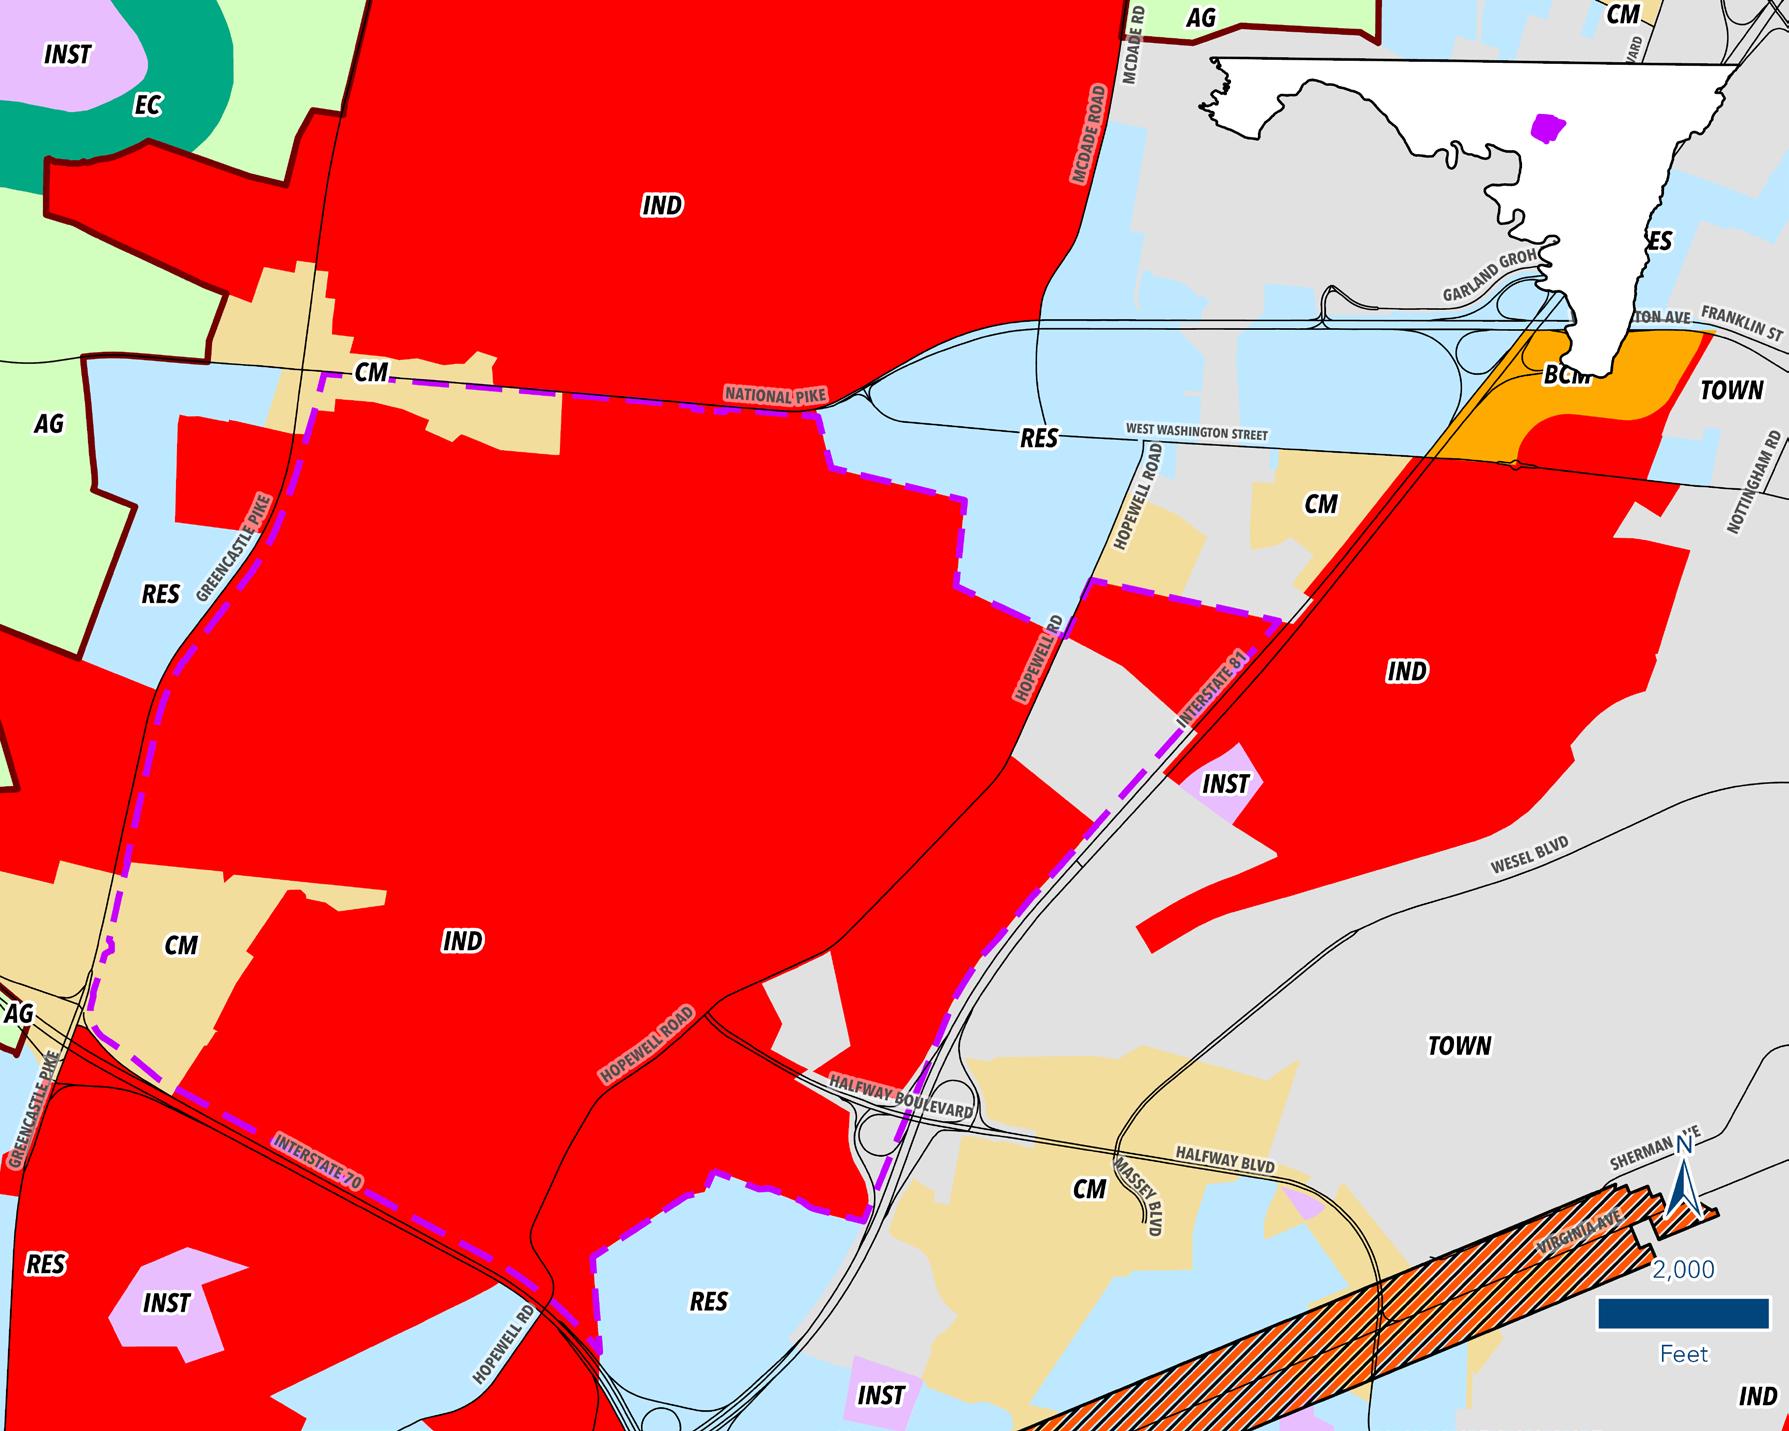
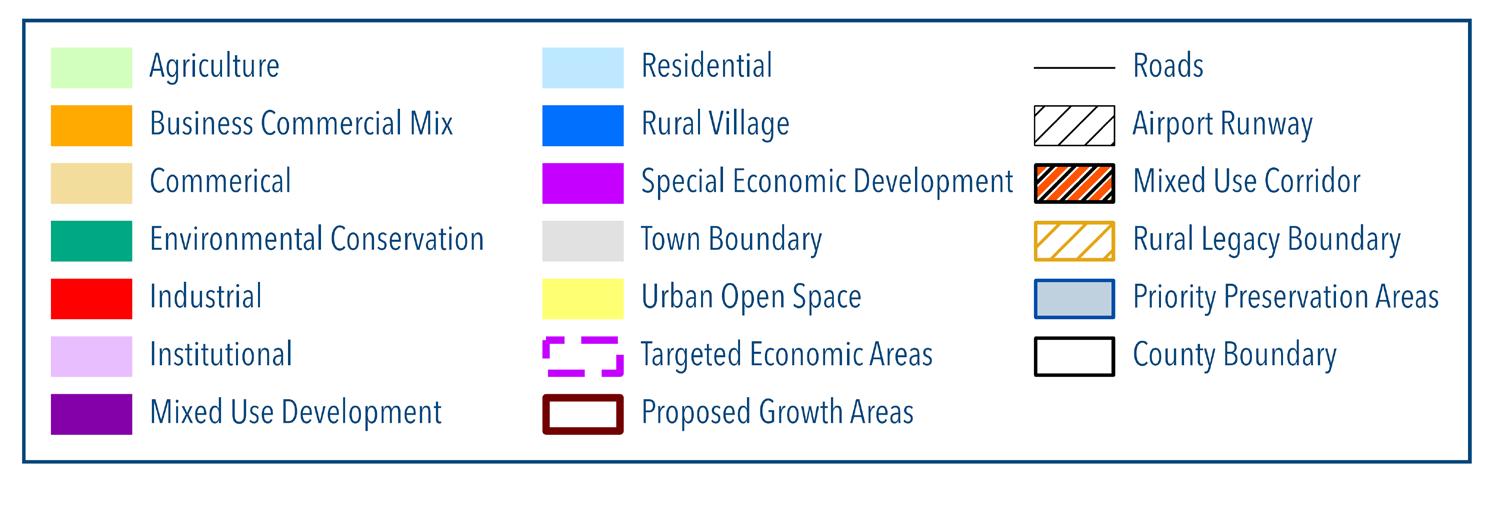
The Hopewell Valley TEA is strategically located in the northwest quadrant of the Interstate 70 and Interstate 81 interchange. It is bounded on the west by Maryland Route 63 and on the north by US Route 40/W. Washington St/National Pike.
This area was also delineated as a priority TEA in the 2002 Comprehensive Plan and is planned to provide land area for manufacturing facilities, warehouse and distribution centers, and freight transportation support facilities. Its location at the intersection of two major interstate networks provides one of the best regional transportation access points on the eastern seaboard. Most of this area is located within the Industrial land use policy area. Zoning districts in this area include Highway Interchange and Industrial General that support the establishment of uses that are associated with highway transportation needs and general manufacturing type uses. In addition to highway access, the area has numerous other forms of infrastructure including public water and sewer, natural gas, and broadband internet services.

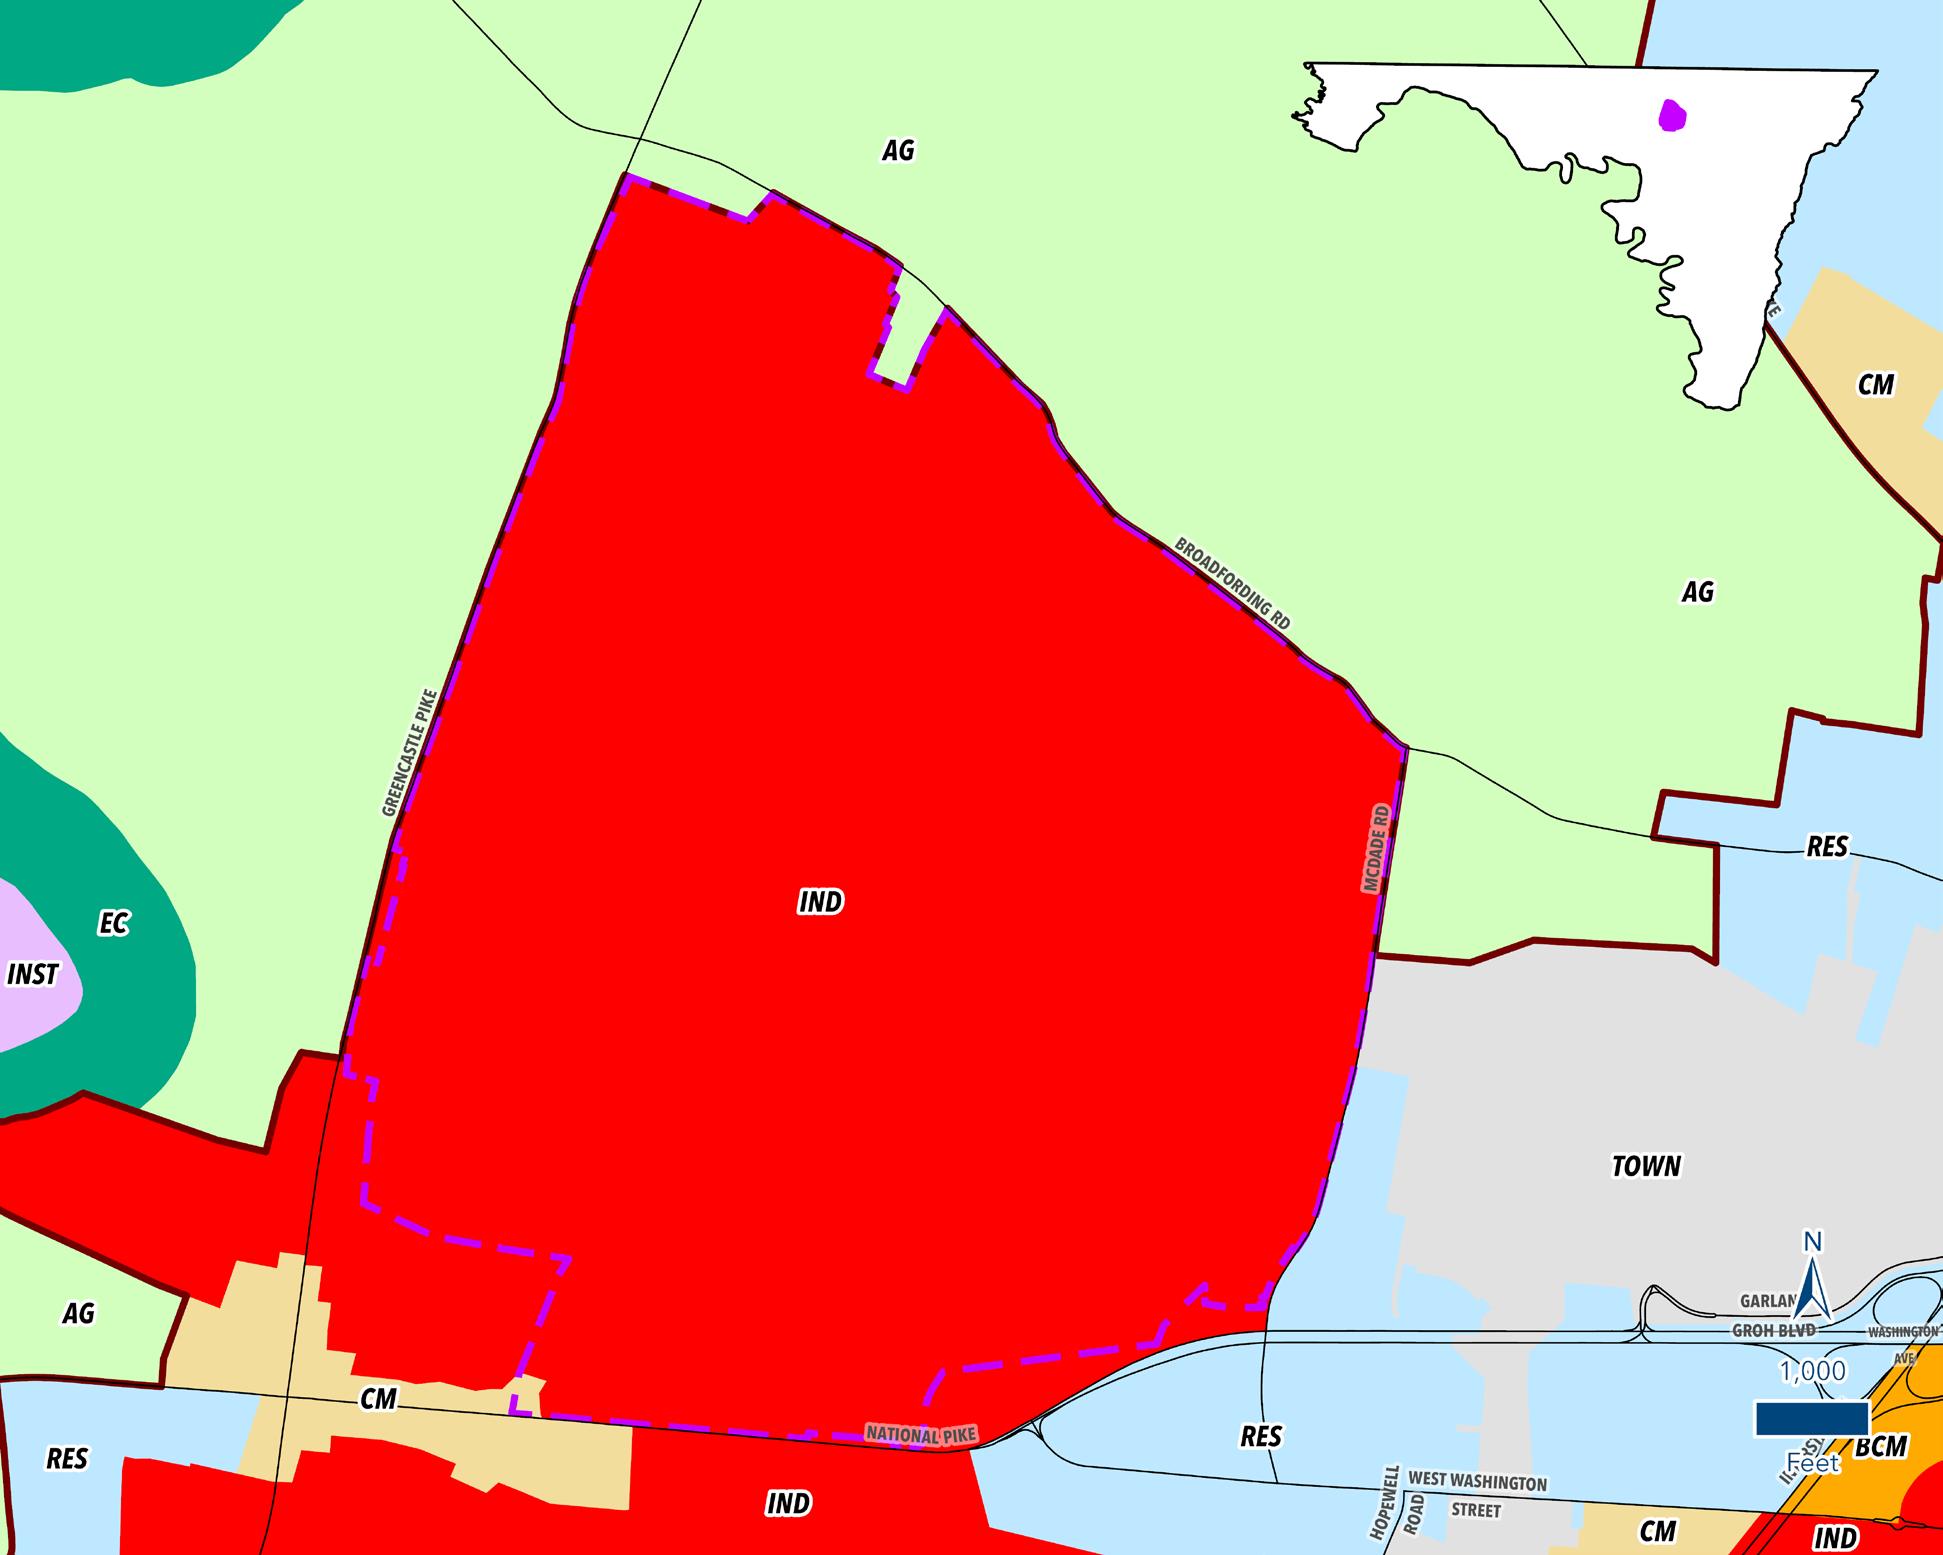
As the description implies, the Hopewell Valley North TEA is a northern extension of the original Hopewell Valley TEA. It is located in the northeast quadrant of MD 63 (WilliamsportGreencastle Pike) and US Route 40 (National Pike). It is bounded on the north by Broadfording Road and on the east by McDade Road.
This area was identified in the 2002 Comprehensive Plan as an Industrial Flex reserve area. After an analysis of available commercial and industrial land for economic development, it was found that the County lacked adequate area for this type of development. Because this area is near existing commercial and industrial development and had a significant availability of larger undeveloped/underdeveloped parcels, the area was included within the growth area as a potential economic development area for the future. The entire designated area is located in an Industrial land use policy area and contains industrial zoning districts.
There is minimal public infrastructure currently available to the area; however it is adjacent to existing services and is a logical area for future expansion of services. The existing highway network also provides ample connection to local and regional transportation systems.

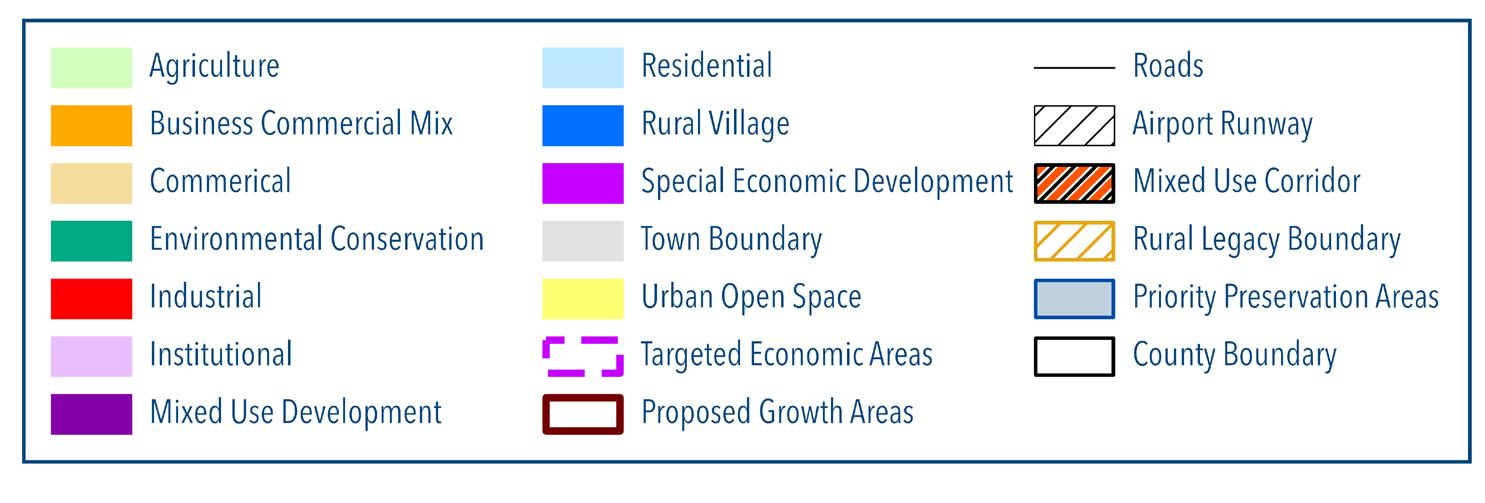
Located on the south side of Interstate 70 along the MD 632 (Downsville Pike) corridor, the Friendship Technology Park TEA is another carryover from the 2002 Comprehensive Plan. In the late 1990s, a new interchange was constructed in this area to provide better access to the southern portion of the City of Hagerstown and to promote opportunities for more hi-tech jobs in the County.
After the interchange was complete, a new zoning district was established and applied to the areas south of Interstate 70 to promote office and light industrial development. The Office, Research and Technology (ORT) zoning district was written with the intent to attract businesses with higher paying jobs and to promote these businesses to develop in campus like settings so that retail and support services could also be established and create a more well-rounded and sustainable business community. Office and light industrial development is still the preferred land use for this area and is therefore delineated as Industrial and Business Mix land use policy areas.

Public infrastructure in this area includes public water, public sewer, access to high speed broadband, and an existing highway network that allows easy connections to local and regional transportation. There are also several parcels directly adjacent to Interstate 70 that provide excellent business visibility.
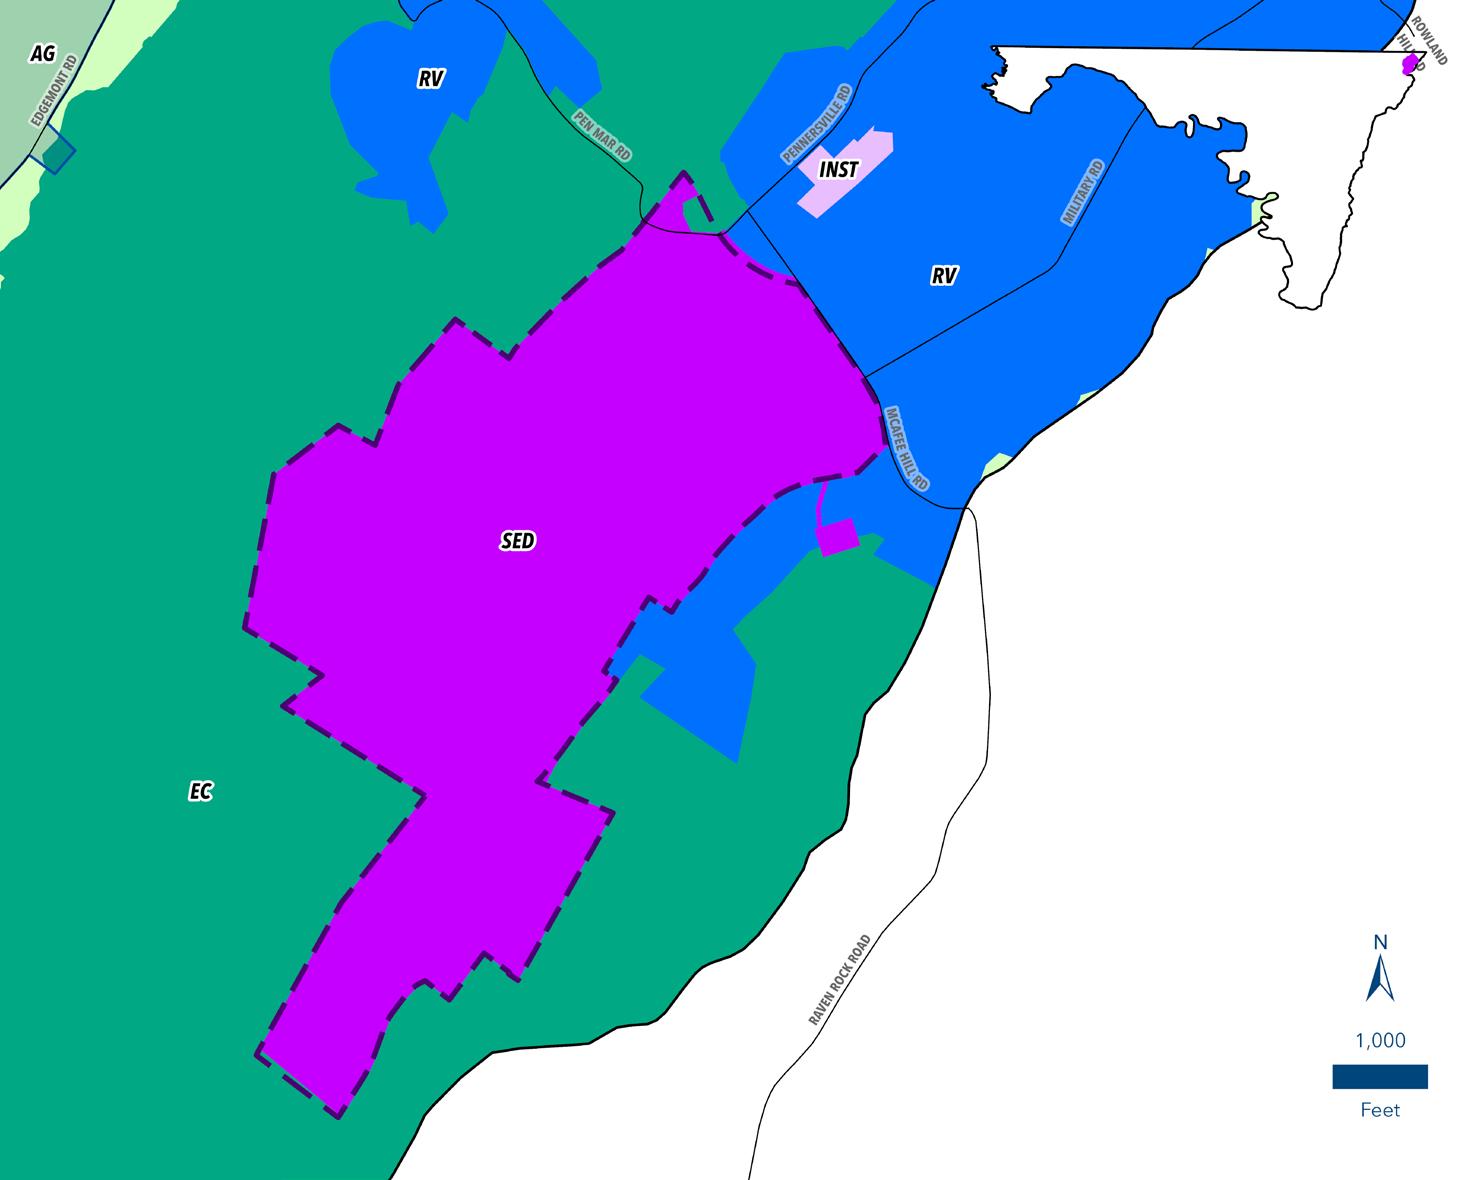
In 1998, Fort Ritchie military base in Cascade was closed as part of the 1995 Base Realignment and Closure Commission (BRAC) recommendations. To help facilitate the redevelopment of the site, the County rezoned the land encompassing the former Fort with a Special Economic Development district. It is also located in part of Foreign Trade Zone #255.
Since its closure, the former base has had a variety of groups interested in redevelopment of the site. Currently, the property is privately owned and being redeveloped through public and private investment.
Because of its previous use as a military base, this area mimics that of a small town. Available infrastructure in the area includes public water, public sewer, natural gas, and a private internal road network. There are also numerous structures left on the site that are currently being renovated and put back into use such as Lakeside Hall (former officers club), the Castle (former Colonel’s headquarters), the former youth center, dining hall, post exchange, and commissary.
Urban Revitalization/ Municipalities
Urban revitalization generally refers to a set of policies aimed at redevelopment of previously developed areas that have fallen into decline for economic or social reasons. Most often these policies are directed at portions of cities and towns that have deteriorated over time but still have infrastructure and resources available to restore its economic vitality.
The City of Hagerstown being the largest municipality in the County, as well as being the County seat, has drawn the most attention to these types of initiatives. Hagerstown was once the central location for sales, services, and business opportunities. Similar to other communities all over the country, the popularity of the automobile, coupled with a desire for a more suburban lifestyle, pushed development away from central urbanized areas. The development of the Valley Mall in the mid-1970s was the first major setback in downtown retail businesses. This downturn continued as automobiles became more affordable and citizens continued their suburban sprawl.
In 2013, the City hired an economic and planning consultant to conduct an economic analysis and identify projects to help spur downtown redevelopment. The plan endorsed eight catalytic projects and action steps to implement the projects over a 10-year period. The County has helped support several of these initiative through funding and staff cooperation including financial support for the expansion of the Maryland Theater, expansion of the University of Maryland Systems-Hagerstown campus, and staff coordination with the Department of Business Development to expand operations of the City Farmers Market. As these projects continue to progress, the City has experienced some revitalization of the downtown with new restaurants and retail businesses locating in the area.
Other municipalities are also working on economic plans and projects to help revitalize downtown/main street areas of their communities. The Town of Smithsburg recently completed an economic development study of its Main Street areas to identify projects and policies that will help revitalize their Town center.
The Environmental Protection Agency defines a brownfield as “…a property, the expansion, redevelopment, or reuse of which may be complicated by the presence or potential presence of a hazardous substance, pollutant, or contaminant”. Currently, there is no definitive accounting of the number of brownfield sites in Washington County. Often the judgements are made on a case-by-case basis and are not fully evaluated until there is a pending development plan for the property.
Many environmental regulations have been adopted over the last several decades to help reduce the occurrence of land pollution and contamination. Therefore, most of the remediation efforts being conducted today are a result of previous development. Examples of brownfield areas include former gas stations or auto repair facilities that still have leaking fuel tanks or improperly disposed of oil. Superfund sites, such as the Central Chemical site in Hagerstown, are also considered brownfields.
Because of the breadth of public safety issues pollution and contamination cause, regulations pertaining to remediation are often dictated by State or Federal agencies rather than local authority. While the County may not necessarily regulate the remediation process, efforts are made by County staff to help property owners navigate through the regulatory process and promote the redevelopment of these areas.
Locating appropriate areas to zone for non-residential land uses requires a careful balance between availability to infrastructure, availability to workforce, and analysis of potential incompatibilities between land uses. The County has made a concerted effort to achieve this delicate balance. Most recently, the County completed a comprehensive rezoning of the Urban and Town Growth Areas. As part of the rezoning process, efforts were made to update land use categories and zoning districts that better reflect the new technologies and business models of the 21st Century. Bulk requirements were reviewed to ensure proper setbacks and buffering requirements between incompatible land uses. New sections were also added to the zoning Ordinance to provide guidance on screening, landscaping, and lighting requirements to reduce nuisance complaints between incompatible uses.
As a complement to the landmark Economic Growth, Resource Protection and Planning Act legislation passed by the Maryland General Assembly in 1992, the Priority Funding Areas (PFA) Act was enacted in 1997 to help reinforce basic Smart Growth principles. The purpose of the PFA Act is to ensure that State funding provided to local jurisdictions for growth related infrastructure is directed to areas where there is existing growth or in areas where logical expansion of services should occur. PFAs were established by local jurisdictions and are periodically updated to delineate updates or expansions in services.
To take advantage of State funding, the County has designated nearly 55,120 acres of PFAs in the Urban and Town Growth Areas as well as specifically designated rural villages. Municipalities were automatically designated as PFAs as part of the initial legislation.
One key component in Maryland smart and sustainable growth efforts is to promote the infill, redevelopment and revitalization of older urban and suburban communities throughout the State. These policies put additional focus on locating development to areas where infrastructure is available instead of expanding into currently undeveloped areas. Similar to many communities all over the country, long established urbanized cores have been abandoned for vacant greenfields, causing sprawl and suburbanization. Reinvest Maryland is a targeted approach to encourage development back into these underutilized areas.
The shining example of reinvestment efforts in Washington County is occurring in the City of Hagerstown City Center. This is the result of a coordinated effort between the County and the City of Hagerstown to revitalize the downtown area. Primary efforts have been centered around a two-block radius from the intersection of Washington Street and Potomac Street. This intersection has been the nucleus of the City from its inception. Similar to many other rural communities in the region, this area is known as “The Public Square”. Aptly named for the layout of the intersection, with larger building setbacks that open up the intersection, allowing for more space for pedestrian interaction. Investments already made in this area include the Barbara Ingram School for the Arts, the remodel of the Washington County Free Library (Central Library), and the remodel and expansion of the Maryland Theater.
There are many numerous overlapping incentive programs that are assigned to this area. The incentive programs are mostly City driven; however, there are also State incentive programs associated with the area as well. Some of the programs include an Arts and Entertainment District, a Partners in Economic Progress District, the City/County Enterprise Zone, and a specialized City Center Mixed Use zoning district.
Ì Continually monitor business needs in relationship to land use to ensure enough available resources for the expansion of existing and the establishment of new businesses.
Ì Review, and where appropriate, amend permitted land uses in non-residential zoning districts along with the locations of said districts to better match infrastructure needs of particular businesses to ensure appropriate location and use of limited infrastructure resources such as railroad sidings, interstate access, and airport access.
Ì Maintain and update, as needed, the “Infrastructure Assessment for Washington County and the City of Hagerstown” as a vital resource for attracting and retaining businesses.

Ì Support and expand land preservation programs in the County by maximizing local match funding and support agricultural marketing efforts.
Ì Review and where necessary amend local ordinances to support new agricultural business opportunities.
Ì Ensure that the annual Capital Improvement Program (CIP) for the County furthers efforts to maintain and expand necessary infrastructure to attract and retain business.
Ì Continue to partner with municipalities to help support downtown and main street revitalization efforts and help bolster the overall County economy.
Ì Consider financial incentives for remediation and redevelopment of brownfield sites such as tax incentives or fee waivers.
Ì Explore public-private partnerships as a method to create reinvestment and infill opportunities in the growth areas and targeted economic development areas.
Ì Align transportation expenditures and community facility siting to maximize the impact of County spending in order to promote economic growth.


Washington County is underlain with a diverse geologic foundation where non-renewable resources such as sand, lime, shale, and quartz can be found. These minerals play a pivotal role in creating and sustaining our built environment. As these minerals are non-renewable, it is important to plan for the efficient extraction and utilization of these resources to ensure availability in the future.

The Annotated Code of Maryland’s Land Use Article states that the Mineral Resource chapter shall identify:
• undeveloped land that should be kept in its undeveloped state until the land can be used to assist in providing a continuous supply of minerals, and
• appropriate post-excavation uses for the land that are consistent with the County’s land use planning process.
This element will discuss the balance between mineral resource extraction and other land uses in the County. Through identification of historic and existing mineral operations, provided by the Maryland Department of the Environment, it will analyze the impacts that mineral extraction and their transport have on the environment and citizens to safeguard both. It will also provide a further look into the local land use policies which promote conservation of accessible mineral resource deposits for future extraction. Finally, the environmental factors specific to water resources have been analyzed to ensure impacts of mineral extraction can be mitigated through best management practices and land use policies such as wellhead protection areas.
Minerals fall into one of two broad forms of classification; fuel or non-fuel minerals, the latter of which can be subclassified into metallic and non-metallic minerals.
The mineral resources in Washington County tend to be primarily non-fuel type minerals. Nonfuel minerals can be defined as:
“any solid material, aggregate, or substance of commercial value, whether consolidated or loose, found in natural deposits on or in the earth, including clay, diatomaceous earth, gravel, marl, metallic ores, sand, shell, soil, and stone [not including coal].”1
The economic value derived from mineral resources stems from either their bulk (such as building stone), or for specific mineral element or elements contained in the material (such as iron ore). Mineral resources therefore denote an economic commodity that can be profitably extracted under current conditions with the available technology.
Mineral resource production in Washington County is presently limited to surface mining operations for non-fuel minerals. While used as a commodity locally, there are currently no coal or natural gas mining operations occurring within the County. Active mining operations within the County include limestone and shale quarries that produce crushed stone, cement, and shale. Much of this material is used for various construction-related purposes in Washington County and throughout the region.
According to the Maryland Department of the Environment (MDE), there are 11 active surface mines reporting tons mined in Washington County as of 2021 (out of 13 active mining permits). Non-fuel surface mines produced 3.3 million tons of non-fuel minerals in Washington County in 2021, which is 50% less than the 2016 high of 6.6 million tons. Tons mined by year is displayed in Chart 10-1 below.
Chart 10-1
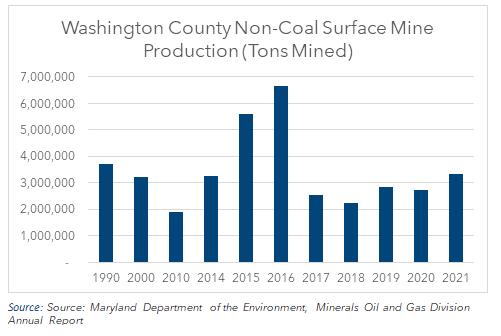
The vast majority of these active mining operations are located in the Martinsburg Formation and the alluvial deposits adjacent to the Conococheague Creek in the central portion of the County. There are approximately 4,855 acres or 1.6% of the County’s area currently available or being actively mined according to the County’s Industrial Mineral Overlay land area. Map 14-1 displays the locations of active permitted non-fuel surface mining operations in the County as of 2021. Note the map includes locations which are permitted and not all are actively mined.

Based upon information extracted from USGS and MDE historic permitting data, there have been numerous mineral extraction operations that have occurred in Washington County since the early 1800s. In addition to limestone, shale, and clay operations that continue into present day, metallic minerals such as manganese, copper, and iron were also extracted from various parts of the County as shown in Map 10-2. Historically mined formations include Antietam, Catoctin, Colluvium, Harpers, Helderberg, Tomstown and more. While, these mining operations are no longer active, they do give an indication of large quantities of other mineral resources that have been economically worthy of commercial exploration. They have potential to yield additional minerals in the future that were inaccessible due to technology during their active period. It should be noted that some of these historically mined formations include vast areas of State-owned recreational land today which limits their availability due to environmental and conservation best management practices.
Evaluation of historic and existing mining operations can give insight into potential mineral resource areas that may be extracted in the future. Current and past geologic formations used for mining as well as current Industrial Mineral Overlays in Washington County are shown on Map 10-2, below. Potential mineral reserves in Washington County are most likely to be explored in areas adjacent to existing Industrial, Mineral (IM) Districts. Areas of potential reserves and their geologic descriptions include:

• Martinsburg Formation – Shale | Siltstone | Sandstone – Bordering the Conococheague Creek, this is currently the most predominant mining area in the County. The resources are abundant and easily extracted.
• Oriskany Sandstone Formation – Sandstone | Conglomerate – Located along the Tonoloway Ridge, west of Hancock, this formation holds the only currently permitted, but inactive, mineral reserve of notable size already zoned IM in the County. It is owned by U.S. Silica which extracts quality silica sand in nearby Berkeley Springs, West Virginia.
• Waynesboro Formation – Siltstone | Shale | Sandstone – Located along the eastern edge of the Hagerstown Valley. This formation contains two active mines and has shown potential for crushed stone production.
• Stonehenge/Conococheague Formations – Limestone |Shale | Dolomite | Conglomerate - Centered in the Hagerstown Valley and occurring in the area around Clear Spring, these formations contain one current mining operation. This operation is involved primarily in the mining for potash and limestone products for cement production.
Map 10-2: Potential Non-Fuel Mineral Reserves
As stated previously, there are currently no active fuel mineral extraction operations within Washington County. Mining of fuel minerals such as coal and natural gas occurs primarily in neighboring Garrett and Allegany Counties. The Marcellus Shale Formation, where much of the natural gas exploration is taking place throughout the region, underlies New York, Pennsylvania, Ohio, West Virginia and Western Maryland at depths ranging from 3,500 to 7,000 feet 1. In 2009, the Department of Energy estimated 262 trillion cubic feet of natural gas exists in the Marcellus Shale, making it the largest onshore Natural Gas Reserve in the United States. The Marcellus Shale formations are found in Garrett and portions of Allegany and Washington Counties. Specific to Washington County, the Romney and Oriskany Formations are included within the Marcellus shale grouping and can be seen on Map 10-2. Only Western Allegany and Garrett Counties are presently anticipated as production areas in Maryland.
Mineral resource regulation attempts to balance the need for retaining the ability to extract valuable mineral resources with the protection of adjacent communities from the impacts of these intensive operations. Mineral extraction operations represent an intensive land use which is directed, primarily through zoning, to occur only in the rural areas of the County. Recognizing the potential for conflicts in land use on adjoining properties to mineral extraction operations is, therefore, a fundamental part of short and long-term planning for the needs of the County.
The extraction and processing of minerals has the potential for significant impacts upon local infrastructure, nearby communities and natural ecological systems within the operation’s sphere of influence if not properly managed. These potentially significant impacts can include erosion, landslides, water quality and aquatic ecosystem impacts, subsidence, adjacent well failures, acid mine drainage, degradation of wildlife habitat and more.
Federal, State and local regulations are designed to eliminate or minimize the environmental, aesthetic and reclamation issues that may accompany mineral extraction operations. Effective long-range planning can avoid direct adverse impacts on communities by separating mineral extraction from incompatible adjacent land uses. Finding ways to balance the needs of different user groups while mines are in operation and planning for re-use of mined lands after operations cease are essential to comprehensive planning for mineral resource lands in Washington County.
The establishment of Industrial Mineral Zoning Districts is necessary to prevent the preemption of future mining operations by incompatible current land uses. If valued mineral resources are comprehensively mapped and inventoried, it enables decision-making bodies to head off such conflicts by reserving such areas for future exploration when economically and technologically feasible. In the process, larger issues related to the protection of our water supply, water quality and of sensitive environmental resources can be addressed both during initial site planning and in later reclamation efforts.
Federal Mining Regulations
The General Mining Law of 1872, and its subsequent amendments, regulate mining activities on federal lands open to mineral extraction. Numerous federal environmental laws such as the National Environmental Policy Act (NEPA), Federal Land Policy and Management Act, Clean Air and Water Acts, Endangered Species Act, and many other legislative acts also indirectly govern mining activities on federal lands.
The Surface Mine Control and Reclamation Act passed by Congress in 1977 spurred the creation of individual state programs for mining land reclamation, particularly for abandoned coal mines. The Act helped to create uniform standards across state lines for regulation and reclamation that would ensure mining operations would have to meet minimum safety, health and environmental standards no matter which state they chose to locate in.
State Mining Regulations
Maryland’s first mining law was established by the General Assembly in 1876. Like much of the State’s early regulation of the industry, the law sought to improve the conditions of the coal mines and mitigate their external impacts. This first law established the Inspector of Mines position (now Chief Mine Engineer) to ensure the health and safety of coal and clay mining operations in Allegany and Garrett Counties, and to prepare an annual report detailing the volume output, working conditions and number of people employed in the industry. Further regulation occurred in 1922, when the Bureau of Mines was created to provide a code of laws protecting the health and safety of coal miners, protect property connected to the mines, keep a record of inspections and enforce laws and regulations under its authority pertaining to the industry. Additional State legislative controls on the coal industry occurred in 1955, 1967 and 1974, with 1967 being notable as the first-time licenses, permits and land reclamation was required by law in Maryland for any type of mining operation.
The regulation of non-fuel surface mines first occurred in 1977 when Maryland enacted comprehensive regulations for the extraction of non-fuel minerals. These regulations required mining operations to maximize environmental protection and to ensure public safety. The program also emphasized reclamation of both active and abandoned mining sites, employing the logic that mining is an inherently temporary land use and remediation should, therefore, be ongoing throughout a mine’s life cycle. Permits were required for non-fuel surface mines, and their issuance was contingent upon the approval of mining and reclamation plans by the State so that it could ensure safety and environmental controls were in place during the mine’s working lifespan. The County’s review and approval process for extractive operations is designed to work concurrently with the State process. Oil and gas well drilling and production were included among the non-coal mineral reserves regulated by this act.
Dewatering is an intentional process in mining operations in which groundwater is pumped or physically excluded from the mine to allow excavations for construction or mining projects to be carried out in workable dry conditions. Dewatering has the potential to create a cone of depression which results in a variety of impacts on adjacent surface lands and subsurface groundwater regimes including land subsidence, water contamination, effects to surface water habitats, and well failures.

The Environmental Article of the Annotated Code of Maryland asks counties to delineate “zones of dewatering influence” around quarries and assigns damages to be remedied by the quarry operators within the zones.1
In 1991, the State of Maryland provided property owners with protection from damages resulting from limestone quarry dewatering in Baltimore, Carroll, Frederick, and Washington Counties. These counties were specified because portions of each are underlain by porous bedrock known as karst terrain that is highly susceptible to water quality and land subsidence issues.
In a continued effort to inform citizens of the issue of dewatering, in 2021 HB 399 requires sales contracts for land in the counties previously mentioned to include a notice that property is in a Maryland Department of Environment known zone of dewatering. These zones delineated by MDE are displayed in Map 10-3.
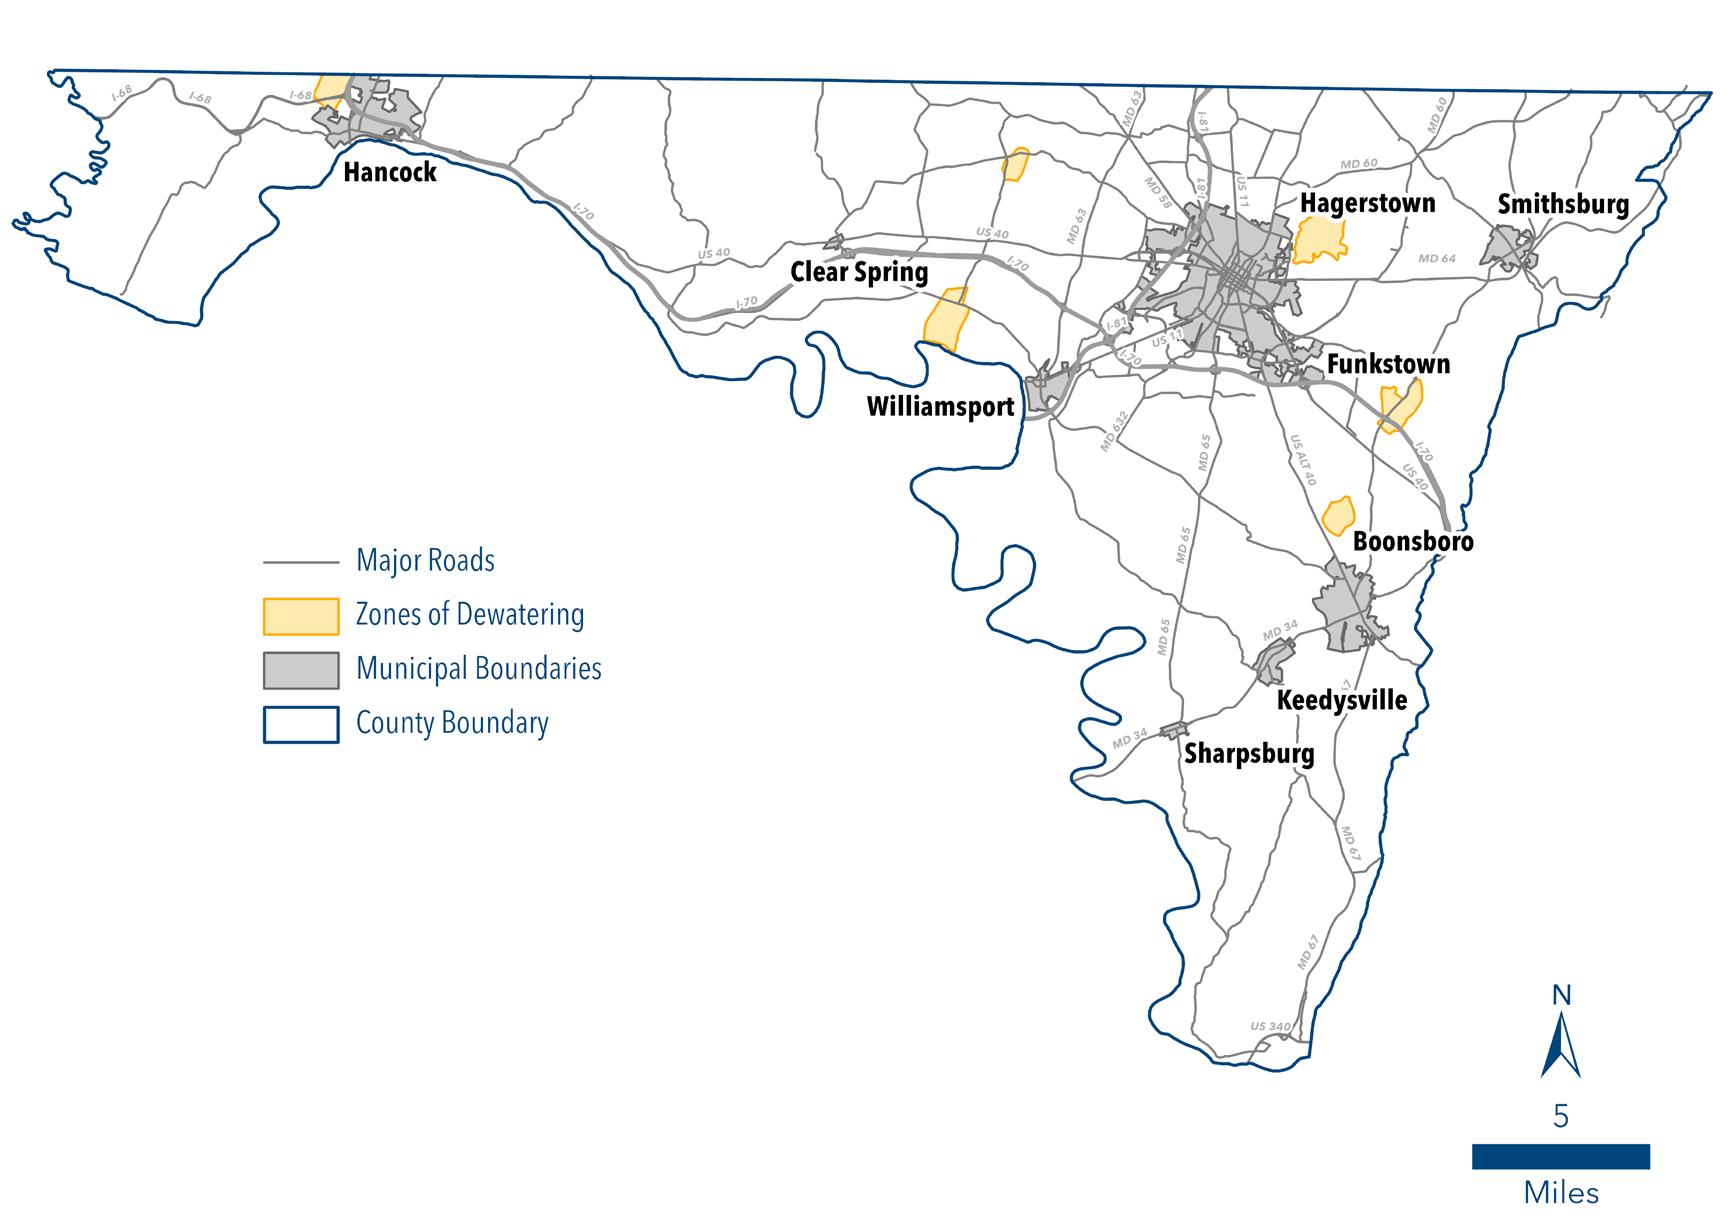
Washington County’s Zoning Ordinance is the primary land use control tool governing mineral resource extraction locally. When zoning was first enacted in Washington County in 1973, approximately 5,000 acres of land were classified as Industrial Mineral (IM). Most of the lands zoned IM at that time were in the ownership of companies either actively engaged in mineral extraction, or in the mineral extraction business with apparent plans for removing minerals on their property. Mineral extraction was also permitted as a Special Exception on land with other zoning classifications.
The Zoning Ordinance text was updated in 1983 and divided mineral extraction into three categories based on the amount of area disturbed and the length of operation time: Low Volume (LV), Medium Volume (MV), and High Volume (HV) Mineral Extraction. A summary of the key characteristics of each category is displayed in Table 10-1 below.

As seen on Map 10-4, Washington County currently has four MV and thirteen HV mineral extraction operations. HV operations are only permitted outside of the UGA, TGA and Rural Villages. LV (one acre or less in size) are regulated only within Washington County, as the Maryland Department of the Environment (MDE) only regulates mineral extraction greater than one acre in size. Therefore, LV are not reflected on the map 10-4 of active permitted mining operations. The County will need to ensure that low volume operations are more accurately tracked in the future in order to pinpoint their geographical location, to avoid potential conflicts from adjacent land uses, and to address the gap between State and County oversight of small mine operators.
As part of the 1983 Zoning Ordinance updates, a completely new Industrial, Mineral (IM) District section was adopted. Presently, the IM District is designed solely for HV operations in the rural areas of the County. The IM District was changed from a traditional zoning district classification to a “floating zone”. Unlike an overlay zone, which layers additional land use controls on top of those associated with the underlying zoning classification, floating zones render the existing zoning inert while permitting only pre-specified uses, setback requirements and other development standards. Applications for new IM District approval occur through the rezoning process, but do not require meeting the “Change or Mistake” burden inherently placed upon applicants in a typical rezoning case.
The Zoning Ordinance defines a few key objectives for the regulation of IM Districts. First, it aims to protect existing IM Districts from encroachment by incompatible land uses. Second, the ordinance seeks ensure that new or expanded IM Districts are compatible with existing adjacent land uses. The effects on public roadways are also a major consideration in the establishment of new IM Districts.
The Ordinance also defines a number of performance standards that must be accounted for in site planning development and review. IM applicants must identify and adhere to hauling routes along County roads adequately designed to bear the burden associated with an IM operations. Applicants must also estimate average daily truck traffic and be prepared to post a performance bond if the Planning Commission determines, during the site plan approval process, that the resulting vehicular traffic may damage County roads. Applications must consider the location of geologic or environmentally significant features and identify ways to minimize visual, auditory, air quality (dust) and vibration impacts. Finally, in keeping with State law, the applicant must consider what impacts their operation will have on groundwater supply and quality within the zone of dewatering influence and make contingency plans for well replacement of public water supplies that fall within this State designated zone (see Map 10-3, Zones of Dewatering).
The Federal Surface Mine Control and Reclamation Act (SMCRA) of 1977 recognized the need to uniformly regulate the technique of using surface mining to extract coal and to focus more attention on mine reclamation, particularly for abandoned coal mines. SMCRA created minimum performance standards for mining operations that states had to adhere to in the creation of their own individual surface mining regulations.
While mineral resource extraction is a type of land use that inherently creates significant disturbance to the natural surface of the land, its temporary nature provides opportunities
to reclaim the site for productive use after operations have ceased. State law requires that areas affected by mining shall be restored in a timely manner to conditions that are capable of supporting uses equal to or better than previous conditions. Washington County currently requires applicants applying for an IM rezoning to provide a plan for reclamation after active mining operations have ceased.
The method of mineral extraction strongly influences the limits of any individual reclamation plan. Economic constraints also influence the range of projects that can be considered feasible, cost-effective reclamation uses. Projects that are both economical and ensure long-term land and water quality should gain the highest priority. Potential categories for re-use of reclaimed mineral resource lands include: agriculture, pasture, forestry, wildlife habitat, recreation or open space uses, industrial or commercial uses, residential development, or as a reservoir. Within Washington County, previous forms of reclamation have been within the realm of agriculture and forestry uses.

The considerable cost of remediating hazardous, abandoned mines remaining from the State’s 19th and 20th century industrial legacy has led Maryland to pursue reclamation through remining. Modern technology has enabled economical extraction of remaining reserves at various sites of many abandoned mines around the State. This practice offers another option for County lands disturbed by mineral resource options that may be difficult to convert to another type of land use. Reclamation plans are essential to retaining productive use of County lands in the aftermath of extraction, thereby ensuring its economic utility while minimizing longterm environmental impacts to people and wildlife in and around the disturbed area.
Watershed level planning studies, which inventory the overall health and abundance of sensitive environmental resources within a given watershed, could help provide guidance as to what land uses would be appropriate choices in the development of the pre-mining reclamation plans. If environmental quality in a watershed has been compromised to a significant degree by mining operations, retaining the reclaimed land for conservation purposes would help address overall watershed health. Additionally, due to the unique nature of the County’s subsurface geology, such as the porous karst terrain underlying the Hagerstown Valley, less intensive land uses may be the most prudent choice to prevent groundwater contamination or the development of sinkholes.
Ì Encourage interim reclamation activities to improve the soil quality and potential for vegetative growth during the life of the mining operation rather than after mining operations have ceased.
Ì Develop policies that support reclamation through re-mining to abate any negative impacts from legacy mines in the County.

Ì Identify and utilize any programs which can support reclamation or reforestation of older mined sites which were not subject to reclamation requirements established by Maryland’s Surface Mining Law.
Ì Maintain land use policies and regulations that discourage the preemption of known mineral extraction areas by other uses.
Ì Require an inventory and impact assessment of sensitive areas located on proposed new Industrial, Mineral zoning districts.
Ì Consider the impact on sensitive area resources in applicable areas during development review before extending any new Industrial, Mineral (IM) Zoning Districts.
Ì Ensure that all available measures are taken to protect the natural environment and adjacent communities from spillover effects resulting from active mineral extraction activities.
Ì Ensure that post-excavation uses for mined sites are identified during development and are consistent with existing or planned adjacent uses.
Ì Coordinate with other County agencies to track low volume (LV) mineral extraction operations more accurately.


While Washington County has experienced some urbanization over the last century, it remains a largely rural community. Agriculture and forestry land uses make up over 80% of Washington County’s total land area. The prime agricultural soils of the Great Hagerstown Valley provide ample opportunity for quality farming while the forested ridges of South Mountain, Elk Ridge, Red Hill, Fairview Mountain, and Sideling Hill provide prime forest resources.

The Agriculture and Forestry Resource Element serves as a guide for future agriculture and forest resource protection and sustainability. It establishes goals and policies that help define, protect, and maintain our resources for future generations. The purpose of this element is to promote and protect the County’s rural heritage as a sustainable resource. It is also intended to protect the County’s rich cultural and historical heritage.
Early settlers migrating west across the Appalachian Mountain range found fertile soils and open land suitable for crop cultivation and raising of animals in areas of the Great Valley. The majority of agricultural areas where prime soils exist in Washington County are located within that stretch of land from South Mountain to just west of Clear Spring. This section summarizes the existing agricultural resources, agricultural sales, and demographics of farm operators in the County.
According to the US Department of Agriculture (USDA), prime farmland is defined as, “land that has the best combination of physical and chemical characteristics for producing food, feed, forage, fiber and oilseed crops”. In addition, prime farmland “has an adequate and dependable supply of moisture from precipitation or irrigation, a favorable temperature and growing season, acceptable [pH], acceptable salt content, and few or no rocks.”1 When treated and managed properly, these soils have the capability to produce sustained high yields of crops. In order to classify the various levels of soil quality, USDA Soil Surveys include a Land Capability Classification system to group and prioritize soil classifications according to their limitations for field crops, the risk of damage if they are used for crops, and the way soils responds to management. Prime agricultural soils are considered to include Soil Capability Classes 1 and 2. As expected, the majority of Washington County’s agricultural areas correspond with the prime soil classifications.
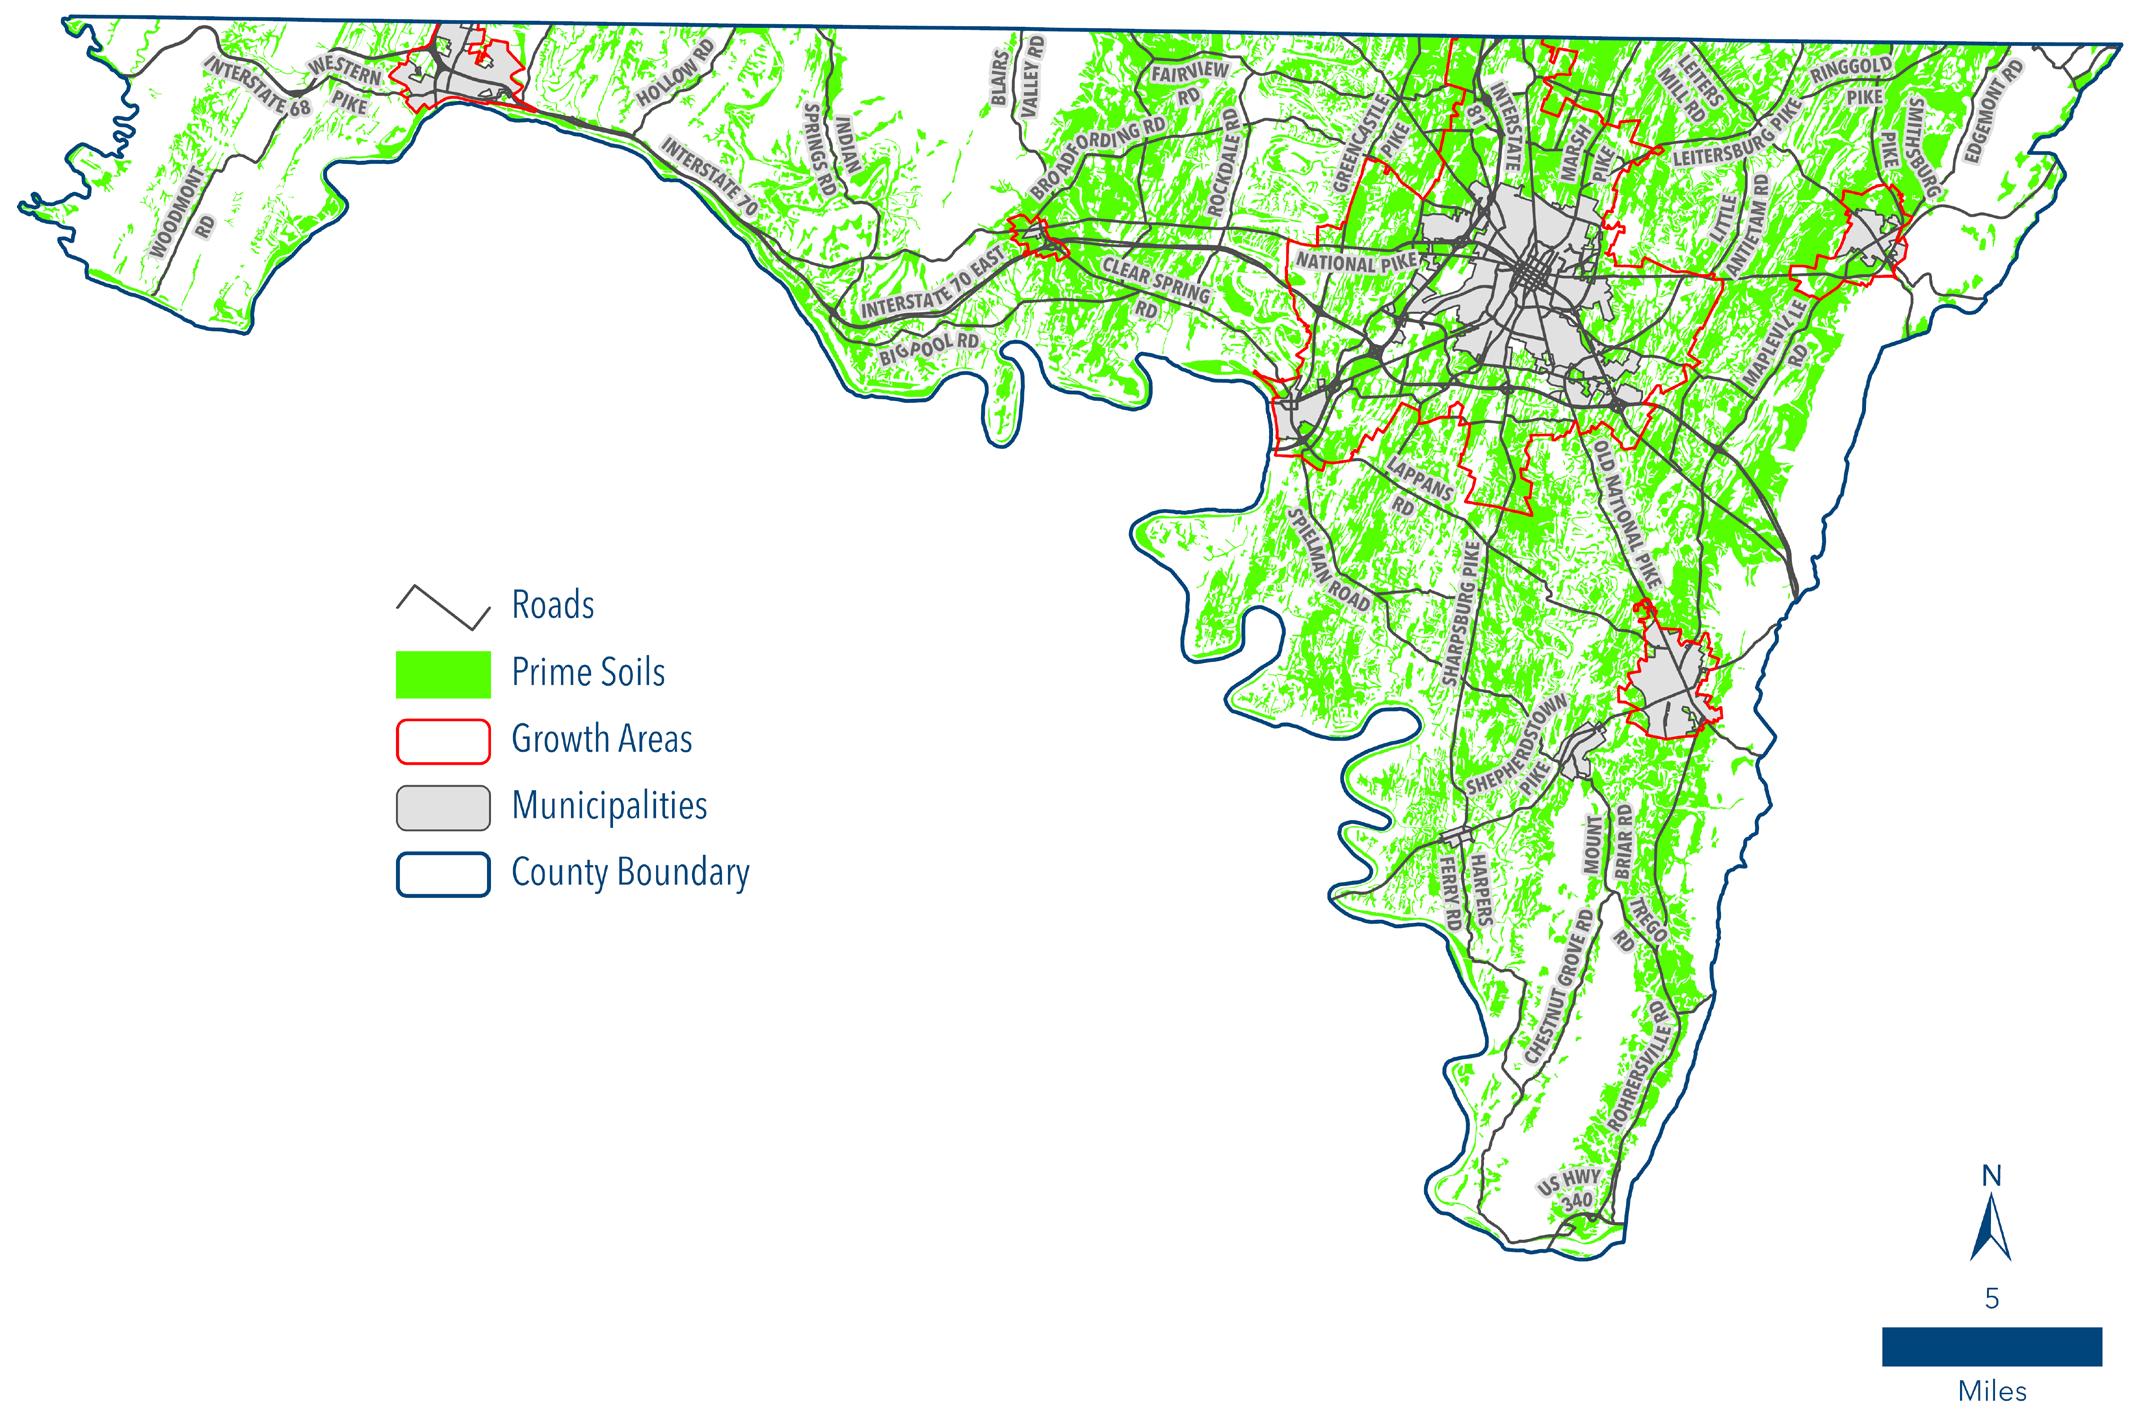
In 2017, the US Department of Agriculture National Agricultural Statistics Service (NASS) estimated that there were approximately 119,248 acres of active farmland in Washington County. This figure represents a slight decrease in land being used for active agriculture since the previous survey in 2012. While the amount of land in the County that is assessed as agriculture and has an agricultural land use is much greater, the amount of land actively being farmed helps planners evaluate the viability and profitability of the agricultural economy in the County. After several years of sharp decline in the late 1980s to early 1990s, it appears that active farmland areas have stabilized in the County. In correlation, the number of farms in the County are trending upward while the average size of farms has shown some variability over the last decade.
Land use on active farmland in the County consists mostly of cropland (69%). Pasture and woodland each make up 13.8% of land use while the remaining 3.5% consists of orchards and other forms of active farmland. It should be noted that while only 1% of land in the County is used for orchards, this represents almost 30% of the total orchard land in the State of Maryland.
Source: US Dept. of Agriculture, National Agricultural Statistics Service (2017)
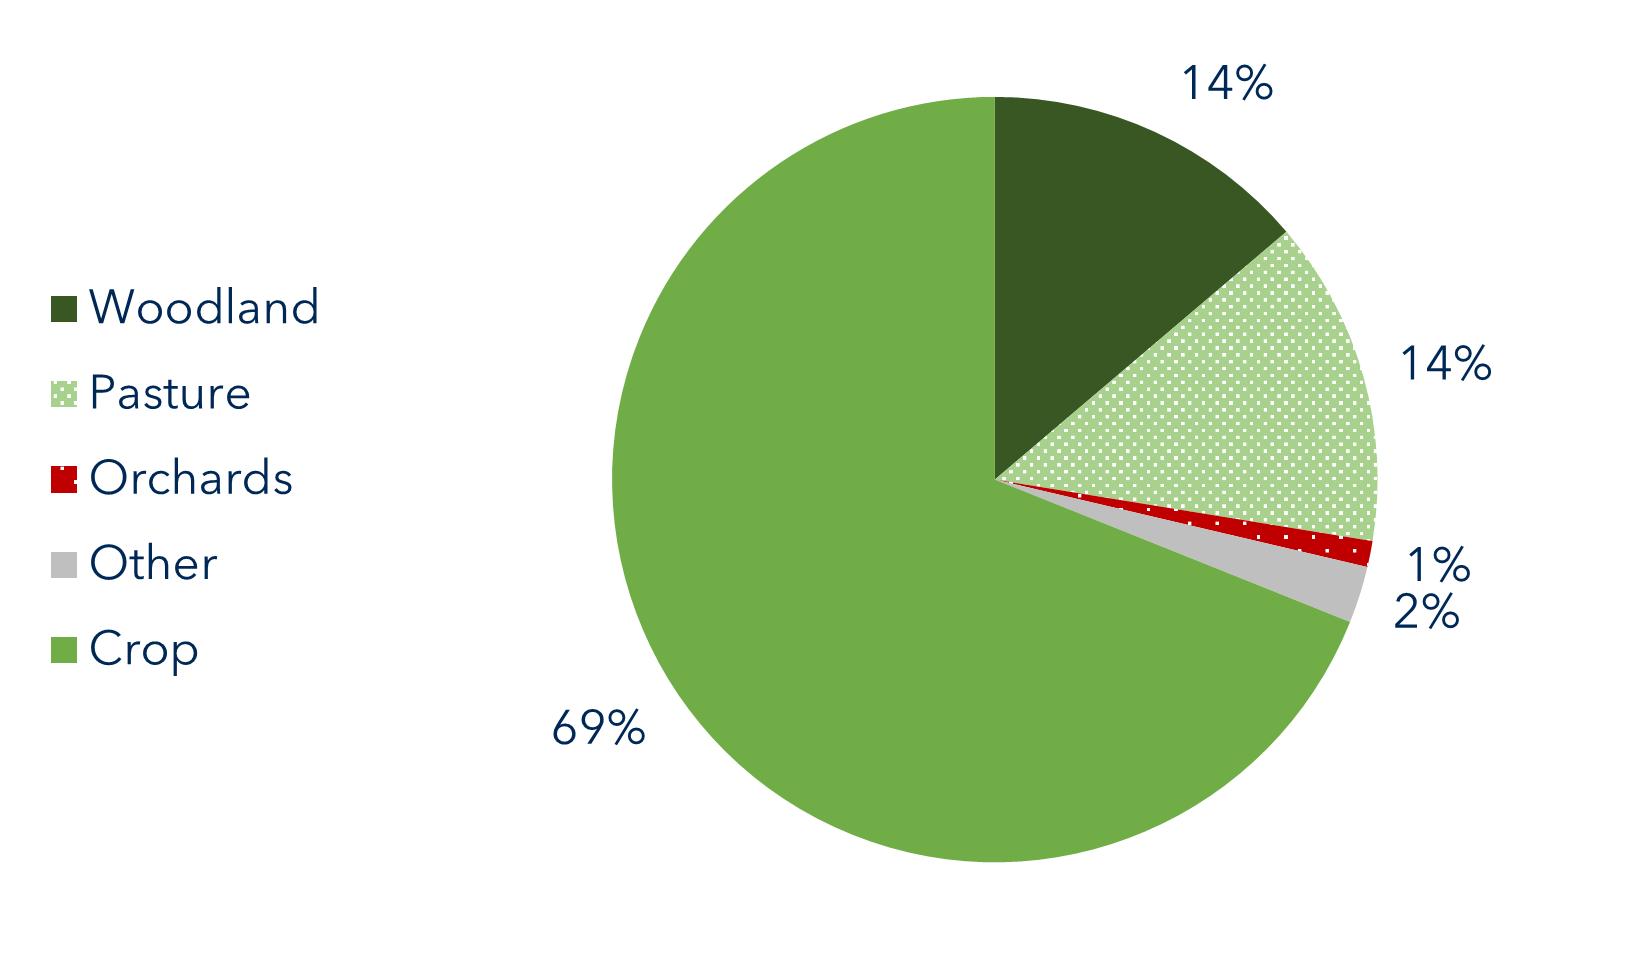
The most predominant crops grown in the County are corn, hay, and soybeans. Combined, these three categories make up over 75% of the crops produced in the County. Animal husbandry is another important aspect of the agricultural economy. As has been historically the case, the majority of livestock raised in the County are cattle. It is assumed that based upon agricultural sales figures also compiled in the survey, the County still has similar stock of layer chickens. Compared to animal inventories across the State, Washington County ranks first in the number of cattle, hogs, and pigs; second in goats; and third in sheep and lambs.
(D) Totals withheld to avoid disclosing data for individual farms
Source: USDA, National Agricultural Statistics Service
Agriculture remains a strong economic force in Washington County, with over a third of its total land area consisting of farmland. According to the 2017 USDA NASS, the market value of agricultural products has reached nearly $153 million with more than $38 million in crop sales and $115 million in livestock sales. Agricultural sales in the County are spearheaded by the sale of dairy milk, grains and cattle, which make over $92 million.
(D) Totals withheld to avoid disclosing data for individual farms
Source: USDA, National Agricultural Statistic Service (2017)
With agricultural sales topping $2.4 billion across the State of Maryland in 2017, Washington County ranked 7th in the State, behind the larger and more rural eastern shore counties of Caroline, Dorchester, Queen Anne’s, Somerset, Wicomico, and Worcester. Washington County ranks 1st in the State in sales of milk from cows, cattle, fruits, tree nuts, and berries, sheep, goats, wool mohair and milk, and other animals and animal products. Other animals and animal products generally refer to non-traditional livestock and their products such as alpaca, emu, and others. Additionally, it ranks in the top 5 highest sales in other crops and hay, hogs and pigs, and aquaculture.
Understanding the evolution and vitality of agriculture also includes understanding the operators of the farmland. Historically, farming operators in Washington County have been white males. Over the last decade this trend has slowly begun to diversify and include more minority owners. Since 2007, the number of female farm operators have increased by 38% while the number of farms operated by Hispanic farmers has increased by about 67%.
One notable trend happening in agricultural operations is fluctuation in the average age of operators. Up until 2012, the average age of an operator in Washington County was on the rise. The 2017 NASS found that the trend may be reversing with the average age dropping by over 3 years. In the 2017 Census of Agriculture, the USDA began tracking data on “new and beginning producers”. This category includes producers who have been operating for 10 years or less. According to the survey, there were 540 new and beginning producers with operations in Washington County the third highest in the State of Maryland.

Land preservation efforts in Washington County have a 40-year history starting in 1978 with one program, the Maryland Agricultural Land Preservation Program (MALPP). The land preservation opportunities in Washington County have grown to several programs including: MALPP, Conservation Reserve Enhancement Program (CREP), Maryland Environmental Trust (MET), Transportation Equity Act Funds (TEA), Green Print, Rural Legacy, and most recently Installment Payment Purchases (IPPs). The County has also had some limited success with donated preservation easements. It should be noted that all of these programs are voluntary and entered into at the sole discretion of the private property owner. Another potential funding source that has been explored by the County in the past is a Transfer of Development Rights (TDR) program whereby a privatized system of developer purchased development rights in the Rural Area could be transferred to the Urban Areas. So far, the viability of a TDR program has not been tenable. Residential and land market values and supply have not reached a point that could support the needed financial incentive to make the program practical.
In identifying lands for agricultural land preservation efforts, the County prioritizes targeting contiguous farmland or areas where land has already been set aside for agricultural or conservation purposes. The County participates in various Federal, State and local land preservation programs where these priorities are built into priority ranking formulas and eligibility requirements. As a result of the County’s efforts, significant farmland and open space has been set aside for future generations. Descriptions of these programs and efforts are offered below:
• Maryland Agricultural Land Preservation Program (MALPP)
MALPP is the oldest County-administered land preservation easement program and comprises over 14,700 acres in total. The Washington County Agricultural Land Preservation Advisory Board (Ag Board), the Board of County Commissioners, and the Maryland Agricultural Land Preservation Foundation (MALPF) of the Maryland Department of Agriculture (MDA) administer the program through the County’s Department of Planning and Zoning. The easements are extremely competitive as there are many applicants to the program. If purchased by the State, the easement will remain effective in perpetuity.
• Rural Legacy Program (RLP)
Enacted by the 1997 Maryland General Assembly, the RLP was created to focus on some of Maryland’s best natural, agricultural, historic and cultural areas, as well as representing Maryland’s most significant rural landscapes. The program encourages local governments and private land trusts to identify Rural Legacy Areas (geographic areas around historically significant portions of the county) and to competitively apply for funds to complement existing land preservation efforts or to develop new ones. Easements or fee estate purchases are sought from willing landowners to protect areas vulnerable to sprawl development that can weaken an area’s natural resources, thereby jeopardizing the economic value of farming, forestry, recreation and tourism. The Rural Legacy Program in Washington County has permanently protected over 8,600 acres.
The State of Maryland has initiated this easement program to improve the water quality of the Chesapeake Bay by installing vegetative buffers along streams, waterways, and highly erodible soil. These buffers serve as a natural barrier to prevent nutrients and sediment from entering County and State waterways. To qualify for this program, the landowner must have a current CREP lease on their land. The easement value is determined by the amount of acreage in the program and current buffer width. The CREP program has permanently protected over 1,900 acres.
• Installment Payment Program
Due to the competitive nature of land preservation funding across the State of Maryland, the County opted to use local funding to create a land preservation program exclusive to the citizens of Washington County. The IPP was created for the purpose of accelerating land preservation easement purchases for the agricultural landowners and citizens the County. Once a landowner agrees to accept the County’s offer to purchase development rights, an Installment Purchase Agreement (IPA) between the County and the individual seller is drafted, signed, and recorded. The IPAs are paid over a period of 10 years, with 10% of the principal being paid at settlement with the interest and 10% of the principal being paid annually for the remaining 9 years. There are currently over 1,500 acres of IPP easements acquired by the County.

This program was developed by the Maryland Agricultural and Resource-Based Industry Development Corporation (MARBIDCO) for the purpose of marketing farming opportunities to new generations. The key tool for the program is its easement purchase option contract, which provides up to 51% of appraised fair market value to a young or beginning farmer towards the purchase of their first farm. While still a newer program, it has the potential to provide a significant benefit to the growing number of young farmers in Washington County. There are approximately 700 acres of NGFAP easements in the County.
• Land Trusts and Other Easements
Frequently through the years, Staff has worked with various land trusts such as the Maryland Environmental Trust (MET), Save Historic Antietam Foundation (SHAF), the American Battlefield Trust and others to help facilitate the acquisition of easements on land in Washington County. The State also administers their own easement programs such as Program Open Space (POS) Stateside to preserve natural areas for public recreation and watershed and wildlife protection. Several federal scenic easements exist to protect viewsheds around the C&O Canal as well as Antietam National Battlefield. There are over 7,200 acres of permanent easements preserved through these land trusts and State program.

Through 2020, the County has preserved over 30,000 acres of land through its many land preservation programs. In addition to the County’s land preservation efforts, several other programs have bolstered our protected land efforts. Other protected land areas included State, Federal, and local government owned lands that total nearly 36,000 acres. These lands are mostly attributed to parkland and other resource conservation efforts. Forest conservation easements are also included in the County’s calculations for protected lands. There are currently a little more than 3,600 acres of land under forest conservation easements. Current protected lands are shown on the map below.
To evaluate the County’s success in land preservation efforts, a comparison metric is used to compare how much agricultural land has been converted vs. preserved over time. Early in the implementation of County land preservation programs, the amount of agricultural land converted to other uses exceeded the amount of land the County was able to preserve through existing programs. This trend quickly reversed itself as the land preservation programs started to take hold in the mid-1980s. Since that time, the County has continued to far outpace land conversion with land preservation efforts.
It is also worth noting that agricultural land conversion rates have steadily decreased since the early 1980s. This can be attributed to the County’s multi-faceted approach of a strong land preservation program and smart growth policies.
To efficiently spend land preservation funding, most programs have a priority ranking system that is used to determine which properties have the highest compatibility with the goals and objectives of the easement program. Included in the various priority ranking systems are evaluations of contiguity with other easements, use of best management practices, prime soils, location within the designated Priority Preservation Area, historic resources, environmental resources and several other criteria.

For agricultural land preservation easement programs such as Maryland Agricultural Land Preservation Foundation (MALPF) and IPP, the highest number of points are given to those properties that are already contiguous to other permanent easements, have the best quality soils, and use best management practices for farming operations. Each year, the County is allotted funding from the MALPF and the highest ranked properties are offered easements first.
The Rural Legacy and CREP easement programs are more environmental and culturally focused programs that also include ranking criteria such as amount of forested area, proximity to sensitive areas, inclusion of historic resources, etc. Similar to MALPF, funds are received from the State and the highest ranked properties are offered easements first.

While challenges exist, local demand for land preservation has not significantly waned. In fact, interest in local land preservation programs has increased over the years creating a greater demand for funding. In order to counter the lack of funding, the County began successfully pursuing several opportunities to leverage easement funding and land preservation to its maximum level.
Currently, the primary funding mechanisms the County uses to support land preservation is with revenues from the real estate transfer tax and the agricultural land transfer tax. When agricultural land is transferred and converted to another use, a tax is collected from that transfer and used to provide the local match needed to support the MALPF easement program. In addition, when any real property in the County transfers from one entity to another, there is a Real Estate Transfer Tax associated with the transfer. As stated in the enabling legislation, the first four-hundred-thousand dollars ($400,000) collected from this tax goes explicitly toward land preservation efforts in the County. Originally, the funds were used solely to implement the County’s Installment Payment Program. Recently, the County opted to reallocate a portion of the transfer tax revenues toward the MALPF program in order to take better advantage of the programs 60/40 match ratio. For every forty dollars ($40) the County provides toward MALPP easement funding, the State provides sixty dollars ($60). By increasing local match funding with revenues from transfer tax, it allows the County to leverage additional funding from the State of Maryland and increase overall funding allocations for this program.
Continued implementation of the Installment Payment Program in the County has also provided another opportunity to obtain permanent easements through creative financing. Established as a ten-year program, the County purchases an easement and pays the owner in ten equal installments annually. This provides flexibility to the County and the landowner so that funding does not have to be produced in a lump sum and the property owner will have a steady stream of income for a longer period of time and can incrementally invest in the agricultural operation.
One final method of trying to maximize easement funding is through donated and reducedvalue easements. The State of Maryland and local land trusts have had the most success with donated easements in the County. Through Federal, State, and local efforts, there have been over 50 donated easements settled in Washington County. As part of local land preservation efforts, the County has been actively promoting donated and reduced value easements. To date, the County has settled nearly 20 reduced-value easements primarily through the Rural Legacy program.
Since the last Comprehensive Plan was adopted by Washington County in 2002, several new trends have emerged in Washington County agriculture, and American agriculture as a whole. Many of these trends were unforeseen when the County was writing the previous plan, and they must be accounted for when looking toward the future. One such change is related to promoting a more commercial aspect to farming by creating an interactive environment for visitors to come to the farm rather than the farmer taking product off-site for sale and consumption. This has been generically termed “agri-tourism” or “agribusiness”.
According to the Maryland Rural Enterprise Development Center, “Agritourism refers to enterprises and activities that are conducted on farm sites for the pleasure, education, recreation and enrichment of visitors.” Generally, these practices are employed as a way to diversify the main operation of the farm through means such as retail sales, educational opportunities, and recreation. Historically, many Washington County farms have participated in such activities, even prior to the current trend, but recently the County has seen a rise in agritourism.

Value-added product manufacturing on local farms has been one of the leading drivers in new agricultural businesses for the last decade. A value-added product is loosely defined as enhancing or improving the value of an agricultural commodity. Examples of these types of uses include alcohol manufacturing facilities such as wineries, breweries, or distilleries, as well as, creameries, and cheese manufacturing. In 2012, the County adopted new Zoning Ordinance regulations to include some of these new land uses. Since then, there have been several businesses of these types established and they have become quite successful.

More traditional agricultural operations have also begun to incorporate alternative agricultural uses on farms to produce additional income. Popular uses include U-pick operations, hayrides, corn mazes, and petting zoos with traditional and exotic livestock.
While these new trends are welcomed to provide new commercial and economic opportunities for farmers, they also have highlighted the lack of proper infrastructure to support intense rural business and the challenges related to installing such infrastructure. Proper infrastructure is key to ensure healthy and safe access for the general public.
Roads as well as water and sewer infrastructure are the most common limitations to rural business enterprises such as these. While small businesses are encouraged, it has become difficult to balance the success with the strain on existing infrastructure. Many small businesses do not have the capital to open a business and make large public infrastructure investments such as widening roads or installing oversized septic systems. The County will need to continue monitoring the expansion of rural businesses and find ways to balance needed infrastructure improvements with the limited amount of investment small businesses are capable of making.

The “Grown Local” and organic movements have also been trending upward over the past several years. Many Washington County farmers have taken advantage of their close proximity to metropolitan areas to export their locally grown products to the major urban areas of Washington DC and Baltimore. This movement has also increased the number and frequency of local farmers markets. In addition, the growth of the organic foods market has presented local farmers with the ability to diversify their operations by producing products like organic milks and cheeses, meat, fruits and vegetables. These products tend to have a larger profit margin.

Though the average age of a farmer is approximately 55, Washington County has seen a resurgence of young farmers purchasing and operating farms. Some have inherited family farms, and others have managed to purchase farms on their own. Many of these young farmers come with advanced, formal agricultural degrees and education. As farming technology and practices have advanced over the years, these young farmers have gained a great advantage that comes along with the understanding of newer technological resources. Additionally, the new generation of farms seem more apt to incorporate unconventional uses in their farm operations.
The County continues to support young farmers in various ways. For those young farmers who want to purchase land to establish a farm, the County participates with the State’s Next Generation Farmland Acquisition Program. Locally sponsored events such as the Washington County Agricultural Exposition provide opportunities for young adults to show and sell livestock and other agricultural commodities. In addition, local high schools offer agricultural science curricula for students wanting to pursue careers in the agriculture and agriculture support industries.
In order to conserve and protect our agricultural resources, the County uses several different tools to create a comprehensive land use strategy. Current strategies include a combination of land use policies and regulations in ordinances and functional plans such as the Zoning Ordinance, Subdivision Ordinance, and Land Preservation, Parks and Recreation Plan as well as a robust land preservation program.
Pre-dating most jurisdictions across the State, Washington County first established a policy of designating areas for growth and development and for land and resource protection in the mid-1970s. Growth areas were then established in the 1981 Comprehensive Plan to support this policy. This was the initial step in establishing a boundary between urban and rural areas in the County. These policies continued to evolve and be refined through State legislative efforts through the 1990s. In 2002, with the adoption of a new Comprehensive Plan, the County took an enormous step forward in using land use management tools to direct growth into areas where existing infrastructure was available and limit the amount of development in rural areas. The 2002 Comprehensive Plan called for reducing the number of lots permitted to be subdivided in rural areas thereby limiting the conversion of farmland. While not eliminating the possibility of some development in rural areas, these policies have significantly reduced development pressures in the rural area.
The addition of several new water quality regulations passed since the adoption of the last comprehensive plan have produced many changes in the operation of farms. The primary pollutants looked at by the State related to agricultural operations are nitrogen, phosphorous, and sediment. These pollutants can come from many different sources, but this section will focus on the agricultural sector contributors. There are many other pollutants that are tested for and monitored by the State, but these three pollutants have been identified and targeted for specific reductions.
Nitrogen and phosphorous pollution typically come from fertilizer and animal waste sources. On a National level, the EPA has called for fertilizer producers to reduce the rates of these compounds in their products. The State has also implemented numerous programs to help reduce the use of fertilizers and target their usage only when needed and in the appropriate locations (i.e. away from streams and waterways). Animal waste is controlled at a State level through the Maryland Department of Agriculture. New regulations regarding the ban of manure spreading during the winter months have forced many local framers to expand their nutrient management systems.
Sediment pollution is primarily linked to the tillage of soils and the access of animals directly into waterways that damage stream banks. Maryland has encouraged farmers to adopt no-till farming techniques into their operations.

No-till farming is a method used to seed the crop directly into vegetative cover or crop residue with little to no disturbance of the surface soil.
At a local level, there is not much regulatory authority because water quality is a regional issue that does not adhere to subjective jurisdictional boundaries delineated on a map. However, the Washington County Soil Conservation District works diligently with local farmers to implement best management practices whenever possible. These actions are reinforced in County policies related to land preservation efforts, development regulations, and educational outreach activities. They are further supported in the County’s land preservation efforts through evaluation of best management practices being a large portion of points given as part of the priority ranking system.
The initial purpose of the Ag District program started by the Maryland Department of Agriculture’s (MDA) Maryland Agricultural Land Preservation Foundation (MALPF) was to keep productive agricultural land in farming by staving off potential development and conversion of the land. The premise of the program is to essentially buy time for local and/or State jurisdictions to gain the necessary funding to purchase the development rights from participating landowners and alleviate development pressures faced by local farmers attempting to remain viable in the agricultural industry. In 2012, the State opted to end this program but gave local jurisdictions the option to take over the program. Washington County chose to initiate their own program and took over responsibility of existing State Districts at that time.
The Ag District program encourages landowners to voluntarily enter into an agreement with the County to restrict development on their land for a period of five years. In return for the restrictions, the landowner receives a tax credit on all County property taxes associated with agricultural land and buildings, as well as limited reduction on property taxes on dwellings. This program is also a required precursor to become eligible to sell development rights easements through the Maryland Agricultural Land Preservation Program (MALPP).
To be eligible for the Ag District program, properties must have development potential, be located outside of growth areas, have an agricultural land use assessment by the Maryland Department of Assessments and Taxation, be at least 50 acres in size (or as small as 20 acres if contiguous to 50 acres or more of preserved land), and have at least 50% of Class I, II and III soils. At this time, all Ag Districts in the County are administered solely by the County, and each Ag District is governed by a district agreement recorded in land records at the Washington County Courthouse as well as the adopted Ordinance for the Establishment of Agricultural Land Preservation Districts and accompanying regulations.

Washington County currently has over 34,800 acres in the Ag District program and more landowners are joining the program each year. This is a good indicator of land preservation interest but there is concern that the program is beginning to exceed its purpose. The financial cost of maintaining tax credits for properties in the districts and in permanent easements have been increasing. In 2019, the average per acre tax credit was about $12 per acre costing the County nearly $418,000 in revenue for the district program alone. Between 1995 and 2015, the County, on average, established approximately 1,000 acres per year in various permanent easement programs. Extrapolating this information, it would take almost 35 years for the County to purchase easements on the existing 34,800 acres of land in the Ag District program, assuming that the property owner is interested in a permanent easement.
At the time this program was established, development conditions were more favorable in the rural areas of the County. Existing zoning regulations at the time allowed for one-acre and three-acre lot subdivisions with no limitation on the maximum number of lots created. Subdivision was a function of physical constraints more than zoning regulation. Since that time, the County has implemented new zoning districts in the rural areas that restrict the amount of development to a total number of dwelling units per acre standard. The adoption of these new regulations has dramatically reduced development pressure in the rural areas. In addition to County regulation, the State of Maryland also recently adopted legislation restricting the number of new septic systems that can be built in the rural areas. These compounding regulations have greatly reduced the pressures of development in the rural areas to the point where districts may no longer be advantageous to the long-term goal of permanent preservation. Many property owners have applied to the program to reduce their tax burden with no intention of long-term preservation.
Because recent changes in regulations have reduced development pressure and stabilized the land base in rural areas, there may be some merit in evaluating the effectiveness of continuing the Ag District program and the tax credit program in general. To increase the amount of land permanently preserved each year, one alternative that could be evaluated is possibly discontinuing the ag district program and redistributing those funds toward MALPF permanent easements to leverage more money from State programs. Another option may be to continue the Ag District program but discontinue tax credits on those properties that receive a permanent easement. As funding sources continue to dwindle and/or seek more investment from local entities, the tax credit program should be further evaluated to determine if the program is still effective in meeting its purpose.
The Agricultural Stewardship Act of 2006 provides the impetus and guidance for Counties in the State of Maryland to become more diligent in the effective spending of land preservation funds. It is the intent of the Act that Counties establish goals and priorities for the effective and efficient use of land preservation funding.
It has always been the goal of Washington County to support a diversified system of agricultural operations that include, but are not limited to dairy, livestock, crop, orchards, vineyards, and timber. As previously stated, one of the goals developed as part of the Washington County Comprehensive Plan is to, “promote a balanced and diversified economy, including agriculture.” One of the County’s objectives in obtaining this goal is to maintain at least 50,000 acres of land in the County in agricultural production. This acreage goal was developed in the early 1990’s in coordination with the Agricultural Extension Office and the University of Maryland based on an evaluation of critical mass and land needed to support the agriculture industry. Through 2020, Washington County has permanently preserved approximately 38,900 acres of farmland and woodlands through various preservation programs. In addition, approximately 34,800 acres of land are in short-term preservation districts.
A key component in the success of an agricultural preservation program is the efficient spending of funds to maximize the community benefit. Since the inception of agricultural preservation programs in Washington County, a priority rankings system has been used to determine the best use of preservation funds. This ranking system was amended to further incorporate the goals of MALPF by expanding the contiguous definition to include open space lands and by increasing the penalty for exclusionary development. Expanding upon this existing practice, and to remain consistent with State preservation goals, the County’s PPAs are being designated to further refine and maximize the focus and impact of preservation funding.
In 2011, the County amended its Comprehensive Plan to include a Priority Preservation Element in accordance with State legislative requirements and accompanying guidance documents. According to State law, Priority Preservation Areas are required to:
• Contain productive agricultural or forest soils; or be capable of supporting profitable agricultural and forestry enterprises where productive soils are lacking;
• Be governed by local policies that stabilize the agricultural and forest land base so that development does not convert or compromise agricultural or forest resources;
• Be large enough to support the kind of agricultural operations that the County seeks to preserve, as represented in its adopted Comprehensive Plan; and
• Show that a County’s acreage goal for land to be preserved through easements and zoning within an area shall be equal to at least 80% of the remaining undeveloped land in the area.
Using the County’s GIS database, parcels generally located outside of Urban and Town Growth Area boundaries and Priority Funding Areas that were greater than 20 acres and had an agricultural use assessment were used as potential sites for PPAs. The areas were further refined by focusing on parcels that were located in close proximity to existing permanent easements as well as existing 10-year districts. Then the soils and forest cover were evaluated to ensure that productive areas were being defined. Staff focused the primary areas for establishment of PPA’s around existing “blocks” of agricultural easements located generally in the Clear Spring, Smithsburg, and Downsville areas. To the degree possible, PPAs were extended around these existing blocks of easements to include parcels adjacent or in close proximity to existing permanent easements and 10-year districts.
When PPAs were first adopted in 2011, the County had permanently preserved approximately 22,000 acres of land leaving a balance of nearly 30,000 acres to meet our land preservation goals. In accordance with the guidance provided in the Agricultural Stewardship Act of 2006, the additional 30,000 acres of permanently preserved land needed to meet the County’s stated goals should equal at least 80% of the total undeveloped area in the defined PPAs. After determining preliminary locations for PPA designation and establishing a minimum preservation target threshold of 30,000 acres, Staff began to build the PPAs with blocks of large undeveloped land around existing agricultural preservation easements and 10-year districts. As areas were added, the proportion of undeveloped land ‘viable’ for preservation efforts was continually tested against areas that contain existing development or existing permanent easements in order to maintain the 80% undeveloped requirement of the legislation. Ultimately, this process yielded a proposed area of 74,854 total acres, of which 20,690 acres contain permanent preservation easements and 9,461 acres do not meet the minimum MALPF requirements for easement acquisitions. This leaves a balance of 44,703 acres of ‘viable’ land within the proposed PPAs available for preservation efforts.
Since the adoption of the Ordinance in 2011, Washington County has been able to permanently preserve an additional 3,500 acres in the PPAs through land preservation programs. The 3,500 acres increases the amount of preserved land in the PPA to 25,500 acres, or 34% of the total area. When accounting for a goal of 80% of undeveloped land in the PPA (74,854 acres) to be permanently preserved, the County is more than 42% of the way toward its goal.
Comparatively, since 2011 approximately 88 acres of land in PPAs were converted for development. This acreage represents the amount of viable agricultural acres lost. For this analysis, ‘viable agricultural acres’ is defined as agricultural land that meets the minimum MALPF requirements for easement acquisitions. This includes land that is located outside of a designated growth area, greater than 20 acres, has an agricultural land use assessment, and contains a minimum of 50% or more of Class I, II, or III soils.
These figures present a positive trend in land preservation efforts within locally designated Priority Preservation Areas. With a conversion ratio of 39 acres preserved per 1 acre developed within the PPA, it is evident that land preservation and land management efforts in the County are achieving the desired outcome of the Agricultural Stewardship Act of 2006.
In 2003, the County passed the Right to Farm Ordinance. The purpose of this Ordinance is to educate the general public about agricultural operations and the potential conflicts that can result from encroaching development. Education efforts include notification to all new property owners of the impacts of farming operations such as odor, dust, spray, etc. at the time of settlement. Purchasers of land are required to sign a document that states they have been made aware of these potential conflicts. The Ordinance also provides a process by which to handle the occasional nuisance complaints that can result from incompatible uses.
While the County has had many achievements regarding preserving land within the PPAs, there have also been some challenges. Below are summaries of some of these challenges.
Funding Issues
As has always been the case, the most significant challenge in land preservation efforts has been funding. The primary sources of land preservation funding come from real estate and agricultural land transfer taxes. Since the 2002 Comprehensive Plan was adopted, the County has seen times of economic prosperity, as well as a major recession. In the early 2000s, the economy was flourishing because of a major housing boom. The impact of the boom was a massive increase in land values. This allowed the State budget to swell which, in turn, provided millions of dollars in real estate and agricultural transfer taxes to put toward land preservation efforts across the State.

Unfortunately, as history has taught us with any economic increase there is typically an accompanying decrease. The housing market recession began in late 2006 and lasted for nearly 8 years and still has lingering impacts. Property values decreased, transfer taxes became minimal, and the State budget was diminished. While the associated drop in land values has helped to mitigate this funding decrease by empowering the purchase of more acres per dollar, the resulting lack of easement funding was more significant than the decrease in land values.
More recently there has been a resurgence in commercial and industrial development. Mostly in the form of warehouse and distribution facilities, there has been significant amounts of land conversion to accommodate these facilities that are averaging between 800,000 and 1,000,000 square feet. In turn this has caused a significant increase in agricultural transfer tax that is used for land preservation programs. These significant swings in economic boom and bust highlight the contradiction and fragility of land preservation funding. The double-edged sword of waiting for land to convert so that land can be preserved creates a level of uncertainty and unpredictability that may jeopardize preservation efforts.
Another fluctuating influence on a land preservation program is the interest of landowners to participate in these programs. In Washington County, there are two primary factors that weigh on a property owners’ decision to participate in land preservation programs. The status of the economy is one of these variables. When the housing market is in decline, landowners seem to be more receptive to these programs to help generate revenue for the farm. However, during a housing boom, the market to develop usually outweighs the incentive to preserve land. This will continue to be an issue in the land preservation program as the supply and demand of the housing industry continues to vary.
The other primary variable to participation in land preservation programs are property owners who, because of their religious beliefs, familial obligations, or other reasons, choose to keep their properties in active agriculture without this type of governmental assistance. Inherent in the decision for private property owners to participate in land preservation programs is personal ethic. While this can be an obstacle to expanding land preservation programs in the County because a significant portion of productive farmland in the County is in the ownership of these private citizens, there is also some degree of confidence that the land will remain in agricultural production rather than succumbing to development pressure. So, while land isn’t being definitively protected, it likewise is not being developed.
In 2012, the Maryland General Assembly passed Senate Bill 236, the Sustainable Growth and Agricultural Preservation Act of 2012, commonly known as the Septic Bill. This legislation encourages Counties to develop strict land use standards relating to the installation of private on-site sewerage disposal systems (aka septic systems). The legislation essentially directs counties across the State to adhere to a 4-tier mapping system outlined in the State law to regulate the installation of new sewerage facilities.
The State law does not require a County to adopt what is being termed as a tier map. However, Counties that choose not to adopt a septic tier map are prohibited from approving new major subdivisions that would use private on-site sewerage disposal systems. Contained within this plan under the Water Resources Element, the septic tiers map and analysis has been performed and delineated.
While the adoption of a septic tiers map does create some additional availability for development, the overall effect of this law in Washington County is essentially a de facto downzoning that may have some repercussions on land preservation efforts in the County. The reduction in permitted development rights creates two potential challenges. First, the reduced number of development rights can deter farmers from participating in land preservation programs because of potential loss of development rights for immediate family members. Under the MALPF program, a property owner could retain a certain number of rights for family members and still have enough rights remaining based on local zoning regulations that would make selling an easement a reasonable concession to a property owner. With the inception of the Septic Bill, immediate family member lots count toward the overall maximum and therefore has a greater impact on easement value. Some landowners may perceive this as too restrictive or unpredictable for future estate planning.
The other potential impact from this law on land preservation programs is related to land easement values. With development rights further restricted by the requirements of the Septic Bill, the value of the overall easement can be diminished. Fewer development rights permitted means fewer development rights purchased. Another side effect of a limited supply of development rights available in rural areas is that the demand for such lots will likely elevate the value of development lots. At some point the supply vs. demand ratio of rural development lots will elevate the value of lots to the point where development will be more lucrative than easement values for the overall farm. Not enough time has elapsed since the inception of this law to fully understand these types of financial impacts, but the County will need to closely monitor this balance to stay competitive with land preservation.
Just as farmers are seeking out alternative agricultural uses to supplement income, other nonagricultural uses are also being sought out because they are becoming more accessible and profitable than traditional agricultural land use. Uses such as commercial communication towers (aka cell towers), solar energy generating systems (SEGS), and wind energy generating systems are a new wave of non-agricultural uses that can consume large areas of land currently used as productive agricultural land in the County.
Large solar energy generating systems are of primary concern especially as it relates to consumption of productive cropland. Cell towers and wind turbine facilities can also have a negative effect on agricultural operations by using up productive farmland for their facilities, however, they typically have a lower impact than SEGS. Cell towers and wind turbines have a smaller footprint (typically less than one half acre) per tower or turbine and the necessitated height of these uses allows ample area for farming equipment to still operate on the land and to allow enough light penetration for vegetative growth.
SEGS, however, are not conducive to crop cultivation or harvest. Typically, the solar arrays are less than 10 feet tall and block a significant amount of sunlight from reaching the ground thereby reducing productivity of most crops. The panels are also too low to the ground to allow for easy access for harvest.
While SEGS can have a negative impact by reducing productive cropland in the County, they do appear to be more compatible with pasture operations. Rocky terrain generally associated with the karst topography of the region already limits the ability of some areas of the County to have viable cropland. Most farms already use these rocky areas as pastureland for livestock grazing. This could provide a unique opportunity for Washington County farmers to potentially integrate SEGS into existing farming operations by locating the solar areas within pasture lands, planting feed grasses under the panels, and opening the areas for livestock grazing.
Legislation regarding the location and implementation of renewable energy sources such as wind and solar have recently been debated in the Maryland General Assembly. The debate revolves around governmental jurisdiction as it relates to how these uses are regulated. Recent court cases around the State have deemed the Public Service Commission as the legislative authority over these types of uses. In order to preserve some local input on these issues, legislation has been passed to require the PSC to consult with local jurisdictions on potential applications and must consider testimony given as part of their decision.
In Washington County, amendments have been made to the Zoning Ordinance to provide opportunities for renewable energy uses to be located within appropriate areas. Currently, solar arrays are permitted in Industrial Districts and a special exception use in rural area districts. While permitted as a special exception use in rural areas, these uses have also been prohibited from designated preservation areas such as Priority Preservation Areas and Rural Legacy Areas. The only exception of this prohibition would be the establishment of solar facilities in PPA’s on land that is currently zoned Industrial Mineral.
Great effort was made to analyze which areas of the County should be delineated as a high priority for land preservation because of agricultural productivity. Because the State and County have put forth millions of dollars and other resources into land preservation to reduce large scale residential development in these areas, it was a logical progression to prohibit uses that would inhibit or prevent agricultural production. By being selective and prioritizing agricultural resources, this also provides flexibility to landowners outside of these areas who may not have access to funding opportunities for preservation, to gain another source of income. Additional protections against intrusion of these facilities into prime farmlands include a requirement for solar facilities to be located on lands not designated as prime soils to the greatest extent possible.
Another new niche industry creating challenges to land preservation efforts are rural based event centers. These typically take the shape of converted barns or temporary tents on farms and large lots to accommodate events such as weddings, festivals, and large-scale recreational activities. These activities are blurring the lines between a commercial element that is directly related to agricultural activities that occur on the farm and those that simply take advantage of the view.
The installation of uses that manufacture value added products or sell items produced on the farm such as wineries, creameries, or farm stands have a direct link to the agricultural production of the land. Event centers do not have the same inherent link. While they do show off the beauty and scenic value of the land, it does not directly support agricultural production. The loss of this direct link to agricultural production is of specific concern to land preservation efforts. It begs the question, are we protecting the land for scenic value or to promote a viable agricultural industry?
Washington County is not the only jurisdiction to grapple with this issue. Other rural counties as well as the State have been weighing the same balance between maintaining a viable agricultural base while also reaping the benefits of these types of agricultural tourism uses. Recently, MALPF included event centers as a permitted commercial use on permanently preserved easements. This decision has led to some controversy at a local level. While MALPF allows such uses, the Washington County Agricultural Advisory Committee does not support this conclusion. The belief is that public tax dollars were used to protect the agricultural operations and viability of the land not for commercial profitability. As this issue continues to evolve, the County will need to further evaluate its effects on local land preservation efforts.
At the inception of the County Land Preservation program, a collaborative effort between the County, the University of Maryland and the Agricultural Extension Service was initialized to help the County produce a minimum acreage goal for land preservation efforts. It was determined at that time that 50,000 acres of active agricultural land was the threshold for critical land mass needed to keep agricultural operations viable. This goal was developed in coordination with Staff from local planning agencies, State planning agencies, and the Soil Conservation District. The calculations and assumptions made were analyzed in a manner to determine the minimum acreage of active agriculture needed to produce sustainable levels of agricultural products and to support the County’s many agricultural services.
Now that the County has preserved a little over 60% of our initial goal of 50,000 acres of active agricultural land, it seems appropriate to re-evaluate the County’s goals for easement acquisition and determine what future efforts could take place to continue supporting agriculture as a viable economic sector. While the methodology used to determine the initial preservation goal is unknown, new research was completed in 2002 through a grant by the Maryland Center for Agro-Ecology Inc. to study and evaluate the critical mass theory. In the self-explanatory title “Is There a Critical Mass of Agricultural Land Needed to Sustain an Agricultural Economy?: Evidence from Six Mid-Atlantic States”, Janet Carpenter and Lori Lynch from the University of Maryland postulate the relevance of the critical mass theory.
Synthesized to its finest point the question posed is, at what point does loss of farmland create a collapse in the overall agricultural economic sector? The answer is, it depends. What is clear from the study is that critical mass is not just a number. It is a mixture of variables and policies such as available prime farmland, consumer preferences, land use polices, and environment that interact with one another and forces farmers to adapt to changes through time. The study included 110 counties in six States and examined the rate of farmland lost over a nearly 50-year period between 1949 and 1997. Their findings were that the critical mass threshold in terms of harvested acres per County was 189,420 acres. They also found that counties that had a total of 150,000 acres or less of farmland were also susceptible to higher rates of farmland loss. However, that trend was not consistent over the entire 50year period. They also found that between 1978 and 1997, the level of harvested cropland acres no longer had an impact on the rate of farmland loss. They theorize this pattern of farmland loss changed for two reasons, implementation of preferential taxation programs for agriculture and changes in technology, policies and trade patterns.

Just as with many other sectors of business, the agricultural economy is evolving, adapting, and changing from traditional business models. Changes in technology, transportation, land management policies, genetics, and even public perception have forced agricultural operations across the country to move away from traditional forms of agricultural operations. In their study about critical mass, Carpenter and Lynch wrote, “Changes in the last 25 years have apparently altered the impact of this critical mass variable. Thus while the initial results indicated that once a county dropped below the critical mass threshold that agriculture was doomed, we find that the rate of farmland loss has actually slowed. We hypothesize that farmers have shifted to alternative crops, have found alternative marketing mechanisms (such as direct marketing rather than depending on processing plants), or have begun using alternative purchasing channels such as the Internet or using delivery services to obtain their input needs.”1
Assuming a similar average of easement acquisition over the next twenty years (2020-2040) that has occurred in the last twenty years (2000-2020), it is projected that we could potentially preserve about 20,000 acres of additional active agricultural farmland. Added to our existing 38,000 acres +/- of existing preserved land puts the County just over our current 50,000-acre goal. So, the question now becomes, is this enough to support long term sustainability in the agricultural sector.
As stated in the previous section, the amount of active farmland being reported in the County seems to have plateaued over the last 25 years at an average of 120,000 acres. This stabilization, after decades of decline, appears to be a positive indicator that the agricultural industry has found some economic balance. Assuming this average remains steady for the next 20 years and that we achieve our goal of 50,000 acres of preserved land, that would equate to a little over 40% of the total active farmland in the County being permanently preserved. While this would be a remarkable milestone to achieve, it also leaves a large portion of active farmland unprotected. It seems evident that this issue will need further in-depth study.

In addition to traditional agricultural commodities, Washington County is host to a significant amount of forest resources. According to a detailed land use-land cover analysis completed by County GIS Staff in 2011, there are approximately 131,600 acres of forest land in Washington County. This is the largest land use in the County and includes deciduous, coniferous, and mixed forest areas.
Forestland serves multiple purposes in the County: it is a viable economic resource with millions of board-feet of timber being harvested yearly; it is a valuable recreational resource as many parks and trails in the County utilize woodland as cover; and it is an environmental resource, providing habitat for wildlife, carbon sequestration that traps carbon dioxide to reduce buildup in the atmosphere, and positively contributing to the health and quality of the County’s waterways.

Forest Inventory
Forest Location and Composition
At one time, most of Washington County was covered with hardwood forests. The limestone bedrock areas of the valley had significant forests that included Oak, Hickory, Beech, Ash, and Basswood. Today, the major forested areas are located in the mountainous areas of the County including the Blue Ridge (South Mountain) area to the east, the Elk Ridge and Red Hill areas in the south, and the Ridge and Valley system (Fairview Mountain and Sideling Hill) in the west. There are additional forested areas located in the Hagerstown Valley, primarily where the land is too rocky or steep for development or farming. Bottomland forests are found along the fertile floodplains of streams such as Conococheague and Antietam Creeks, and along the Potomac River (see map on following page).
Source: Maryland Department of Natural Resources
According to U.S. Forest Service and Maryland Forest Service data, most of the forested area in the County consists of Oak-Hickory type (79%). Remaining forested areas are classified as Oak/Pine (6%), White/Red/Jack Pine (8%), and other northern hardwoods (6%). While the composition of forest areas in Washington County has stayed rather consistent, several pests and diseases have impacted specific species groups over time. Examples of pests that have impacted forest resources in Washington County include gypsy moth, emerald ash borer, and the hemlock woolly adelgid.
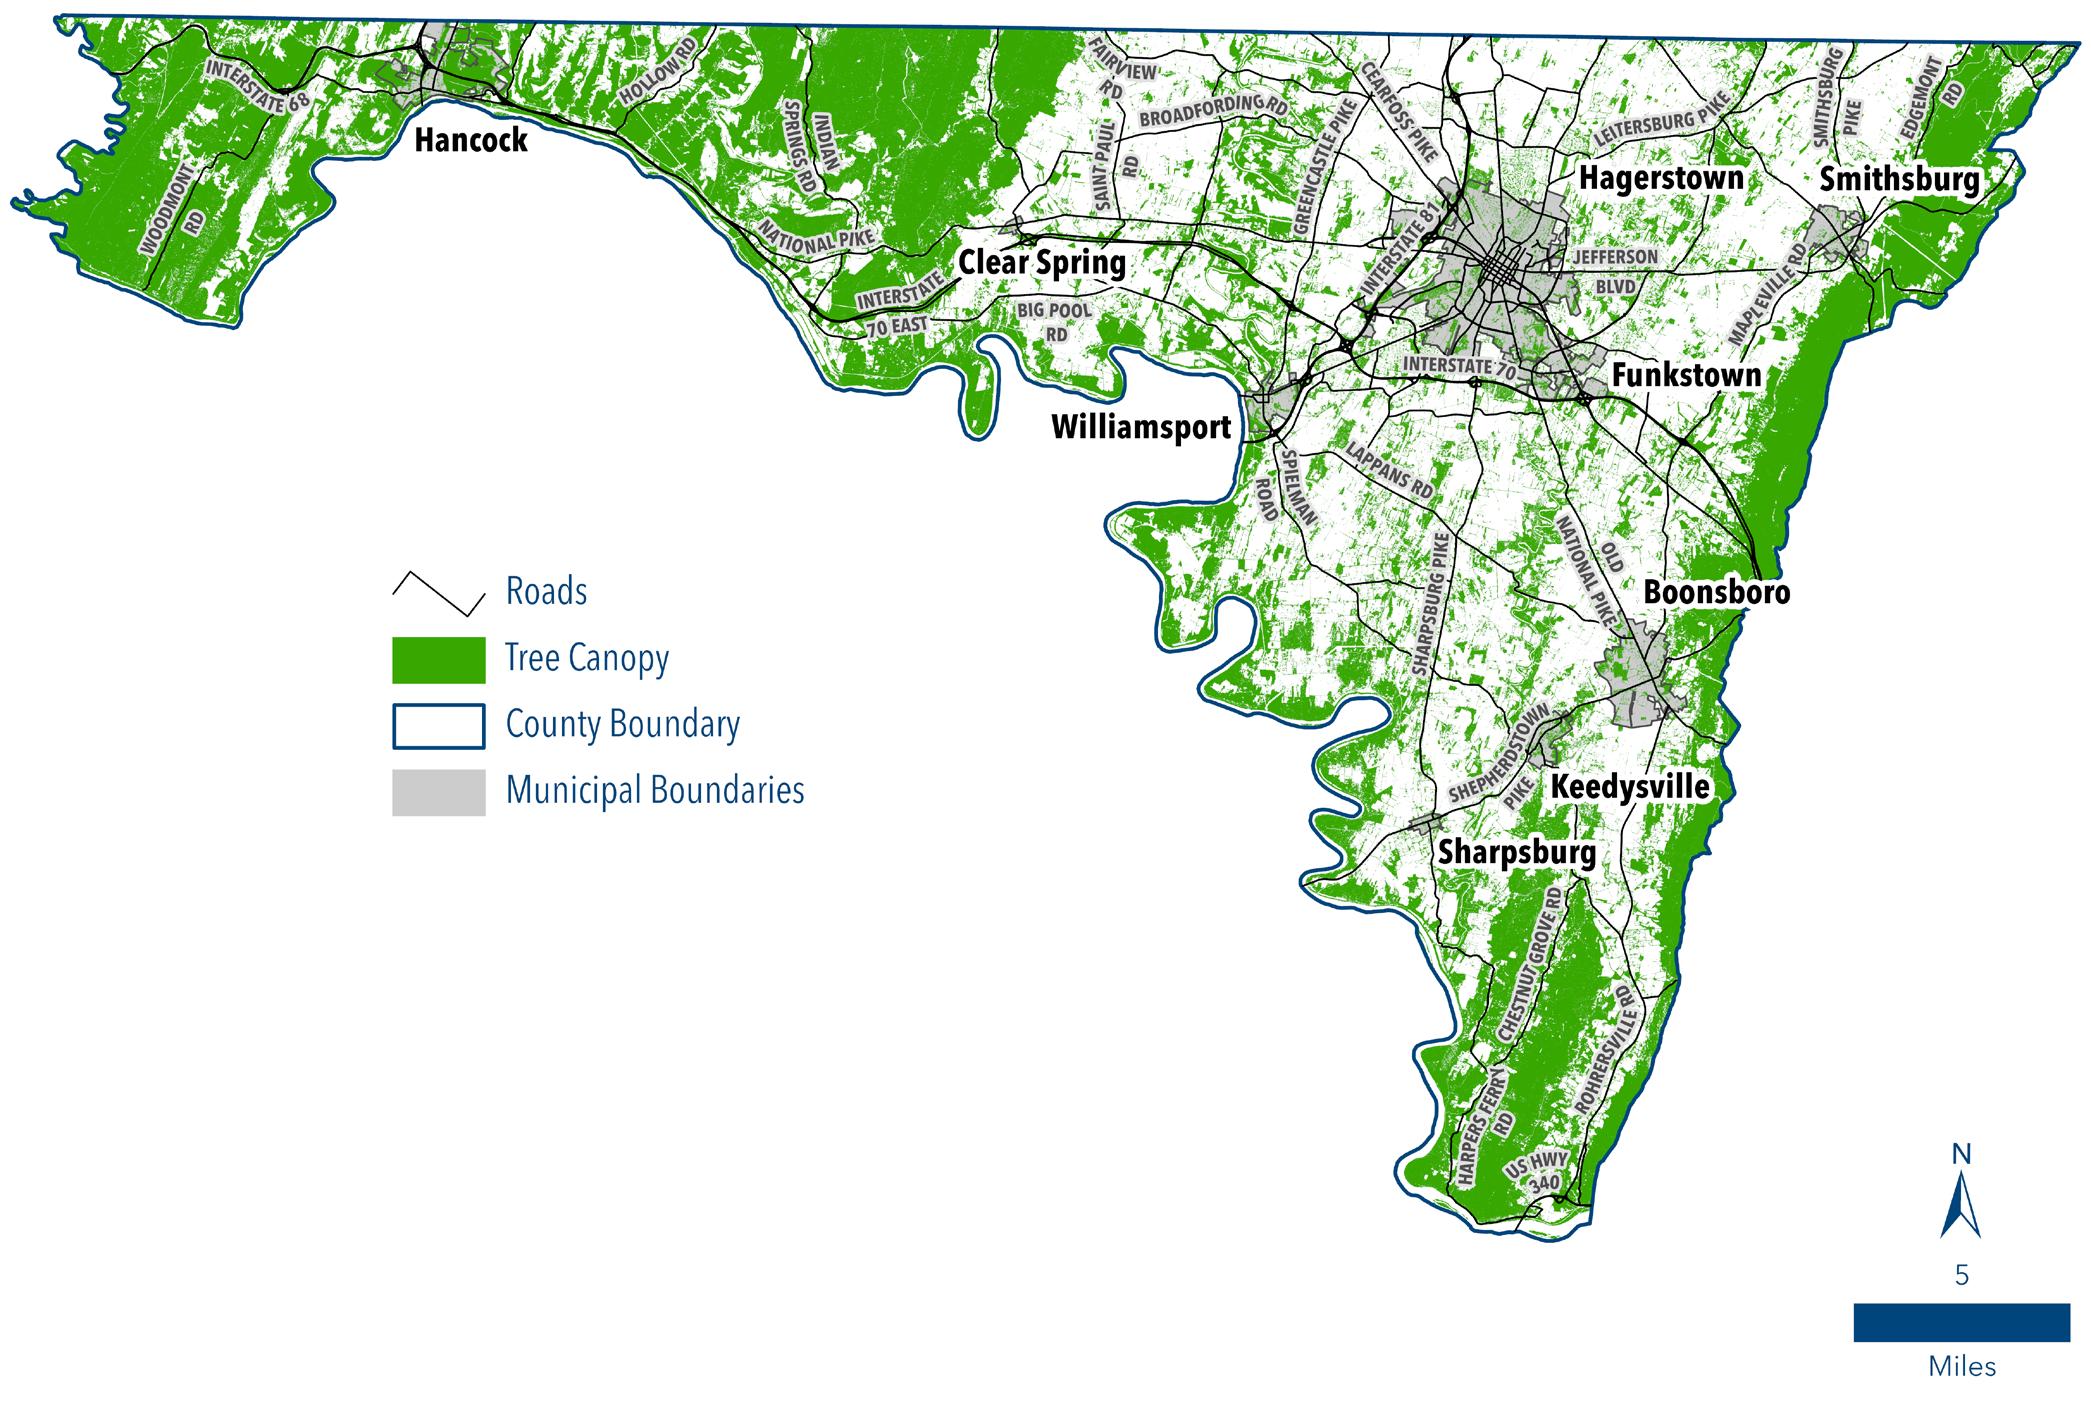
While trees and forested areas are typically viewed in terms of their aesthetic value, the environmental values are often overlooked or taken for granted. Forested areas are critical in providing clean air and water that are essential to all life. They also provide protection and relief from the sun during summer months. These functions are served by different types of forested areas as outlined below.
Riparian Forests
Riparian forests are identified as those forested areas located adjacent to water features such as streams, rivers, lakes, wetlands, etc. These areas are prone to frequent flooding and inundation so only specific types of trees will typically grow in these areas. Their proximity to flowing water systems such as rivers and streams give stability to banks and help reduce erosion and sedimentation. These areas also act as transitional zones for aquatic and terrestrial habitats and provide shade to help reduce water temperatures.
Riparian forest buffers also play a critical role in the regional maintenance of water quality as outlined in the County Watershed Implementation Plan (WIP). Use of various funding mechanisms from Federal, State, and local resources have bolstered Washington County’s Clean County initiative which includes tree planting and stream restoration projects. More detailed information regarding the benefits of riparian stream buffers is contained within the Sensitive Areas Element.

Urban Forests
While the term “urban forest” may seem counterintuitive, forests within urbanized areas play an equally important role in overall environmental health. Urban forests can take many forms including park areas, street trees, landscaped boulevards, greenways, etc. Because nearly 80% of Americans live in urbanized areas the function of urban forests plays a critical role in the health of our citizens.
These areas serve to provide stormwater management controls, air and water filtration, and provide shade and reduce urban heat islands that can also result in energy conservation. They provide habitat for many animals including rabbits, squirrels, and inland bird species. They also provide areas to recreate and congregate.
The County has recently begun to incorporate the principles of urban forests into forest conservation mitigation efforts by including street trees as a permissible method of mitigation. Further efforts should be made to incorporate opportunities for the establishment of urban forests as part of our forest management plans.

Timberlands
Timberlands are a description of forested areas that are suitable for commercial harvest. They are defined as areas capable of producing wood at more than 20 cubic feet (ft3) per acre. Products from timberland can vary depending upon the type of trees being harvested. Generally, harvested timber is categorized into two categories; hardwoods (trees that have broad leaves and mostly deciduous) and softwoods (trees that have needles and are evergreen).
Washington County contains mostly hardwood forests that support production of construction lumber, pole timbers, furniture, and flooring. According to the Maryland Forest Service, an estimated 574,216 cubic feet of hardwoods were harvested in Washington County in 2016

A forest is a complex web of relationships between plants, animals, fungi and other organisms. When intact and healthy, they purify our air and water, provide important economic products, and provide space for recreational activities. Therefore, as the County continues to urbanize, it is important to recognize not just the loss of forest resources but the effects of fragmentation. Fragmentation of existing forest; i.e., the decreasing size of forest lots and their isolation from larger tracts of forest land, make it difficult to maintain healthy forest populations. Isolated islands of forest cover have higher mortality rates, fewer environmental benefits, and little economic value. Increasing tree canopy in more densely developed areas helps to mitigate pollution from stormwater runoff, improve air quality, reduce the urban heat island effect, and reduce thermal pollution to streams and rivers. Additional research into fragmentation of forested areas should be completed and strategies adapted into existing forest conservation best management practices.
Threats from pests, disease and invasive insect and flora species on forest resources is a constant threat that has no regard for jurisdictional boundaries. To help manage these threats, the Maryland Department of Agriculture, Department of Natural Resources, and US Forest Service partner in the Cooperative Forest Health Program. Together these agencies work to monitor, study, and evaluate potential threats and spread of pests and diseases.
There are several invasive insect pests that are having harmful effects on the health of forest resources in the County including the gypsy moth, emerald ash borer, spotted lantern fly, hemlock wooly adelgid, and walnut twig beetle. These insects have varying methods of injury such as defoliation, bark boring, or root damage.

Invasive plant species can also have devastating effects on native forest resources. Invasive species are those characterized as being able to spread quickly and displace native plant resources and include common plants such as honeysuckle, thistle, dandelion, ivy, morning glory and bamboo. There can also be a noxious component to such invasive plants that can be harmful to not just forest resources but also humans and animals. Examples include poison ivy and poison oak that lead to allergic reactions in some humans resulting in blistering, itchy rashes and Johnson Grass which can be lethal for cattle.
The County’s Forest Conservation Ordinance provides guidance and direction to properly maintain forest resources including the management of pest, disease and invasive species encroachment. The County should continue to monitor long term forest protection easements to help ensure proper maintenance of these resources.
Animal grazing in forested areas is a common strategy used by livestock owners to expand their pasture needs and provide some protection of the animals from the elements. It has been a long-standing policy to deter livestock owners from allowing forest grazing activities. Grazing activity has led to detrimental effects on forested areas such as soil compaction, erosion, damage to saplings and understory, and in some cases stream degradation.
To make forest grazing a manageable activity there is a lot of investment required both in time and money. Landowners would need to carefully manage the rotation of livestock to prevent overgrazing through strategies such as:
• Establishing watering systems and mineral resource areas to help direct the movement of herds;
• Incorporate rest periods into the grazing management plan so that livestock do not overgraze and allow enough seedling stock for the forest areas to recuperate;

• Install fencing to protect sensitive areas such as stream buffers;
• Avoid grazing during spring and fall cycles to allow forage maturity and recuperation; and
• Monitor and potentially thin forested areas to allow the proper amount of sunlight to reach the forest floor so that foraging plants may grow.
Animal grazing in Washington County is typically not recommended as a sustainable agricultural activity. The forest types and sizes in our area are not typically conducive to the management techniques needed to balance forest grazing activities. As stated in previous sections, the primary forest type in the County is Oak/Hickory stands. These species of trees typically have broad canopies that do not allow for a substantial amount of undergrowth that would characteristically be needed for large herds of livestock. In addition, the primary locations of larger stands of forested areas are in the mountainous areas of the County to the east and west, and along flowing waterways. Neither of these areas are conducive to grazing for large herds of livestock.
Long term analysis of forest land in the State of Maryland has shown a steady decline in the total forested area of the State. Since the early 1960s, it is estimated that over 450,000 acres of forest have been lost across the State. Comparatively, the western region of the State (consisting of Allegany, Garrett, Washington and Frederick Counties), has been consistent in management of forested areas and have a net gain in forest cover both short and long term. In order to stop and eventually reverse the trend of forest loss across the State, two key pieces of legislation have been passed by the Maryland General Assembly over the last two decades to address this issue. First was the Maryland Forest Conservation Act passed in 1991. The purpose of the law was to “minimize the loss of Maryland’s forest resources during land development by making the identification and protection of forests and other sensitive areas an integral part of the site planning process”1. The Act required that all Counties in the State with less than 200,000 acres of forest cover adopt an ordinance to address the issue of forest conservation through identification and protection of existing forest, and establishment of new forest.
The second key piece of legislation passed was the Maryland Forest Preservation Act of 2013. This legislation builds upon the existing rules established in the Forest Conservation Act. The primary inclusion to the existing Act was to mandate that there be no net loss in the existing 40% of forest canopy across the State. To further incentivize the program, the new regulations also included an expansion of tax credits to Marylanders who help increase tree canopy on their own properties.
In February of 1993, in accordance with newly adopted State legislation, the Forest Conservation Ordinance (FCO) for Washington County was adopted. Under this Ordinance, any person seeking subdivision of land or applying for a grading or sediment erosion control permit on areas 40,000 square feet or greater are required to comply with the Ordinance. There are some specific exemptions included in the law such as real estate transfers with no change in land use, family member lots, selective timber harvests, etc.
The implementation of the Forest Conservation Program has had a positive impact on forest resources in the County. According to the Maryland Department of Natural Resources and the Maryland Forest Service, Washington County has increased forest land by nearly 5,000 acres in the seven years between 2008 and 2015. To help build on the effectiveness of this notable achievement, further attention needs to be given to the location and functional importance of forested areas in the County.
When mitigation is needed, the FCO establishes a preferred sequence of mitigation techniques that developers and consultants are directed to use when planning for new development. The highest priority of mitigation is to limit the amount of tree disturbance on the site and retain any existing resources. If there are no forest resources on site, the highest priority of mitigation would be to plant forest. On-site mitigation helps offset the environmental impacts of development such as water quality and urban heat island effects.
If on-site remediation is not possible, the next highest priority is to either retain or plant forest on an offsite location in the same watershed. Keeping remediation in the same watershed can still help mitigate for some of the impacts of development with regard to water quality specifically. Offsite mitigation is typically mitigated between the developer and another property owner seeking to preserve their forest resource. The County has also recently implemented a forest bank program to help streamline these efforts between property owners. Further discussion of the banking program is outlined later in this section. The least preferred method of mitigation on the list of techniques is a payment-in-lieu (PIL) of planting option. To use this method of mitigation, the land developer must prove that all other methods listed in the preferred sequence of techniques have been exhausted. Further discussion of this mitigation method is outlined below.
Forest retention and planting on-site are the most common methods of mitigation used in the County particularly for residential development. Commercial and industrial development also have a history of using these methods but have come to favor the payment-in-lieu of on-site mitigation. To help improve the effectiveness of the program and better guide the County in implementing the Forest Conservation Program, there is interest in completing a tree canopy analysis to establish a baseline of forest inventory and its location. Some work has been done in the past using aerial photography and detailed land use analyses, but a more focused analysis would be beneficial. Once the inventory is complete, the County can delineate priority areas for forest cover in sensitive areas such as streams, floodplains, and steep slopes. Further incentives and regulatory streamlining could also be investigated to better target areas for priority resource location.
The County, in cooperation with the Washington County Soil Conservation District, has successfully developed a program where fees collected in lieu of on-site mitigation are used for easement purchases throughout the County with emphasis in acquisition of locations in environmentally sensitive areas. The collected funds provide the opportunity and flexibility for the County to help implement the objectives of the Forest Conservation Ordinance. To ensure proper use of the funding, the WCSCD and County Planning Department developed a priority ranking process. Included in the ranking are priorities for locating PIL funded easements in areas with existing sensitive area such as floodplains and stream buffers, areas that will create a greater contiguous forested area and reduce fragmentation, and that have good forest management techniques such as control over invasive species.
Since 1994, the County has collected over $2.4 million in forest conservation funds to mitigate for nearly 480 acres of forest needed to comply with the Forest Conservation Act. In August 2017, the State of Maryland passed new legislation tripling the mitigation fee from $0.10 per square foot of mitigation needed to $0.30 per square foot for mitigation in Priority Funding Areas (PFAs) and $0.36 per square foot for mitigation outside of PFAs. As the economy continues to rebound, the County would expect slightly higher fund balances as a result. To date, the WCSCD has spent over $1.9 million in funds on 21 projects that have resulted in 315.6 acres of new forest plantings and conservation of 572.95 acres of existing forest for a total of 888.55 acres being permanently protected by easements. These results far exceed the nearly 480 acres required to be mitigated by the funding collected in the Forest Conservation Fund by Washington County.
Chart 11-3: Forest Acres Preserved vs Acres Required (1994-2018)
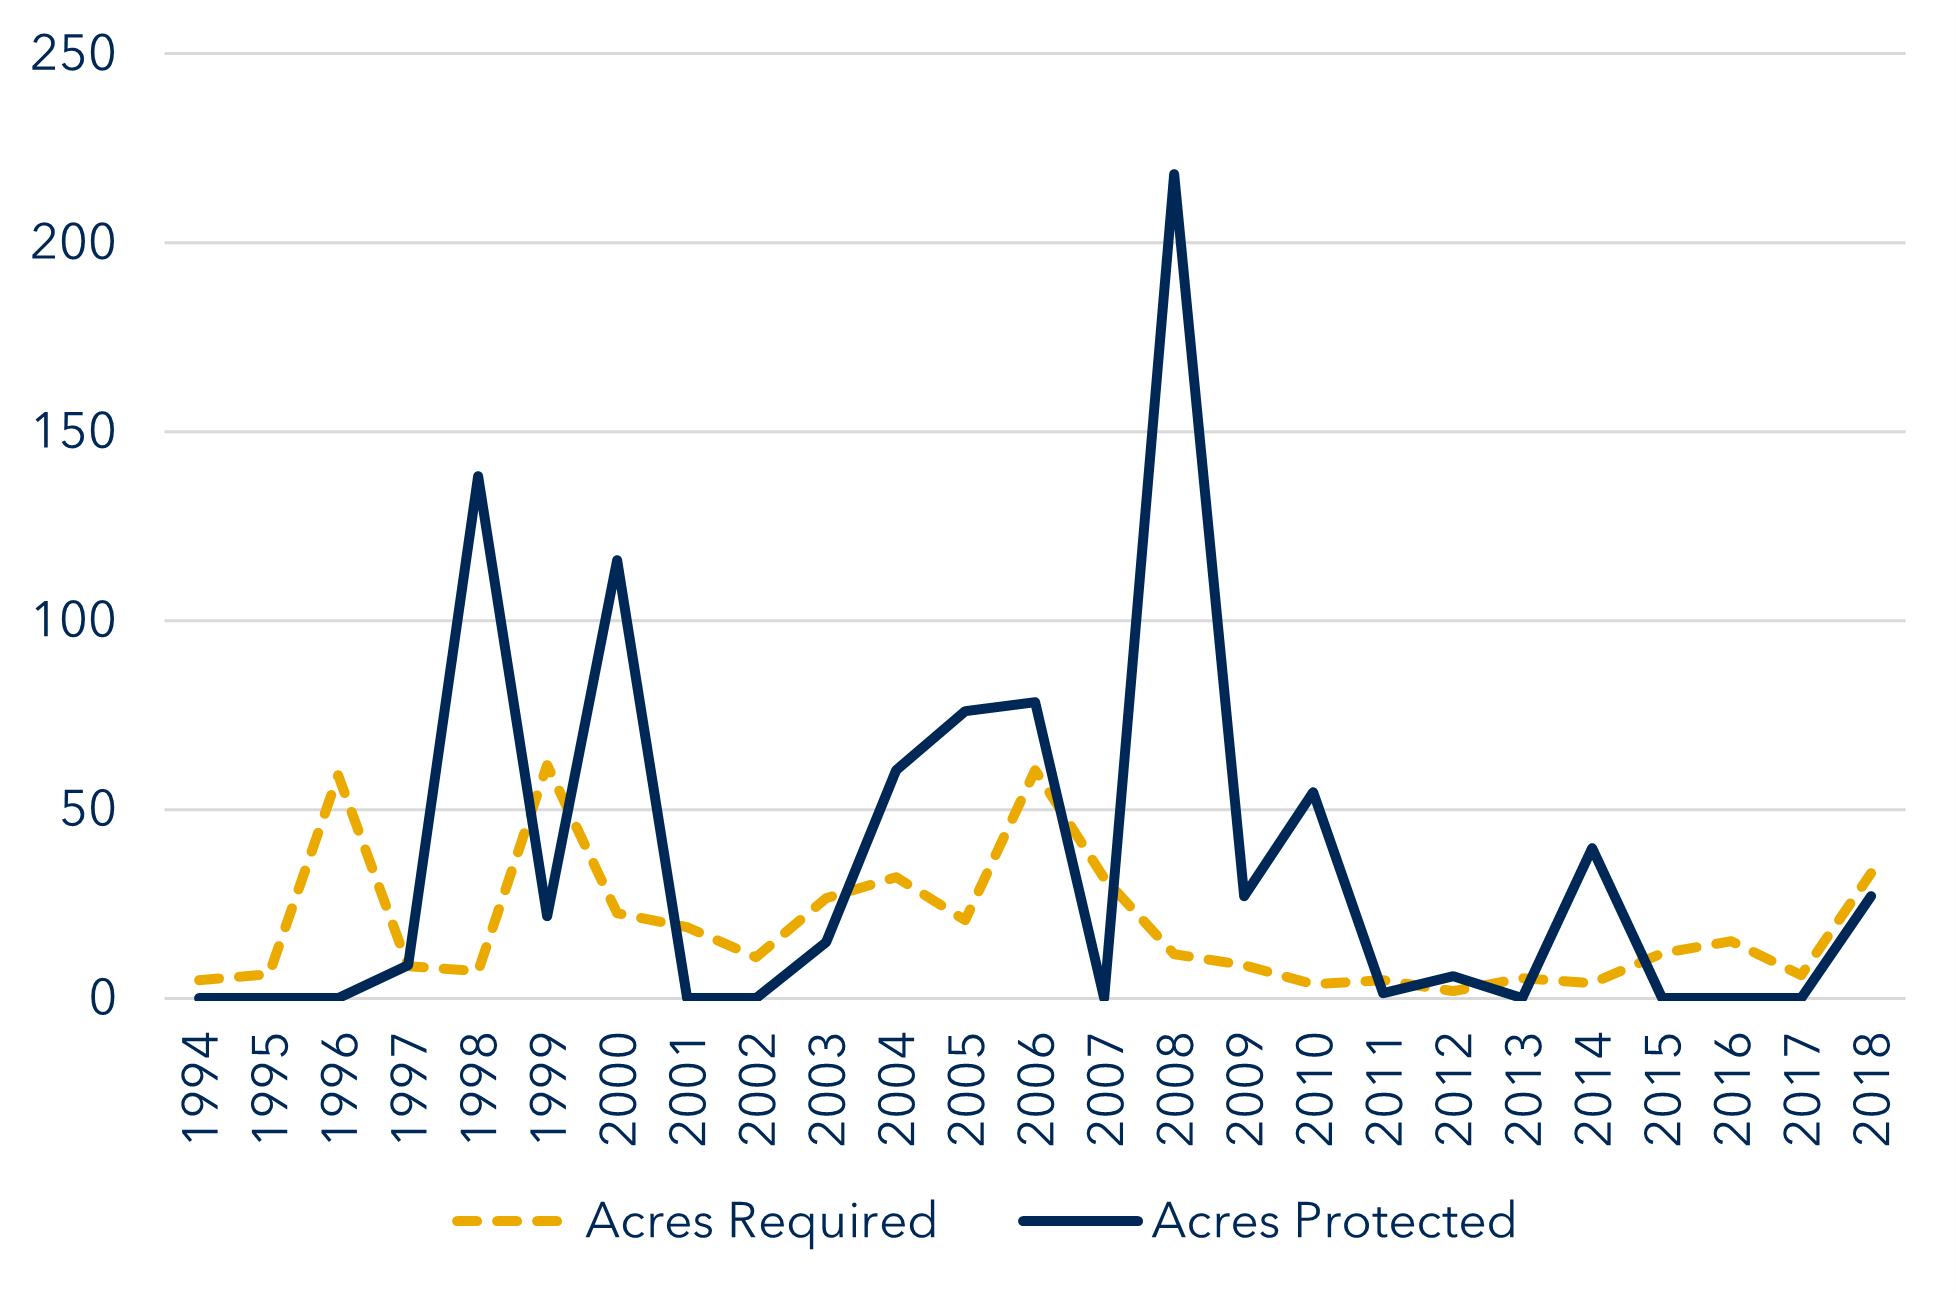
A newer mitigation method added to the County Forest Conservation Ordinance in 2015 is the forest banking program. The purpose of the banking program is to establish long term forested easements in priority areas that can be intermittently used by multiple development projects. One of the primary objectives of the program is to work in harmony with other programs with similar goals such as land preservation and targeted sensitive areas. Using the banking program will help build larger blocks of protected lands for both agricultural and environmental benefits.
The program works similarly to, but not exactly like, a purchase of development rights program seen in land preservation programs. In a PDR program, the property owner agrees to extinguish development rights on their land in return for payment from the County for those rights. In the forest banking program, the property owner also establishes a long-term protective easement on their property that limits development and associated activities within the easement. However, instead of the County paying the property owner for the easement, developers in need of forested area to mitigate for projects elsewhere in the County pay the property owner to use the forest easement for their mitigation.
Recent changes in legislation have restricted the use of forest banking projects to only be associated with afforestation projects. Previously, banks were permitted to be established on existing forest resources, however, current regulations now only permit establishment of banks on newly planted forest resources. To date, this program has not gained much traction, but promotion of this program is continuing to increase.

Ì Continue to work toward the established County goal of preserving at least 50,000 acres of active agricultural land by:
• Further emphasizing preservation of large continuous blocks of permanent farmland containing 1,000 or more acres by including this variable in the priority ranking system;
• Encourage diversification of farm products including value-added products;
• Encourage and support young and/or new farm operators through easement/loan programs such as the Next Generation Farmers program.
Ì Continue to monitor the overall status of active agricultural land for stability and to determine if additional acreage goals are needed to help maintain critical mass.
Ì Continue efforts to seek out permanent funding sources that sustain agricultural easement and development rights acquisition.
Ì Implement strategies to deter uses that remove large blocks of prime agricultural land out of active production (i.e. solar energy generating facilities)
Ì Monitor, evaluate, and where necessary amend regulatory ordinances such as the Zoning Ordinance to include emerging agri-business and agri-tourism opportunities.
Ì Work with the local Soil Conservation District to promote and implement best management practices in farming operations.
Ì Continue to monitor and, where applicable, adjust targeted preservation areas such as Priority Preservation Areas and Rural Legacy areas to best achieve long term preservation goals.
Ì Consider permitting overlapping land preservation easements where easements protect different natural resources.
Ì Investigate investment in infrastructure such as bridge/culvert widening or pull off areas to help accommodate the requirements of larger farm equipment.
Ì Work with MD DNR to complete a tree canopy survey for Washington County. This will establish a baseline of existing resources that can be used to formulate additional goals, such as targeted canopy cover.
Ì Delineate high-priority areas for tree plantings such as stream buffers, trout streams and floodplains to enhance water quality.
Ì Use State Green Infrastructure Assessment, BioNet and other programs to provide additional guidance in prioritizing forest resource conservation and implementation.
Ì Prioritize the use of payment- in- lieu of mitigation funds to retain and expand riparian forest and large contiguous forested areas.
Ì Integrate tree plantings in landscaping design standards to help reduce urban heat islands, reduce runoff and promote on-site water quality treatment.
Ì Promote local, State, and non-profit efforts to encourage private property owners to plant trees through programs such as Gift of Trees, MDers Plant Trees, Chesapeake Bay Trust grant program, and Maryland Urban and Community Forestry Committee (MUCFC) grant program.

Ì Develop a priority ranking system for the preservation of sensitive environmental, cultural and scenic resources to be targeted for preservation efforts through forest banking, the use of PIL funds and other land preservation programs.
Ì Target reforestation of undevelopable public and private land to assist TMDL, Canopy cover, SWM goals:
• Public lands (schools, parks, institutional)
• Roads (ROW, medians, planter strips, parking lots, traffic circles, cul-de-sacs)
• Private (floodplain, stream buffers, abandoned lots, industrial or reclamation lands)
Ì Evaluate the potential benefits of permitting overlapping land preservation easements where different resources are protected (i.e.-CREP contract to forest conservation), particularly those that don’t require the expenditure of state or local funds
Ì Strive during the development review process to create workable forest conservation plans that are sustainably designed to provide for community quality of life and do not constrain business expansion potential.
Ì Promote the multiple landowner benefits that can be realized from forest easements when enrolling in State programs for forest management (i.e.- an approved forest stewardship plan enables timber harvesting in a forest easement).


Sensitive Areas are environmental resources which provide integral ecological functions that are necessary for the sustainable coexistence of human and natural communities. The primary objective of the Sensitive Areas element is “to integrate environmental protection into comprehensively planned growth and economic development in Plan-designated growth areas.”1
Maryland’s Economic Growth, Resource Protection and Planning Act of 1992 required local governments to adopt a Sensitive Areas element within the framework of their Comprehensive Plans. The 1992 Planning Act named four (4) overarching categories of Sensitive Areas to be considered for protection as a part of comprehensive planning: streams and their buffers, 100year floodplains, habitats of threatened and endangered species, and steep slopes. County Subdivision and Zoning Ordinance amendments were adopted in 1996 to implement sensitive area protection for these four (4) natural resource types.
To provide further guidance to local governments in protecting sensitive environmental resources, twenty (20) additional Sensitive Areas were specified for consideration in the Maryland Department of Planning’s Models and Guidelines #18: Sensitive Areas, Volume II publication associated with the 1992 legislation. These additional categories expanded the range of environmental resources found throughout Maryland’s varied landscapes that could be considered for protection by local jurisdictions.
Accordingly, this chapter principally covers the four (4) main Sensitive Area resource types. Within these four (4) overarching categories, related sub-resource types such as forest buffers, wetlands, hydrogeomorphic features, wildlife corridors and greenways are also discussed. Some of the additional Sensitive Area types which directly affect County water resources, such as groundwater and wellhead protection areas, are discussed in passing in this chapter, but are given greater attention in the Water Resources Element of the Comprehensive Plan.
By broadly defining a range of Sensitive Areas to be examined in local long-range plans, opportunities are created to establish overlapping policies, land use controls and regulations at various levels of government that serve to ensure their long-term protection. The key for local jurisdictions is to find a balance between planned growth and the protection of sensitive environmental resources in order to achieve a sustainable form of development over time.
Streams serve many purposes in Washington County. Aside from their essential function as habitat for aquatic and riparian communities, County residents rely on their waters for many vital functions of daily life including recreational pursuits, usage as drinking water and to serve the operational needs of farms, businesses and industry. The protection of streams in Washington County is particularly important, as they are tributaries of the Potomac River, which is the primary source of water for the majority of County residents, particularly those living in urban areas.
We tend to think of streams within the confines of the channel itself, but stream health is strongly influenced by land use activities at a much wider scale. At the macro scale, overall land use patterns throughout the entire watershed have significant effects on the integrity of the waterway due to the myriad impacts of development on water quality and quantity. Individual watersheds are, of course, part of much larger drainage basins that encompass thousands of miles of land area, crossing State lines and making evident the effects of differing land use regulations on water resources. Maryland’s position at the mouth of the Chesapeake Bay further magnifies the importance of efforts to protect stream health because it receives the downstream impacts from six (6) different States that jointly encompass the approximately 64,000 square mile Chesapeake Bay Watershed.
At the same time, while stream health does depend heavily on macro scale watershed health, a large measure of protection for surface waters can be provided simply by ensuring the integrity of the stream’s adjoining natural areas – particularly floodplains, wetlands, steep slopes and riparian forests. These combined elements comprise the streamside buffer that, ideally, should be protected or restored to minimize stream damage. Each potential element within the stream buffer offers complementary and sometimes overlapping roles in achieving this protection, including:
• Floodplains where most stream wetlands are located and where energy dissipation, natural filtration, and floodwater storage occur.
• Stream banks and adjoining steep slopes that help to prevent erosion from clogging the streambed when intact and provide habitat for plants and animals.
• Streamside forests, which provide habitat, stabilize banks, provide shading, control temperatures, filter pollutants and produce leaf-litter, which supports a variety of aquatic organisms.
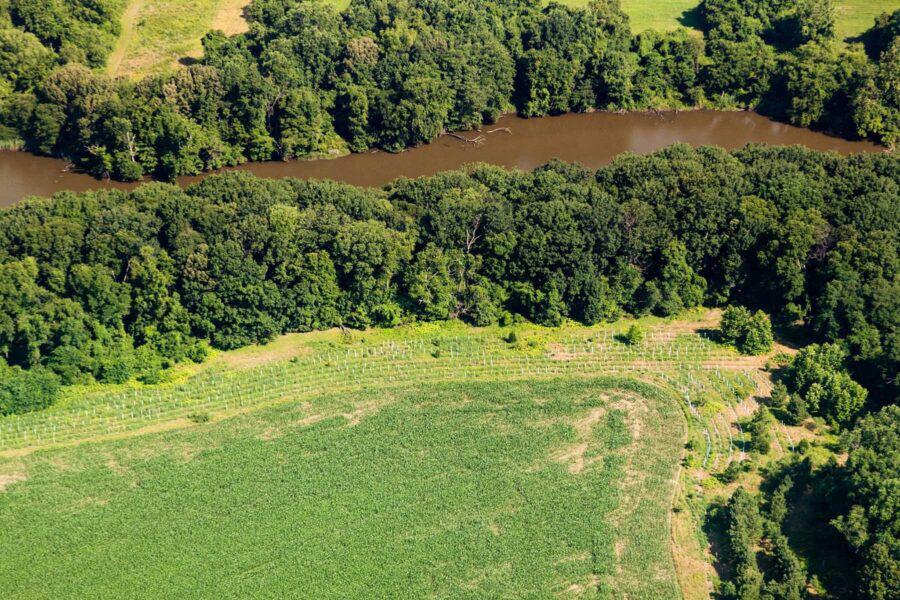
The width of an effective buffer is a complex calculation that is based on factors such as soil types, degree of slope, vegetation type and the presence of floodplains, wetlands or stormwater management (SWM) facilities. Ideally, not only should floodplains, wetlands, riparian forests, and upland steep slopes be included within the buffer, but land managers should also consider what uses should be permitted within the buffer. Some land uses, such as passive recreation or open space uses, cause little or no ground disturbance and can be permitted without additional controls. Other land uses, such as active recreational areas (e.g. - campgrounds), can be acceptable with mitigation. Still other activities, like intensive agricultural operations, are inappropriate under any circumstances within the buffer zone. The figure below shows a sample stream buffer cross section, with corresponding ecological functions and appropriate land use practices assigned to 3 specific vegetative zones within the buffer area bordering the stream.
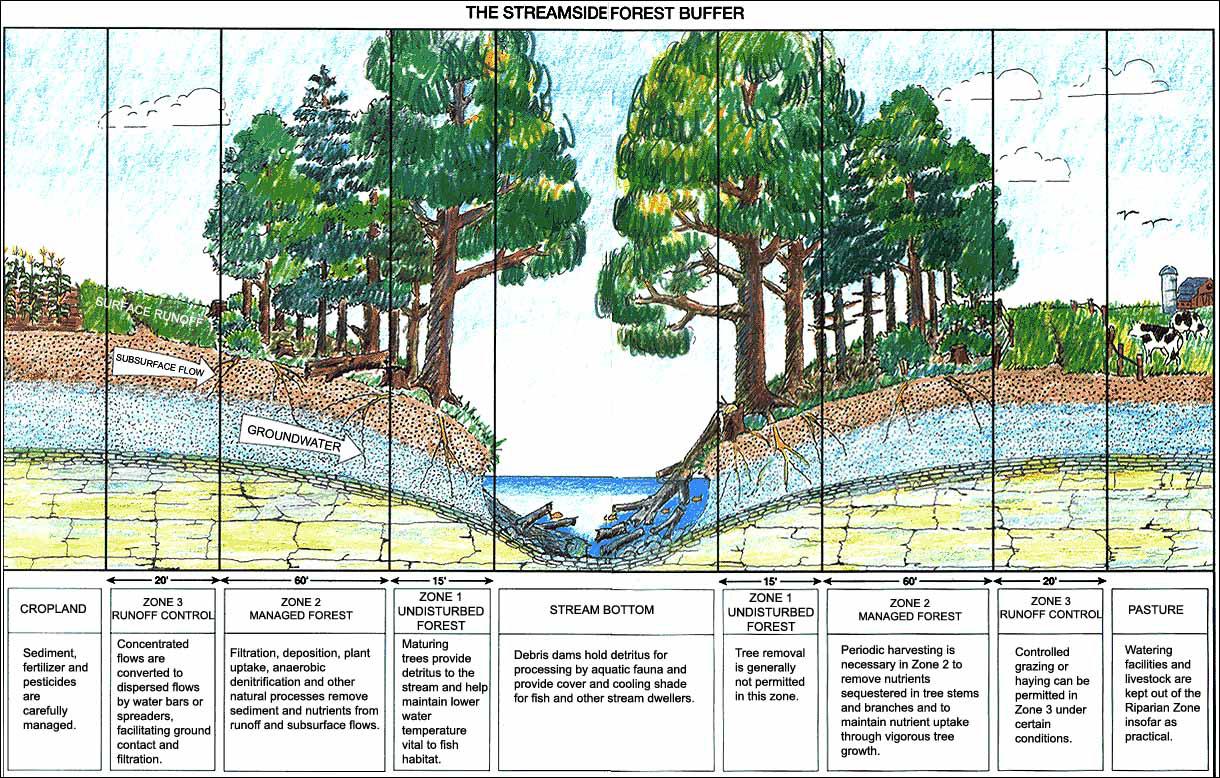
The amount of impervious surface cover in a watershed plays a large role in determining overall aquatic system health because of the cascading effects on water quality and hydrology that result from changes to the headwaters drainage basin. High amounts of impervious surface in watersheds have been shown to alter stream flows, degrade physical habitat, increase stream temperatures, speed up erosional processes, produce higher magnitude floods and result in waterways carrying higher pollutant and nutrient loads due to increased runoff and reduced ground infiltration of precipitation. As noted in the Water Resources Element, impairment of surface waters is likely to occur when greater than ten (10) percent of the total watershed acreage has been covered in impervious surface. For sensitive native species such as brook trout, populations are eliminated from streams with impervious surface coverages above four (4) percent.1
Comprehensive statewide stream surveys conducted by various Federal, State and local entities support these water quality concerns. Using biological indicators such as the health of fish and aquatic insects, the study concluded that 46% of Maryland’s non-tidal stream miles were in poor condition, 42% were rated fair, and just 12% were rated as good according to surveys conducted throughout the State between 1995 and 1997.2 Improvements in farm practices, cleaner energy sources and stream buffering have made noticeable improvements in lessening nutrient runoff and acid deposition throughout the State. The most recent surface water quality assessment reported by the State however, in 2022, found that 42.99 percent of all 1st through 4th order (which are headwater or medium sized streams) non-tidal wadable streams in MD were still found to be in non-attainment, based on both biological and conventional measures for water quality.3
A snapshot of Washington County’s current stream health, taken from the Maryland Biological Stream Survey (MBSS), echo the results of the State’s recent water quality assessment in Map 12-1. MBSS uses the same Combined Index of Biotic Integrity (CIBI) that looks at fish and aquatic health used in the 1990s stream study noted above. The numerical average generated from these two measures produces the CIBI, which classifies streams as Good, Fair or Poor. Streams have been color coded according to their health with those in red in poor condition; those in yellow are in fair condition, and streams in green classified as being in good condition.
Not all stream miles occurring in Washington County have been sampled as a part of MBSS surveys, but the Map 12-1, is a representative cross-section of County stream health between 1995 and 2020. Out of 169 collection sites sampled over this twenty-five-year period, 51% were rated as poor, 43% were judged Fair, and 6% were rated as good.
The Map 12-1, shows that, generally, streams of all health grades are distributed throughout the County. Notably however, 2 of the 4 streams in good condition are found on the western border of the County, where there is a great deal of contiguous protected land, governed by the State of Maryland in various Wildlife Management Areas.
Source: Maryland Biological Stream Survey
The importance of forested buffers as a best management practice (BMP) to improve stream health has been highlighted in the information presented above. Therefore, it is useful to examine the current status of forest buffers along Washington County streams.
Signatories of the 2014 Chesapeake Bay Watershed Agreement agreed to the goal of replanting and restoring riparian areas until 70% of riparian areas are forested watershed wide. As of 2018, 58% of Maryland’s riparian habitats were covered by tree canopy. Riparian forests are unevenly distributed throughout the State, with only one-third (33%) of counties (8) having 70% riparian forest coverage.1 Riparian buffers are most prevalent in Maryland’s western and southern regions, and lowest in the Eastern region, as detailed on Chart 12-1 on the following page.
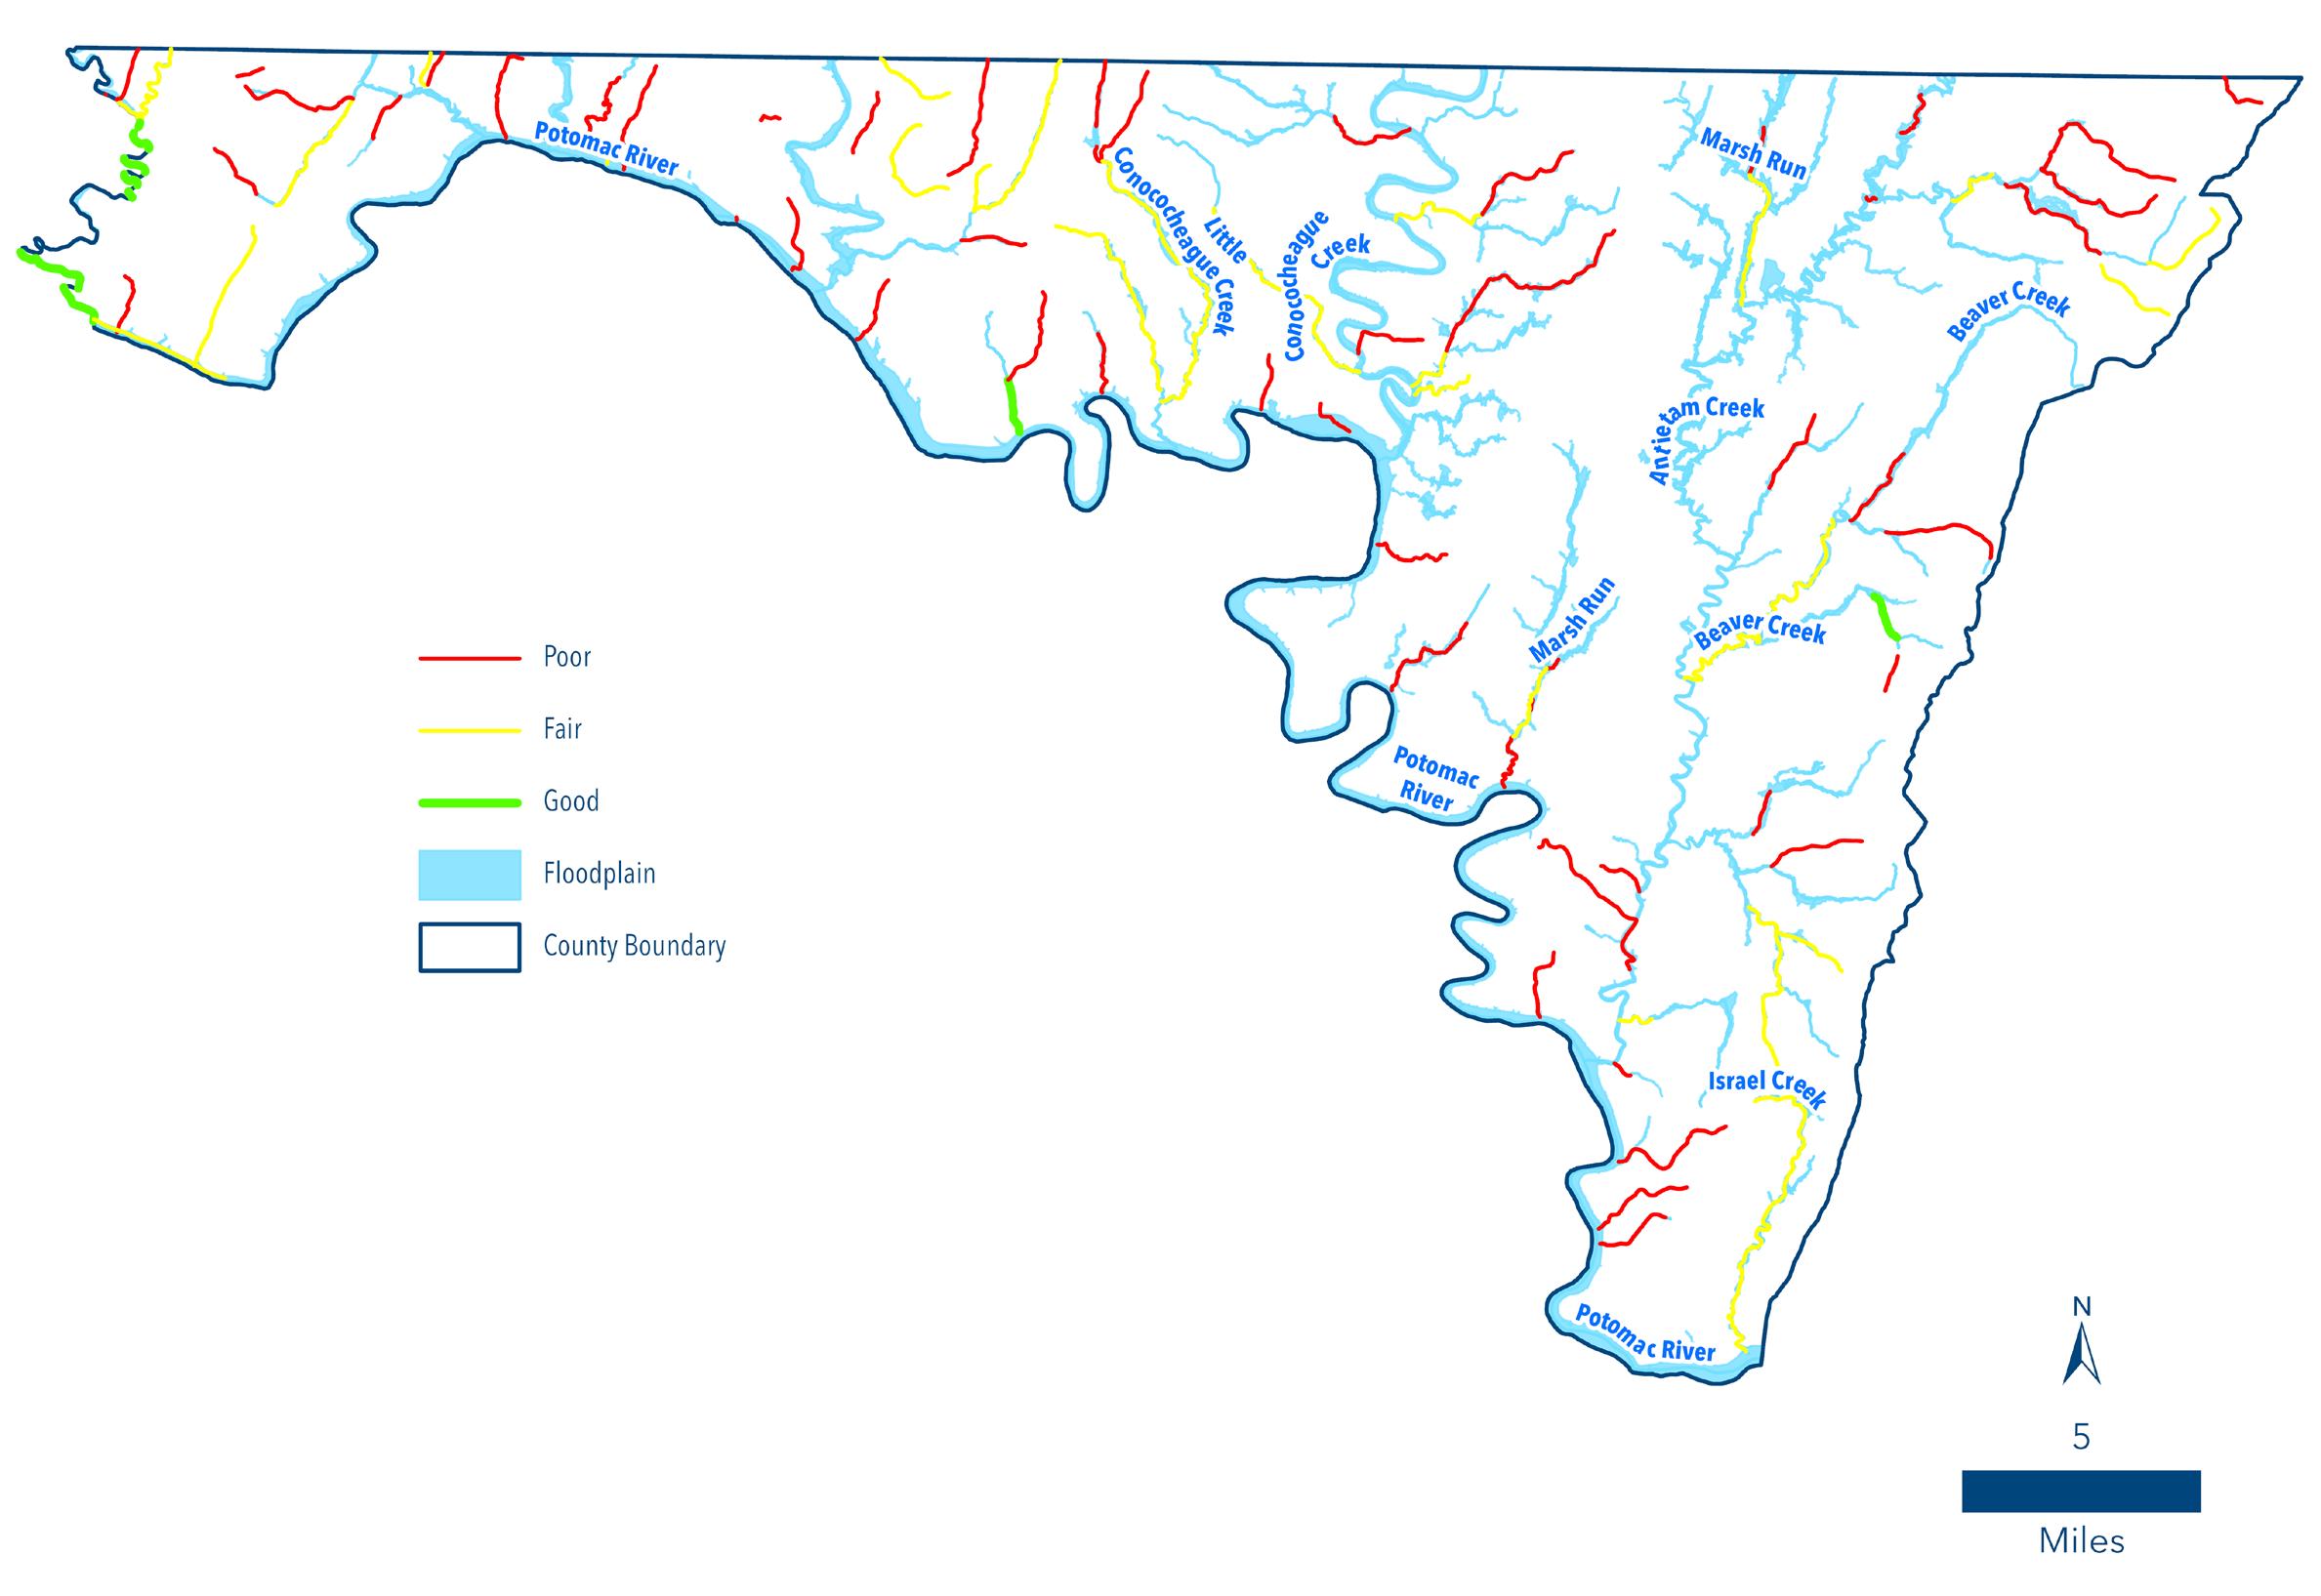
Variation in forested buffers among regions is due to a variety of factors beyond just the level development, as noted in the study. Riparian buffers along waterways in Eastern Shore Counties are often characterized by low vegetation and wetlands instead of forests, for example. Recently planted trees also may not be picked up by aerial imagery used in the study until the saplings reach greater maturity, despite significant advances in satellite imagery in recent years.
Source: Maryland Forest Techinical Study (2022)
Map 12-2, displays the status of forested buffers along select stream miles in Washington County. Of the total acreage depicted within this map, 62% of stream miles are forested (38% unforested). This calculation should not be taken as an absolute measure of forest cover along all stream miles in Washington County, however, as the following caveats should be considered.
• The stream forest cover data consists of a 100-foot buffer around major streams in the County, which then have their forest cover analyzed.
• The total area for the buffer in the County is more than 15,000 acres. Of that total acreage, 62% is forested.
• It is important to note that the stream forest cover data examines only around 50% of the total stream miles for the County.
• When looking at the stream miles for the County, there are a total of more than 2,200 stream miles of varying orders.
As one might expect, forested buffers are most prevalent along waterways in western Washington County, where land is less developed, less suitable for agriculture and there is a large amount of permanently protected State and Federal lands. Forested buffers are less consistent throughout the Hagerstown Valley in eastern and central Washington County where concentrated urban and agricultural land uses have removed notable forest cover over time.

Notably in this region, however, the Counties two largest watersheds - Conococheague and Antietam Creeks - show mostly intact forest buffers along their main stems. Tributaries feeding these two major streams, however, show a much higher absence of forested buffers. This offers insight into where forest buffer planting programs could be undertaken by the County to improve stream health and water quality through various land conservation and easement programs it participates in.
Map 12-2: County Riparian Forest Buffers
Source: Maryland Biological Stream Survey
Stream buffer protections have been in place in Washington County since 1997. County regulatory ordinances provide consistent definitions for streams and buffers, including both perennial and intermittent streams identified in the most current County soil survey. They are required to be identified on development plans, have specific width requirements based on slope and must be maintained with vegetative cover at all times. Sediment and erosion control plans and permits are required for any soil disturbance exceeding 5,000 square feet. Permanent structures and septic systems or reserve areas are prohibited in the buffer. Water quality improvement structures or access limitations are permitted.

The Subdivision Ordinance requires that stream buffers “... be measured from and perpendicular to the top of the stream bank. The buffer shall be expanded to include any floodplain determined according to the Floodplain Management Ordinance, any non-tidal wetland areas identified on the Maryland Department of Natural Resources Non-Tidal Wetlands Guidance Maps and field verified and/or any area of steep slope as defined in this Ordinance.” Buffer widths may be varied with Planning Commission approval in cases of undue hardship where the requirements severely limit the buildable lot area. The County’s slope-based stream buffer guidelines are shown in the chart below. For each categorical increase in slope percentage, the buffer width likewise increases by at least four (4) feet. The width applies to each side of the stream. Development is restricted on slopes steeper than 25%, or on highly erodible soils (greater than .35 K factor).
Outside of the development process, additional programs protect stream buffers on private lands through the establishment of permanent easements of various types. Rural Legacy easements award additional monetary value to landowners’ easements which establish permanent 100-foot-wide buffers adjacent to streams, rivers and springs. The Conservation Reserve Enhancement Program (CREP) offers another agricultural land preservation program to establish riparian forest buffers. Enrolled landowners create buffers on highly erodible land, next to a waterway or take steps to restore natural wetlands. Easement values are determined by the amount of acreage in the program and the current buffer width.
Besides agricultural land preservation programs, the County has a Memorandum of Understanding with the Washington County Soil Conservation District (SCD) to create forest easements on private lands using funds collected from developers who cannot meet their Forest Conservation Ordinance requirements through other means. Easement purchases of existing forest or the planting of new forest is focused on priority lands such as those along streams, on steep slopes, containing sensitive wildlife habitat or those conferring other significant environmental benefits. The SCD locates willing landowners, then manages the various stages of forest establishment and monitoring for 20 years after the success of the initial planting is achieved. The County maintains a dedicated Forest Conservation Fund where accrued funds paid by developers are tapped to implement these projects.
The 100-year floodplain is the portion of the landscape adjacent to streams and rivers with ground surface elevations that have a 1% chance of inundation by a flood event in any given year due to upland rainfall or runoff. Floodplains are generally composed of rich alluvial soils formed by many years of deposition of soil, gravel, sand, rock, leaves, twigs, animal and other plant materials caused by the continual ebb and flow of water in and out of the stream or river channel. Antietam, Conococheague, Licking and Little Tonoloway Creeks and the Potomac River all have extensively mapped 100-year floodplains. There are many other areas associated with unnamed streams that are also prone to flooding.
Floodplains are a natural part of the aquatic environment and contain diverse ecosystems. A key function of floodplains is to hold excess water and allow a slow release into groundwater and back to the waterway. Streams and rivers carry higher suspended sediment during flood events; the floodplain acts as a ‘sink’, trapping and settling these particles. The soil microbial community is active in floodplains, processing and cycling nutrients. Unique plants that can tolerate episodic high water are present in floodplains along with a variety of animal species that contribute to high biodiversity.
Floodplains have distinct components that are important to understand as they relate to flooding events and, by extension, floodplain regulations. These components, defined in Washington County’s Floodplain Management Ordinance (FMO), are illustrated and described below:
Source: Tulsa Engineering & Planning
• Floodplain - defined above, encompasses both the floodway and floodway fringe
• Floodway - the channel of a river or stream and the parts of the floodplain adjoining the channel that are reasonably expected to efficiently carry and discharge the flood water of a watercourse
• Floodway Fringe - portion of the floodplain outside the floodway
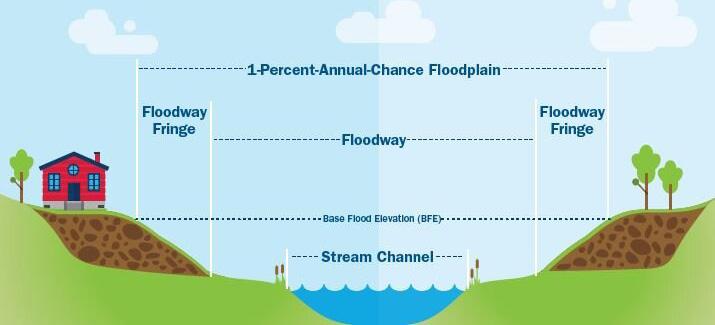
Floodplain management typically regulates the location and intensity of land uses that fall within the 100-year floodplain, which is also known as the Base Flood zone. The Federal Emergency Management Agency (FEMA) maps 100-year floodplains as well as other hazard areas on its Flood Insurance Rate Map (FIRM). The FIRM maps are most specific about the base flood line in places where detailed engineering studies have been performed. The line is more approximate where such studies have not been carried out.
The 100-year flood depicted on the FIRM map depicts a statistical average, not a precise interval of years that will elapse before a flood of that magnitude will occur. The average is based on historic and present data about the watercourse in question, such as rainfall and stream stage. Real-time factors affect the actual probability that a significant rainfall event will produce a “100-year flood,” such as the soil saturation before the storm, the extent of rainfall in the watershed, and the relationship between watershed size and storm duration (e.g. - runoff occurs more rapidly in smaller watersheds).
Development activities have the ability to significantly alter the flood regime of a waterway. As noted previously, large amounts of impervious cover upstream or adjacent to a waterway can increase both the amount of precipitation that runs off into the water body and the rate at which water travels to reach said waterway. Unnatural changes in stream morphology, such as the placement of fill in the flood fringe, the use of dams, or channelization can reduce the capacity of the floodway to carry floodwaters. The effects can be catastrophic to downstream communities if proper mitigation devices such as stormwater facilities or stream buffers are not utilized to safeguard these locations from these anticipated hazards. Improper floodplain development can also result in less physically damaging but equally costly effects such as contaminated water and long-term impacts to the integrity of aquatic and riparian stream communities.
Washington County has recognized these potential hazards and addressed the protection of floodplains through its FMO. While the FMO does not entirely restrict new development in the floodplain, it does substantially limit the number of permitted uses. The Ordinance excludes all new development from the floodway, outside of roads, bridges and essential utilities. New development in the flood fringe is generally limited to water dependent activities (e.g. – marina), or small, uninhabited accessory structures of limited use (e.g. - garages). These flood fringe structures must be elevated above the level of the 100-year flood (called the Flood Protection Elevation) and be equipped with water equalizing vents.
Existing structures in the floodway must also meet certain safety requirements. Existing structures in the floodway generally cannot be improved beyond their current footprint and must be relocated out of the floodplain in the event of substantial damage. Permitted but restricted new construction in the floodway fringe generally has anchoring and material specification requirements. Variances are granted only in cases where the applicant has demonstrated exceptional hardship. The County’s Subdivision and Zoning Ordinances require that 100-year floodplains must be identified during development review.
These regulatory requirements are on par with what is required by FEMA’s National Flood Insurance Program (NFIP), which also permits limited development in the floodplain with implementation of certain flood protection measures.
The adoption and enforcement of a FMO are two of the major requirements that allow the County to participate in the NFIP, which provides flood insurance to property owners, renters and businesses. Homes and businesses in high-risk flood areas with mortgages from government-backed lenders are required to have flood insurance. Having this coverage helps speed up recovery efforts once floodwaters recede.
The State of Maryland in conjunction with FEMA has been systematically updating Flood Insurance Rate Maps (FIRMs) for communities over the past several years. The current paper flood maps are being converted to a digital format that is GIS compatible called Digital Flood Insurance Rate Maps (DFIRMs). The improvements in spatial accuracy provided by the new base map, and the availability of electronic floodplain information should greatly enhance the ability to use the maps for planning, permitting, and insurance applications.
Wetlands are defined by U.S. Fish and Wildlife Service as transitional lands between terrestrial and aquatic habitats where the water table is usually at or near the surface or the land is covered by shallow water. They are generally identified based on the degree of flooding, the existence of unique plant communities, and by special soil characteristics. Wetlands may be permanently flooded by shallow water, permanently saturated by groundwater, or periodically inundated for periods during the wet season.
Wetlands are broadly classified as either tidal or non-tidal, where the primary distinction is salinity versus freshwater habitats. Non-tidal, freshwater wetlands which occur in Washington County can be further classified generally as palustrine (isolated) or lacustrine (associated with lakes or reservoirs). According to GIS analysis using data provided by the Maryland Department of Natural Resources and the U.S. Fish and Wildlife Service’s National Wetlands Inventory, Washington County contains 2,297 acres of wetlands, the vast majority of which are classified as palustrine. Non-tidal wetlands are found throughout Washington County, generally isolated from one another, but also in closer proximity along streams and the Potomac River.
In addition to the considerable number of Federal and State Laws protecting wetlands as a result of historic losses throughout the nation, non-tidal wetlands are recognized within a number of local ordinances. The County’s Forest Conservation Ordinance requires their identification on forest stand delineations, which are the first plan submission required for most development projects, and direction for their identification is described. The Subdivision Ordinance also requires that wetlands be included in mandated stream buffers, expanding buffer distances for their inclusion if necessary. Finally, the County’s Floodplain Management Ordinance states that “encroachment by development into wetlands is not allowed without State and Federal permits.” Typically, even if a permit is granted, the project is required to provide mitigation by constructing additional wetlands on or offsite.
Hydrogeomorphology is the study of landforms created by the action of water. Work at the intersection of hydrology and geomorphology is increasingly common and useful for identifying hazards and understanding the impacts of land use, among other natural and man-made hazards on the landscape. The intersection of these fields of study is useful in Washington County where a unique set of geologic features has influenced its settlement patterns and are a notable factor to be considered during development processes, particularly as it relates to water resources. These features are introduced briefly in this chapter and expanded upon in greater detail in both the Water Resources Element of the Comprehensive Plan, as well as the County’s adopted Water and Sewerage Plan.
Notable portions of Washington County are characterized by an underlying Karst geology, particularly in the Hagerstown Valley where most of its population is concentrated. 89% of the Hagerstown Valley is underlain by carbonate rock types characteristic of karst terrane.1 Karst landscapes reflect the result of chemical weathering and erosion processes by water on bedrock such as limestone and dolomite. Caves, sinkholes, sinking streams, rocky outcrops, springs and other unusual surface and subsurface features are common features found in locations characterized by this geology.
Due to the interconnection of surface features, bedrock and the subsurface water table, karst environments offer significant challenges to development, the provision of water supplies and environmental protection. Examples of these challenges include:
• Land instability in such areas can result from the formation of sinkholes and/or due to pinnacled weathering patterns of exposed bedrock. These weathering patterns result in uneven ground surface conditions from which to anchor roads and structures.
• Karst aquifers are highly complex because of the broken and folded nature of the bedrock which also facilitates rapid infiltration of surface water. Correspondingly, wells drilled in these environments are not always successful and those which do produce high yields may be directly connected to sources of contamination.
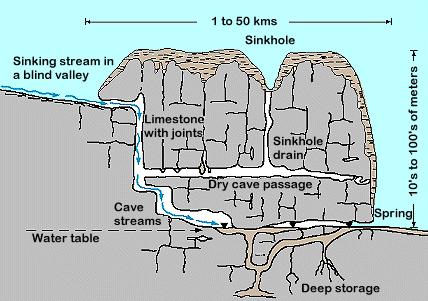
• Due to lack of public knowledge, features such as sinkholes have historically been used for waste disposal by landowners, even though they are often significant points of ground-water recharge.
• Groundwater discharged at springs, streams or in caves in karst terrain has the potential to negatively affect aquatic and terrestrial ecosystems if contaminated.
• Runoff, reduced groundwater availability and increased sinkhole formation are all post-development concerns if SWM systems have not been properly designed, implemented and maintained.
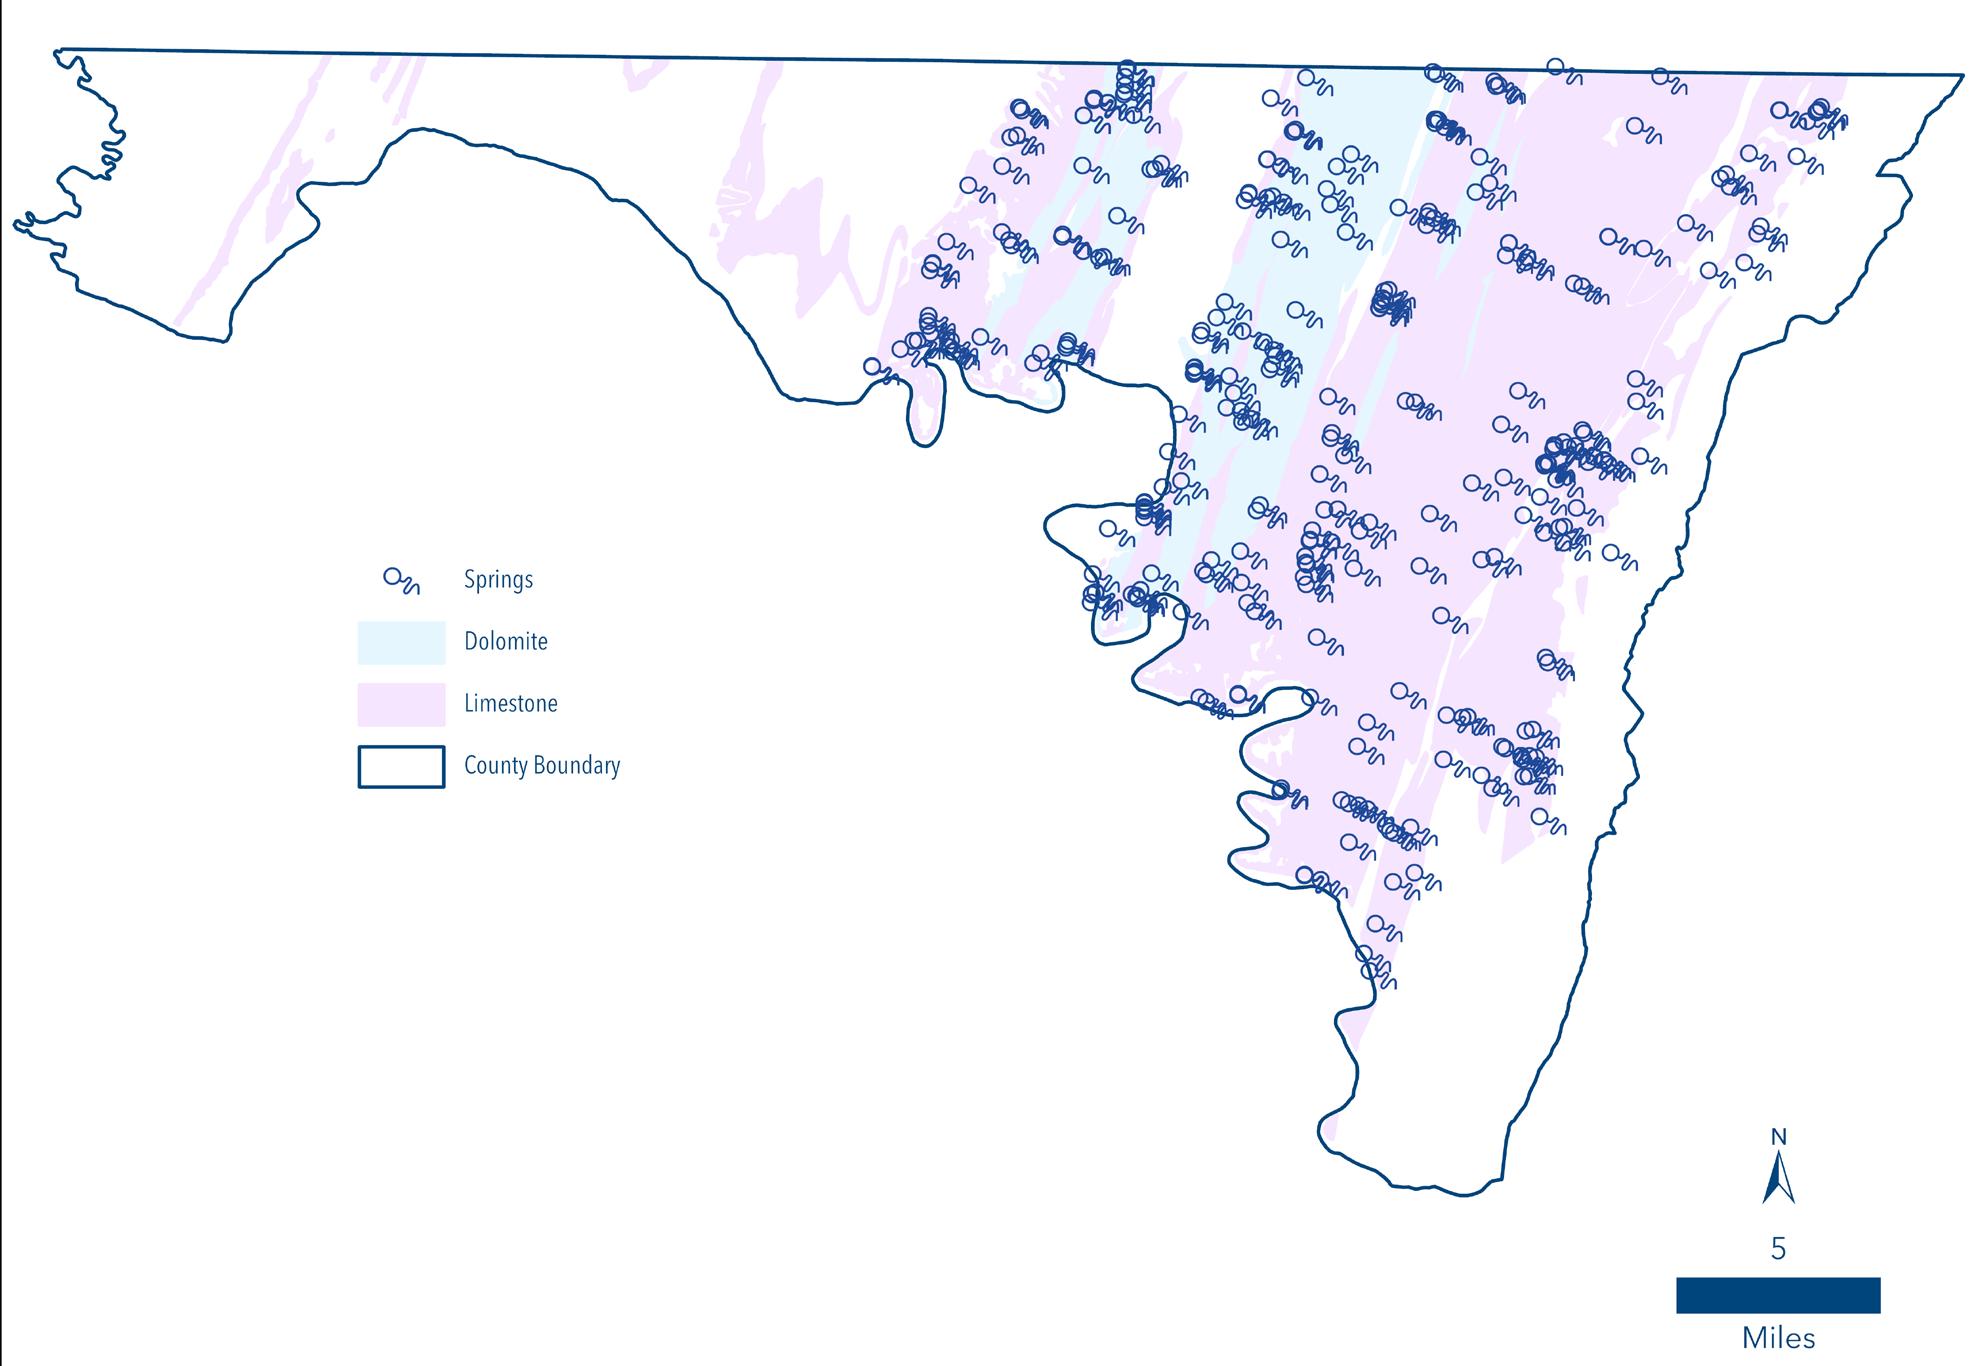
Springs and seepage areas are locations where water flows from a confined aquifer to the earth’s surface. Typically, this results from precipitation infiltrating the ground, whereupon it travels through subsurface geology as groundwater and exits to the surface at a lower elevation location where an impermeable rock layer prevents deeper penetration. Springs feed surface waters through smaller tributary streams that, in turn, aid in maintaining base flows of larger streams.
Springs occur throughout Washington County, producing anywhere from a few gallons per minute to several thousand gallons, depending on a variety of factors. According to the County’s 2009 Water and Sewerage Plan, the most productive springs occur in the eastern part of the county, near the base South Mountain and Elk Ridge. Springs are generally less productive as one travels west through the county. The greatest number of springs occur in the Hagerstown Valley. There are 191 known springs in the Hagerstown Valley where the porous and permeable karst terrain creates a hydrologic regime that is constantly evolving.1 In this region, while the output is more uncertain due to subsurface conditions, production rates can reach 2,000 to 3,000 gallons per minute. The location of springs in the Hagerstown Valley is depicted on the map below.
Springs provide sources of potable water which, historically, helped spur settlement of the region. While no longer relied upon as heavily as in the past, springs are still utilized by both private and public entities in the County for a variety of purposes. Fort Ritchie and the Boonsboro-Keedysville water system are examples of local jurisdictions which still rely heavily on springs to supply their water systems. Additionally, the Albert Powell State Fish Hatchery relies on a large nearby spring to feed its operations.
From the perspective of wildlife, springs provide both habitat for sensitive plant and animal species, some of which are limited in number or geographical distribution. The bog turtle, rock vole, and pearl dace are examples of Maryland species that are associated with spring or seepage-fed habitats.1 Contributions to surface waters from cool springs are also part of the reason why the County can support native brook trout populations
Maryland has extensive SWM and water quality regulations that govern development procedures in karst environments to safeguard the interconnected surface and subsurface features of these landscapes, including springs. These Statewide regulations, design guidelines and best management practices then are typically implemented by local jurisdictions through development review procedures, and backed by enforcement mechanisms that may be carried out by State and/or local governments.

From the SWM perspective, Maryland’s Stormwater Design Manual (2000) contains an entire section in its appendix devoted to Geotechnical Methods for Karst Feasibility Testing. Geotechnical analysis, conducted prior to site development in karst areas, is intended to identify subsurface voids, cavities, fractures, or other discontinuities which could pose an environmental concern or a construction hazard to an existing or proposed SWM facility. Methods include soil borings and various geophysical investigation techniques undertaken in the field which are then sent for further laboratory analysis.
Washington County’s Stormwater Management, Grading, Soil Erosion and Sediment Control Ordinance mandates geotechnical investigations for projects proposing Environmental Site Design (ESD) planning techniques and practices or structural SWM measures that entail infiltration, filtration, detention and/or retention that are suspected of being located within a karst area. For structural SWM measures proposed in areas of karst geology, dry and wet ponds, infiltration and filtration practices are required to be lined with a natural or man-made liner in accordance with the Design Manual, as well as the latest adopted version of the Washington County Standards and Specifications for Public Works Construction.
Maryland has also undertaken source water assessments to determine the vulnerability to contamination of all public drinking water sources Statewide. In Washington County, assessments have been completed for public water sources utilized by the incorporated municipalities and several other community water systems affiliated with large institutions, multi-family developments or mobile-home parks.
Transient non-community water supplies for individual properties have also been evaluated. Using these assessments, local governments and water suppliers can work with the Maryland Department of the Environment (MDE) and other agencies to develop source water protection initiatives, such as wellhead protection programs, to improve the safety of their water supply.
The County’s adopted Water and Sewerage Plan is the authoritative policy document governing water and sewer service locally. It functions primarily as a land use document which establishes service area boundaries for the phased extension of public water and sewer services in accordance with projected development. While mostly a policy document, the Plan does provide generalized guidance on well construction and septic location for lots located in karst environments in Chapter II:24-25.
Volume One of Models and Guidelines from the 1992 Planning Act defines a habitat of a threatened or endangered species as:
“An area which, due to its physical or biological features, provides important elements for the maintenance, expansion and long-term survival of threatened and endangered species. This area may include breeding, feeding, resting, migratory, or overwintering areas. This area may need special management or protection because of its importance to conservation of the threatened or endangered species.”
Human activities have, both currently and historically, had an undeniable impact on species habitat globally and locally. In Maryland, over 200 species have been documented as being extinguished over the past 350 years.1 Fundamentally, the resiliency of an ecosystem is dependent on protecting its species biodiversity. Biodiversity is a direct outcome of habitat protection and the maintenance of the core ecological processes which provide the conditions for habitation in general.

As an issue of Statewide or national significance, regulation and protection of threatened and endangered species stems primarily from Federal or State laws. In Maryland, endangered species regulations were enacted in the State through the Maryland Endangered Species Act of 1971.

This Act prohibited the taking, transportation, possession, processing, or sale within the State of Maryland of any wildlife appearing on the Federal lists of endangered, foreign or native fish and wildlife. Secondly, it mandated the Department of Natural Resources (DNR) to develop a list of fish and wildlife deemed to be threatened with Statewide extinction in Maryland. The DNR list includes all of the Federally listed species and lists of species which are threatened or endangered within their range in Maryland.
In 1979, the State of Maryland established the Natural Heritage Areas Program, to fulfill the second requirement of the 1971 legislation. This program is responsible for identifying, ranking, protecting and managing Rare, Threatened and Endangered (RTE) species throughout the State. The Maryland DNR restores degraded habitats, conducts field surveys, performs research, and conducts public outreach and education efforts in service of its responsibilities for the Natural Heritage Areas Program.
The Natural Heritage Areas Program has established review areas throughout the State. Whenever there are proposed development projects within these review areas, DNR will examine the proposal to ensure that they do not negatively affect sensitive plant and animal species habitat. In some cases, the Program will cooperate with outside organizations to acquire land that encompasses RTE species habitat.
The Wildlife and Heritage Service Natural Heritage Program tracks the status of over 1,250 native plants and animals that are among the rarest in Maryland and most in need of conservation efforts as elements of our State’s natural diversity. The Maryland DNR lists 60 animal and 167 plant species in its Current and Historical Rare, Threatened, and Endangered Species for Washington County as of 2021. This list includes three (3) Federally listed threatened or endangered species (one animal and two plant species). Habitats that may support rare, threatened or endangered species in Washington County are shown on the map 12-4.
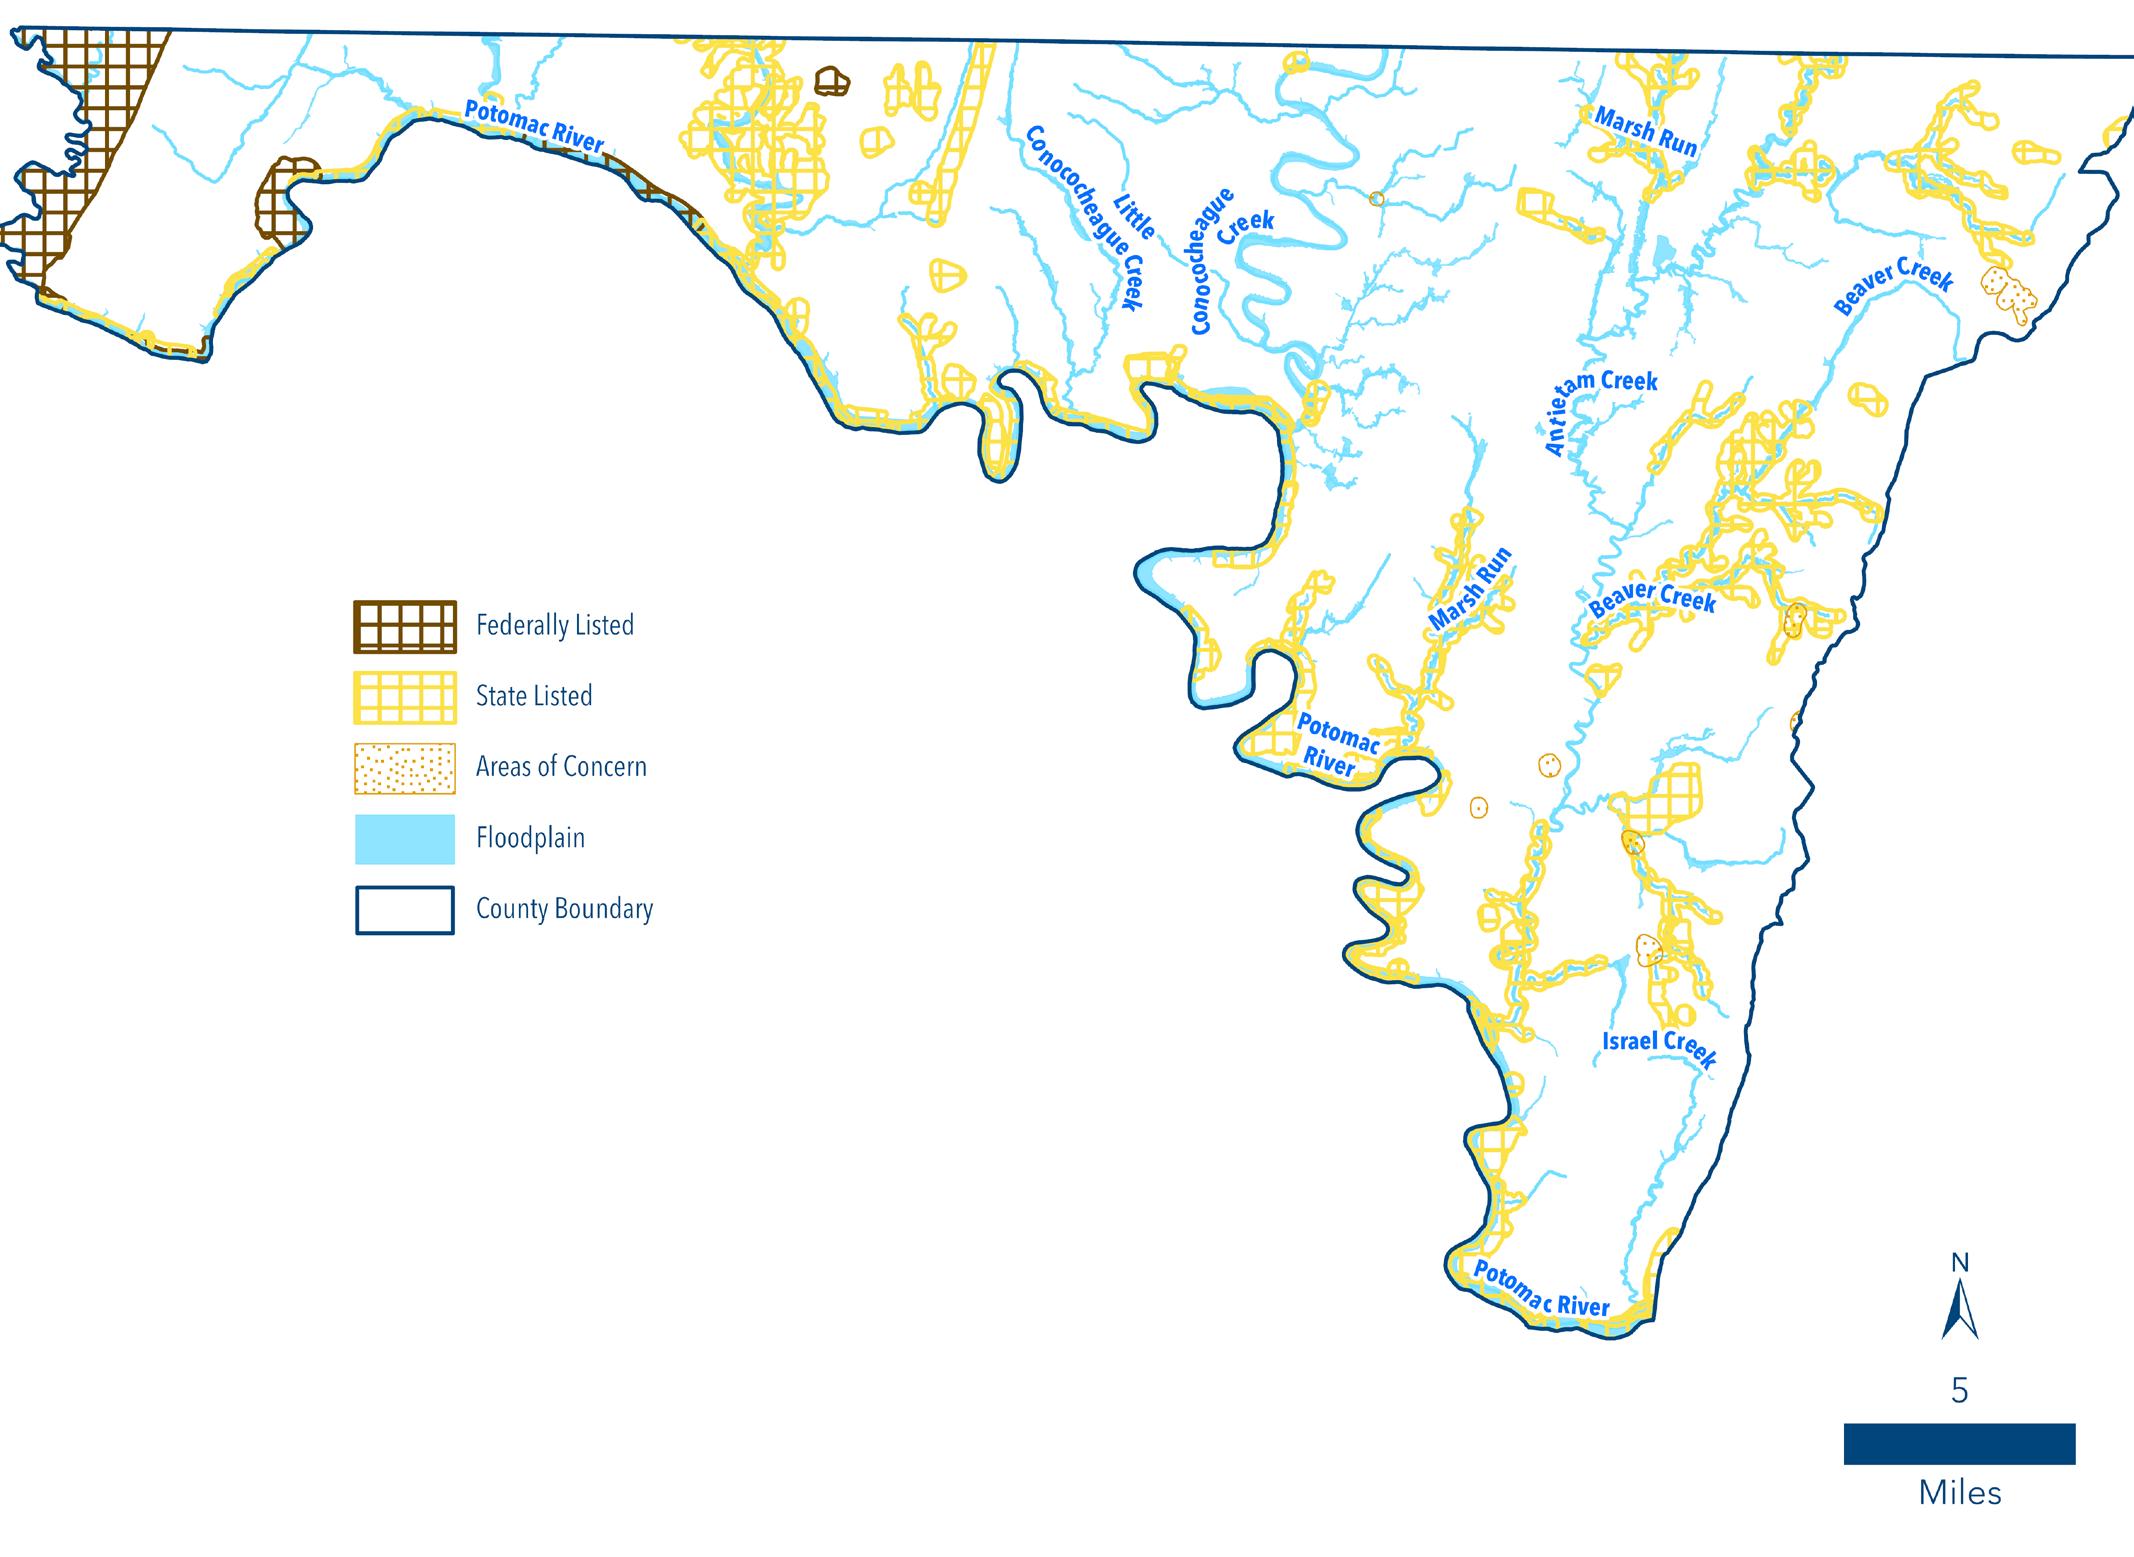
The primary State law that presently governs the listing of endangered species is the Nongame and Endangered Species Conservation Act. This Act is supported by COMAR regulations which contain the official State Threatened and Endangered Species list. DNR’s Fisheries Service maintains an official list of game and commercial fish species that are designated as threatened or endangered in Maryland.
At the County level, habitat of RTE species is required to be identified at the earliest stage of development, typically beginning with the submission of a forest stand delineation (FSD) under the County’s Forest Conservation Ordinance. At this stage, projects taking place on lands that fall within the regions mapped above will be sent to DNR for their review. Review comments provided in the letter received from DNR will then be included on the FSD, as well as on any subsequent plans affiliated with the development that affect land disturbance. Typically, these involve voluntary protection measures involving sediment and erosion control best management practices (BMP) during grading and construction, or guidance on limiting the extent or timing of clearing forest or other existing vegetative cover. The County also tracks, by parcel, the confirmed existence of RTE species habitats in its permitting system (Accela Automation) following reviews conducted by DNR. This makes the presence of RTE species habitat known beyond the scope of a single project, to all County employees involved in land development and permitting.
A significant GIS mapping effort conducted by the DNR to comprehensively identify priority lands for threatened and endangered species conservation is the Biodiversity Conservation Network (BioNet). BioNet is a GIS data layer that was developed primarily to aid DNR, other government agencies, and non-profit conservation organizations determine where conservation efforts are most needed. This layer can be used to help focus a wide array of conservation activities, such as land acquisition and easements, land planning, and management actions.

Prioritization criteria are based on the relative rarity and conservation value of the species and habitats present: the most critically significant areas contain the rarest habitats and species, as well as the largest concentrations of these, Statewide. These lands include State Natural Heritage Areas, Critical Area Habitat Protection Areas, Ecologically Significant Areas, and Sensitive Species Project Review Areas. The areas are prioritized into a 5-tiered system, with Tiers I and II being the most significant for biodiversity conservation. Ranking criteria focuses on both the most irreplaceable species and habitats, as well as on the habitats that concentrate large numbers of rare species.
Washington County has 27,168 acres of Tier I and II lands, and 147,907 acres of Tier III through V, according to the GIS data contained within the BioNet layer. Cumulatively, these lands cover more than 50% of Washington County’s roughly 300,000 total acres. Many of these Tier I and II lands are concentrated along select stream and river corridors dispersed through the County, outside of the Urban and Town Growth Areas where development has been intentionally concentrated. All BioNet designated habitats within Washington County are shown on the map below.
Wildlife corridors are defined in Models and Guidelines #18 as “undeveloped linear stretches of land connecting larger patches of wildlife habitat.” Wildlife corridors can occur in many settings both natural (such as rivers, riparian forests, along undeveloped ridgelines) and manmade (e.g. - along power lines or railroads). The importance of these corridors to people and nature has gradually become clearer to both scientists and urban planners over time. From a natural perspective, conservation biologists and other experts have begun to view plant and wildlife preservation from a systems perspective. What has come into clearer focus is the need for contiguously connected habitat parcels that allow wildlife to fully meet their fundamental needs of obtaining food, water, shelter, and for raising offspring. Isolated and disconnected protected lands are often insufficient to maintain genetic diversity among species, particularly among those that migrate or range widely throughout their life history. Accordingly, wildlife corridors serve to enable both common and threatened or endangered species to obtain the full range of resources that they need to maintain their populations by allowing free movement.
At the same time, it is not just wildlife that benefits from protecting contiguous pieces of land. Greenways are an urban planning and land conservation tool that seeks to protect these contiguous, linear open spaces in order to provide recreational opportunities and water quality benefits, in addition to setting aside land for sensitive species. Greenways are often targeted by land use planners as places to provide long-distance multi-use paths. In urban areas, such corridors provide a buffer from the stress of the city and facilitate contact with open spaces that feel wilder than a typical urban park. In this way, local residents as well as visitors can gain respite from the stresses of modern life, and sensitive land and aquatic species are given more room to roam.
In order to be effective for either purpose however, these corridors or greenways must be of an adequate width to provide their intended benefits. As with stream buffers, there is no exact distance that automatically fits the definition of a perfect corridor. Instead, the width of the corridor needs to take into account the needs of the wildlife species residing within it as well as human factors such as adjacent land use patterns. For conservation purposes in general, corridors should be wide enough to provide for the needs of both edge species (i.e. - crows, raccoons, jays) and forest interior species (i.e. - reptiles, amphibians). Corridors that are too narrow are often too bright, dry or open and contain insufficient cover from predators to allow interior species to survive in large numbers. A wider buffer may also be necessary to mitigate stormwater runoff, and to prevent pollutants from entering ground or surface water systems in urban areas, thereby ensuring increased water quality benefits to people. Professional ecologists and urban planners should work collaboratively to determine both the size and location needed to make such corridors effective for their intended purposes.
DNR’s GreenPrint is an example of a tool that can be used for proactive land conservation planning for ecological and recreation purposes. GreenPrint identifies Targeted Ecological Areas which represent lands and watersheds of high ecological value that have been identified as conservation priorities by the DNR. This Green Infrastructure Network of priority lands consists of ecological hubs and corridors.
• Hubs - are large, ecologically significant, natural areas that provide habitat for native plants and wildlife. They may include protected areas such as County, State, or National parks that are managed for preservation purposes as well as private lands where natural features and ecological processes are protected or restored.
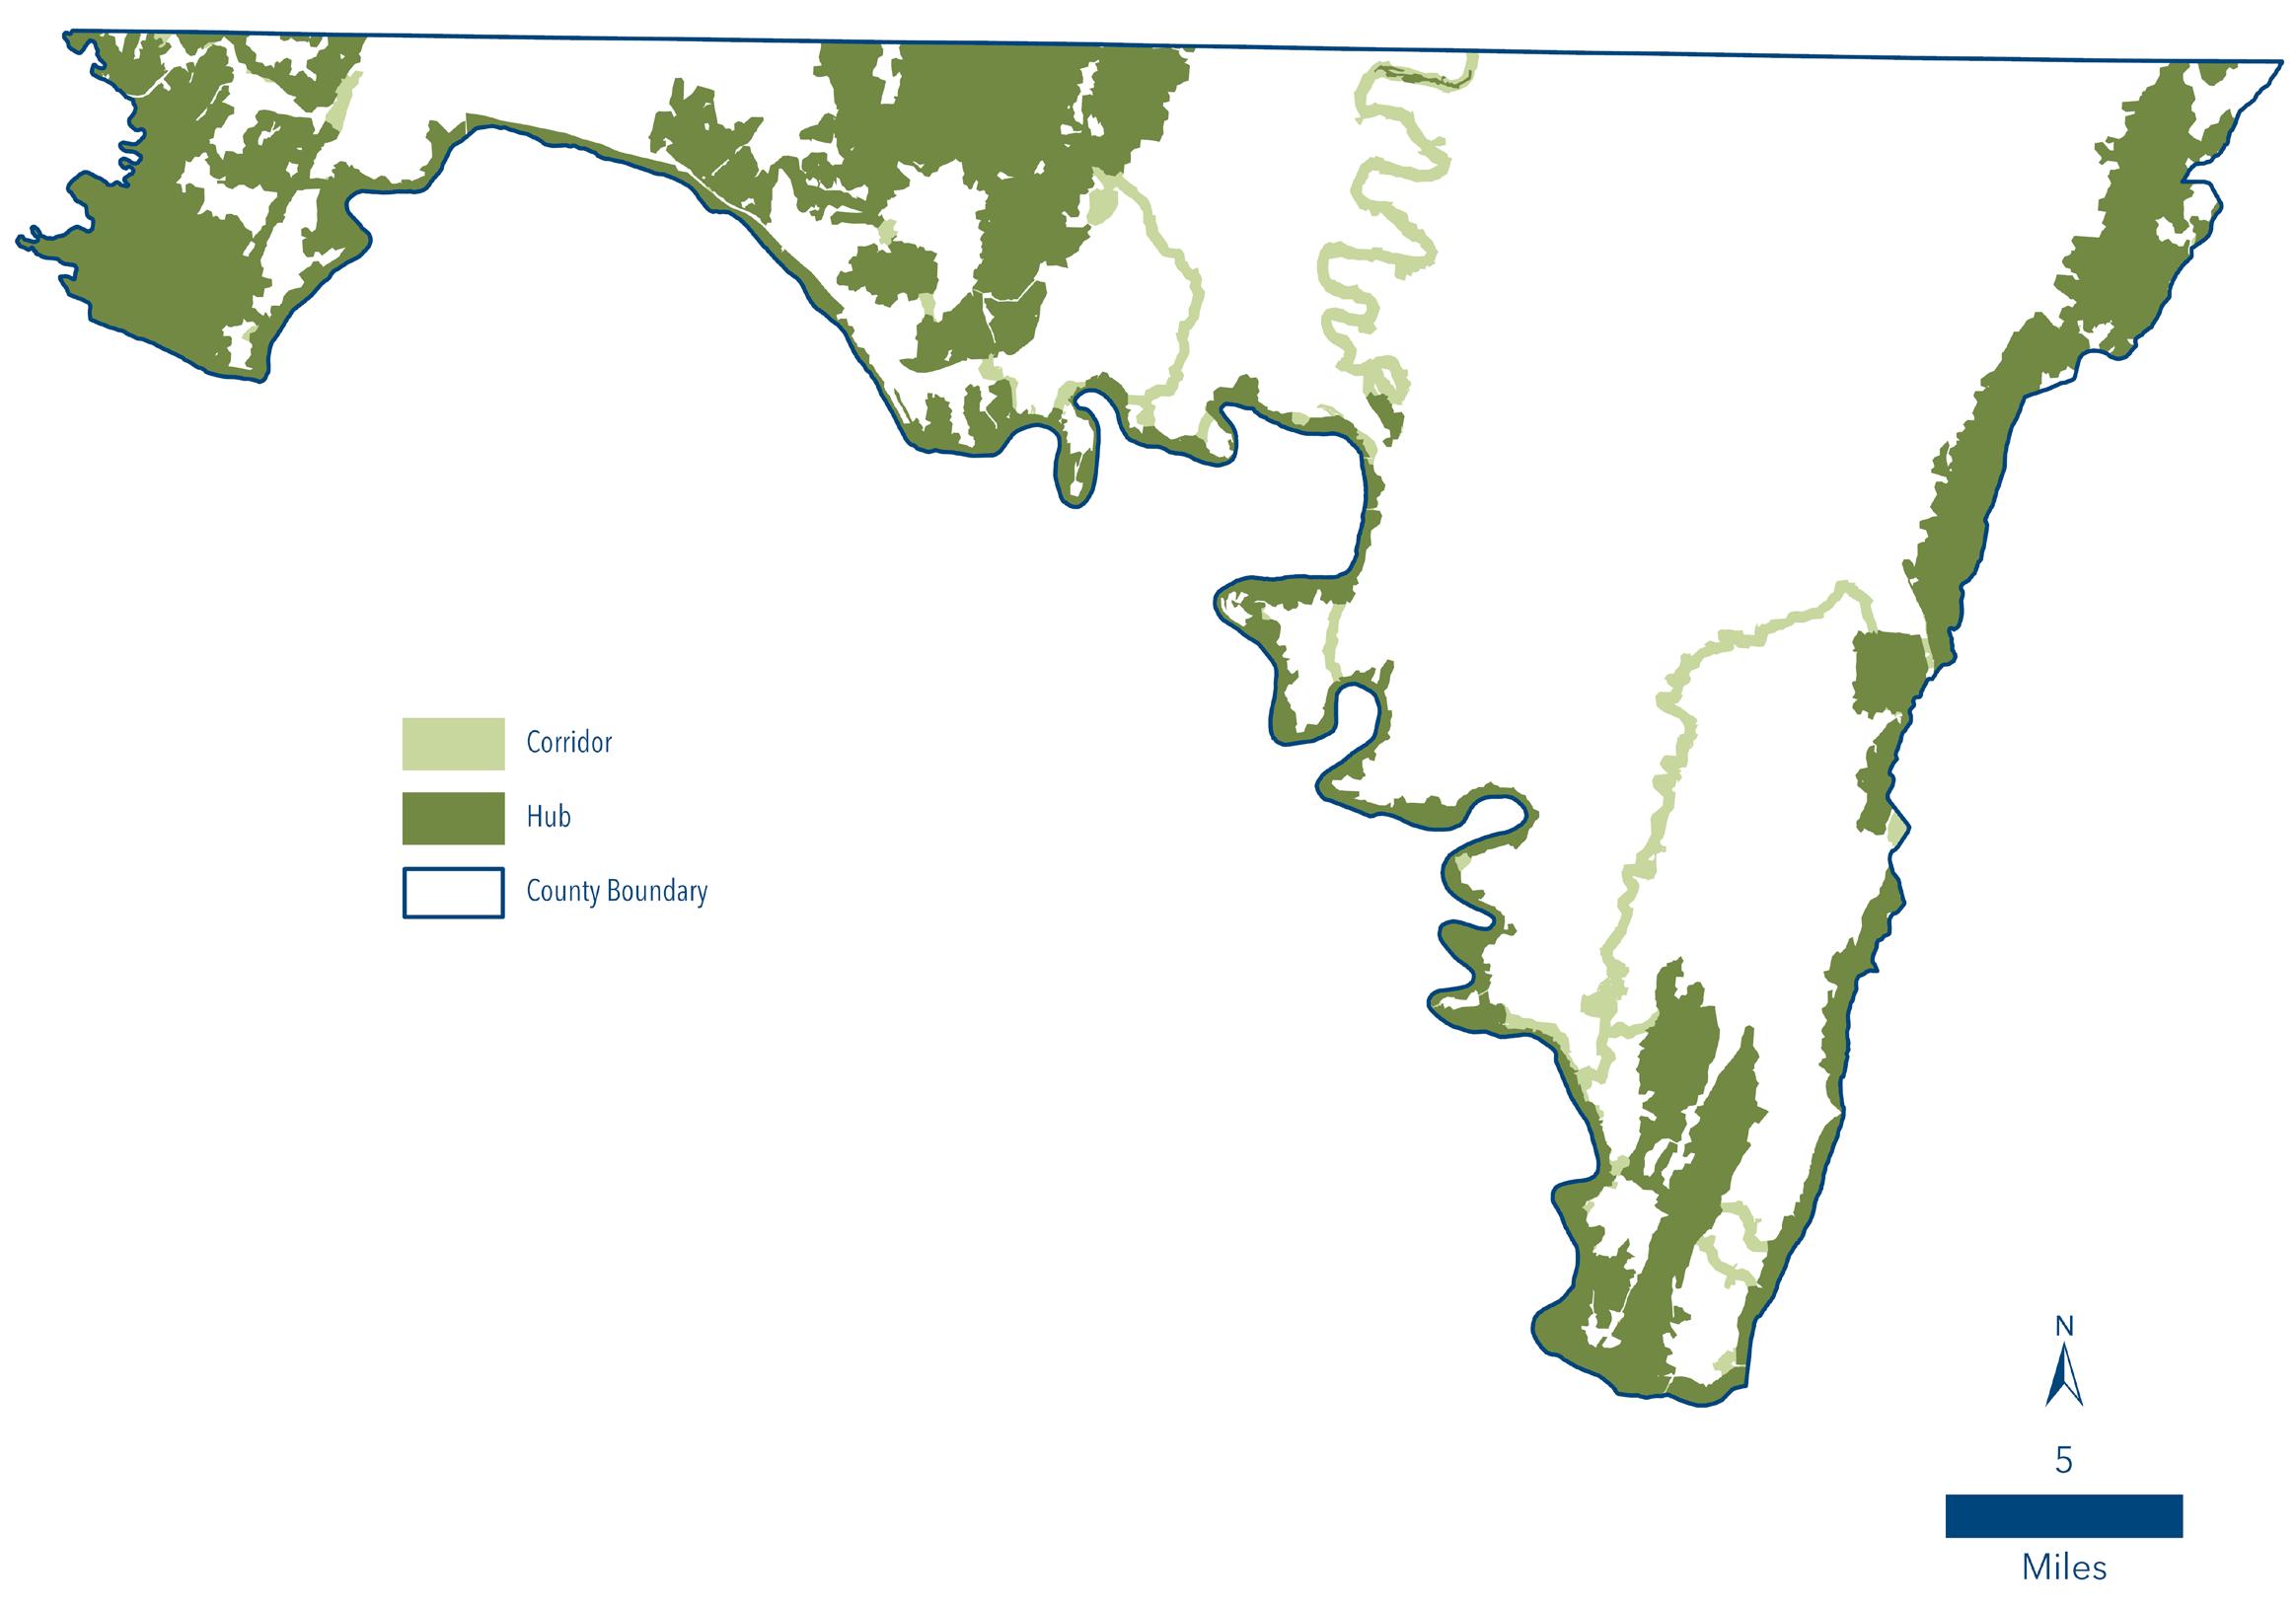
• Corridors - are linear features that tie the hubs together and serve as biological conduits for native plants and wildlife. They often follow streams and their adjacent upland areas, which provide cross watershed connections. Greenway is a term often used interchangeably with corridors, within this model of ecological preservation. These lands represent contiguous areas in the County worth considering for new or additional sensitive resource protection in the future.
As noted in the Agriculture and Forestry chapter, Washington County has done an excellent job to date in preserving contiguous corridors of land and water. Collectively, between its various agricultural land preservation programs and forest conservation lands, nearly 39,000 acres have been permanently set aside by the County. Additionally, another 33,000 acres1 are held in various Federal, State and local parklands throughout the County. In total, these protected lands comprise approximately 24 percent of the County’s total acreage (299,522 acres), a substantial figure by any measure.
Thus, with so much land protected already, the County’s focus going forward should be to identify opportunities to connect these preserved lands contiguously to an even greater degree in areas where development offers more costs than benefits.

For planning purposes, the County may wish to adapt DNR’s GreenPrint and BioNet tools to its own ends to create a natural resource inventory that would help guide its land preservation efforts for the protection of sensitive environmental lands in contiguous, protected hubs and corridors. The presence of many sensitive features is noted before and during development review already, which could supplement broad-scale data resources such as those displayed and analyzed in Geographic Information Systems.
As noted in the introduction of this chapter, the 1992 Maryland Planning Act permitted and encouraged local jurisdictions to identify additional sensitive areas that were unique and locally important beyond the original four (4) types noted in the legislation. Washington County accomplished this through the identification of Special Planning Areas (SPAs). SPAs are geographic areas of unusual or significant importance for which definitions, special policies and land use techniques were needed to ensure their protection. SPAs were first identified by the County in the 1981 update to its Comprehensive Plan. They include the Upper Beaver Creek Basin and Beaver Creek (Albert M. Powell) Trout Hatchery, Edgemont and Smithsburg Reservoir watersheds and the Appalachian Trail Corridor. SPAs were then formally adopted through amendments to the Comprehensive Plan, followed by the Subdivision and Zoning Ordinances, between 1995 and 1997. The County’s SPAs shown on the map on the next page.
Maryland’s water quality standards have three (3) components: designated uses, water quality criteria and antidegradation policy. Of these three components, designated uses have the most direct application to the Sensitive Areas element for Trout Stream Watersheds as well as the Upper Beaver Creek Special Planning Area. Designated uses are goals for water quality based on a particular intended use for humans or aquatic life which have been organized into four (4) classes. These uses generally include recreation, shellfish harvesting, water supply and/or aquatic life habitat. The Use Class designations are defined and mapped below:
• Class I: Water Contact Recreation and Protection of Non-tidal Warm-water Aquatic Life
• Class II: Support of Estuarine and Marine Aquatic Life and Shellfish Harvesting

• Class III: Non-tidal Cold Water
• Class IV: Recreational Trout Waters
• P: Public Water Supply – can be applied to all Use Classes

While all except Class II Uses apply to waters within Washington County, it is Classes III and IV that apply specifically to the Beaver Creek Watershed Special Planning Area. The main stem of Beaver Creek within the Antietam Creek Watershed is a Class III stream. Marsh Run, also within the Antietam Creek Watershed, is Washington County’s only other Class III stream. Beaver Creek originates on the western slope of South Mountain and supports habitat for brook trout, the only native species of trout in the Eastern United States. Wild trout are an indicator species for water quality and overall watershed health. They have strict water temperature requirements and are highly susceptible to habitat degradation. Therefore, upstream disturbance from human activities must be kept to a minimum to continue supporting a self-sustaining population of brook trout.
Beaver Creek is also the site of the Albert Powell Fish Hatchery. This Hatchery raises rainbow trout which are used for stocking Class IV waterways throughout the State of Maryland and to supplement other State hatchery operations. Sideling Hill, Tonoloway, Licking and Conococheague Creeks are the other Class IV streams within Washington County that receive stock from the Hatchery. The facility is fed by a nearby spring, whose waters it is able to recirculate when use exceeds output. The spring feeds both hatchery operation and the baseflow of Beaver Creek itself. The Hatchery, therefore, represents an important operation economically and biologically for both the County and the State.
Attention is given to the Upper Beaver Creek Drainage Basin in both the County’s Subdivision and Zoning Ordinances because of their identification as Special Planning Areas. The Subdivision Ordinance requires that new development located in the Upper Beaver Creek Basin that is subject to a preliminary consultation and proposes the use of on-site wells and septic systems may be required to provide a hydrogeologic study prior to the submission of a preliminary plat. The goal of the hydrogeologic study is to evaluate potential impacts to ground and surface water resources from the proposed development. The study must also address the karst specific features which may have a direct relationship to groundwater quality such as caves, sinkholes, double terminating drainage reaches and contact between specific geologic formations. Residential density has been limited within this Watershed through amendments made to the Zoning Ordinance in 2005.

The Washington County Soil Conservation District has been the lead agency in the Beaver Creek-Antietam Creek targeted watershed project. In 1992, Little Antietam Creek and Marsh Run sub-watersheds were selected to be in this program which was expanded in 1996 to include the Beaver Creek watershed. A Soil Conservation Planner was hired to complete a watershed assessment and to begin educational efforts in the targeted sub-watersheds. This was funded by an Environmental Protection Agency (EPA) Nonpoint Source grant from Section 319 of the Clean Water Act and was obtained through the Maryland Department of Agriculture. A conservation technician was hired to help install Best Management Practices (BMP) identified by the planner in Soil and Water Conservation Programs. This program has continued in the Beaver Creek and Marsh Run sub-watersheds. These documents require a comprehensive review of development and its impacts on local resources, and in some cases, mechanisms to reduce negative impacts such as setbacks, easements, and tree planting.
Best Management Practices encouraged by the DNR in Class III tributaries to protect aquatic habitat include protection of stream buffers, restriction of development on steep slopes, stormwater infiltration devices, minimization of impervious surfaces, stormwater detention basins that don’t hold water longer than 12 hours and the use of watering troughs for livestock on pastureland. Many of these practices are already in use in Washington County to safeguard stream and watershed health.
The Edgemont Reservoir is located along the eastern slope of South Mountain, a few miles above the Town of Smithsburg, near the Washington and Frederick County border. The reservoir collects water from a watershed that is approximately 6 square miles of mixed forested and agricultural land, potentially supplying up to 750,000 gallons of water per day. The Smithsburg Reservoir, built in 1881 and located in Smithsburg, was the original source water supply for the City of Hagerstown. A dam, fed by Little Antietam Creek, was constructed in 1902 to create Edgemont Reservoir to supplement the Smithsburg Reservoir during seasonal shortages.
The use of both reservoirs was curtailed in 1987 after passage of the Safe Drinking Water Act required filtration in addition to the chlorination already done at the plant. Improvements were made to the dam and spillway in 1992-93. In 1997, the William Breichner Water Treatment Plant was constructed on the site of the Smithsburg Reservoir to treat water from the Edgemont Reservoir and again became a second drinking water source for the City of Hagerstown. The Edgemont Reservoir, along with the Potomac River, serves 75,000 people in Hagerstown, Smithsburg, Funkstown, and Williamsport. Accordingly, the County treats both the reservoir and the overall health of the watershed as a Special Planning Area.
The use of the Edgemont Reservoir as a backup water source is currently on hold. An inspection of the reservoir performed by MDE on May 19, 2015, found that the condition of the dam was considered to be unacceptable due to ongoing seepage issues, which had the potential to lead to dam failure. The reservoir was drained in April 2016 in response to MDE’s concerns. At this juncture, the City of Hagerstown is weighing its options for the Reservoir with input from MDE, including dam repair, dam removal and drilling for groundwater at the site. The City does still have two water storage tanks on the west end of Hagerstown that are filled with water from the Potomac River to use as a backup water source.1
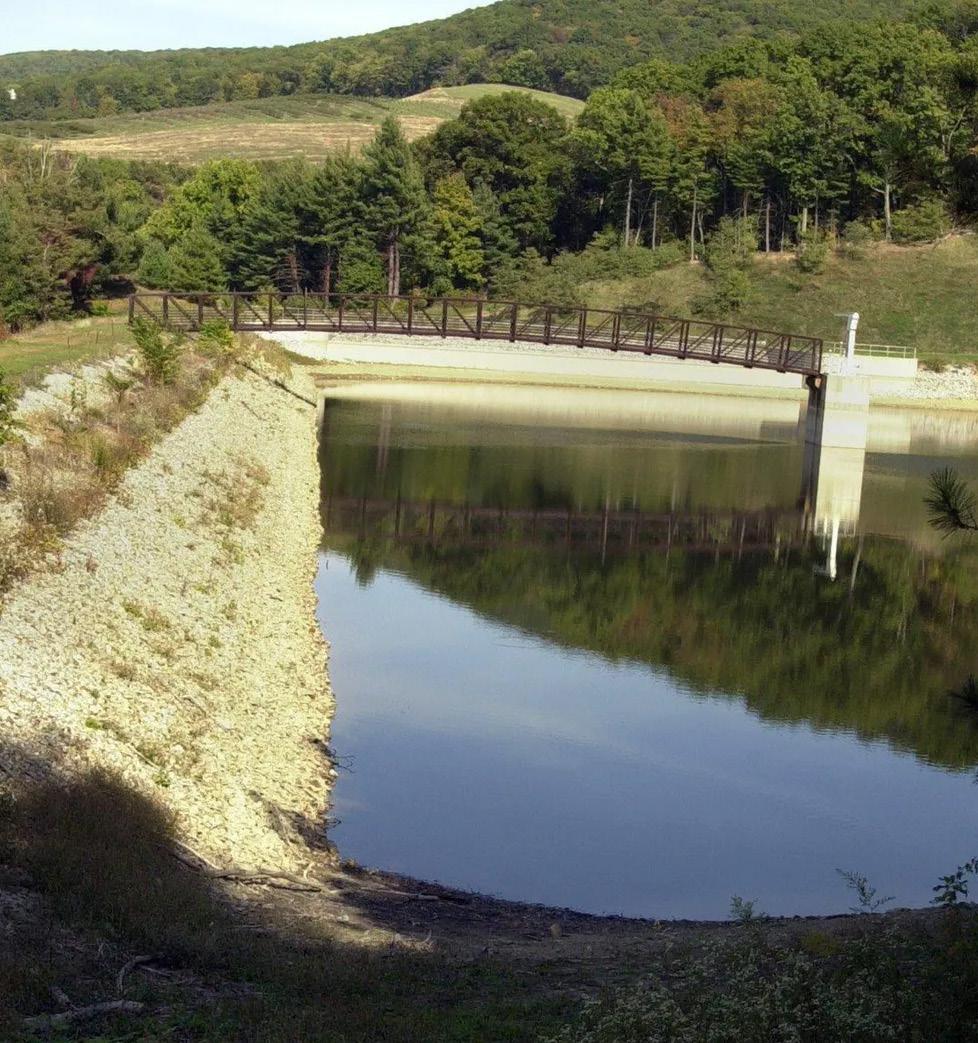
The Appalachian Trail (AT) is a Federally managed National Scenic Trail that stretches more than 2,100 miles through the Appalachian Mountains from Maine to Georgia. 40 miles of the AT run through Maryland between the Potomac River and the Pennsylvania State line, all of them inside Washington County. From a management perspective, the Trail is unique in that a variety of entities from Federal, State and local governments, nongovernmental organizations and volunteers cooperatively work together to ensure the Trail’s upkeep.

As one of those partners, Washington County’s role is to consider the appropriate arrangement of land uses surrounding the Trail corridor so that the Trail is buffered from incompatible development and viewsheds are preserved for Trail users. The County has achieved this objective through regulation within both the Zoning and Subdivision Ordinances. The Subdivision Ordinance (Section 411) requires a minimum buffer of 300 feet from the Trail for all new development adjacent to the Trail. The Trail buffer is in addition to building setbacks required by the Zoning Ordinance. The Planning Commission may approve a planted buffer as a substitute for the 300-foot setback where it can be demonstrated that maintaining the 300foot setback will cause the subdivision to be in non-compliance with other subdivision design requirements or where it can be demonstrated that a permitted use could not be established anywhere on the new lot in conformance with the 300 foot setback. The Zoning Ordinance (Article 4.21) also reiterates the Subdivision Ordinance requirement that the location of the Appalachian Trail must be shown on all applications subject to its requirements that are within 500 feet of the Trail boundary.
Steep slopes are defined as having an incline of 25% or greater. The behavior of steep slopes when it comes to the impact of development is very much influenced by the underlying geology, the type of soil produced by that parent material, the magnitude of the disturbance, and the overall severity (or lack thereof) of the prevailing topography.
The modification of a steep slope by clearing and/or grading land often produces a ripple effect on the downslope and potentially downstream communities from the area of disturbance. Slopes barren from the removal of vegetation can expose soils to repeated erosion and movement from rainfall. Rainfall carries the sediment into the nearest waterway, altering stream behavior and character, ultimately resulting in a wider and shallower watercourse. Over time, sedimentation into both natural waterways and into man-made water diversion devices such as culverts reduces their capacity to carry floodwaters and the results can be catastrophic.
Sedimentation into waterways also alters the delicate balance of streamflow, sunlight, temperature, and oxygen that sustains habitats of aquatic communities. As a result of sedimentation, water becomes turbid, blocking out sunlight and decreasing the amount of dissolved oxygen available as algal blooms form. This process, known as eutrophication, can often lead to conditions which make it nearly impossible for fish and other aquatic vertebrates to survive.
In addition to the environmental impacts of disturbing steep slope areas, there are physical hazards that can occur. Slope failure, a process more commonly known as a landslide, is a potential threat to public safety often resulting from improper development on steep slopes. Natural and human factors can contribute to potential slope failure. Natural risk factors include: water (soil saturation), slope (the steeper the slope, the more susceptible it is to failure), and geology (underlying rock types). Man-made factors that can cause landslides include: changes in slope (such as from road building), excess loading (construction or filling land), changes in vegetative cover, and shocks and vibrations.
Due to the severity of the topography and the nature of the underlying geology, Washington County has a reasonably high potential for slope failure. Relatively low population densities in the areas where steep slopes occur in Washington County mean that the incidence of significant property damages or bodily injury resulting from landslides is much lower than the potential. The drainage capacity of the soils underlying developed parts of the County also aids in lowering the incidence of losses due to landslides.

Steep slopes are also places that support biodiversity by creating a range of unique microhabitats that don’t occur in more uniform terrain. Some of these species may have been protected from past disturbance due specifically to the severity of the terrain, allowing rare species to survive and perhaps even thrive to a degree that wouldn’t be possible in a habitat with a greater incidence of disturbance. The protection of steep slope areas is, therefore, potentially instrumental in preserving the habitat of rare, threatened or endangered species.
Steep slopes are located in the Ridge and Valley Physiographic Province in the western part of Washington County as well as in the vicinity of major creeks such as the Conococheague, Licking, and Antietam Creeks, and along parts of the Potomac River. There are also steeply sloped areas in the Blue Ridge Province along South Mountain and Elk Ridge. The map below shows the location of steep slopes throughout the County.

Steep slopes are defined in multiple County Ordinances, including the Subdivision, Zoning and Forest Conservation Ordinances. Steep slopes as defined as those which are greater than 25%, or greater than 15% where the erodibility coefficient (K Value) is greater than 0.35. The Subdivision and Zoning Ordinances prohibit the location of septic systems or septic reserve areas on steep slopes and in Forest Conservation easements. BMPs recommended by the Soil Conservation District may be required by the Planning Commission for any development in steep slope environments under these Ordinances. The Forest Conservation Ordinance (Article 8) specifically targets steep slopes as priority locations for the retention or planting of forest cover, including in the establishment of new forest banks.
Restricting intense land use on steep slopes is often unnecessary due to the impracticality and high costs associated with engineering and construction in such an environment. Such projects require elaborate design for stable structures and often dictate a move to a more friendly terrain. Still there are uses that can overcome the limitations or occasions where the slope is an advantage for aesthetic reasons. These land uses should provide for the protection of the slope against damage during and after construction.
Ì Create linkages between priority natural resource lands to create a comprehensive system of protected lands that offer greater benefits than can be achieved with the protection of isolated parcels.
¾ Link developed areas to natural resource lands for purposes of tourism, community health, environmental protection.
¾ Maximize the use of existing land preservation programs that offer natural resource land protection (i.e. - CREP, Rural Legacy, Forest Conservation Fund spending, etc.) to achieve conservation goals.
¾ Consider permitting overlapping land preservation easements where easements protect different natural resources (i.e. - agricultural easements that do not protect forest cover). CREP contract, MALPF, Rural Legacy and Program Open Space lands are examples of where this could occur after preliminary consultation with State or Federal partners.
¾ Investigate the creation of a weighted ranking system to develop a priority list of lands where multiple sensitive areas overlap to identify where to focus protection efforts.
Ì Continue to pursue a multifaceted approach to enhance water quality throughout the County. Opportunities include:
¾ Inventory County owned lands for their potential use to satisfy stormwater or forest conservation mitigation requirements for County development projects.
¾ In addition to current efforts to create forested stream buffers along the Antietam and Conococheague Creeks, target use of Forest Conservation Fund spending for the protection of existing forest, or creation of new forest in the Upper Beaver Creek Watershed to support native brook trout habitat. Forest banking offers another potential method of creating or retaining forest cover in this watershed.
¾ Investigate opportunities to designate additional wellhead protection areas, particularly in areas underlain by Karst topography, to protect drinking water supplies.
Ì Utilize undeveloped portions of park lands for natural resource enhancement or protection.
¾ Many parks contain open areas which are available to visitor use, but do not contain facilities or amenities for visitors to use. Such areas should be considered tree planting or wildlife habitat restoration projects if they are located in sections of parks that are unlikely to be developed in the future (i.e. – distant to access points, unsuitable topography, etc.). Regional scale parks, or public lands along waterways should be strongly considered.
Ì Review the current list of Special Planning Areas and determine whether updates are needed to either the areas being included for protection or the regulations that govern them.
¾ Wellhead protection areas could be included as new Special Planning Areas
¾ Edgemont Reservoir Watershed Special Planning Area may no longer be needed in light of recent dam removal


During the 2006 legislative session, the Maryland General Assembly passed House Bill 1141 which requires that Maryland jurisdictions with zoning authority prepare a Water Resources Element (WRE) and adopt their WRE in the County’s Comprehensive Plan.
Local jurisdictions must:
• Identify drinking water and other water resources that will be adequate for the needs of existing and future development proposed in the Land Use element of the Plan; and
• Identify suitable receiving waters and land areas to meet the stormwater management and wastewater treatment and disposal needs of existing and future development proposed in the Land Use element of the Plan.
There are nine (9) incorporated municipalities in Washington County: Boonsboro, Clear Spring, Funkstown, Hagerstown, Hancock, Keedysville, Sharpsburg, Smithsburg, and Williamsport. Each of these communities provides public water and wastewater services to their residents through various combinations of ownership and operation. To date Boonsboro, Hagerstown, Hancock, Keedysville, Smithsburg, and Williamsport have developed and submitted a WRE and Municipal Growth Element specific to their jurisdiction. To the extent possible, the County’s WRE includes the most current data about each municipality to coordinate water resources, growth, and land-use planning.
Watersheds can be defined at many different scales. The United States Geological Survey (USGS) developed a ranked system for mapping all of the nation’s watersheds. They are grouped from largest to smallest. These areas are called Hydrologic Units and are assigned a number known as a Hydrologic Unit Code (HUC) based on size. Currently, the most detailed level of nationwide drainage basin mapping available from the USGS is the 8-digit HUC. This plan will utilize this system of 8-digit watersheds. As shown on Map 13-1, there are ten different 8-digit watersheds located either, in whole or in part, in Washington County. Small portions of two other watersheds straddle the boundary between Washington and Frederick Counties. Catoctin Creek and the Upper Monocacy Creek have small portions of their watershed that are statistically irrelevant. Therefore, those sections are included throughout this section as part of the Antietam Creek watershed as part of a line and stream analysis.
Map 13-1: 8-Digit Watersheds in Washington County
Source: Maryland Department of Natural Resources

Maintaining a sustainable water supply to meet current demands and provide for projected growth is vital to the future of Washington County. This means not only ensuring adequate water quantities but also that water quality is of a standard to provide safe drinking water. Evaluation of the County’s water resources consider a variety of planning factors including jurisdictional boundaries, water service areas, designated growth areas, watersheds, and hydrogeomorphic areas. This section will describe the demand for drinking water in Washington County including public and private water systems, and water for agriculture, business and other uses.
Drinking water is obtained from both surface water and ground water sources in Washington County. Surface water is defined to include water resources that remain above ground in the form of rivers, lakes, streams, and other water bodies. Groundwater is located in subterranean aquifers and contained within rock layers below the water table. There is a public perception that because we have numerous, and highly visible, large stream systems in our area that there is an adequately abundant level of water resources available. However, quantity, quality, and availability must all be addressed to develop a safe and sustainable drinking water resource. Disruptions to the natural hydrologic cycle, such as droughts or severe flooding, can affect both the quantity and availability of these water supplies. Land use practices also have good and bad effects on the hydrologic cycle which makes sound land use planning essential to preserving water resources.
The largest surface water supply in Washington County is the Potomac River. The river drains a watershed of approximately 14,670 square miles that include parts of Maryland, West Virginia, Virginia, Pennsylvania, and the District of Columbia. The volume and consistency of flow is what makes the Potomac River the primary surface water resource for drinking water in the County. According to the Interstate Commission on the Potomac River Basin (ICPRB), the highest recorded flow on the Potomac was 275 billion gallons per day while the lowest recorded flow was 388 million gallons per day. They also report that the average flow of the river is approximately 7 billion gallons per day, not including water supply withdrawals. Overall, about 600 million gallons per day of water from the river is used for domestic water supply.
The Potomac River supply is augmented by two reservoirs: Jennings Randolph located on the North Branch of the Potomac in Garrett County, MD and Little Seneca Lake located on Little Seneca Creek near Boyds in Montgomery County, MD. Releases are made from the reservoirs when low flow conditions of 600-700 Mgd are present. Low flow conditions result from low summer rainfall, low groundwater levels, and low precipitation levels over the previous 12 months1. The Potomac River has a minimum flow-by requirement of 100 Mgd (the minimum flow needed to maintain suitable conditions for fish and aquatic communities); summertime demand ranges between 400 and 700 Mgd.
While there are other sources of surface water that could be used, seasonal variability of stream flow and the inability to meet flow by requirements established by the State limit their availability.

Because the availability of ground water supply is commonly dependent upon the underlying geologic conditions of the area it is important to understand how water gets into the ground and how it flows and interacts with the subsurface. For this analysis, data from the USGS and the Maryland Geological Survey regarding water yield characteristics were used. According to the USGS, there are three (3) primary hydrogeomorphic regions within Washington County, the Blue Ridge, Valley and Ridge Carbonate, and Valley and Ridge Siliciclastic. There is a fourth, very small hydrogeomorphic region in southern Washington County in the Israel Creek watershed known as Piedmont Crystalline. Because the area is so small and does not have a high statistical variance from the geology surrounding it, this area is included in the Blue Ridge region for analysis purposes.
Source: USGS
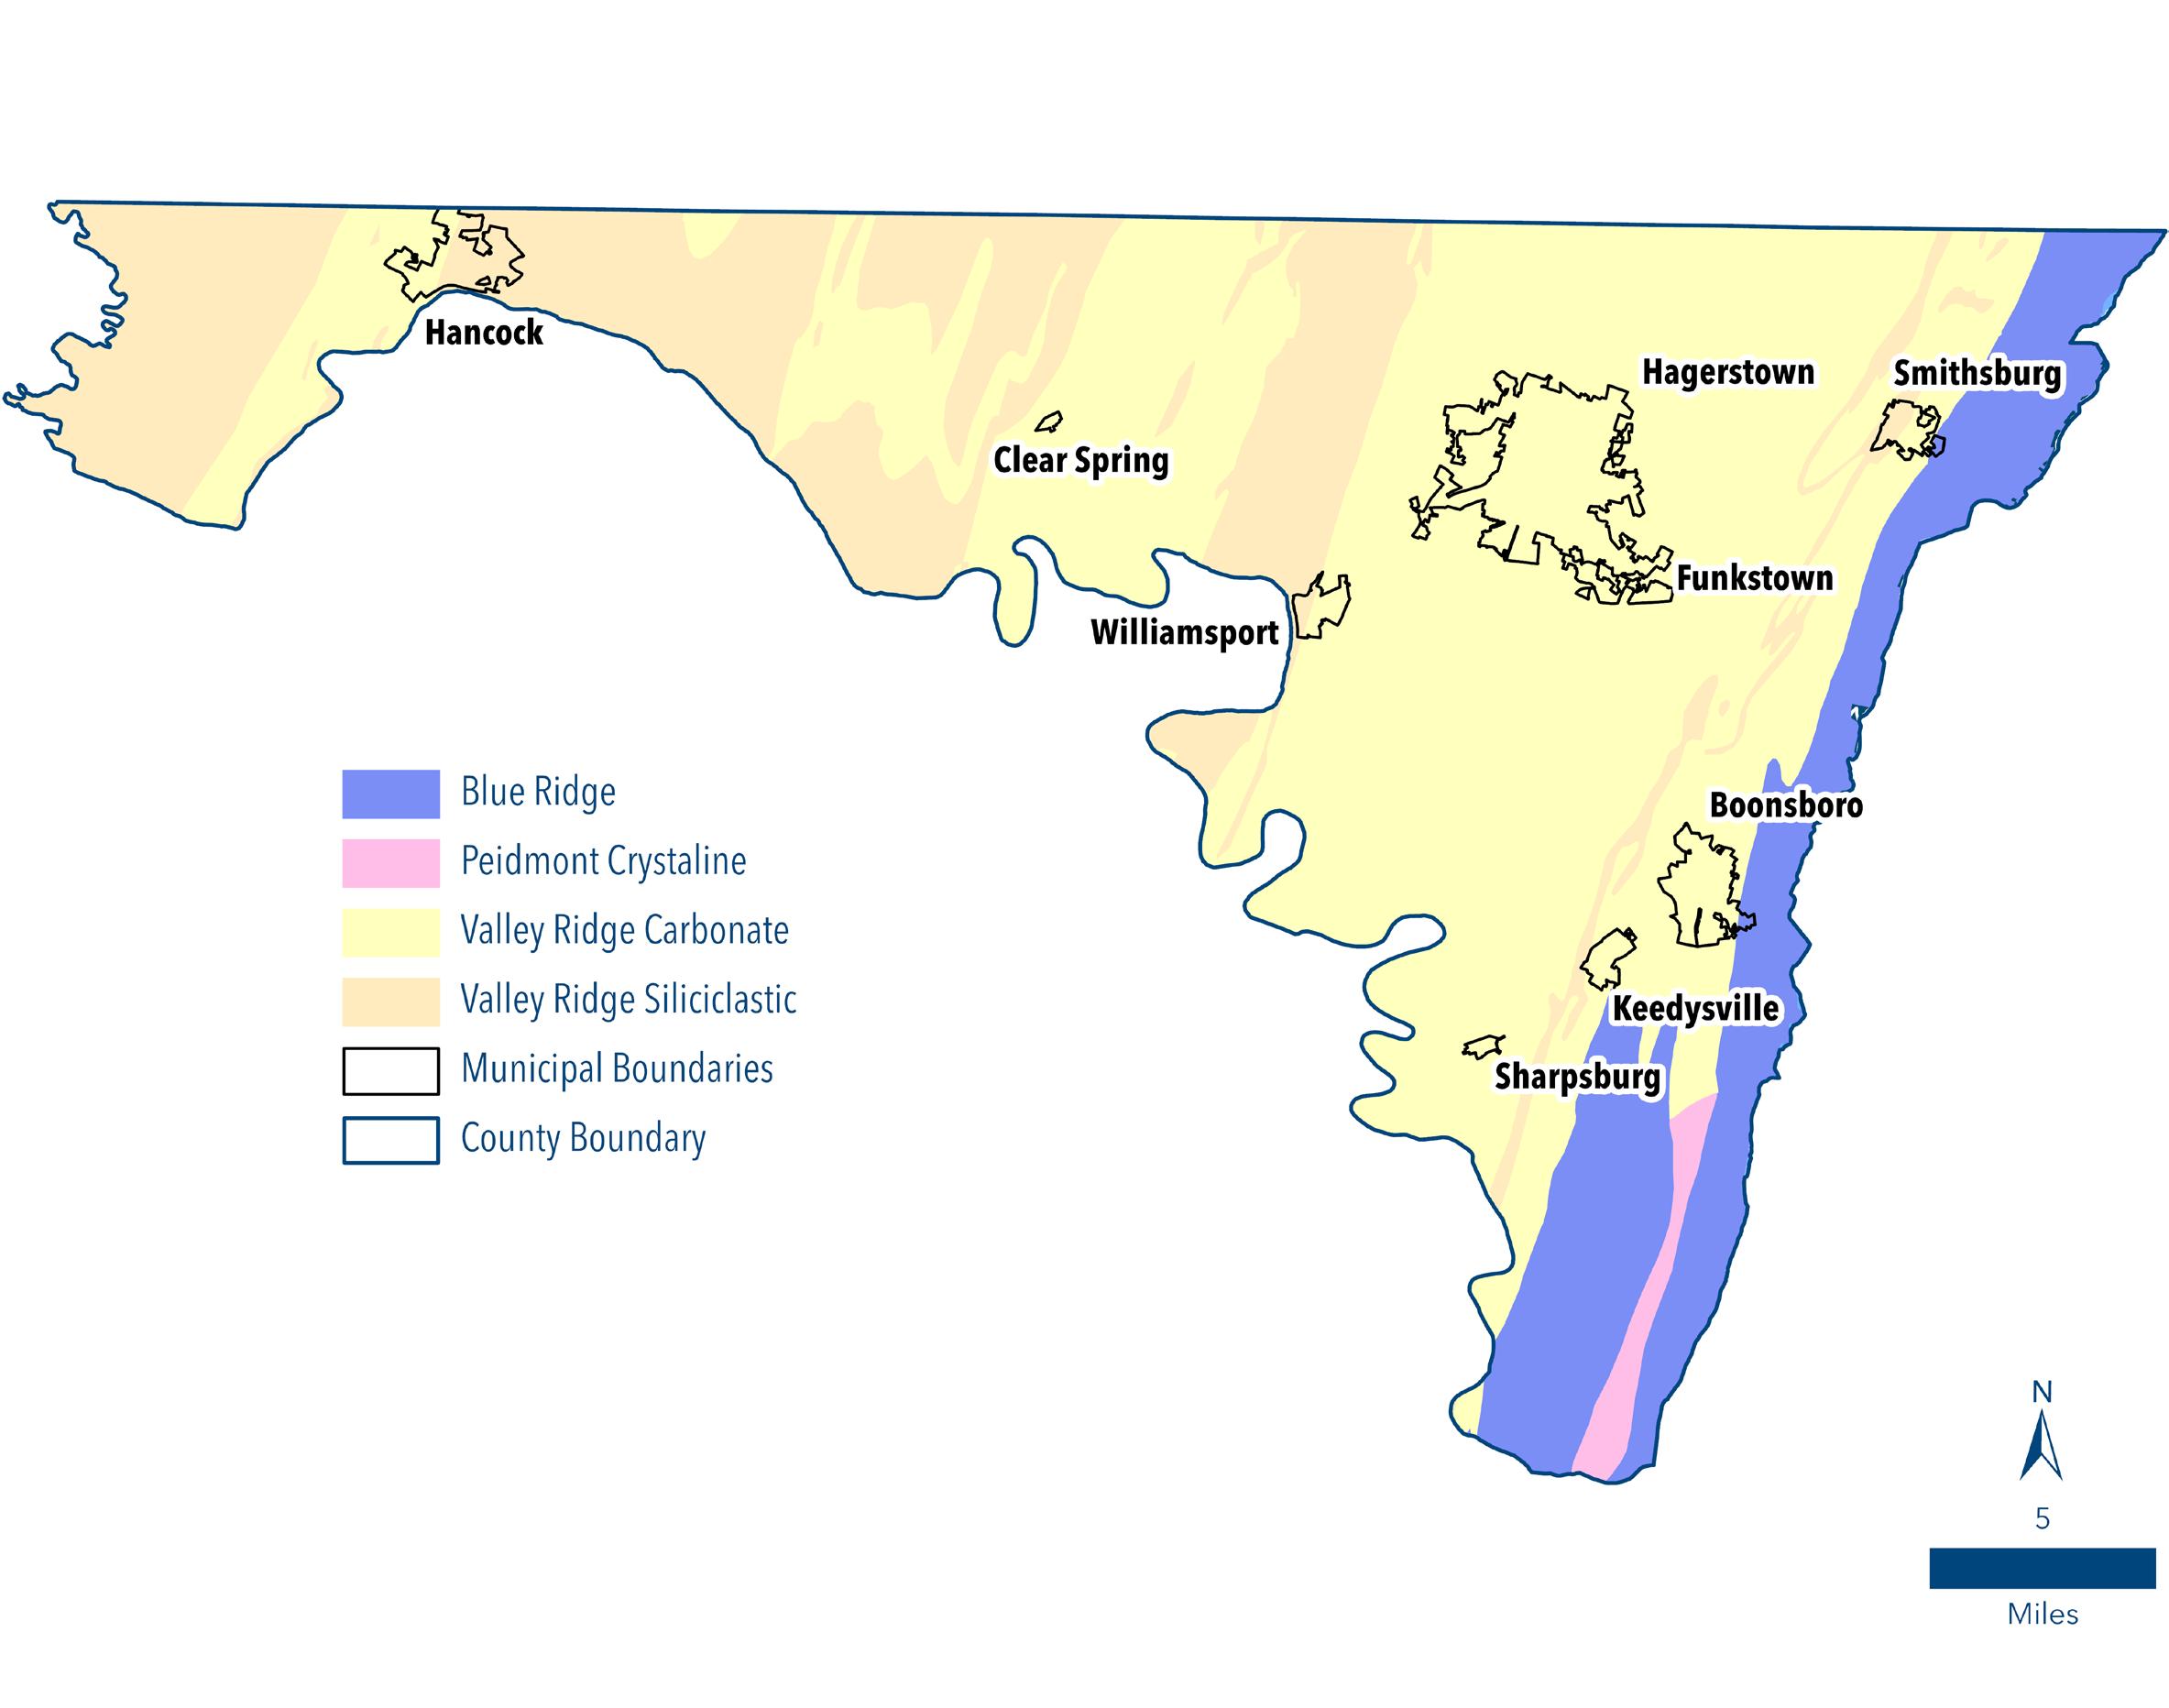
Within the Blue Ridge (BR) region only small differences exist in the water-bearing capacities of the geologic formations. According to compiled data, the mean yield from wells is less than 10 gallons per minute (gpm) with a range from 1 to 60 gpm. The best yields appear to be located in the Catoctin metabasalt formation in the Cascade-Highfield-Fort Ritchie area. Springs in this water province, although numerous, are generally small with discharges ranging from less than 10 to 100 gpm. The chemical quality of groundwater is considered suitable for most uses with spring water lower in mineral content, but slightly more acidic than well water.
The Valley and Ridge Carbonate (VRC) hydromorphic region is the largest section of geology in the County underlying nearly two-thirds of the total land area of the County. The quantity of groundwater available in the limestone and dolomite aquifers of the Hagerstown Valley is quite large. The typically karst characteristics of carbonate geology provide the highest storage and capacity of groundwater but also leave water resources vulnerable to contamination. Wells drilled in the Hagerstown Valley yield from 2 to 400 gpm, with the Tomstown dolomite, Conococheague limestone, and Stonehenge limestone producing the highest yields. Springs also occur throughout the Hagerstown Valley water province and have a low discharge range from 25-100 gpm to a high discharge range of 2000-3000 gpm.
The third major region in Washington County is the Valley and Ridge Siliciclastic (VRS) province. This area extends westward from the Fairview-Powell Mountains to the western border of the County. While the geologic materials in the subsurface are similar and consistent with a Siliciclastic province, in Washington County there is a distinct difference in water recharge calculations in areas west of Sideling Hill.
In the eastern portion of the VRS region from Fairview Mountain to Sideling Hill, shale is the dominant rock type. Groundwater recharge is low because shale soils typically contain a low to moderate moisture holding capacity and a relatively high direct surface runoff result. Hydrogeologic conditions, therefore, are unfavorable for large capacity wells of any sustained yield. Springs occur in all of the formations in the Hancock-Indian Springs water province, and are for the most part, gravity fed. The western portion of the VRS region between Sideling Hill and Sideling Hill Creek contains a geologic subsurface that produces a very low water yield. The best well in the province yields only 36 gpm which indicates the absence of any significant groundwater supplies.
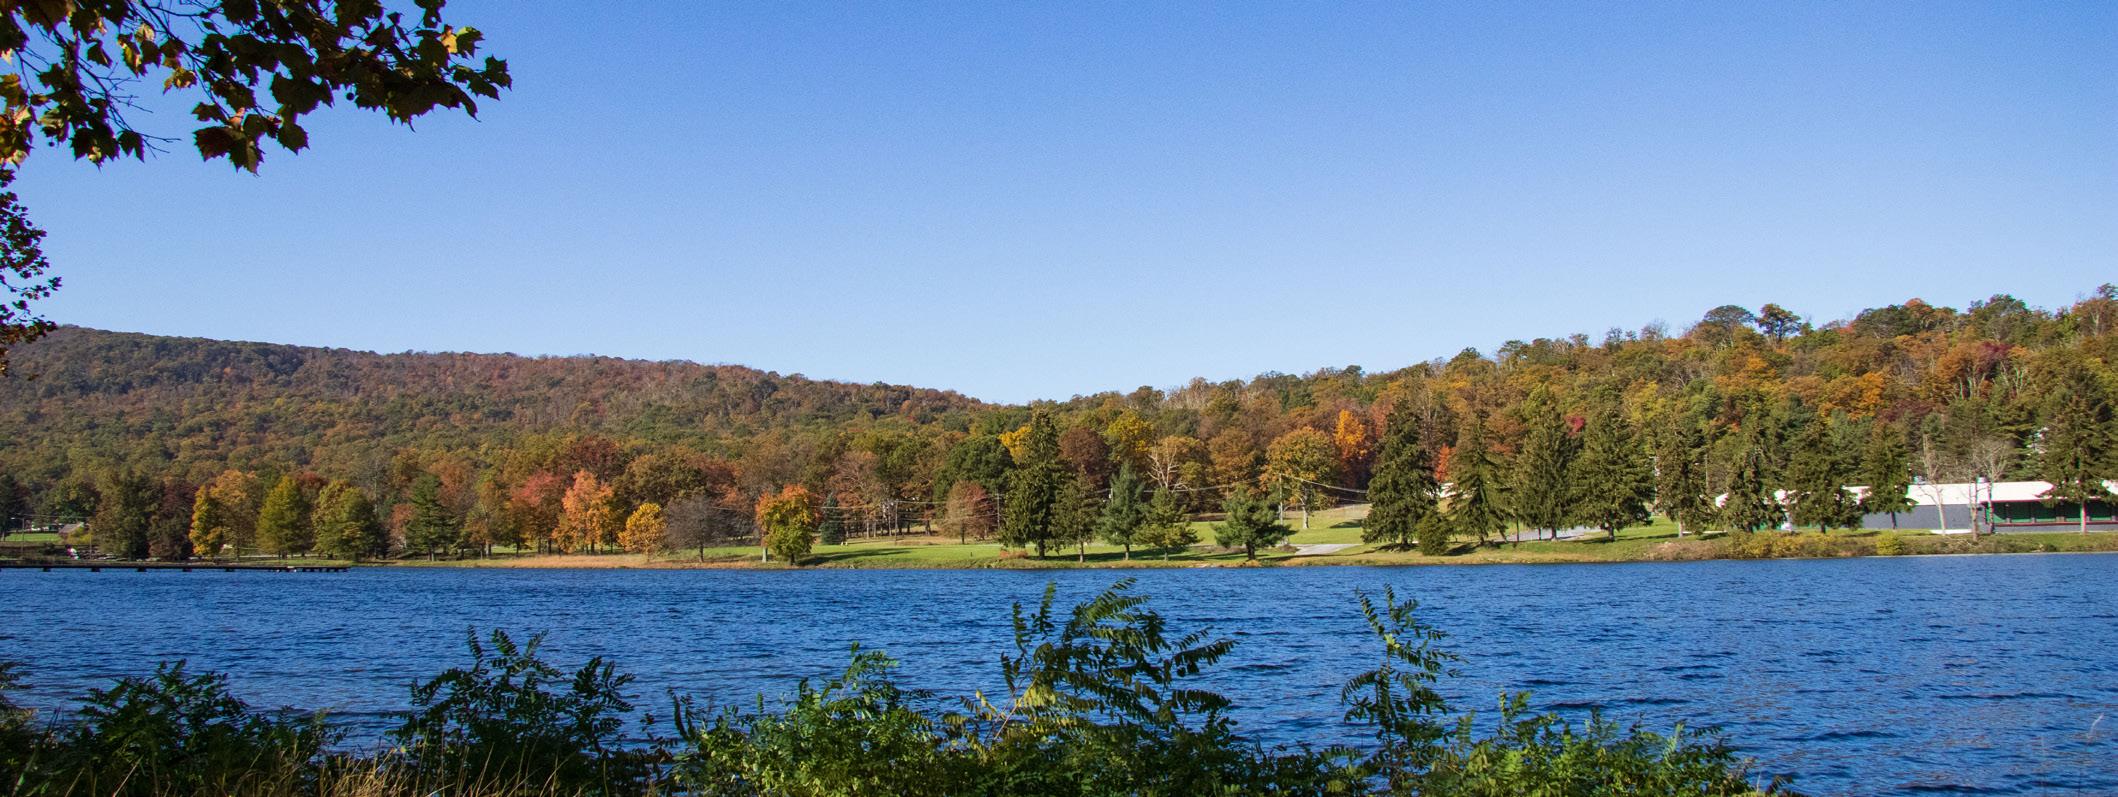
Groundwater supply is difficult to predict because of the many variables that effect the hydrologic cycle. Climate, vegetation, geology, and land use can all play significant roles in the potential capacity of underground water supplies. MDE has recommended using a water balance methodology to identify and estimate available groundwater supplies based on water recharge data for the different hydrogeomorphic regions within the State. Using the recommend methodology outlined in MDP’s Models and Guidelines for the Water Resources Element (No. 26), the estimated groundwater availability for Washington County is illustrated in the table below.
As noted in the Models and Guidelines document on page 61, there are some limitations and warnings on the accuracy of the data. First, it should be noted that this analysis calculates an “upper limit” of potential within an aquifer that many not be realistically extractable. Therefore, this analysis is meant to be used for planning purposes only and may not be used in place of site-specific analysis for withdrawal permit approval. This analysis may also have a high margin of error based upon extreme changes in climate (i.e. droughts, snowfall levels, flooding, etc.). Some hydrogeomorphic regions are more susceptible to significant changes in climate than others.
There are multiple public and private water supply systems under varying degrees of ownership and operation in the County. They range in size from a few thousand gallons of withdrawal and usage per day to millions of gallons per day. As shown in the chart below, the majority of freshwater use and withdrawal is for public and private (domestic) drinking water.
Approximately 42,570 households in the County and municipalities receive drinking water from a public or private community water system.
Publicly owned and operated water systems exist mostly within designated growth areas of the County but also exist in rural areas where water quality and/or quantity issues have created the need for intervention. Public water systems in the County have a combined permitted allocation of over 17.2 million gallons per day and primarily depend upon surface water resources.
There are currently two water treatment facilities in the County that use surface water from the Potomac River as a raw water source for treatment, the City of Hagerstown and the Town of Sharpsburg. Currently, the City of Hagerstown holds a Water Appropriation and Use Permit for the withdrawal of water from the Potomac River in the amount of 15 Mgd This is the sole public water drinking source for the Urban Growth Area. The County holds the appropriation permit for the Sharpsburg treatment facility in the amount of 200,000 gpd.
The only other surface water drinking resource is the Edgemont Reservoir. Also known as the Warner Gap Hollow Dam, it was built in 1902 and is currently owned by the City of Hagerstown. Water impounded and stored within the reservoir drains from Warner Hollow and Raven Rock Runs. Both streams are located within the larger Antietam Creek watershed. At full capacity the reservoir is estimated to be able to hold nearly 85 million gallons of water. The impounded water is transmitted to the William M. Breichner treatment facility located in the Town of Smithsburg. According to the City’s Comprehensive Plan, this treatment facility has a maximum treatment capacity of 4.5 Mgd and has a permitted appropriation permit of 700,000 gpd. In 2015 the reservoir was drained due to ongoing seepage issues in the dam embankment and concerns with potential dam failure. The City is continuing to negotiate with MDE regarding the scope of repairs and amount of funding available for the reservoir to again be used as a surface water impoundment. Therefore, in the interim, this resource is not being included in potential drinking water availability.
The remainder of the publicly owned and maintained drinking water systems in the County rely upon ground water resources or purchase water as a wholesale user. Three municipalities who own and maintain drinking water distribution systems in the County purchase water from the City of Hagerstown and pay a wholesale rate based upon permitted allocation agreements. Those communities are Funkstown, Smithsburg, and Williamsport. Other municipalities that rely upon ground water resources include Boonsboro (which also serves the Town of Keedysville), Clear Spring, and Hancock. There are also four non-incorporated areas of the County with public water systems that rely upon groundwater for drinking water supplies. They include Elk Ridge, Mt. Aetna, Sandy Hook and Highfield/Cascade/Fort Ritchie areas.
The table below (Table 13-3) shows the existing and projected future drinking water demand as well as projected available capacity for each of the public water systems in the County. Projected capacities are derived from two growth scenarios described in the Land Use Element. For this plan there are two growth scenarios being analyzed for projected growth and demand, a moderate growth and a high growth scenario. The moderate growth scenario assumes a historic level of growth to continue while the high growth scenario assumes a growth rate 50% above the moderate scenario.
Under a moderate growth scenario, there are two facilities that may exceed their current permitted allocation. Both municipalities are also projected to have demand exceed capacity under high growth scenarios, however, they are currently working on plans to bolster future water demands. Under the high growth scenario, it is projected that the water demand for the Urban Growth Area will likely exceed permitted capacity. This analysis supports the need for collaboration between the County and the City to prepare for future anticipated needs.
Privately owned and operated water systems typically exist in the rural areas of the County for a specific use or development that was established prior to regulatory health statues regarding water quality. Developments include uses such as mobile home parks, educational facilities, and community service facilities. These small private water facilities have a combined permitted allocation of just over 100,000 gpd and primarily depend upon ground water resources. Examples include Brook Lane, Conococheague Apartments, Saint James School, San Mar Children’s Home, and Fahrney-Keedy Home and Village. In accordance with the adopted Water and Sewerage Plan for the County, expansion of existing/establishment of new private community water systems that are maintained by the County are prohibited. Facilities under private management are regulated and monitored by MDE.
County residents outside the available limits of public/private community systems depend primarily upon ground water extraction from a private on-site well. There are a few locations where cisterns are still used, however, the storage tank must be detached from a rooftop gathering system and may only contain potable water purchased from a certified hauler. The State no longer permits installation of new water holding tank systems such as cisterns as a potable water supply. Rainwater catchment systems such as rain barrels and other holding tanks may be used for non-drinking water uses such as irrigation.
The majority of private wells that serve residential, commercial and industrial uses in the County are located with the Valley and Ridge Carbonate geologic structure. These areas typically have the highest volume and recharge aquifers in the County. They are also the most susceptible areas for ground water contamination due to the karst characteristics of the rock formations.
The second largest category of water usage in the County is for agricultural purposes, more specifically related to aquaculture. A small amount of the agricultural water use in the County is associated with livestock watering and crop irrigation. The largest usage of agricultural demand is associated with the Albert Powell Fish Hatchery. The hatchery is one of three cold water fish hatchery facilities owned and operated by the State. Personnel at the hatchery hatch more than 600,000 trout eggs annually that are used to supply fall and spring stocking seasons across the State.
The water used by the hatchery is supplied by the second largest spring in the State which produces an average of 3400 gallons of water per minute.
In addition to water quantity evaluations, water quality of the ground water is an integral part of evaluating the drinking water supplies in the County. Different issues can exist for ground and surface water sources, however, most of the underlying geology of the County is karst in nature, therefore much of the County is potentially under the influence of surface water. Because of this unique geology, most areas of the County can be susceptible to a wide array of contaminants.
Surface water is typically vulnerable to contamination from non-point sources such as runoff from impervious surfaces and agricultural lands. These sources of contamination can cause water quality concerns such as sedimentation, fecal contamination, and contamination from potential spills. Ground water quality can be affected by more naturally occurring substances such as radon or iron but also can be contaminated by fecal coliform from septic systems that are prevalently used in the rural areas. As noted in the Mineral Resources Chapter, ground water can also be impacted by quarrying operations. The State has delineated zones of dewatering influence where operations may impact wells of individual residences or community systems.
Source Water Assessments have been completed by MDE to evaluate public drinking water systems and identify their vulnerabilities to contamination. They do not assess the treatment plant or the distribution system through which the water passes. These are assessed separately through other mechanisms. Details on each of these systems are available on MDE’s website. The most common water quality concerns include sedimentation, nitrates, radon, fecal contamination (Cryptosporidium and Giardia), and microbiological.
Wellhead Protection is a strategy designed to protect public drinking water supplies by managing the land surface around a well where activities might affect the quality of the water. Between 2000 and 2005, the MDE published a series of assessments for each of the County’s community water systems that rely on groundwater. Components of MDE’s water supply assessment include:
• Delineation of an area that contributes water to the source
• Identification of potential sources of contamination, and
• Determination of the susceptibility of the water supply to contamination.
Potential sources of contaminants include agricultural activities, gas stations, and industrial uses that store and use various liquids such as gasoline, diesel fuel, and kerosene. The improper use, storage, disposal, or release of these or other substances from agricultural, industrial, or residential activities can harm groundwater quality. The contaminants may include volatile organic compounds, radionucleotides, synthetic organic compounds, microbial contaminants, and nitrates. This Comprehensive Plan recommends adoption of a wellhead protection ordinance.
One of the major goals of the Water Resource Element is to better link land use plans with water and wastewater capacity management plans. As shown in Table 13-3, public water systems across the County could likely accommodate moderate growth scenario projections. There is a slight deficit within the Boonsboro growth area, however, improvements are currently being pursued by the Town to improve their water system through Inflow and Infiltration (I&I) mitigation. High growth scenarios provide a less optimistic view of available capacity.
While most systems have available capacity, a few are projected to fall short of meeting demand. The most concerning of these systems is the City of Hagerstown. As the largest utility provider of public water for the UGA and several municipalities, the large amount of unmet allocation could create long term capacity issues if steps are not taken presently. The city treatment facility can increase its withdrawal permit; however, treatment of the water supply is currently at its peak capacity due to the age of the system and their transmission lines. Steps should be taken now to plan for future improvements that will be necessary to adequately service growth within the UGA and several municipalities. Recommendations are included at the end of the chapter that address these concerns.
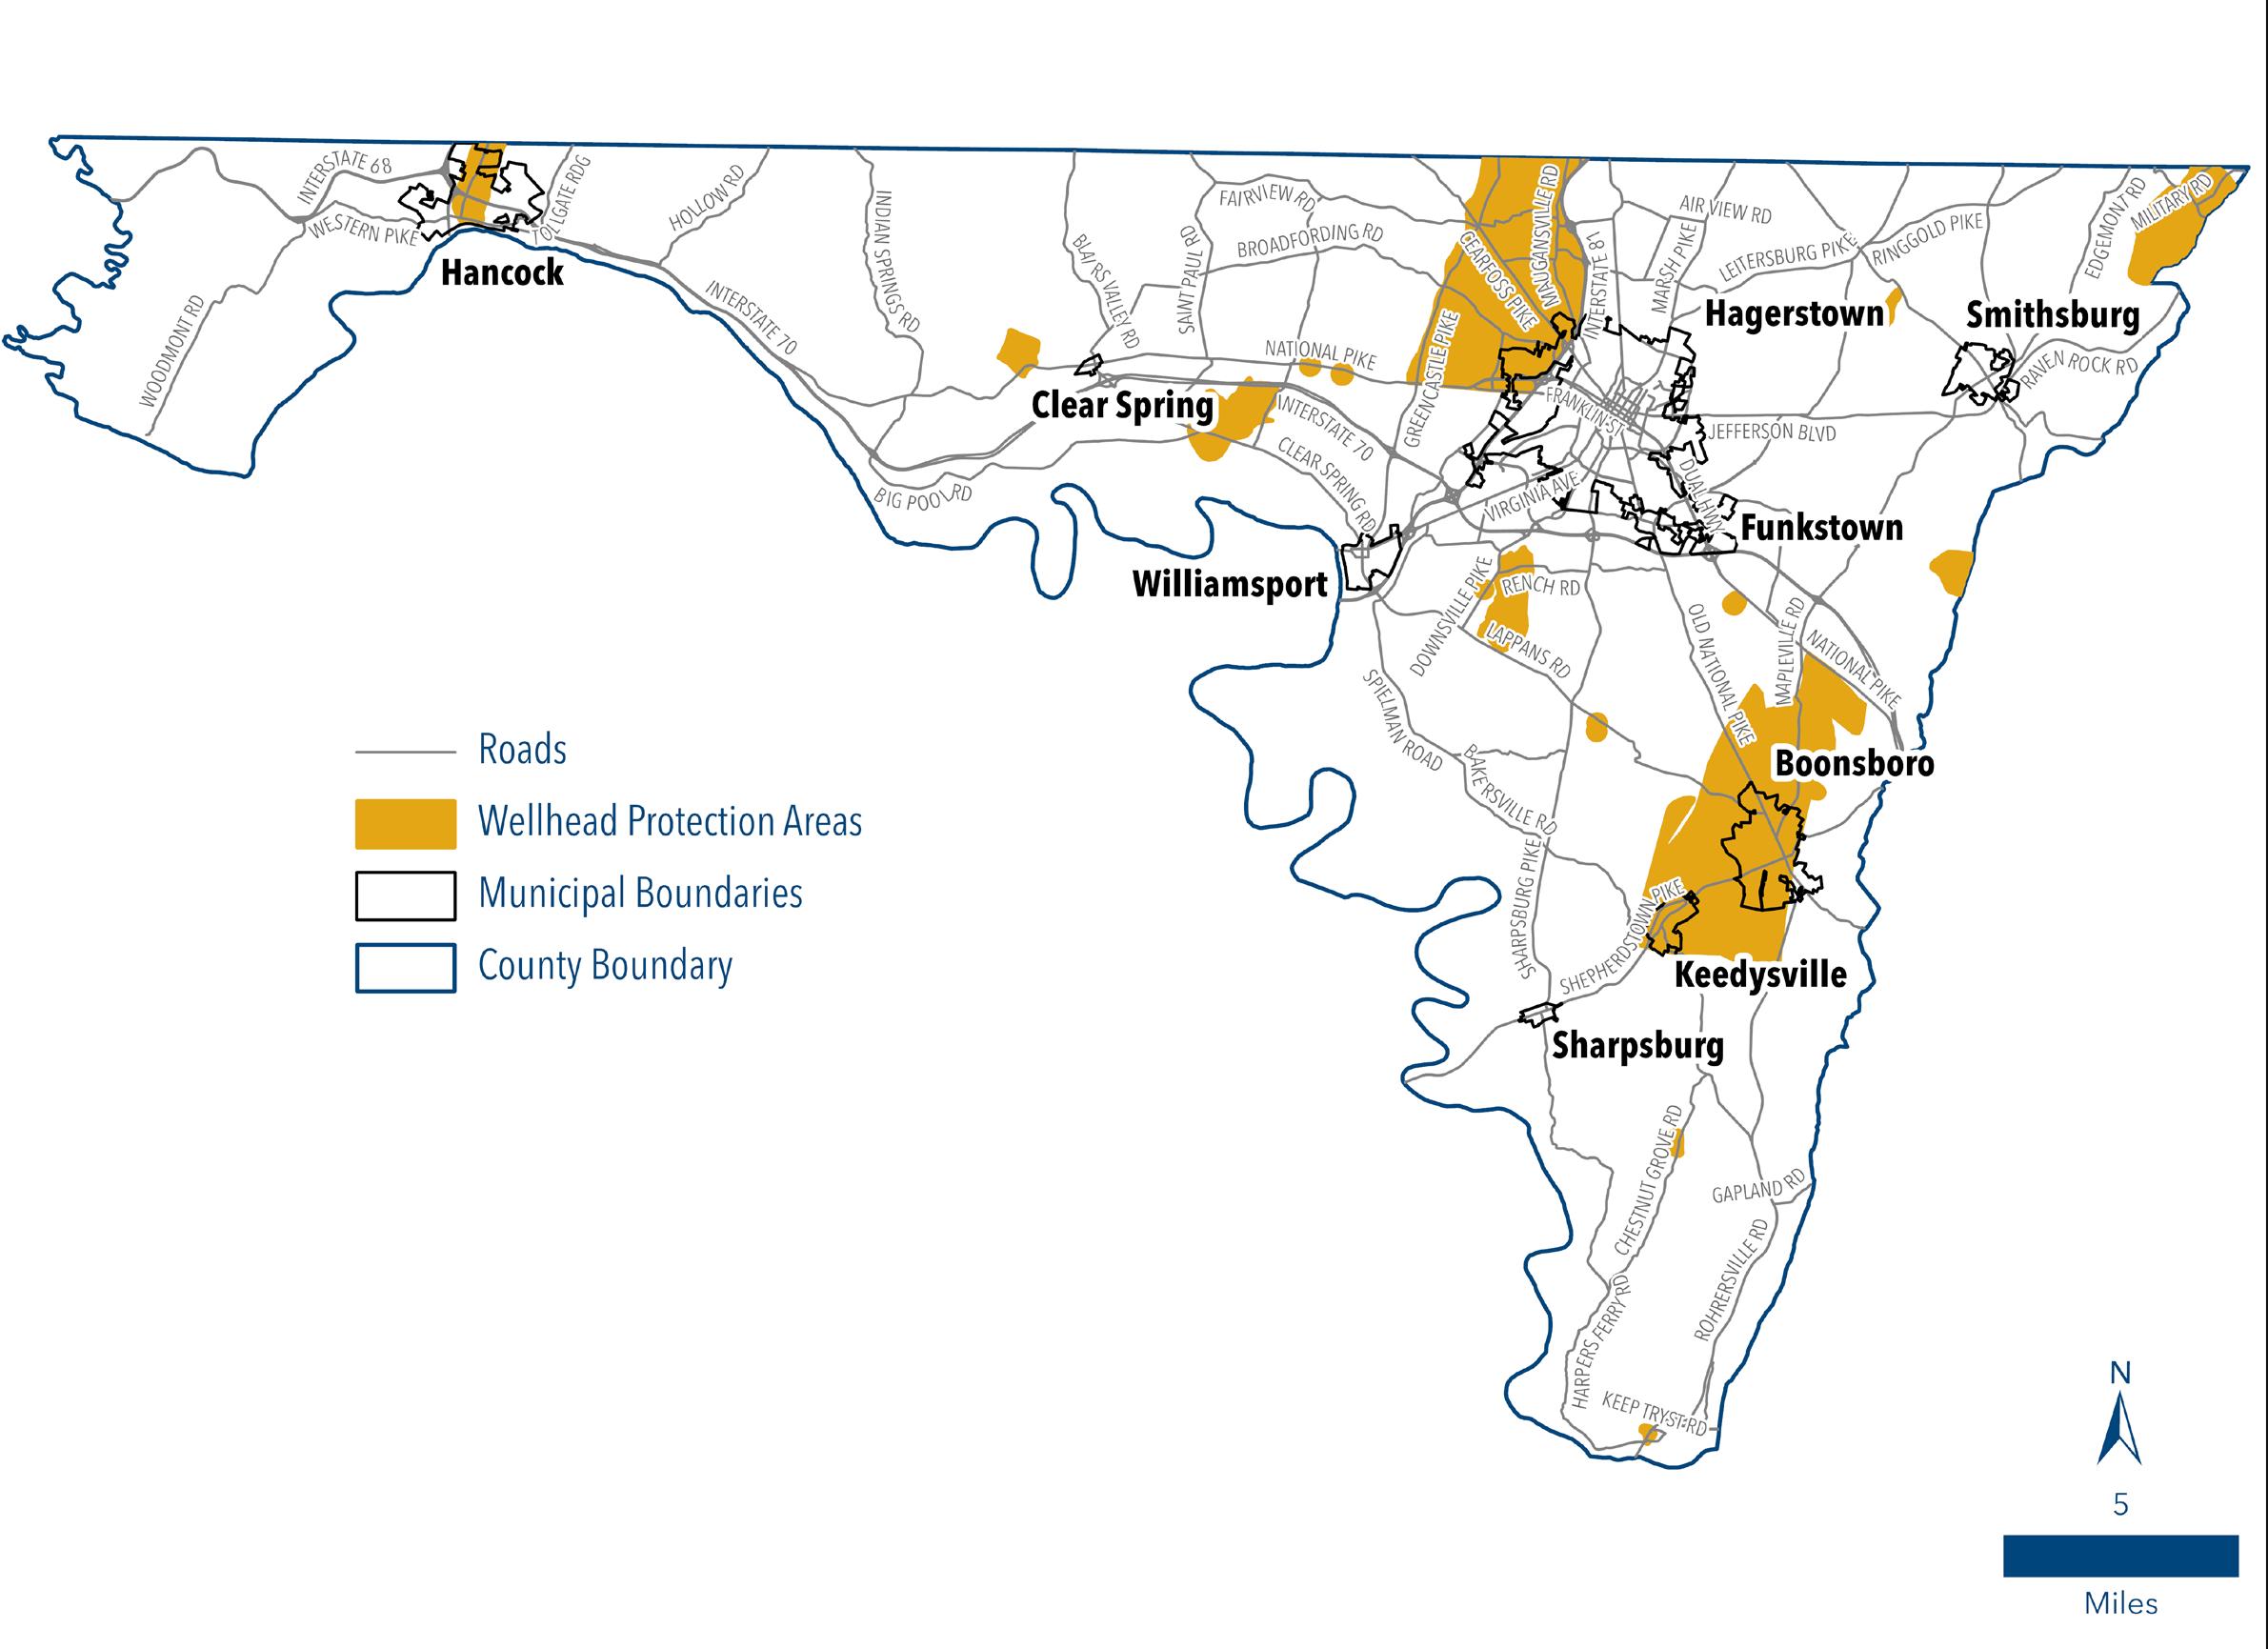
Surface Water Sources
• Increased withdrawal from the Potomac River – The City of Hagerstown currently has a water appropriation permit from the State of Maryland to withdrawal up to 15 Mgd. According to the City’s Water Capacity Management Plan, once demand reaches 85% of the current appropriation, they can begin working with MDE on an increase in appropriation. The current treatment facility has capacity to handle up to 18 Mgd, however, deficiencies exist in the current distribution system that preclude an increase presently. Significant investment will need to be made by the City to its existing transmission mains to accommodate an increase in allocation. The City also notes in their Water Resources Element that additional system projects to address deteriorating pipe, system pressure and water quality will be necessary to handle the increase.

• Edgemont Reservoir – Continued seepage issues in the earthen dam facility caused MDE to declare the structure unacceptable and the reservoir was drained in 2015. Other issues have been found in the spillways of the dam that will need to be addressed. The City is continuing to negotiate with MDE regarding the scope of repairs and amount of funding available to revive this facility as a drinking water source. At full capacity the facility can provide up to 750,000 gpd.

Ground Water Sources
The aquifers found in the Valley and Ridge Carbonate regions of the Hagerstown Valley are typically plentiful and have larger storage capacity than other areas making them a likely target for additional ground water supply. These areas have historically been adequate to service public systems and individual wells. While this region is generally the most prolific, it can also be erratic and susceptible to contamination due to the karst nature of the underlying geology.
With limitations in the City’s treatment capacity and distribution system, the County may investigate options in establishing another public water source within the Urban Growth Area. A new system would likely require the drilling of wells and installation of appropriate water treatment facilities. Depending upon the gallons generated by the wells, the level of service could range from small and localized to modest and regional. No specific locations have been determined at this time.
Water conservation is a low-cost option for extending the life of existing water supplies. The Maryland Water Conservation Plumbing Fixtures Act (MWCPFA) requires that new plumbing fixtures sold or installed as part of new construction are designed to conserve water. Future efforts to upgrade the water distribution system will contribute to water conservation by reducing system water loss due to leaks.
Beyond these regulatory requirements and major capital projects, the County also proactively promotes water conservation through a concerted public education program, and by coordinating with the State to seek funding for upgrades to appliances and water fixtures. Careful planning of stormwater management techniques, as well as the location and species of landscaping on County streets can help to reduce or eliminate outdoor watering needs, thus reducing water demand.
Water reuse generally takes the form of what is known as graywater. According to State definitions, graywater includes bath/shower water and lavatory sink water but does NOT include toilets, kitchen sink, dishwasher or laundry water. Uses depend upon the level of treatment but may range from outdoor irrigation to toilet flushing. Graywater reuse is heavily recommended and sometimes required in LEED (Leadership in Energy and Environmental Design) certified development.
Wastewater management is a key service that influences land development patterns and impacts water resources. This section will describe the demand for wastewater serviced in the County, evaluate pollutant loading that can be discharged into stream and rivers, and consider areas of concern and potential solutions related to wastewater treatment and disposal.
There are currently ten (10) public wastewater treatment plants (WwTPs) in Washington County. Treatment technology at these various facilities range from lagoon systems to enhanced nutrient removal systems (ENR). The table below summarizes these facilities, their discharge location and the current treatment technology.
The County owns and operates five (5) of the WwTPs including the Conococheague, Antietam, Smithsburg, Winebrenner, and Sandy Hook facilities. The remainder of the WwTPs are owned and operated by municipalities.
Privately owned and operated wastewater systems typically exist in the rural areas of the County for a specific use or development that was established prior to regulatory health statues regarding water quality. Developments include uses such as mobile home parks, educational facilities, and community service facilities. These small private wastewater facilities generally have a very small treatment capacity and range in design capacity between 6,000 gpd to 50,000 gpd. Examples include Brook Lane, Hunter Hill Apartments, Highland View Academy, Greenbrier State Park, and Fahrney-Keedy Home and Village. In accordance with the adopted Water and Sewerage Plan for the County, expansion of existing/establishment of new private community wastewater systems that are maintained by the County are prohibited. Facilities under private management are regulated and monitored by MDE.
Residences and businesses outside of the County’s community sewerage service areas treat their wastewater with onsite sewer disposal systems (OSDS). It is estimated that there are approximately 59,600 residential septic systems in Washington County.
These systems are intended to be temporary in nature as an interim solution until public facilities can be extended to service the development. However, in rural communities such as Washington County, these systems have become more permanent due to the infeasibility of service extension to a large portion of our rural areas. Depending upon the age of the structure/development, these facilities vary in treatment process from cesspools and seepage pits to Best Available Technology (BAT) systems.
The following table (Table 13-4) depicts the current WwTP capacities, their current demand, and their projected demand. It is important to note that this chart includes facilities not under the management of the County due to their inclusion in County designated growth areas. Information related to treatment facilities not under the management of Washington County has been extracted from each of the utility’s jurisdictional Comprehensive Plans with the exception of Hancock. The Town of Hancock submitted a Water and Sewerage Plan amendment in 2021 that included data for a proposed increase in capacity. Data from that amendment has been used in this chart.
The purpose of including the non-County managed facilities is to acknowledge impacts of potential development under County jurisdiction on municipal utilities. With the exception of the Urban Growth Area which surrounds the City of Hagerstown, there is very little anticipated impact on municipal wastewater utilities.

Unless otherwise noted, it is assumed that 1 EDU = 200gpd
1 Boonsboro assumes 1 EDU = 250 gpd
2Smithsburg assumes 1 EDU = 235 gpd
Nitrogen and phosphorus (more generally referred to as “nutrients”) from WwTPs, stormwater, and other sources are the primary contributors to degraded water quality in the Chesapeake Bay and its tributaries. Excess nitrogen and phosphorus in an aquatic ecosystem cause a wide range of problems, including algal blooms, loss of oxygen in the water, fish kills, and the loss of aquatic vegetation. This imbalance is called eutrophication, which is a widespread problem that can be remedied by decreasing input rates of nitrogen and phosphorus into the waters locally and therefore the Chesapeake Bay.
To address nutrient discharges into the Bay, water and sewer planning must consider the “assimilative capacity” of a receiving body of water. Assimilative capacity refers to the ability of a natural body of water to receive wastewater or toxic materials without harmful human effects and damage to the aquatic life of a water body. In basic terms, the total contribution of pollutants to the waters of Maryland (point and non-point combined) should not exceed the capacity of those waters to assimilate pollutants. This section describes the key limits on assimilative capacity as they apply to the County’s WwTPs (some of these measures also apply to non-point nutrient sources, as described later in the chapter).
One measure of assimilative capacity is the Total Maximum Daily Load (TMDL), required under the Federal Clean Water Act. A TMDL is the maximum amount of pollutant that a water body can receive without resulting in impaired water quality. In essence it quantifies an upper threshold for pollutants or stressors. Whereas point source caps only address WwTPs and other point sources, a TMDL accounts for all sources of the given pollutant, including point sources and non-point sources (such as stormwater, agricultural runoff, or discharges from septic systems). Water bodies are classified as “impaired” when they are too polluted or otherwise degraded to support their designated and existing uses. (Defining designated uses will be discussed later in the chapter.) The impaired waters list is called the 303(d) list, in reference to the section in the Clean Water Act that establishes TMDLs. The table below shows the list of watershed impairments in Washington County.
Antietam Creek Bacteria, Nutrients, Sediment
Conococheague Bacteria, Nutrients, Sediment
Greenbrier Lake Nutrients
Marsh Run Sediment
Potomac River (Washington County)
Nutrient, Sediment
Only one TMDL has been established in the County. The maximum daily loading of the nutrient phosphorous in the Antietam Creek watershed is 2,747 pounds per day2.
Another factor relating to assimilative capacity is antidegradation—the State policy that significantly limits new or expanded discharge permits that would degrade water quality. The focus of the antidegradation policy is on Tier II (high quality) waters, as defined by the US Environmental Protection Agency (EPA).
Maryland’s antidegradation policy significantly limits new discharge permits and expansions of existing discharge permits that would degrade water quality. In these areas, new nutrient discharges can be permitted if they do not degrade existing water quality. Sideling Hill Creek is the only Tier II water segment in Washington County. There are currently no WwTP discharges into this stream segment nor are any proposed by the County.
To address nutrient loads from point sources such as WwTPs, the State has established Chesapeake Bay Tributary Strategy point source caps. These caps are numerical limits on the amount of nitrogen and phosphorus that WwTPs can discharge to the Bay and its tributaries (expressed as pounds per year of nitrogen and phosphorus).
To date, specific point source caps have not been established for any of the County managed WwTPs. It is anticipated that the Smithsburg WwTP will be upgraded to its maximum permitted capacity of 0.600 Mgd at some point in the future. There is currently a project underway that will upgrade the plant to meet ENR standards and expand capacity to 0.450 Mgd At such time the WwTP is expanded above 0.500 Mgd, it will be classified as a significant facility and according to Maryland tributary point source strategies, a cap of 6100 lbs/yr of total nitrogen and 457 lbs/yr of total phosphorous will be implemented. While caps may not be currently applied, the County is diligent in obtaining and maintaining water quality standards set by State and Federal agencies for clean water.
The table below shows the existing and estimated future point source nutrient loads for the five (5) County managed WwTPs.
x-5: Point Source Loading for County Owned
1 In accordance with MD Tributary Point Source strategies, expansion of non-significant facilities to significant facilities installs a point source cap of 6,100 lbs/yr of nitrogen and 457 lbs/yr of phosporous. Smithsburg WwTP is projected to expand to a significant treatment facility in the future.
Table 13-5 shows a similar pattern of resource capacity issues for public wastewater facilities across the County as those found in public water systems. According to the table, it appears that moderate growth scenario projections can be accommodated across the County with some minor potential deficits at the City of Hagerstown and Town of Boonsboro treatment facilities. Due to the amount of fluctuation that can occur with these types of calculations, these deficits are not alarming and could likely be absorbed.
High growth scenario projections show a more concerning pattern of available capacity. Two treatment facilities, Hagerstown and Smithsburg, show significant deficits in available capacity under this scenario. The Smithsburg treatment facility has the loading capacity to increase their treatment permits up to 600,000 gpd but would take a significant upgrade to the treatment facility. The City of Hagerstown, however, does not have the same capability. At their maximum treatment capacity of 8.5 Mgd, they would also maximize their nutrient loading capacity. The facility is actually built to handle a maximum of 10 Mgd of effluent treatment and is using the highest scientific treatment options to meet loading requirements. Effectively, they have reached the highest level of treatment available based on today’s limits of science and technology. The City is working closely with State to find alternative methods of mitigation to resolve the issue.
While this issue is concerning, it should be noted that the County has a large amount of capacity available that could accommodate high growth scenario projections for the UGA. An intercounty connection between the City and County wastewater treatment systems exists that could be used to resolve some capacity issues. It is anticipated that negotiations will occur between the two entities to ensure that long term growth goals can be met. Recommendations are included at the end of the chapter that address these concerns.
Enhanced Nutrient Removal (ENR) is among the most efficient sewage treatment processes available to public treatment facilities. However, more stringent pollution limits established by Federal and State environmental agencies are causing severe limitations on wastewater treatment capacities that cannot currently be overcome due to limits of current scientific and technologic processes. This has become true for the City of Hagerstown WwTP with regard to nitrogen and phosphorous point source caps. While the City has design capacity to treat up to 10.5 Mgd, point source caps limit treatment capacity to 8.0 Mgd. As shown in the capacity (Table 13-5), the City is nearing 90% of their total treatment capacity and may not have the ability to accommodate future land use demands. A combination of alternative options such as flow transfer, nutrient trading, or operational improvements related to I&I will likely be needed to address shortfalls within the City WwTP.

All wastewater treatment systems experience some level of inflow and infiltration (I&I) problems. Cracked collection lines, leaky pipe joints, deteriorated manholes, and illegal stormwater connections are a few examples of I&I sources.
Washington County deploys several measures to help reduce the amount of added capacity from I&I issues such as routine manhole inspections, annual budgeting and maintenance of equipment (grinder pumps, pump stations, etc), televising various service lines, and implementation of a rehabilitation program that uses grant funding to repair old and deteriorated service lines in the system.
Upgrades to WwTPs can have significant benefits to water quality by reducing nutrient loading into our waterways. Currently, the highest level of effluent treatment is through the Enhanced Nutrient Removal (ENR) process. Two (2) out of the five (5) County managed facilities (Conococheague and Winebrenner) have been upgraded to use ENR strategies while a third (Smithsburg) is due to be upgraded by 2024. The remaining two facilities will likely remain as secondary facilities due to the lack of new demand and the costly price of ENR upgrades.
Expansion of treatment facilities will be necessary in some growth areas of the County based on projected demand. Both the Conococheague and Smithsburg WwTPs are eligible for capacity expansions in the future.
Under the State’s Water Quality Trading Program credits can be generated through nutrient reductions related to nitrogen, phosphorus and sediment. Credits must first be certified by MDE (or MDA if agricultural credits are generated) and can then be placed on the State marketplace for trade or sale. However, the credits can only be used in the same TMDL watershed where the credit was generated. The State is currently working on a trading policy for potential exchange of credits from Wastewater Treatment Facilities, but nothing has been formally adopted.
The limitations and regulatory process of the trading program have made its use in Washington County unappealing to this point. Being an inland County with a significant agricultural industry, most BMPs and reduction techniques are being used to mitigate existing or projected onsite impacts. Additional efforts to implement nutrient reduction can be cost prohibitive or create a negative return on investment in rural areas due to the lack of significant development opportunity.
While the usage of the program seems to be unfeasible in the short term, the County will continue to monitor the trading program and potentially take advantage of opportunities as they may present themselves.
The connection of homes and businesses with onsite sewage disposal systems to public sewer facilities significantly lowers the amount of nutrient pollution generated by point sources. The State estimates that the amount of nutrient reduction is dependent upon the location of the septic system as follows:
• Septic systems in the Chesapeake Bay Critical Area: approximately 12.2 lbs/year per EDU retired (equivalent to approximately 5 EDU in an ENR facility).
• Septic systems within 1,000 feet of any perennial surface water: 7.5 lbs/year per EDU retired (equivalent to approximately 3 EDU in an ENR facility).
• Any other septic system: 4.6 lbs/year per EDU retired (equivalent to approximately 2 EDU in an ENR facility).
Currently there are no Chesapeake Bay Critical Areas designated in Washington County and to the degree possible, newer septic systems are located to avoid proximity to any perennial surface waters. Therefore, most of the credits that we could expect to obtain would be from the third category of “other septic systems”. While the estimated impact of connection is equivalent to 2 EDUS per one septic connection, the State only provides loading credits to WwTPs at a rate of 1 EDU per 2 septic systems retired. Areas targeted for potential retirement would likely coincide with areas determined to be localized hotspots through continued mapping of failing septic locations, as well as areas that become surrounded by new development using public facilities.
The application of treated wastewater effluent directly to the soil can allow pollutants to be absorbed before the effluent reaches receiving streams. Spray irrigation is the most common form of land application, although other options (such as drip irrigation or subsurface discharge) can also be considered.
Factors such as slope, soil depth and granularity, water table depth and behavior, and buffers from streams and developed areas are important in determining true suitability. Other important considerations for land application include storage and seasonal restrictions. Land application systems typically require large storage lagoons capable of holding several months’ worth of effluent. Land application may not be permitted during winter months, when frozen soil cannot accept effluent, or during other months when water tables rise. Based on County discussions with MDE, the amount of land in Washington County that is suitable for spray irrigation is extremely limited.
Properly treated wastewater can be reused to in many ways to help reduce stresses on surface and groundwater sources. Treated wastewater is distributed through infrastructure known as purple pipes (plumbing fixtures for reclaimed water are colored purple to distinguish them from potable water supply). This infrastructure can be installed to direct treated water for use in industrial process, watering of golf courses, and irrigation for farmland. In other parts of the United States, these resources have been used to recharge aquifers. This specific technique is not permitted in Maryland but may be a long-term consideration.
Another significant goal of the Water Resources Element is to more closely link land use and development policies with water quality goals. The Chesapeake Bay TMDL and Watershed Implementation Plan (WIP) identify the assimilative capacity of each body of water within and adjacent to Washington County and set interim and final goals for meeting that capacity. The majority of the land in the County’s Priority Funding Areas (PFAs) falls within watersheds that are impaired by nutrients, particularly the Antietam and Conococheague Creek watersheds. However, Maryland’s Smart Growth principles fundamentally encourage the continued concentration of new development within these already-developed areas. The County is specifically using its Phase II WIP and Municipal Separate Storm Sewer System (MS4) permit action plans to address water quality impairments caused by already developed areas.
Non-point source pollution occurs when rainfall, snowmelt, or irrigation runs off land or through the ground and gathers pollutants such as nutrients and sediment, which are carried with the runoff and deposited into surface water or leaked into ground water. The amount of stormwater runoff in developed areas is a function of the amount of impervious surface associated with the built environment, i.e., roads, parking areas, roofs, etc. The greater the percentage of impervious surface, the faster water flows over land. In wooded or heavily vegetated areas, the water is intercepted by undergrowth, plants and trees as it flows over land and it reaches streams more gradually, a process that underscores the importance of grass and forest riparian buffers, particularly on agricultural land. These natural impediments reduce flood-related stream discharges and enable lower, sustained flows which in turn reduce the potential for erosion caused by storm events. The slower pace of runoff from undeveloped land also allows time for vegetation to uptake the nutrients in the runoff, which results in lower nutrient loads being discharged into waterways.
Various technologies reduce nutrients from agricultural and developed lands. Nutrient reduction technologies for urban stormwater and non-point source pollution are generally referred to as “Best Management Practices” (BMPs). Examples of these technologies include urban and agricultural nutrient management, filtration systems, and erosion controls. Non-structural controls can be very effective in reducing the amount of pollutants that reach waterways. Woodlands and wetlands release fewer nutrients into the Bay than any other land use. For these reasons, forests, grasslands, and wetlands are critical to maintaining and restoring the health of the aquatic environment.
To maintain safe water quality standards, MDE has adopted guidance for Water Resources Management and have tasked local jurisdictions with creating their own water quality management plans in coordination with State and Federal efforts. Because the primary laws adopted to protect water resources are the Clean Water Act (CWA) and the Safe Drinking Water Act (SDWA), the State has recommended following this basic framework for analysis and planning for water resource protection. The figure below depicts the basic CWA framework.
(Source: Maryland Department of Planning, 2022 Water Resources Element Guidance Update)
According to the CWA Framework, the first step in planning for water quality is to develop Water Quality Standards (WQS). These standards consist of three components: designated uses, water quality criteria, and an antidegradation policy. WQSs should be identified in those areas where development is anticipated to occur so that appropriate land use strategies can be identified and implemented to ensure continued water quality.
Historic trends have shown that the majority of new development occurring within the County is within the Urban Growth Area. The boundaries of the adopted UGA currently exist within four identified 8-digit watersheds; Potomac River Direct, Conococheague Creek, Antietam Creek, and Marsh Run.
Sporadic development is also expected to occur within the rural areas of the County, however, there has been no consistent pattern of which watershed development has occurred. Therefore, our analysis will focus on the primarily effected watersheds in and around the Urban Growth Area with appropriate attention given to the other less effected watersheds in the County.
MDE has designated four (4) primary Use Classes to the surface waters of the State. A separate designation of “P” is added to any Use Class that can also support a public water supply. A summary of the designated uses and their classifications are included in Figure 132.

The four (4) primary development impacted watersheds in Washington County have designations of I, III, and IV. The annotation of “P” after the classification number indicates that there are areas within the watershed used for public water supply. Below is a list of the designated use classifications for these four watersheds and tributaries.
Antietam & Grove Creek (020700041004)
Creek, Little Beaver Creek and Black Rock Creek (02070041007)
Maryland has codified specific water quality criteria that are specific to the designated use categories. Table 13-9 illustrates the standards that are required to be met. Monitoring data for these criteria will be evaluated later in this section.
Toxic Substances Cannot exceed limits that must protect safety
Fresh water aquatic organisms; Fresh water aquatic organisms; Fresh water aquatic organisms
Public water supplies and the wholesomeness of fish for human consumption
Public water supplies and the wholesomeness of fish for human consumption
Public water supplies and the wholesomeness for human consumption
In order to maintain and protect waterbodies across the State that meet or exceed WQSs, MDE has adopted an avoid, minimize, and mitigate approach to water quality impacts. Maryland designated high quality and other sensitive waters include:

• Tier II High Quality Waters
• Stronghold watersheds
• Within a Chesapeake Healthy Watersheds Assessment
• Drinking source water protection areas for both surface and groundwater sources
• Coldwater Resources
• Within Sensitive Species Project Review Areas (SSPRAs)
• Streams with significant freshwater mussel populations
• Anadromous fish spawning habitat
• Another factor relating to assimilative capacity is antidegradation—the State policy that significantly limits new or expanded discharge permits that would degrade water quality. The focus of the antidegradation policy is on Tier II (high quality) waters, as defined by the US Environmental Protection Agency (EPA).
As stated in the Wastewater Management section of this document, Maryland’s antidegradation policy significantly limits new discharge permits and expansions of existing discharge permits that would degrade water quality. In these areas, new nutrient discharges can be permitted if they do not degrade existing water quality. Sideling Hill Creek is the only Tier II waters segment in Washington County. There are currently no WwTP discharges into this stream segment nor are any proposed by the County.
Washington County does not have the resources needed to continually monitor water quality; therefore, it relies upon the data collection efforts of the State. MDE in collaboration with local and federal government agencies, watershed organizations, and academia, collect data in accordance with established methodologies. This data is then published every two years as an assessment known as the Integrated Report (IR).
The IR is used as a combined report to federal authorities required under section 305(b) and 303 (d) of the CWA. These sections of the CWA require States to perform annual water quality assessments and to identify waters assessed as not meeting water quality standards. Tables 13-10 through 1313 list the surface water quality information found within the 2020-2022 IR for the four (4) primary development impacted watersheds.
Potomac River Direct
Turbidity (sediment) 4a - Impaired, TMDL Complete
Nutrient-Phosphorus 2 -Meets Water Quality Criterion
Federal law requires States to develop and adopt a statewide antidegradation policy that protects existing high quality water resources. These resources are defined by the Federal government as Tier II waterbodies. Currently, Sideling Hill Creek in the far western portion of the County is the only designated Tier II waterbody.
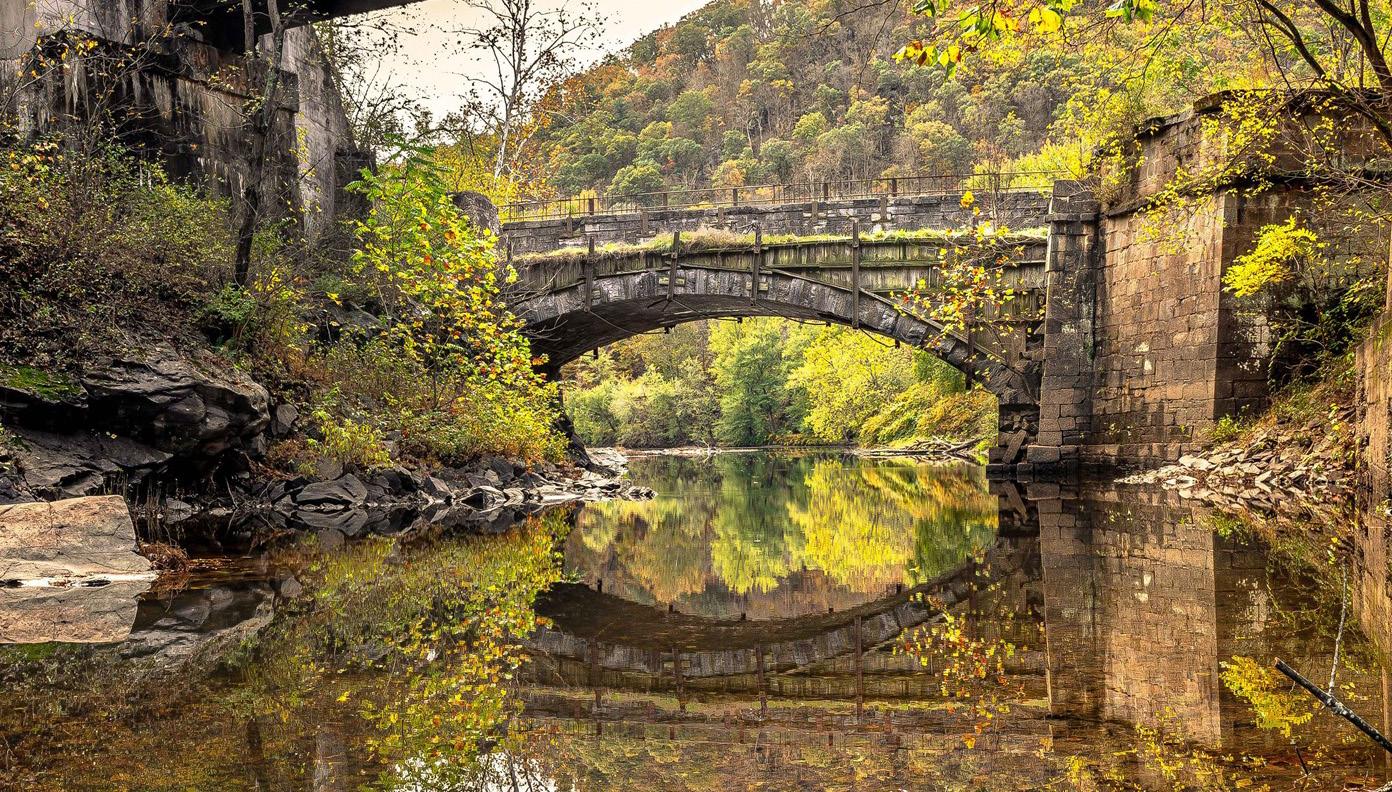
In addition to Tier II waters, the State has identified several other sensitive waterbodies that could be considered for protection efforts. As mentioned previously, these other high-quality waterbodies outlined in the MDP Water Quality Protection guidance documents include:
Ì Stronghold watersheds
Ì Within a Chesapeake Healthy Watersheds Assessment
Ì Drinking source water protection areas for both surface and groundwater sources
Ì Coldwater Resources
Ì Within Sensitive Species Project Review Areas (SSPRAs)
Ì Streams with significant freshwater mussel populations
Ì Anadromous fish spawning habitat
Each of these high-quality waterbody factors were analyzed using Geographic Information Systems (GIS) data provided by various State agencies to provide each watershed with a score based on the occurrence of the data in that watershed. Each criterion was given equal weight in the analysis and those areas where there appeared to be several criteria present were delineated as areas of high priority for protection efforts.
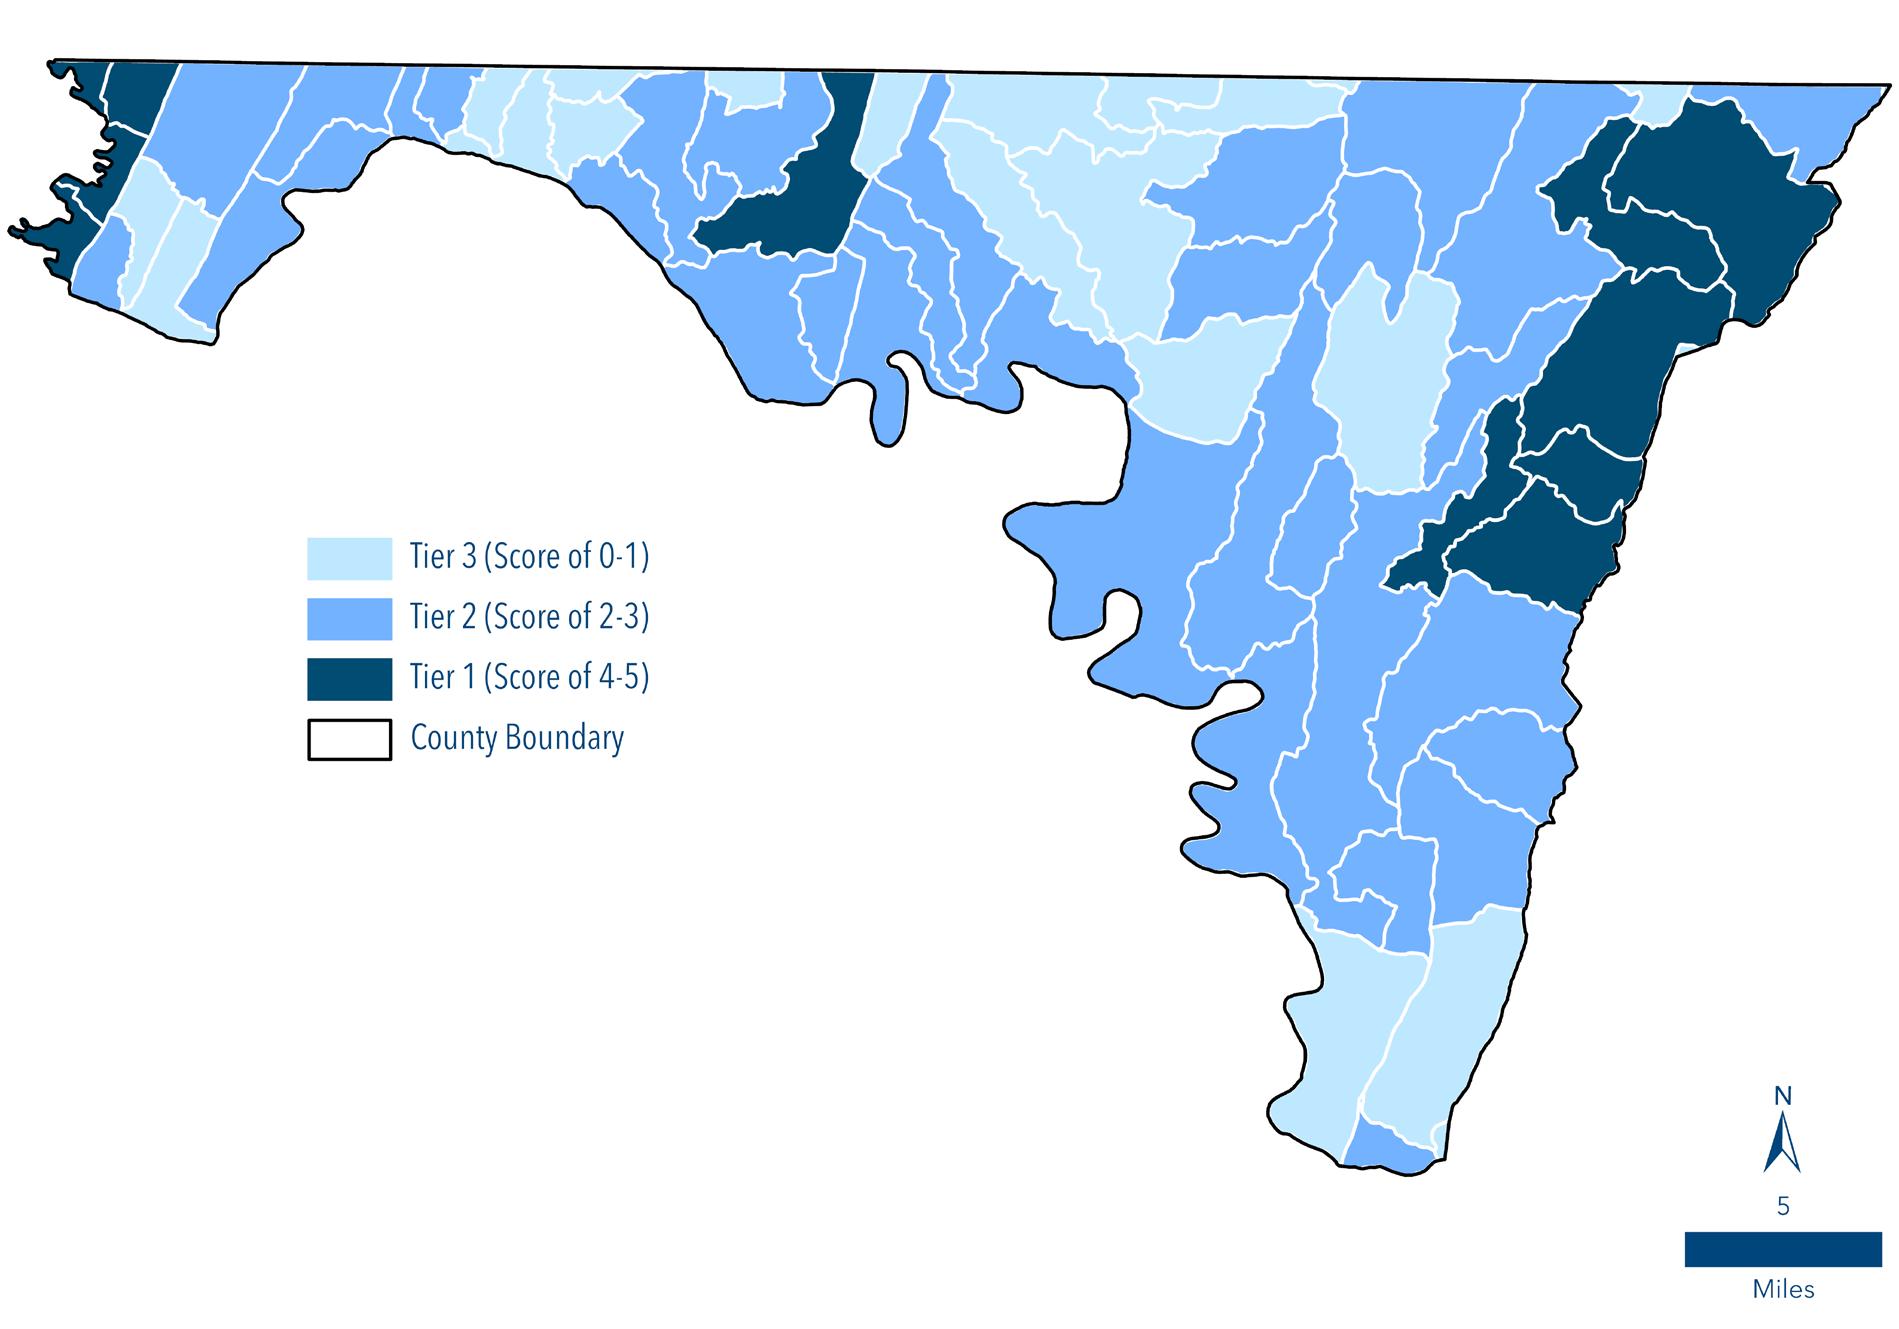 Source: MDP
As shown on Map 13-4, three (3) particular areas of the County show multiple overlapping priority areas. Joining the Sideling Hill Creek are portions of Licking Creek and Antietam Creek. They each show strong indicators for cold water benthic macroinvertebrates, wild trout habitat and sensitive species. The County currently has policies in place within its Subdivision Ordinance which provide for additional review in some of these areas such as those in the Antietam Creek watershed outside of Smithsburg via the Beaver Creek and Edgemont planning areas. It should also be noted that a large portion of these identified watersheds is already under State ownership for recreation purposes. Protection is also enhanced by the Environmental Conservation zoning designation over the majority of these areas.
As stated previously, the State has adopted an avoid, minimize, and mitigate approach to watersheds that have met or exceeded their water quality standards. Washington County shares this approach to conservation and protection of high-quality water resources. Following this approach, the county has taken significant action to avoid and minimize development impacts on high quality water resources through implementation of strict zoning standards in our rural areas.
One significant action taken by the County to avoid and minimize development impacts was a Comprehensive Rural Area Rezoning completed in 2005. As part of that process, land in the Sideling Hill Creek, Potomac River Direct and Licking Creek area was rezoned to reduce residential density from 1 dwelling unit per 3 acres to 1 dwelling unit per 20 acres. Areas within the Antietam Creek/Marsh Run watersheds were also reduced to a residential density of 1 dwelling unit per 20 acres and in some areas of the watershed, 1 dwelling unit per 5 acres.
Other efforts have included public and private investment in land preservation efforts. The State of Maryland continues to seek opportunities to purchase open space areas in and around existing priority resources. Private conservation groups such as the Nature Conservancy have purchased land adjacent to Sideling Hill and Licking Creeks thereby extinguishing potential development. And Washington County continues to use land preservation programs such as Maryland Agricultural Land Preservation Fund (MALPF), Conservation Reserve Enhancement Program (CREP), and Rural Legacy to purchase and extinguish development rights in the centralized areas of the county including the Conococheague and Antietam Creeks, Marsh Run, and the Potomac River Direct outside of designated growth areas.
In cases where monitoring data indicates that WQSs are no longer being attained, those waterbodies are listed as impaired and are then required to develop a TMDL to quantify the assimilative capacity of that resource to begin the restoration process. Because pollution comes from both point and non-point sources, they can impact water quality in different ways. Point source facilities are generally associated with nutrient (nitrogen and phosphorous) and bacteria loads. Non-point sources can also affect nutrient and bacterial loads but also carry other pollutants such as sediment and toxic substances through stormwater runoff.
Land development and its associated conversion of open space and agricultural land to impervious surface, has a direct impact on the quality of stormwater runoff. An increase in impervious cover can lead to an increase in the amount and intensity of stormwater runoff from the land during rainfall events. In addition, impervious surfaces accumulate pollutants deposited during dry weather from the atmosphere, leaked from vehicles or other storage containers, dumped or discharged directly onto the ground, or applied to the surface due to activities such as deicing.
Watershed impervious level has long been shown to be a relatively good indicator of the level of impairment of the aquatic surface waters. Research has shown that sensitive streams of high quality, stable channels, excellent habitat structure and diverse aquatic biota exist when watershed impervious cover is at or below 10%. Streams with watershed impervious cover ranging from 11 to 25% show clear signs of degradation including channel erosion, declining stream habitat and declining stream biodiversity, with most sensitive fish and aquatic insects disappearing from the stream. Once watershed impervious cover exceeds 25%, stream quality is so degraded that it can no longer support a diverse aquatic biological community.
Table 13-14 summarizes existing impervious surface area by watershed. Countywide, slightly less than 6% of all land is currently impervious. On a percentage basis, impervious coverage is highest in the Conococheague, Marsh Run, and Antietam Creek watersheds, where the majority of development has occurred. Catoctin Creek and Upper Monocacy Creek are included within the Antietam Creek watershed due to their small surface areas in Washington County. This is consistent with the CAST model distribution of nutrient loading. Impervious coverage is relatively low in the remaining watersheds with impervious coverage at or below 5%.
After adoption of the 2002 Comprehensive Plan, Washington County was designated as a Phase II Municipal Separate Storm Sewer System (MS4) community. The newly mandated MS4 Phase II permit has added another opportunity to approach comprehensive watershed studies that focus on future restoration and conservation efforts. In accordance with the County’s 2018 NPDES MS4 permit, there is a requirement to restore 20% (or 738 acres) of impervious surface within our urbanized area that are untreated or without modern day stormwater BMPs.

A restoration plan has been developed by the County that identifies several methods of mitigation techniques including tree planting, stream restoration, Onsite Sewage Disposal System (OSDS) disconnections, installation of septic denitrification systems, and stormwater management BMPs (rain gardens, bioretention areas, dry wells, etc) to help reduce impacts from non-point pollution sources. Numerous projects have been identified that are projected to reach, and exceed, the 20% restoration requirement of the MS4 permit.
Pollution loads from point sources and non-point sources are major contributors to degraded water quality in the Chesapeake Bay and its tributaries. The primary purpose of this Water Resources Element is to evaluate the water resources impacts of projected land use and development trends, and to provide input into the Comprehensive Plan’s recommended future land use pattern. Ideally, the Water Resources Element should use measures of assimilative capacity, such as completed TMDLs for nutrients, to guide direction of growth and land use patterns within the County. Because TMDLs have not been completed for all of County’s impaired 8-digit waterways, it is difficult to definitively identify appropriate receiving waters for the County’s point and non-point source nutrient loads, or to direct future growth toward the corresponding watersheds. However, despite TMDLs not being available, the WRE must make recommendations based on the best available data.
As a basis for a pollution risk assessment, Staff used the State produced Chesapeake Assessment Scenario Tool (CAST) to determine pollution scenarios to guide future development. As shown in Table 13-15 three (3) scenarios are depicted to illustrate where we started, where we stand today, and what our goals are in reducing pollution in the County. Using this data, the growth area boundary was evaluated to determine what, if any, changes were needed to accommodate growth and still meet our pollution reduction goals. The determination was made through the analyses of this element as well as the Land Use Element, that the UGA would need to be significantly reduced to limit sprawl and potential pollution issues. Based on this reduction and the other efforts outlined in this chapter, it is anticipated that there will be a reduction in pollution loading under both growth scenarios.
Antietam Creek
Conococheague Creek
Marsh Run
Potomac Rive (WA)
Potomac River (FR)
Potomac River (AL)
Little Conococheague Creek
Licking Creek
Tonoloway Creek
Little Tonoloway Creek
Sideling Hill Creek
Totals For Combined Land River Segments When Run Seperately Grouped As Their 8 Digit Watershed
Antietam Creek
Conococheague Creek
Marsh Run
Potomac Rive (WA)
Potomac River (FR)
Potomac River (AL)
Little Conococheague Creek
Licking Creek
Tonoloway Creek
Little Tonoloway Creek
Sideling Hill Creek
Totals For Combined Land River Segments When Run Seperately Grouped As Their 8 Digit Watershed
Creek
Creek
Marsh Run
Potomac Rive (WA)
Potomac River (FR)
Potomac River (AL)
Little Conococheague Creek
Creek
Creek
Tonoloway Creek
Sideling Hill Creek
Totals For Combined Land River Segments When Run Seperately Grouped As Their 8 Digit Watershed
To manage water quality restoration efforts in the County, a program called the Clean County Initiative was instituted. Washington County’s Clean County Initiative is an integration of the County’s compliance efforts for the Federal Clean Water Act. Regulations are set by the EPA and administered by MDE. Outlined below are some of the programs used in the County to collaboratively administer the program. Details of their progress and implementation can be found in annual reports submitted to MDE regarding our NPDES and MS4 permit.

The County’s Stormwater Management, Grading, Soil Erosion and Sediment Control Ordinance, adopted in 2010, incorporates the management regulations outlined in the Maryland Stormwater Management Act of 2007. It applies to all new development and redevelopment projects that did not have final project approval for erosion and sediment control and stormwater management plans prior to May 4, 2010.
These regulations require the use of environmental site design (ESD) to the maximum extent feasible (MEP). Environmental site design is described by the MDE as “using small-scale stormwater management practices, nonstructural techniques, and better site planning to mimic natural hydrologic runoff characteristics and minimize the impact of land development on water resources.” Environmental site design conserves natural drainage patterns, soils, and vegetation while minimizing developed areas, and reducing runoff volumes to more closely mimic natural conditions. The objective is to design a post-development site to have drainage characteristics that closely resemble natural conditions.
Stormwater retrofits can help to reduce non-point source pollution, particularly in more densely developed areas, however, it is typically the costliest manner of remediation. The County should identify locations where such retrofits could address concentrations of nonpoint source pollution (“hot spots”), or where retrofits can help to protect environmentally sensitive areas that also provide an efficient return on investment. Future retrofit funds and implementation activities should be targeted to these priority areas.
New technologies are available that can limit pollutant loads from OSDS, specifically related to nitrogen loading. While conventional OSDS can deliver over 23 pounds of nitrogen into groundwater supplies per year, BAT systems have shown to reduce that loading by half. In 2004, the Maryland General Assembly signed into law The Bay Restoration Fund. In 2012, the law was expanded to include OSDS users. The law establishes a fee collected annually from each user and the funds are used to provide grants to homeowners upgrading OSDS with BAT systems.
A negligible number of existing septic systems in the County currently utilize denitrification units, and the County does not currently require denitrification units for new septic systems. Maryland Senate Bill 554 (from the 2009 legislative session) now requires all new development on septic systems in the Chesapeake Bay Critical Area to include Best Available Technology (BAT) for nitrogen removal, as defined by MDE. Although there are no defined Critical Areas in the County, consideration should be given to require similar requirements in other areas, such as near perennial waterways, or in watersheds that are identified as high-quality watersheds.
Agriculture is important to the aesthetic and economic value of Washington County and is one of Maryland’s largest and most important industries. However, runoff from cropland and livestock activities can carry nutrients, sediments, and pollutants from manure, fertilizers, and other sources into waterways.
In cooperation with the local Soil Conservation District and similar resource agencies, the County’s agricultural community has proactively implemented Best Management Practices (BMPs) to minimize or eliminate runoff and pollution from active agricultural operations. Livestock owners are required to maintain nutrient management plans and sediment erosion control plans for their pasture lands. These agencies are also working with landowners who manage pastureland adjacent to waterways to install fencing and other deterrents to prevent direct access by livestock into local waterways. Over 74,000 acres of land in the County has been preserved and/or is owned by federal, state, and local government, and more than 80 percent of the County’s cropland is dedicated to no-till or minimum-till crops—which have lower nutrient impacts than high-till crops.
Washington County is also home to one of several University of Maryland Extension sites that provides educational and problem-solving assistance to local farm operators and citizens based on research and experience generated at UMD College Park. They assist the community with practical application of agricultural BMPs through programs related to agricultural production, nutrient management, water quality and numerous other related programs.


Multiple locations have been identified across the County for potential stream restoration and tree planting efforts. Each month the county sponsors a “County Clean-Up” event in various locations to remove trash and debris from local streams and creeks. They have also worked with various governmental agencies to delineate areas where additional tree planting could occur. In 2022 alone, the County planted over 14,000 trees in an effort to increase our local tree canopy and improve water quality.

Stormwater reuse involves storing water runoff from storm events and using it for other purposes. This can be a complex challenge due to runoff flows potentially picking up harmful pollutants such as chemicals, oils, and dirt that can lead to environmental and health impacts. However, in locations with limited water supplies, water reuse can conserve water resources and benefit surface water quality. This reclamation of water can be used for a variety of purposes such as irrigation, groundwater replenishment, industrial processes, and environmental restoration. Washington County promotes the use of small, localized reuse options such as rain barrels that can be used to water gardens or irrigate lawns as a method
In 2019, the County began a street sweeper program that has removed over 4.6 million pounds of debris from local roadways thereby diverting entrance into local waterways. Since the inception of the Clean County Initiative in 2019, over five (5) million tons of trash and debris have been removed from local highways and streams through street sweeping, tire removal, inlet cleaning and highway cleanup efforts.
In response to the adoption of the Comprehensive Flood Control and Watershed Management Program by the State in 1972, Washington County adopted a Floodplain Management Ordinance. The purpose of the Ordinance is primarily to protect public health and safety through encouragement of appropriate construction practices and prevention of unsuitable development in areas subject to flooding. Further floodplain protections were implemented as part of amendments made to the Subdivision and Zoning Ordinances declaring 100-year floodplains as designated sensitive areas.
The most notable areas of frequently repeating flooding occur primarily within federally designated 100-year floodplain areas identified by the National Flood Insurance Program (See Sensitive Areas Element for more details on the 100-year floodplain). As such, these would also be the primary areas to evaluate stormwater management facilities for potential inspection and possibly repair/retrofits.

Water Resources
Ì Coordinate with the City of Hagerstown to explore opportunities such loans or grants to upgrade the city water treatment facility to serve the UGA.
Ì Explore opportunities to supplement water supply to the UGA through potential ground water treatment facilities.
Ì Work with the State in completion of Source Water Assessments for public water supplies. Using this data, the County should adopt a wellhead protection ordinance for those areas designated as community potable water supplies.
Ì Incorporate water information from this Comprehensive Plan into the next revision of the County Water and Sewerage Plan.
Ì Implement a water conservation education program.
Ì Continue to work with the County Health Department to map well failures.
Ì Coordinate with the City on needed upgrades to their WwTP to determine if inter-county connection will be necessary.
Ì Incorporate wastewater information from this Comprehensive Plan into the next revision of the County Water and Sewerage Plan.
Ì Continue to identify and eliminate sources of inflow and infiltration to free up additional capacity at treatment plants.
Ì Continue to pursue abatement of failing OSDS through connection to public sewer systems.
Ì Work with MDE to ensure that the County receives nutrient credits for actions taken to reduce OSDS impacts.
Ì Work with MDE to find suitable areas for land application of treated wastewater.
Ì Promote opportunities for reuse of stormwater, rainwater, and treated water for purposes such as on-site irrigation and non-potable process water for industrial activities where appropriate.
Ì Continue to work with the County Health Department to map septic failures.
Ì Regulations should continue to require use of environmental site design (ESD) to the maximum extent feasible (MEP).
Ì The County should identify locations where stormwater retrofits could address concentrations of non-point source pollution (“hotspots”), or where retrofits can help to protect environmentally sensitive areas hat also provide an efficient return on investment.
Ì Continue to promote funding of retrofit program as an annual line item in the Capital Improvement Program.
Ì Update local stormwater management ordinances to maintain the highest level of consistency with State and Federal Clean Water Act regulations.
Ì Continue to encourage use of rain barrels as small, localized options for stormwater reuse.


The Land Use Plan is the core element of the Comprehensive Plan. It is the portion of the document where the policies, strategies and recommendations articulated in the other chapters are interwoven to form a detailed plan of how the community should develop in the future. The Land Use Plan is also the instrument through which growth management policies are primarily implemented and establishes the framework for defining various zoning classifications as well as their location. The Land Use Plan illustrates how development, consistent with the goals and objectives for the County, can be achieved. To be effective, this Land Use Plan is based on the assumption that there will be growth; and, therefore planning for it should be on an integrated, comprehensive manner.
In addition, the Land Use Plan must fit the community’s needs by preserving its unique character, protecting the environment and enhancing economic opportunities. Recognition of the key role public facilities play in determining the pattern of development is also a significant factor in the development of the Plan. To accomplish this purpose, this Plan will closely mimic previously adopted Comprehensive Plan Land Use Elements in emphasizing smart growth principles that compliment Washington County’s desire to remain a thriving rural community.
Washington County contains approximately 299,522 acres and is a predominately rural County with over 80% of land use being agricultural or forested. Because of the complexity and multitude of uses existing in the County, seven (7) broad categories are analyzed for long term trends. A listing of the categories and potential uses included follows.
Agriculture
Cropland, pasture, orchards, vineyards, horticulture, feeding operations, agricultural buildings and row/garden crops
Forest Deciduous, evergreen and mixed forests as well as brush
Low Density Residential Detached single-family/duplex dwelling units, yards and associated areas.
Medium/ High Density Residential Attached single row units (townhouses), garden apartments, high-rise apartments, and condominiums.
Commercial/Industrial
Retail businesses, office space, professional services, accommodation buildings, restaurants, manufacturing and industrial parks, mining operations, and associated warehouses, storage yards, and parking areas.
Institutional/ Open Space Educational facilities, churches, health care facilities, transportation facilities, correctional facilities, military facilities, emergency service facilities, governmental facilities, barren/bare ground, parks and other recreational facilities, and cemeteries.
Water Rivers, waterways, reservoirs, ponds, lakes, and wetland
As shown in Chart 14-1, the County has experienced increased growth since land use trends were first tracked in the early 1970s. This statistical information includes the areas inside the growth areas including municipalities.

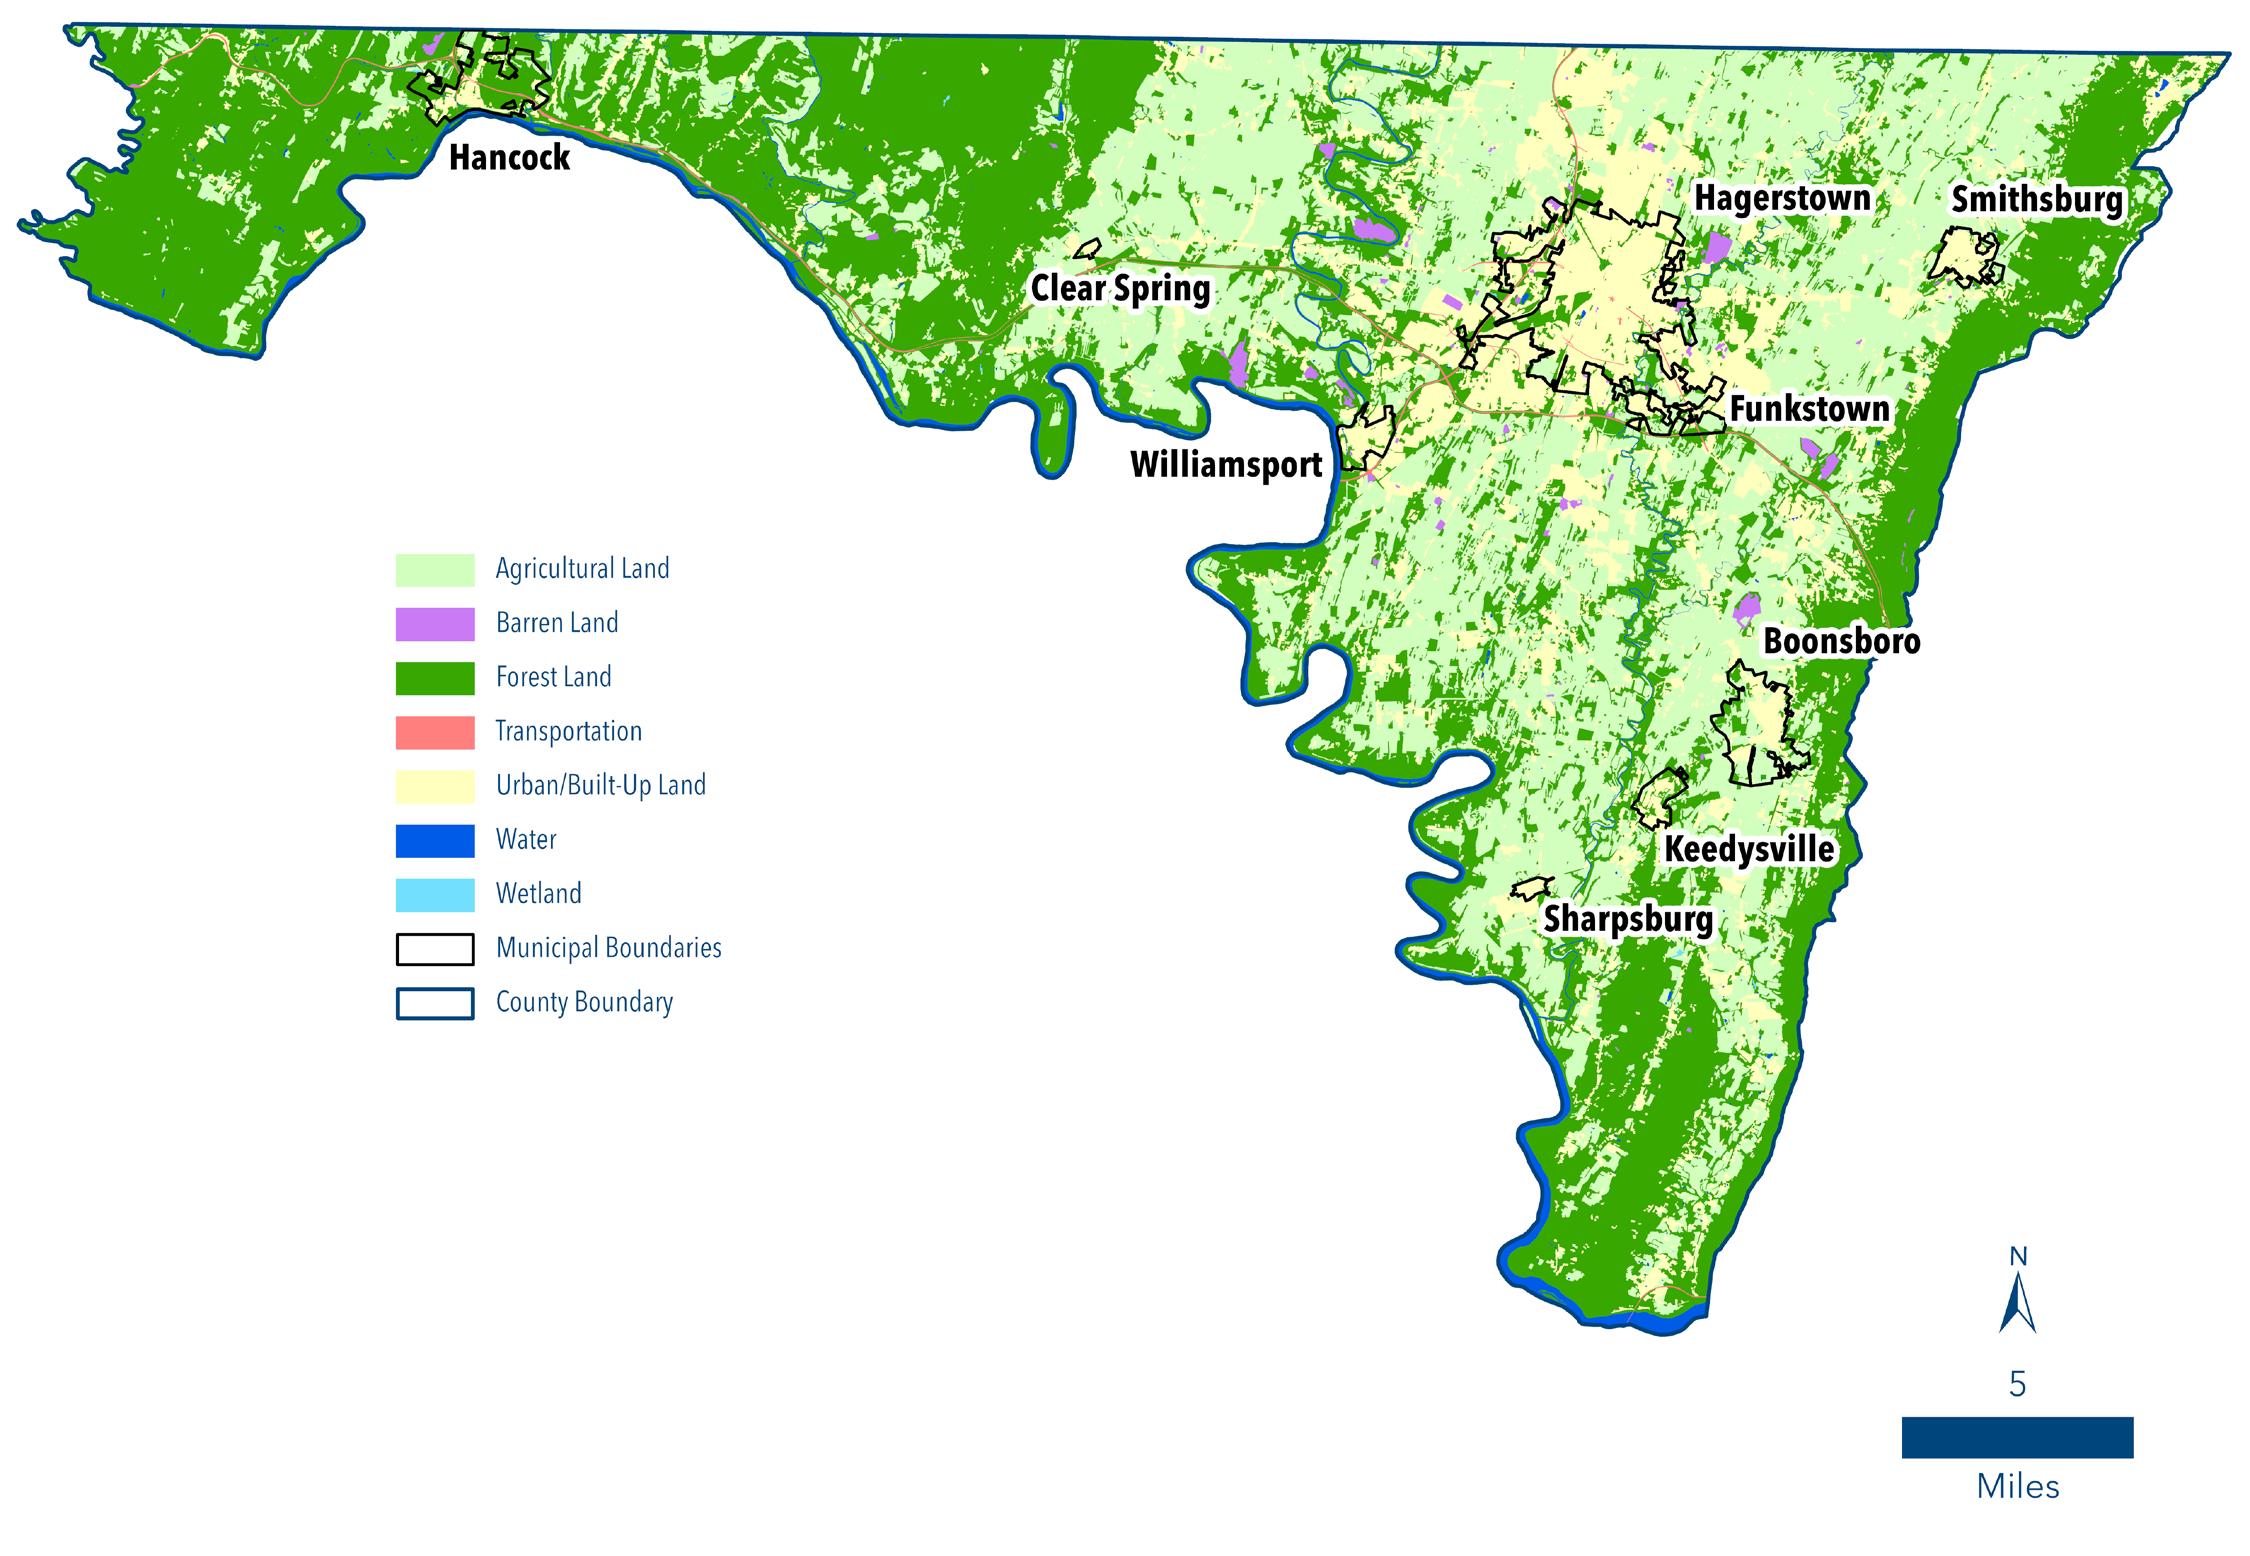
This information is broad based and has been compiled by two different sources; therefore, some statistical difference exists in the data. As clarification, information shown for years 19732002 has been collected from the Maryland Department of Planning (MDP). In 2011, County planning staff completed an in-depth analysis of land use utilizing existing aerial photography and tax assessment data. The methodology between the two sources differed in the evaluation of ‘Low Density Residential’ which is evident in the charting of land uses between 2002 and 2011.
The primary reason for this discrepancy is because MDP methodology relating to low density residential areas is through parcel analysis rather than actual land usage. Analyzing data based on a parcel yielded a higher rate of conversion to low density residential due to the significant number of larger residential lots created in the rural areas. For example, prior to 2005 the County had a Conservation zoning district that required new lots of record to be three acres in size. Often these lots were located in sensitive areas of the County with steep slopes or floodplain areas that are wooded. MDP methodology takes into consideration property boundaries that include the entire three acre parcel in the low-density residential category rather than measuring the amount of land that has actually been cleared for the residential development of the lot. County methodology does not acknowledge property boundaries and instead measures the limits of the overall forest stand using aerial photography.
Although the information is broad based, it does highlight several key points in the development patterns in Washington County over the last 40 years. The most significant change in land use has been the decrease in agricultural land; a little more than 15% loss in volume. Conversely, there have been moderate increases in all other urbanized development categories over the same period of time. The largest of the gains is in the ‘Low Density Residential’ category.
Attention to the specific category of Low Density Residential is of particular concern due to its relationship with development in rural areas of the County. This category is typically reflective of larger lot sizes that convert other rural land uses, such as agricultural and forested land. This same pattern was delineated in the 2002 Comprehensive Plan and was highlighted as an area of importance when evaluating land use policies. These patterns, along with other data collected throughout the 2002 Plan, led to a recommendation of reducing residential densities throughout the rural area.
In 2005, these recommendations were implemented as part of the Rural Area Rezoning that reduced residential density from one dwelling unit per one acre in the Agricultural zoning and one dwelling unit per three acres in the Conservation zoning to one dwelling unit per 5, 20, and 30 acres depending on locations of resources in the rural areas. These changes took effect during a tumultuous time in land use planning when housing construction first flourished and then quickly dissipated. These large fluctuations in the housing market have made it difficult to determine the effectiveness of these land uses policies and will take additional time to accurately assess.

It is estimated that 54,380 acres, or 18%, of the County (inclusive of municipalities), has been developed. For the purposes of this analysis, the definition of developed land is evaluated on a parcel level basis using Maryland State Department of Assessment and Taxation (MD SDAT) data. For the purpose of this analysis, the definition of “developed” means:
1. A parcel cannot have an agricultural land use assessment; and
2. Must have a current improved assessment value of $20,000 or more.
If a parcel does not meet both of these criteria, it is considered “undeveloped” as part of this analysis. In comparison, the same analysis completed in the 2002 Comprehensive Plan estimated that approximately 15% of the County was considered developed.

Areas of developed vs. undeveloped lands are further analyzed based upon their location inside or outside of designated growth areas. This metric helps to determine if the County is meeting its intended smart growth goals of guiding development into designated growth areas. As shown in the chart below, the total acreage of developed areas outside of designated growth areas currently exceeds those located inside. This can be attributed to the larger lot sizes associated with rural development. However, it is important to note that this does not necessarily indicate more rapid growth in the rural areas. When looked at as an overall percentage of area, the amount of developed land is 14% of the total rural land area. Comparatively, 39% of land in growth areas is considered developed.
From these charts, it can readily be seen that Washington County is growing, but that most of the County remains undeveloped. Furthermore, it is clear that the County is maintaining its efforts to appropriately direct growth and that the greatest amount of development is taking place in the growth areas designated for development.

Of Washington County’s nearly 300,000 acres of total land mass, approximately 74,000 acres (about 25%) are public owned or protected property. About 38,000 acres of that are permanently protected through land preservation and conservation easements on agricultural and forested land. Protected lands are projected to increase through land preservation programs such as the Maryland Agricultural Land Preservation Program (MALPP), Rural Legacy, and others. These programs target investment in public-private partnerships to protect the most valuable agricultural and environmentally sensitive areas in the County.

In 1981, the County Comprehensive Plan introduced new growth management controls through the adoption of designated growth areas. Over time, these areas have been amended and expanded to help manage growth and development. One large area, designated as the Urban Growth Area (UGA), is delineated around the City of Hagerstown and the Towns of Funkstown and Williamsport. The UGA represents the areas of highest intensity urbanization in the County and is the centralized location for many of the infrastructure needs of the overall population. In addition to the UGA, Town Growth Areas (TGA) were also delineated around several smaller municipalities in the County that also provide necessary infrastructure needs for growth and development. TGAs have been adopted around the Towns of Boonsboro, Clear Spring, Smithsburg, and Hancock.
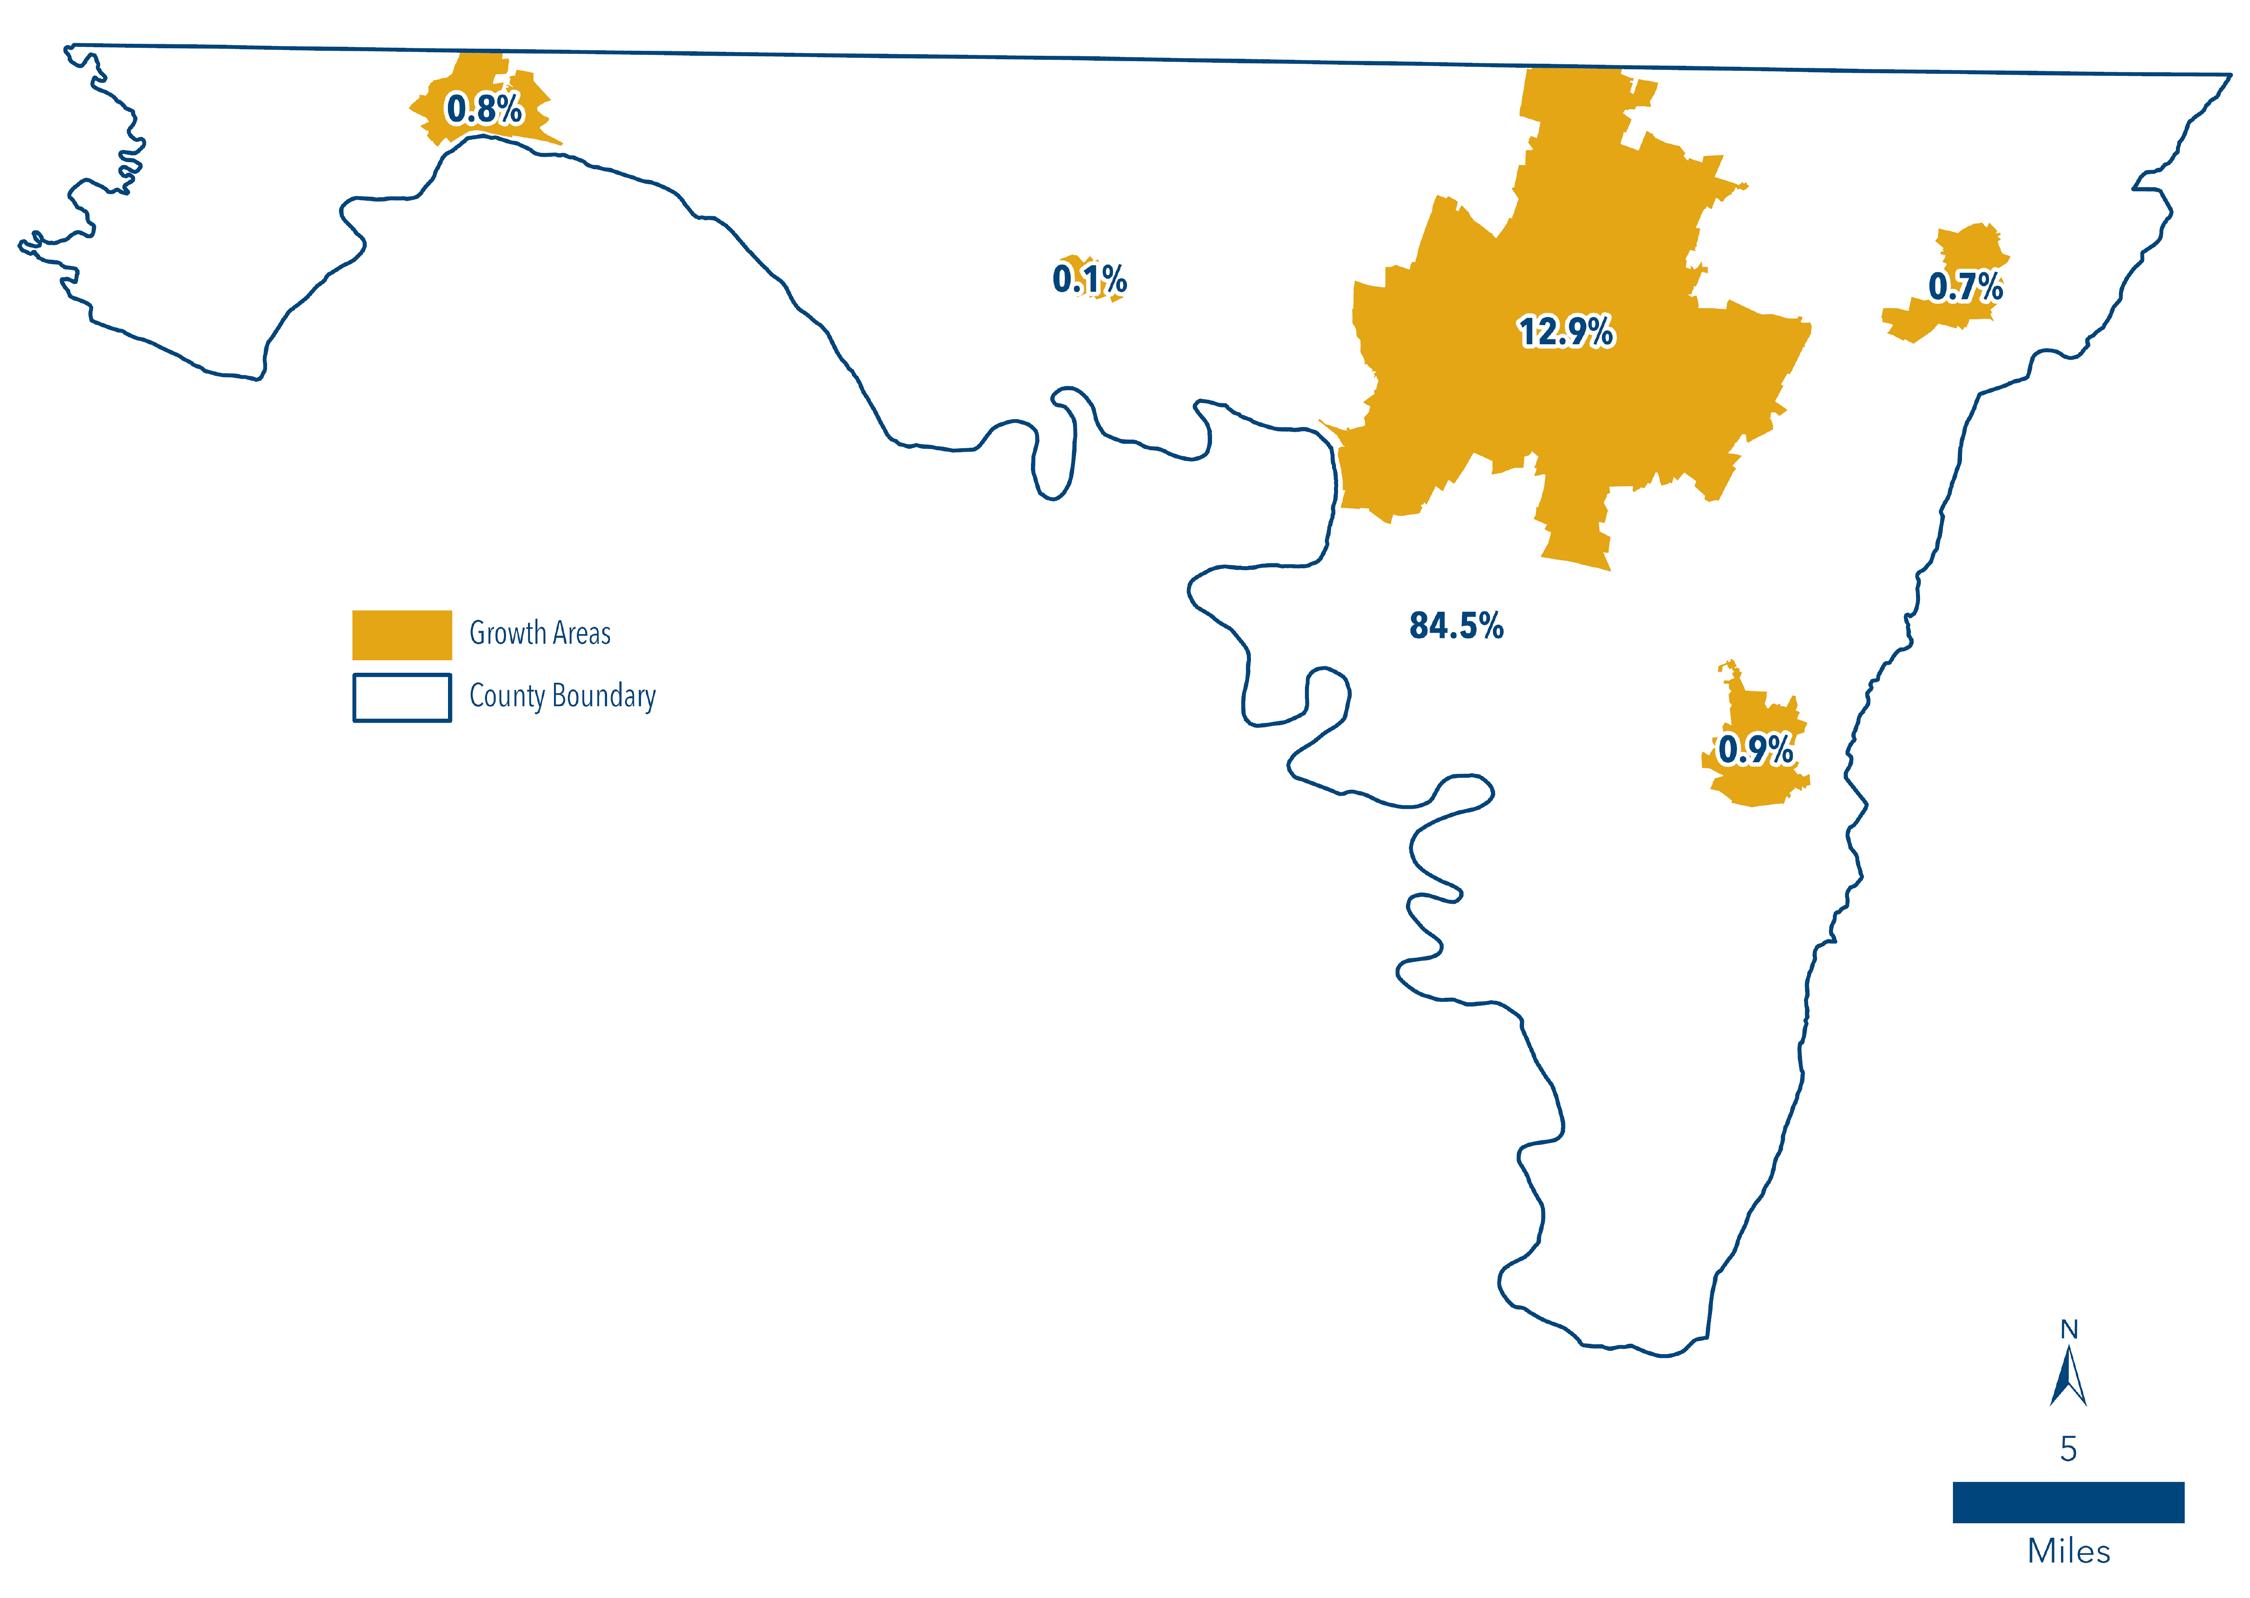
The 2002 Comprehensive Plan refined these boundaries to follow property lines and amended various boundaries to expand and retract certain areas. This has resulted in the growth area boundaries shown in Map 14-3 below.
Map 14-3: Growth Areas as a Percentage of Total County Acreage
Currently, about 46,432 acres or 15.5% of the County land mass (inclusive of municipalities) are within designated growth areas. The UGA contains approximately 38,619 acres while the TGAs contain approximately 7,813 acres. This leaves 253,090 acres, or 84.5%, of the County outside of designated growth areas. To continue support of smart growth efforts, the County maintains its goal of directing at least 80% of new growth within defined growth area boundaries.
Priority Funding Areas (PFAs), as mentioned in other chapters of this document, are existing communities and places where the County wants to direct State investment—in the form of loans and grants for highways, sewer and water infrastructure, and economic development—to support future growth. According to State law, the standard requirements for an area to be designated as a PFA are as follows:
WATER AND SEWER PLAN
GROWTH AREAS
If residentially zoned, the area must have a minimum density of 3.5 dwelling units per acre. The zoning also qualifies if the area is zoned for employment uses, such as commercial, industrial, or institutional.
The area must be planned for sewer service in the 10-year water and sewer plan.
The area must be within a locally designated growth area.
Map 14-4 shows the location of PFAs in Washington County. In addition to having centralized PFAs around the nine (9) incorporated municipalities in the County, numerous rural villages have been defined as well. They are definable on the landscape and contribute to the unique character of Washington County.
Many of these villages are settlements near junctions in roads or along creeks and railroads. They usually include a small core of a residential neighborhood associated with a retail establishment (present or historic) or an institution such as a post office, elementary school, church or fire station. A few are close enough to be associated with the Urban or Town Growth areas delineated throughout the County. Many have vacant lots suitable for infill development. No new rural villages are being recommended at this time.

Zoning was first established in the unincorporated areas of Washington County in 1973. Of the overall 299,522 acres in Washington County, approximately 285,054 acres are under development and zoning regulation control of the Washington County government. The remaining 14,468 acres are under the jurisdiction of the municipalities who have their own autonomous development and zoning regulations.
Since zoning’s inception, there have been numerous piecemeal map amendments that have influenced development patterns throughout the County. As part of the 2002 Comprehensive Plan, it was recognized that zoning had become outdated and needed a comprehensive review. Beginning in 2005, the County began to implement the recommendations of the 2002 Comprehensive Plan through Countywide rezoning efforts. This effort was broken up into three major projects; the Rural Area rezoning adopted in 2005, the Urban Growth Area rezoning adopted in 2012 and the Town Growth Area rezoning adopted in 2016.
Following these comprehensive rezoning efforts, the County Zoning Ordinance currently 20 Euclidean, three (3) floating, and six (6) overlay zoning districts. The following table 14-2 illustrates the breakdown of total acreage by zone.
In 2012, the State of Maryland adopted the Sustainable Growth and Agricultural Preservation Act (the “Act”) to limit creation of new residential subdivisions served by on-site sewage disposal systems. The Act, also known as the “Septic Tiers Law,” was adopted to meet U.S. Environmental Protection Agency limits on Chesapeake Bay nutrient and sediment pollution. The Act establishes four tiers to identify the type and intensity of residential subdivision that may occur (minor or major) and the type of sewage disposal system to serve them.
Areas already served by public sewerage systems and mapped as a locally designated growth area or in a municipality that is a Priority Funding Area served by public sewerage systems. In Tier I, a residential subdivision plat may not be approved unless all lots are to be served by public sewer.
TIER II
Areas proposed to be served by public sewerage systems or mapped within locally designated growth areas.
Areas planned and zoned for large lot or rural development. These areas are not planned for sewerage service and are not dominated by agricultural or forest land. They are also not planned or zoned for land, agricultural, or resource protection, preservation, or conservation.
Areas not planned for sewerage service but are planned or zoned for land, agricultural, or resource protection, preservation or conservation; areas dominated by agricultural lands, forest lands or other natural areas; Rural Legacy Areas, Priority Preservation Areas or areas subject to covenants, restrictions, conditions or conservation easements for the benefit of, or held by, a State agency or local jurisdiction for the purpose of conserving natural resources or agricultural land.
Between 2012 and 2013, the County drafted several versions of a Tiers map that were reviewed by MDP. After failing to find a compromise acceptable by both the State and the County, efforts to develop a Tiers map were abandoned by the County. In accordance with the Act and the County’s failure to adopt an approved Tiers map, the State has deemed all development in areas without access to public water and sewerage facilities as tier 4 areas thereby limiting development to minor subdivisions only.
The timing of this legislation happened to coincide with the beginning of a nationwide housing recession. In addition, the zoning changes made to the rural areas in the prior decade reduced residential densities and somewhat limited significant development. Therefore, the limitations imposed by the Act have not yet had a significant impact on development within Washington County.
As the economy continues to recover, the County is projecting more historic levels of development; thereby anticipating a higher level of demand for rural residential housing options. In order to accommodate this demand, an analysis was completed to develop a Septic Tiers map. The County has closely followed the methodology outlined in MDP guidance documents and used previous discussions between County and MDP staff as a basis for the map (See map 14-5).
Tier 1 areas are lands that are designated as existing sewer service areas (S-1) in the 2009 Water and Sewerage Plan. Tier 1 areas also include any new areas where sewer service has been extended since the adoption of the 2009 Water and Sewerage Plan, as well as parcels with community sewerage facilities that maintain an individual NPDES permit (i.e. Brook Lane, Fahrney Keedy comprehensive care facility, Cedar Ridge Children’s Home, etc.).
Tier 2 areas include lands that are delineated as Programmed (S-3) and Planned (S-5) sewer service areas in the 2009 Water and Sewerage Plan that are also located with a locally mapped designated growth area. Changes that are made to the growth areas as part of the adoption of this document will need to be incorporated into the Water and Sewerage Plan. Therefore, there may be interim discrepancies in the definition of methodologies until the documents can be aligned.
Tier 3 and 4 areas apply most directly to the rural areas of the County outside of any designated growth area boundaries. These are also the areas that have had the greatest amount of discussion and contention. What is explicitly called out in the Act that both the County and State agree upon is the inclusion of delineated Rural Legacy Areas, Priority Preservation Areas, and existing land preservation easements into Tier 4 areas. The County also included all government owned lands in the rural areas in Tier 4.
Diverging opinions between the State and County revolve around a clause in the laws that states, Tier 4 areas should include “areas dominated by agricultural lands, forest land or other natural areas”. The State has strictly interpreted that clause to mean any land with an agricultural assessment or forested land use category. Being a rural County dominated by agricultural and forested lands, this strict interpretation would effectively apply a Tier 4 designation to all of the lands outside of locally designated growth areas; and, by definition, eliminate major subdivisions in these areas. The County contends this is an impractical interpretation because it provides no transition between urban and rural areas of the community. It also ignores the fact that areas adjacent to the growth area have already developed to some degree and have compromised any preservation efforts. Lastly, without the availability of any Tier 3 areas, coupled with the 2005 rural area rezoning completed by the County, the supply of rural housing options becomes severely limited and unaffordable. While it may sound counterintuitive to allow rural development while promoting smart growth principles, the two are not mutually exclusive. Properly managed rural development that promotes lower density growth provides alternative housing options that can sometimes be more affordable than those in more urbanized areas. Taking into consideration these factors, the County has delineated areas surrounding the UGA that have already been compromised by development as areas of Tier 3. All existing rural villages recognized by the State as a PFA have also been delineated as Tier 3 areas.
In order to determine the extent of changes needed to the existing land use plan, a development capacity analysis was performed for all residential and non-residential areas in the County.
Residential density capacities have been calculated using MD SDAT information and average minimum lot size areas per the County zoning ordinance. The analysis begins with removal of all parcels that are preserved and/or restricted through easement or government ownership. MD SDAT data is then run through a local GIS model to determine the potential development yield on a parcel level basis. Only land under the jurisdiction of the County is included in this analysis.
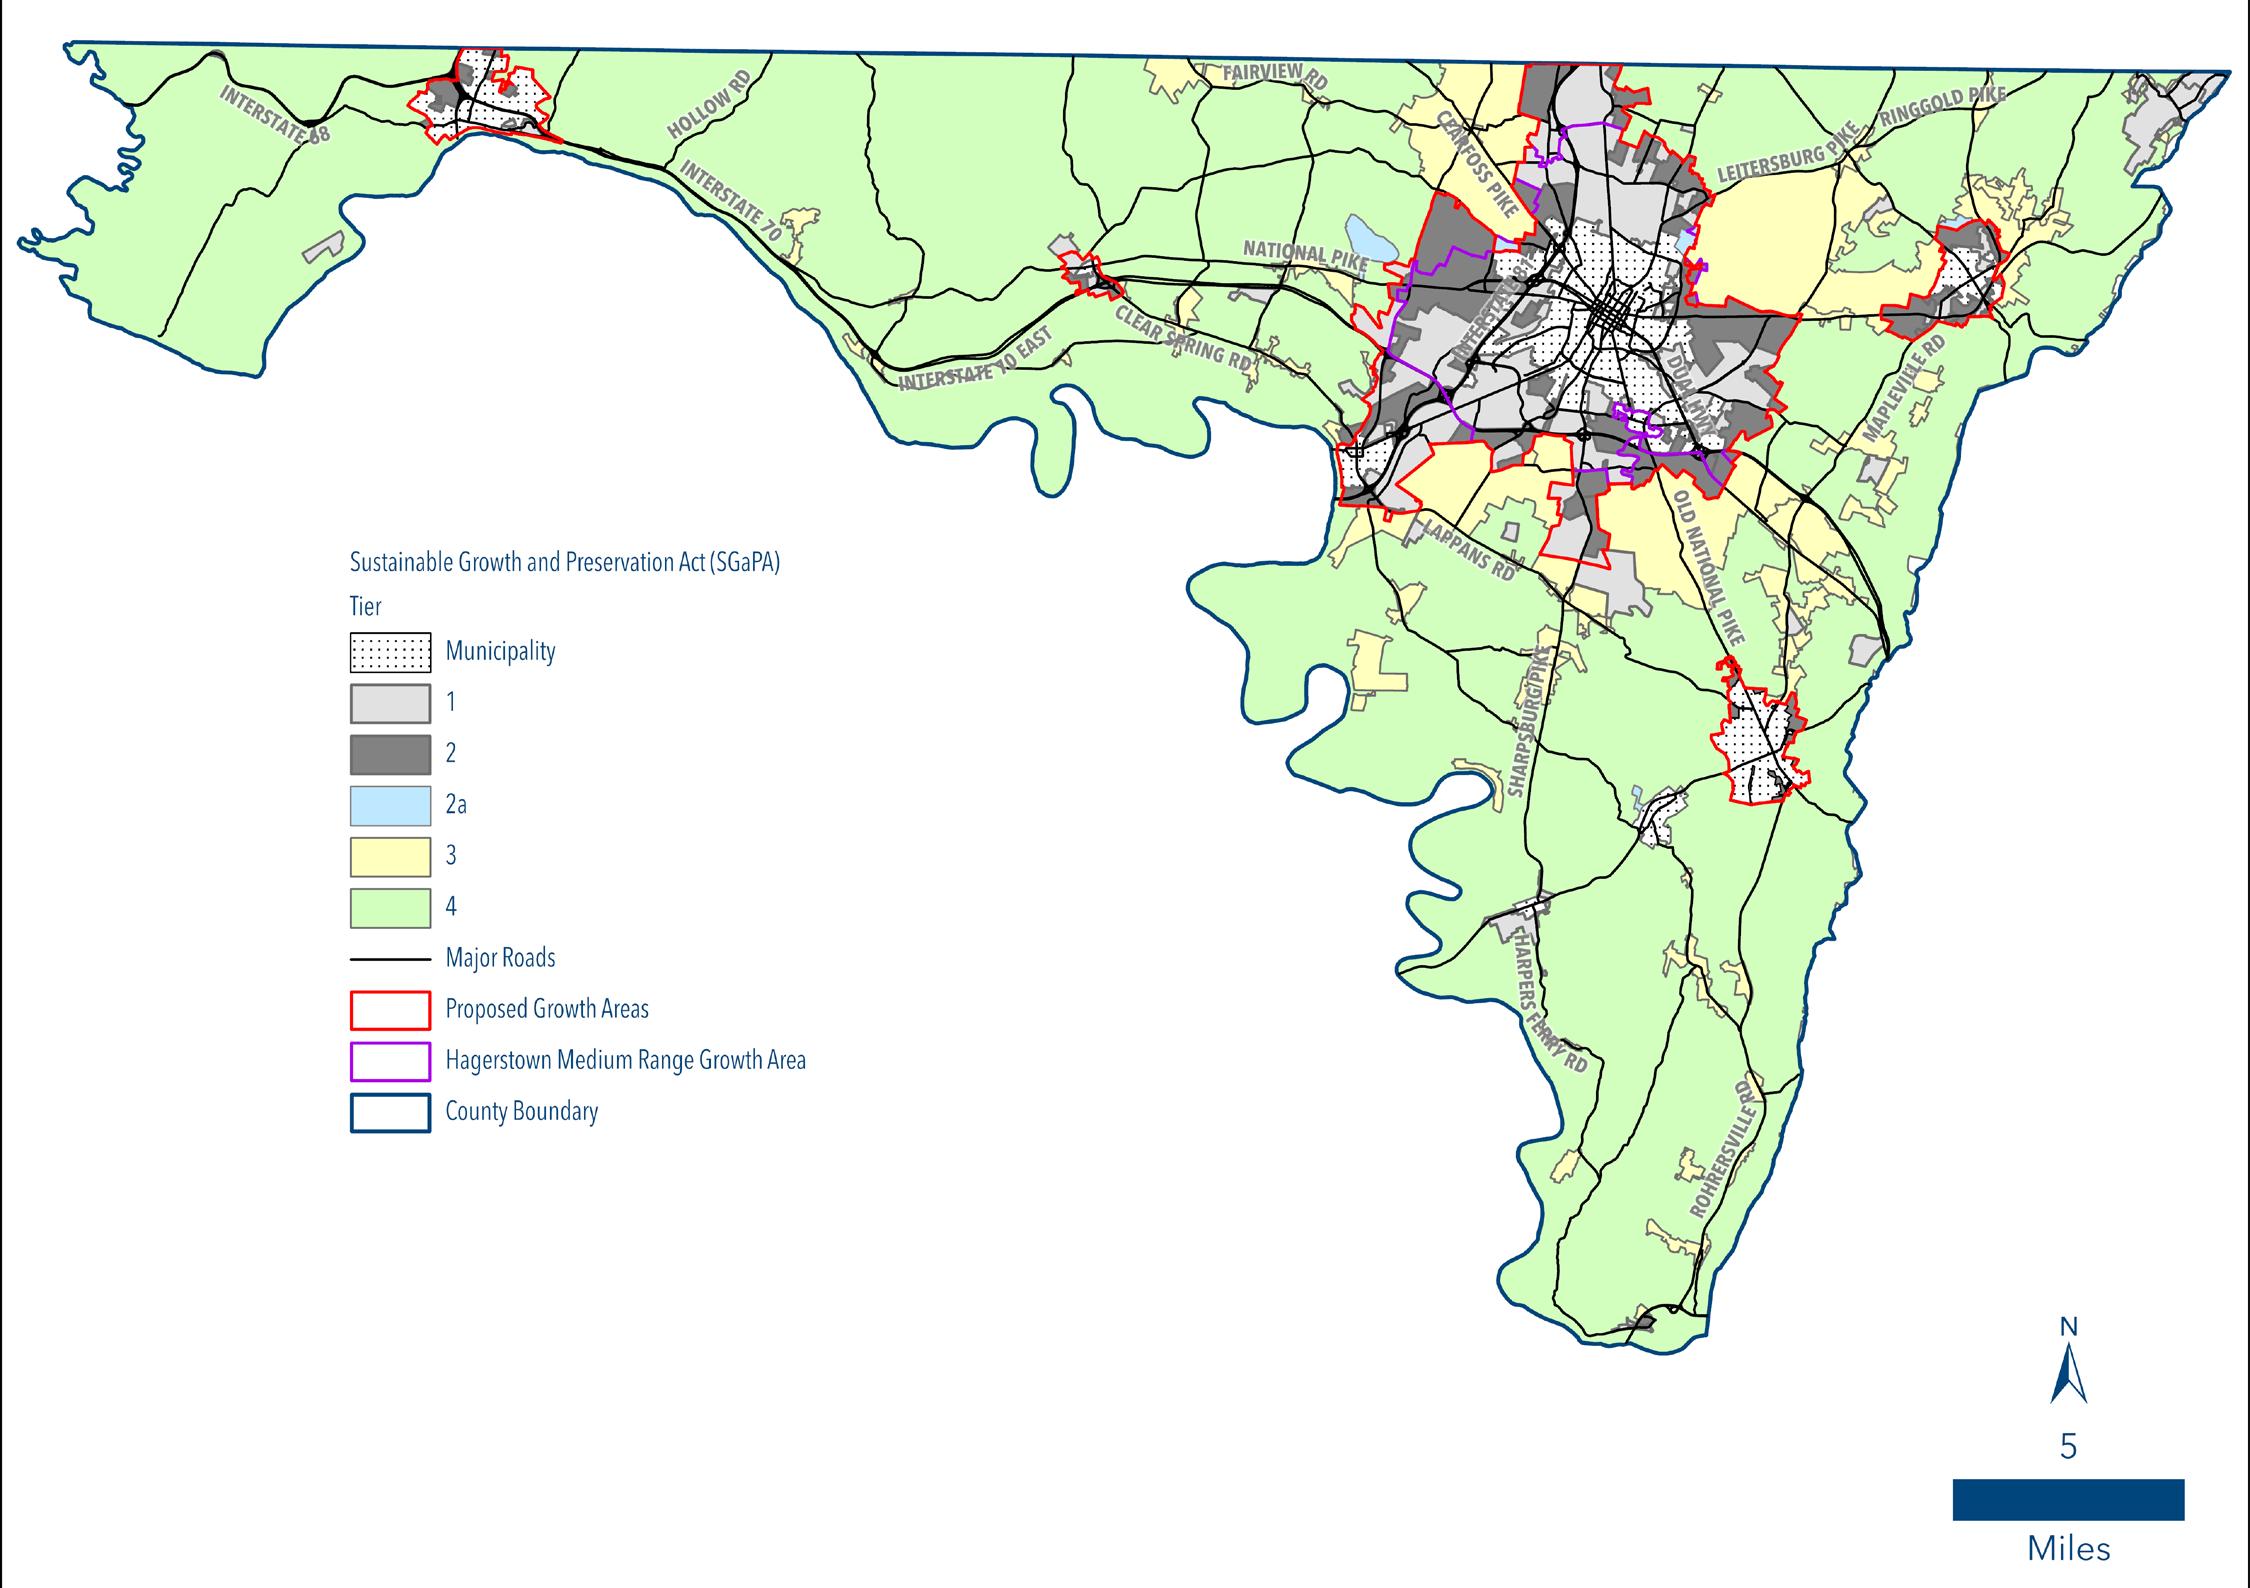
There are four (4) zoning districts established in the County that are associated with residential development within defined growth areas: Residential, Transition (RT), Residential, Suburban (RS), Residential, Urban (RU), and Residential, Multi-Family (RM). An analysis of vacant lands available for new development began by excluding existing development. “Existing development”, for the purpose of this analysis, is defined as only calculating yield on parcels that:
1. Have existing improvements valued over $20,000; and
2. Are of a size that cannot be further subdivided.
In addition, the gross development yield of the vacant parcels are multiplied by an infrastructure factor of 75%. Based on historic development patterns in urbanized areas of the County, it is estimated that on average, residential land yields 75% of its total potential once necessary infrastructure improvements such as roads, open space, and stormwater management facilities are factored into the development. Table 14-3 depicts the amount of vacant land, by zoning district, in each of the five (5) defined growth areas and potential yield.
Residential density calculations in the rural areas of the County have a slightly more complex calculation than that of the urban areas. Rather than basing density on zoning district lot sizes, density is calculated on a parcel-by-parcel basis. The reason for this level of detail is due to the permission of “exemption lots” in addition to a unit to acreage ratio. Exemption lots were included in the Zoning Ordinance to provide a small amount of relief to those property owners who wanted to create family member lots or to farmers who may need to sell a small number of lots to help finance the farm operation.
Currently, there are five zoning districts that cover the rural areas of the County: Agricultural, Rural (AR), Environmental Conservation (EC), Preservation (P), Rural Village (RV) and Special Economic Development (SED). Three of the districts (AR, EC, & P) have regulations that limit residential development to a unit per number of acres in the parent parcel ratio. The RV and SED districts residential densities are similar to the urbanized residential districts in that density is based on the minimum lot size. Table 14-4 outlines capacity within these four districts.
As part of the 1998 Base Realignment and Closure Act (BRAC), the US Army base known as Ft. Ritchie located in Cascade was closed and handed over to civilian authority. The Fort has been through many iterations of development plans for the last 25 years; however, in August 2021, it was officially transferred to a private civilian entity. The current property owner has created an overall master plan that includes renovation and rehabilitation of the numerous structures remaining on the property as well as plans to establish new residential and commercial uses.
From a residential perspective, the new owners of the property have already rehabilitated existing housing units and are actively renting them. New sections of residential units have been proposed in concept but are awaiting necessary infrastructure upgrades to begin formal planning. Preliminary estimates made as part of the overall concept delineate up to 500 new units that would be generated on the property. Zoning allows for residential uses that range from single family dwellings up to, and including, multi-family units. These estimated units are included in the estimated rural area residential capacity in Table 14-4.
Evaluation of land available for non-residential development is an essential component in the economic prosperity of any jurisdiction. Ensuring there is enough properly zoned land available for businesses to locate and/or expand in a community can increase opportunities for residents to have jobs closer to home thereby reducing the need to commute for work. Having enough land available for non-residential development is also essential to grow the local tax base that supports public services.
The dynamic nature of business and the advancement of technology make it difficult to estimate the amount of land needed for non-residential uses. Industrial sites are typically driven by specialized needs for infrastructure, parcel size, building configuration, and access. Commercial development is particularly difficult because it is mostly driven by changes in the market and can shift locations based upon short term needs. Table 14-5 illustrates the current capacity of non-residential zoning districts in the County.
In general, industrial uses are shifting away from heavy manufacturing and moving more toward computerized, high-tech manufacturing. To account for some of these variables, sites identified for industrial, commercial, or office uses should generally conform to the following parameters:
• Infrastructure and utilities should be either available or capable of being provided;
• Access to the Interstate system should be over arterial highway routes that do not require the movement of heavy traffic through residential neighborhoods;
• The ability to mitigate developmental impacts on sensitive environmental, historical or cultural features;
• Contain sufficient land area to accommodate development including buildings, parking, storm water management, buffering, and screening if required;
• Avoidance of areas where there is a high probability of incompatibility with existing residential development;
• Locate where mixed uses can provide opportunities for transitioning from heavy industrial or commercial uses to institutional or residential uses;
• Use adaptive reuse of existing sites or buildings as a catalyst for rehabilitation or preservation of historic or environmental resources;
• Locate retail commercial sites where they best serve the market niche being targeted whether regional, community wide or neighborhood; and
• When feasible, associate development with an approved or proposed incentive area such as Enterprise Zones or Foreign Trade Zones.
As noted in the Economic Development chapter, it is projected that Washington County will gain about 8,800 jobs between 2020 and 2040. Currently, there are approximately 11,000 acres of land in the County zoned for commercial, industrial, and employment uses. As shown in Table 14-5, nearly 40% of the non-residential acreage in the County is located within the Highway Interchange (HI) district. This seems appropriate given our geographical location at the intersection of two major Interstates. It is apparent that the Interstates also have influence over the types of jobs are coming to the area. According to the shift-share analysis contained in the Economic Development Element, the majority of new jobs are coming to the area through regional influence in the Trade and Transportation sectors. This is supported in the location quotient analysis that shows the County has a slightly higher attraction of transportation related businesses than the State and country.
In support of the County’s manufacturing industry, there are slightly over 40% of non- residential zoned land in industrial zoning districts (i.e. Industrial Restricted, Industrial General, and Planned Industrial). While there have been sharp decreases in employment all over the country in the manufacturing sector in recent years, Washington County has a strong workforce for manufacturing jobs. As shown in the location quotient analysis, the County is also twice as likely to attract jobs in the manufacturing sector than elsewhere in the State of Maryland.
Of the nearly 11,000 acres of non-residentially zoned land, there are approximately 5,700 acres (or 53%) still available for new development. As shown in Table 14-5, light industrial districts (IR, ORI, & PI) have higher vacancy rates. The majority of the vacant land available is in the PI district and was created by design. As part of the previous Comprehensive Plan, a distinct need for additional industrial/employment zoned land was discovered. In response to this need, the County designated several hundred acres on the western boundary of the UGA as potential land for future non-residential growth. The area was later rezoned to PI through a comprehensive rezoning process. The remainder of the non-residential zoning districts have between 30% and 50% vacancy rates; therefore, it appears that the County should have enough land to accommodate projected job growth.
Analysis of the Urban and Town Growth Area residential development capacity analysis shows an overwhelming abundance of potential development in comparison to historic growth rates for the County. This proliferation of capacity is beginning to cause issues with “leapfrogging” within the Urban Growth Areas, especially where land closer to municipal limits is being overlooked to seek properties that may be easier with respect to regulatory processes to develop. Therefore, one of the significant changes to be evaluated as part of this Plan is to seek areas of retraction from the existing UGA.
With regard to the rural areas of the County, significant changes were made as part of the last Comprehensive Plan update that included downzoning nearly all of the rural areas of the County. Based upon historic trends in development and permit activity, no additional changes are being proposed for the rural areas. The same is true for non-residential development.
As part of the planning process and development of the Plan, discussion revolved primarily around the concept of how much growth the County both wanted and could support. These are important questions when trying to evaluate short-term development impacts that have long-term consequences such as planning for infrastructure and utilities. It is also important to recognize that some policies need to be put in place during the life of this Plan even though the facilities may not be needed until after 2040.
The future land use map has several purposes:
• It is a policy map that provides the basis for a more refined classification of land into zoning districts that regulate the use and development of land.

• It serves as a guide to the County’s future desires and interests for land development, preservation and conservation.
• It serves as a guide to decision makers regarding public facilities—primarily water and sewer—as well as schools, economic development, transportation, and parks.
The land use designations are intended to direct growth toward existing population centers and areas adjacent to these centers by setting appropriate densities and coordinating growth with public infrastructure. The Future Land Use Map does not apply to the County’s nine (9) incorporated Towns. The Towns have their own planning authority and adopt their own comprehensive plans and land use regulations. The County coordinated the development of the Future Land Use Map with the Towns.
Efforts to address future growth and development included collaboration of the Staff, Planning Commission, and Board of County Commissioners. The process involved review of existing land use and zoning maps, calculating potential and needed capacity, and determining impacts of development on future infrastructure and utilities such as roads, schools, water and sewer. Results of these discussions and analyses can be found in the various chapters of the Plan including the Transportation, Community Facilities, and Water Resources Elements.
To summarize the findings, the majority of impacts on public infrastructure such as roads, schools, and other community facilities can likely be absorbed and mitigated as development occurs over the life of this Plan. The County’s long-standing policy of requiring development to pay for their fair share of impacts and to develop public-private partnerships for large budget items will likely provide the necessary investments needed to maintain service to existing and future citizens.
After significant levels of growth in the middle part of the last century, Washington County's population growth has leveled out to a more modest growth rate just under 1% per year for the last several decades. According to the Maryland Department of Planning, Washington County is projected to increase by another 24,745 people (or 16%) between 2020 and 2040. Historically, State projections for Washington County have been slightly lower than those compiled by the local Planning Department. As shown below, the County is projecting an increase of about 30,800 people (or 19.9%) over the next 20 years. These projections are based upon long-term historic trends and evaluation of variables such as birth and death rates, migration patterns and the influence of group quarters. The methodology for this analysis is included in the Appendix for this plan.
To understand the land use impacts of population growth, this data is extrapolated into household data so that the amount of land needed for residential use can be readily calculated. Similar to the population data, the County has slightly higher projections than the State for household projections.
For the purpose of projecting population and household growth in the County over the next 20 years, two different scenarios are being evaluated. One projection is considered a moderate growth scenario to represent historic growth trends in the County while the other is a high growth scenario to represent a quicker pace of development.
The Moderate Growth Scenario assumes that population and household growth will follow historic trends in population and group quarters. Long term historic growth trends have shown that the County has typically grown at a rate near 1% per year. Prior to 2020, effects of the economic recession caused unusually low rates of growth and the County slightly adjusted estimates to account for this anomaly. This adjustment estimated that the impacts of the recession slowed growth to approximately 0.88% per year through 2020. After 2020, the County is predicting a return to historic average gains. As shown in the chart, the County is projecting approximately 11,680 new households between 2020 and 2040. Using the County’s growth ratio goals with regard to urban vs. rural development (80% urban, 20% rural), that would mean that the County would expect about 9,340 new households in the urbanized areas.
While the County feels confident that the moderate growth scenario will likely be how future growth occurs, it is also important to plan for unforeseeable variables that could cause faster growth in the County as was the case in the early 2000s. The high growth scenario assumes growth occurring about 50% above the moderate growth scenario. As shown in the chart, if the high growth scenario would occur, it would add approximately 26,200 new households between 2020 and 2040. Using the County’s growth ratio goals with regard to urban vs. rural development (80% urban, 20% rural) that would mean that we would expect about 20,960 new households in the urbanized areas.
The purpose for establishing growth areas is to identify areas within the County where development is to be encouraged. These areas surround urban locations where the required infrastructure to support intensive development is in existence or planned. They contain the centers for human activity with future investments in public utilities, facilities and transportation linkages being the most cost effective in these areas. By concentrating development into designated growth areas, this Plan strives to reduce development pressures within rural areas of the County.
These areas are intended to be the most suitable for future development based on the existing built environment and growth patterns. They are also designated to promote economic development and resource protection through proper planning of infrastructure and design. The primary designated area known as the Urban Growth Area (UGA) is centralized around the County seat of Hagerstown and envelopes the Towns of Funkstown and Williamsport. There are four (4) other designated growth areas surrounding the incorporated municipalities of Boonsboro, Clear Spring, Hancock, and Smithsburg (Town Growth Areas- TGAs).
While the majority of impacts on public infrastructure can likely be absorbed and mitigated as development occurs over the life of this Plan, analyses contained within the Water Resources Element highlighted significant deficiencies in two key infrastructure facilities. Drinking water and wastewater resources top the list of potential impediments to increased growth in the County. The City of Hagerstown is the sole provider of drinking water resources within the urban growth area of the County. The uncertainty of long-term capacity and availability issues have prompted the City to adopt a smaller growth area than the one established by the County.
Known as the Medium Range Growth Area boundary (MRGA), the City has restricted access to the public water supply to only those areas within their MRGA. This limitation has created a competitive situation between the two jurisdictions. The City’s desire to maintain the water system as a “municipal” utility has created severe deficiencies in areas of the County's designated urban growth area.
In response, the County has been forced to, as part of this Plan, reevaluate and amend the size of the UGA by retracting a significant amount of delineated residential land use areas and some commercial and employment areas. The result of this retraction will likely be a higher-thanaverage amount of residential development occurring within the City boundaries. Similarly, smaller jurisdictions with municipal utilities will likely experience a higher-than-average increase in residential development as a result of limited capacity within the UGA. Map 14-6 shows the future land use plan with the discussed retractions and resulting changes to land use categories.
Residential density capacities have been calculated using the same methodology used for the existing Land Use Plan. The same zoning classifications that are currently assigned in the UGA have been assumed to continue through to the new Plan with the exception of those areas that have been removed. As shown in Table 14-10, retracting the existing growth area has significantly reduced the availability of land for new residential development in comparison to table 14-3.
Analysis of rural residential areas followed the same methodology as used for the existing Land Use Plan with the exception of introducing restrictions generated by implementation of the proposed Tiers map. As shown in table 14-11, the total acreage of land outside of designated growth areas increased due to the proposed retraction of the UGA. However, it is also estimated that the overall yield for new residential units will decrease in comparison to table 14-4. The reason for the decrease is a result of implementing the regulations of the Tiers map. This is especially noticeable in the Agriculture Rural zoning designation.
No significant changes were made to the non-residential areas between the existing and proposed Land Use Maps.
Even with the reduction of the UGA, the projected demand for new residential growth can be accommodated with the amount of land remaining in the Urban and Town Growth Areas. However, the demand for public water from both residential and non-residential uses could exceed capacity and treatment capabilities at some facilities within the life of this Plan. It is imperative that alternative solutions to increasing capacity of public water supply be evaluated and planned sooner rather than later.
Wastewater resources at the County treatment facility are projected to exceed current permitted capacity with new development; however, the facility has the capacity and nutrient loading availability to increase its permitted capacity to accommodate new growth. The City wastewater treatment plant is also projected to exceed its permitted capacity with new development. But unlike the County facility, the City facility may see severe limitations in capacity due to nutrient loading restrictions. This will require the City to seek other alternatives such as purchasing additional nutrient loading from another entity or potentially negotiate a flow transfer agreement with the County for capacity via the intercounty connection.
Business Commercial Mix
This policy area, scattered around the Urban Growth Area, is intended to provide potential areas for mixed employment and commercial uses. They include suitable locations for uses that facilitate access by a large number of employees and the receipt or shipment of goods by highway vehicles. Existing and anticipated land uses associated with this policy area include light industrial, office parks, research and development facilities, communication and technology facilities, and minor commercial uses that support employment centers. Zoning districts could include HI, ORT, ERT, and AP.
Commercial policy areas are located primarily along significant transportation corridors such as the Interstates and State highways. Uses should be generally associated with retail sales and services for local and/or regional consumers. Opportunities should also be sought in this district to allow for mixed use buildings with residential uses. By offering opportunities for mixed use, retail income in mixed use buildings could help offset the need for higher residential income and provide options for more affordable housing.
In order to narrow the focus of this district, it is recommended that the HI zoning district be re-evaluated to shift industrial type uses from the zoning category into more appropriate industrial districts. These policy areas should be devoted to the needs and demands of the travelling public. Zoning districts could include BL, BG, and HI.
Industrial land uses are located primarily along the western side of the UGA due to its proximity to Interstate 81. As noted in the Transportation Element, freight movement has increased dramatically on I-81 and is projected to increase over the life of this Plan. Most of the designated industrial parks are included in these policy areas and expected uses will primarily focus on manufacturing, processing, and freight movement land uses. Zoning districts that will be associated with these areas include PI, IR, IG, HI and ORI.
This land use category is intended to recognize land uses that serve the community’s educational, social, healthcare, and public safety needs. They include uses such as schools, hospitals, correctional facilities, public safety facilities, and the sanitary landfill. They are typically governmentally or quasi-governmentally owned or managed facilities.
Residential growth is expected to include low to moderate density development. Most of the residential land use category shown in the current Land Use Plan is already developed. Very little unimproved area is being designated as available for residential development due to the limited water and wastewater supplies outlined in the Water Resources Element. Therefore, the majority of residential development is expected to occur within municipal boundaries.
Lower density development is expected on the edges of the Urban Growth Area where the transition from urban to rural occurs. Typical densities in these areas range from two to four units per acre. More moderate residential density is expected in and around the City's delineated MRGA based upon the City’s strict utility extension policies. Typical moderate densities range from four to six units per acre.
This policy area is associated with previously approved Planned Unit Developments (PUD) or Mixed-Use Developments (MUD). They contain a mixture of housing characteristics and, in some cases, contain commercial areas to support the development. The MUD is an overlay zoning district that allows for multi-faceted development schemes. There are currently three (3) types of mixed-use developments: Mixed Use Residential, Mixed Use Commercial, and Mixed Use Employment. Having a variety of options available to developers allows for more compatibly and flexibility in locating mix use development throughout the Urban Growth Area.
Mixed Use developments are permitted in different areas of the Urban Growth Area depending upon the mixture of uses requested by a developer. They are delineated as Overlay districts that require public input prior to establishment.
Urban open space is typically defined as areas reserved for parks and other “green spaces” that are accessible to the public. These areas consist of regional parks located within designated growth areas.
Mixed Use Corridors
Mixed use corridors are specifically designated along US Route 11, MD Route 62, US Route 40, Robinwood Drive and the intersection of MD Route 64 and Eastern Boulevard as anticipated areas of long-term transition. These corridors have been, and continue to be, influenced by development and economic factors such as transportation, proximity to employment, market fluctuations, and proximity to infrastructure. As a result, these corridors have experienced a high level of transition from generally residential uses to commercial and mixed uses.
These corridors are established as being 1,000 feet wide (500 ft from centerline on either side of the road or intersection radius). Defining these corridors reflects an acknowledgement of transitional areas that will likely continue to shift to more commercial uses while also anticipating that existing residential uses will likely still exist over the life of this Plan.
Underlying land use categories will reflect the existing conditions of land use that exist currently. However, the Overlay provides a slightly more streamlined opportunity for mixed uses or adaptive reuse. These corridors are intended to support alternative housing options in accordance with the Housing Element. By offering opportunities for mixed use, retail income in mixed use buildings could help offset the need for higher residential income. These corridors are highly specific and should not be applied without careful examination of influencing factors.
The “Rural Area” of Washington County is characterized by farms, forests, historical sites, villages and scattered residential development. It is also the primary location for the mineral resource, agricultural and tourism industries in the County. The challenge of the Land Use Plan dealing with the Rural Area, is to preserve the rural character through policies that will not promote significant development but will maintain a productive environment for the existing industries located there.
With the previous adoption of growth areas and the continuation of that policy in this document, the growth management provision of limiting the expansion of public facilities in order to direct growth to areas where public facilities exist is well established. In particular, the principal of not encouraging growth in the rural area through the extension of public water and sewer facilities is a fundamental tenet in the development policy for the rural section of the County. Without the necessary infrastructure in the rural areas to support increased development, residential development at densities that may require public facilities to address health and safety issues, should be limited. Avoidance of taxpayer provision of public facilities to address health and safety issues is a priority.
Currently, the three (3) primary zoning districts (Agricultural Rural, Environmental Conservation, and Preservation) associated with the rural area strictly limits new residential development to densities of one dwelling unit per 5, 20, or 30 acres respectively. There are also provisions in the Zoning Ordinance for “exemption lots” for these districts. The purpose of the exemption lot provision is to provide a transitional period whereby property owners of smaller lots that would lose all development rights could still have a few rights for estate or financial planning purposes.
Agriculture
This policy area is primarily associated with sections of the County in the Great Hagerstown Valley. It extends from the foot of Fairview Mountain, around most of the Urban Growth Area, and east to the foot of South Mountain. This area also extends to the southern portions of the County from Boonsboro through Pleasant Valley. The Agricultural policy area has been purposely drawn to enclose large blocks of the best soils for intensive agricultural production as well as gently rolling topography for farming. Most of the operating farms as well as the largest blocks of farmland preserved through land preservation programs are in this area.
Portions of the policy area that are highly desirable for agricultural preservation programs have been overlain by the Preservation Policy area as an indicator of areas to target limitations on new development. The policy area primarily conforms to the Agricultural Rural zoning district but may also include Preservation zoning districts in areas defined in that policy area.
Currently, the Agricultural Rural zoning district restricts new residential development to one dwelling unit per 5 acres.
This policy area is associated with locations in the County where environmental sensitivity issues are prominent enough to warrant constraints on development. A weighted analysis was completed using County GIS to determine overlying areas of environmental concern. The methodology for the analysis is included in the Appendix for the plan. The Environmental Conservation Policy area has been applied to areas of the County that contain multiple sensitive areas including steep slopes, floodplains, wetlands, streams, habitats of threatened and endangered species, forested areas, and wellhead protection areas.
This policy area covers the remainder of the rural areas of the County including areas west of Fairview Mountain, South Mountain, Red Hill, Elk Ridge and stream buffers of significant waterways in the County including Little Conococheague Creek, Conococheague Creek, Antietam Creek, Marsh Run, and Israel Creek.
Portions of the policy area that are highly desirable for land preservation programs have been overlain by the Preservation Policy area as an indicator of areas to target limitations on new development. The policy area primarily conforms to the Environmental Conservation zoning district but may also include Preservation zoning districts in areas defined in that policy area. Currently, the Environmental Conservation zoning district restricts new residential development to one dwelling unit per 20 acres.
This policy area is the primary tool used to implement land preservation efforts in the County. Included within this policy areas are delineated Priority Preservation Areas (PPAs) including Rural Legacy areas. PPAs are required to be delineated by local jurisdictions to maintain a certified land preservation program and the significant funding ratios associated with said certification.
This policy area was first established in the 2002 Comprehensive Plan to implement a Preservation zoning district that would protect the only designated Priority Preservation Area at the time, the Rural Legacy area. The intent of the Preservation Area was to further protect Rural Legacy areas from sprawl development through lower zoning densities. This has been an invaluable tool in maintaining the integrity of this delineated land preservation area. Since that time, many new policies and programs have been developed and implemented that promote a more comprehensive view of protection efforts.
While one of the primary goals of land preservation is to retire development rights in general, some programs have a more targeted interest. For example, the CREP program is targeted toward protecting riparian stream buffers. In this case, while stream preservation is the primary goal, the symbiotic effect is that development rights are extinguished. Similarly, the MALPF program specifically targets the protection of active agricultural operations. Purchasing easements in return for extinguishing development rights furthers the County’s goals to keep agriculture as a viable and successful industry.
Because these types of programs overlap with both agricultural programs as well as environmentally sensitive programs, the Preservation policy area is being shown as an overlay on the Land Use Plan. The intent in showing this policy area as an overlay is to recognize that PPAs can be fluid. Zoning within Rural Legacy area is still recommended to be 1 dwelling unit per 30 acres because of the variety of land use programs that are used to protect this important heritage area. Other Preservation land use areas may have different zoning designations depending upon the targeted goals of the programs being used.
The formal designation of “Rural Villages” is an outgrowth of Maryland’s Smart Growth Act of 1997. By law, a designated Rural Village is considered a “Priority Funding Area” (PFA). Many such villages have existed in Washington County since colonial times while newer urban settlements at junctions in roads or along creeks and railroads have evolved in the recent past. Rural Villages are defined by something other than incorporation or governing structure.
They are definable on the landscape and contribute to the unique character of Washington County. They usually include a small core of a residential neighborhood associated with a retail establishment or an institution such as a post office, elementary school, church or fire station. Most are located in the rural areas some distance from other Towns or facilities. A few are close enough to an urban center to be associated with the Urban Growth Area or a Town Growth Area. Many have vacant lots that are suitable for infill development. No new Rural Villages are being recommended at this time.
Because Rural Villages are an integral part in defining the evolution of the County’s growth, it is recommended that the Villages continue to be reviewed for their historical potential so that “historical sub-areas” may be further delineated within the boundary of the villages. The intent is to create historical sub-areas within the Rural Villages so that additional emphasis can be placed on design criteria thereby preserving the historical nature of the area in terms of scale and compatibility.
Development should be limited to infill development in accordance with the defined boundaries for the Rural Village. Therefore, major public investment by the County in public facilities and services to encourage substantial new development should not be made in Rural Villages. Instead, priority should be given to correcting existing public health and safety problems that result from failing septic systems or contaminated wells.
This policy area is in Cascade in the northeastern corner of the County and encompasses properties formerly part of the Fort Ritchie military base. The area contains a mixture of housing and supporting commercial uses utilizing the existing built environment of the former base as well as reuse plans. The policy area should be devoted to the continuation of the mixed-use development in the existing built environment as well as the redevelopment plans for the properties. The Special Economic Development zoning designation associated with this land use should continue in order to facilitate the redevelopment of the properties. Revisions to the zoning classification to align with future reuse plans may be required in the future.
Numerous commercial uses exist in scattered locations along roadways and, in many cases, in locations that have been commercial for decades. These uses are currently zoned as Rural Business and are largely owned and managed by local businesspeople who provide valuable services to the community. At the same time, many of these sites have substantial redevelopment and expansion potential, which can attract commercial uses away from the town and urban centers.
While there is no specific land use category established on the Land Use Map, it is recommended that few businesses be allowed by right in the rural policy area and that those principal uses be associated with or support the agricultural industry. Non-agricultural commercial uses in the rural areas should be limited to uses that serve the needs of the rural residential population, provide for recreation and tourism opportunities, and that support, complement, and promote the farming, forestry, and heritage tourism industries. These types of uses should require implementation of a Rural Business Overlay as directed in the Zoning Ordinance. In addition, commercial uses in the rural areas should be strictly limited to help avoid drawing traffic onto rural roads and creating conflicts with existing residential communities.
Ì Complete a comprehensive rezoning of the areas affected by Growth Area amendments recommended in this chapter.
Ì Update and revise the Zoning and Subdivision Ordinance regulations to incorporate appropriate zoning districts and development standards recommended in this chapter.
¾ RT zoning should have a lower lot size (12000 sq. ft) to meet PFA criteria. While the RT zoning district meets the average zoning density for PFA standards, the majority of development that occurs in these areas are single-family residential units. The current minimum lot size of 15,000 sq. ft. does not meet the PFA standard of three (3) du/ac; and, therefore, reduces our ability to meet long-term PFA goals. It is recommended that the minimum lot size in RT be reduced to 12,000 sq. ft. lots.
¾ Higher density residential uses such as townhouses should be permitted within the RU zoning district to promote more affordable housing opportunities.
¾ Update the overall Zoning Ordinance to reflect new uses and trends that have occurred within the 50 years since the Ordinance was first adopted.
¾ Incorporate language into urban zoning districts to implement the mixed-use corridor policy area.
Ì Work with the municipalities to incorporate ways to achieve the County’s goal to pursue policies that facilitate development in appropriate areas, including the designated growth areas, when updating the community comprehensive plans.

Ì Coordinate with the municipalities to plan for future annexation areas, and for compatible land uses along common boundaries.
¾ New Interior Streets – Continue to promote new street construction to provide access to the highway network instead of using existing high order highways in order to reduce potential points of conflict.
¾ Landscaping – Criteria should be developed to promote both aesthetic and functional landscaping especially for non-residential uses.
¾ Pedestrian systems – Continue to develop a comprehensive and cohesive pedestrian system in designated growth areas to promote connectivity and sustainable living environments.
¾ Open space and community facilities – Develop criteria to require dedication of land for open space, parks, and/or community facilities necessary to provide service to a growing population.
¾ Parking – Evaluate parking regulations to determine if reductions can be made to large impervious surfaces. For example, review off street parking requirements for large nonresidential uses such as shopping centers. Also develop new policies for on-street parking facilities.
¾ Develop standards for infill development that account for context sensitive design such as lot size, lot width, and building setbacks.
Ì Continue to use the Adequate Public Facilities Ordinance to manage the location and timing of new development and its effects on schools, roads, and other public facilities.


The purpose of the Implementation Element is to recommend methods and resources to successfully accomplish the proposals set forth in the Comprehensive Plan and ensure the continued growth and management of assets in Washington County, as required for local governments through the Land Use Article of the Maryland Annotated Code. To accomplish the goals, objectives, and strategies of this Plan, a wide range of implementation measures are recommended. The implementation measures recommended should be viewed as a guide to the future growth of Washington County. The recommended implementation measures involve agencies at all levels of government, private organizations, developers, and the public; however, the final responsibility for the implementation of the Plan lies with the County’s citizens and elected officials. This Plan is the product of considerable effort on the part of Washington County and its County Commissioners, Planning Commission, Department of Planning and Zoning, as well as many other County departments, the stakeholders, and concerned citizens. Throughout the Plan, each chapter presents suggested strategies to accomplish future goals on individual topics. This chapter categorizes strategies, projects, programs, or services to guide implementation.
The Comprehensive Plan is not a stand-alone document, but is supported by (and, in turn supports) related planning program documents including the following:
• Zoning Ordinance
• Subdivision Ordinance
• Forest Conservation Ordinance
• Capital Improvement Program
• Stormwater Management and Erosion and Sediment Control Ordinance
• Floodplain Management Ordinance
• Adequate Public Facilities Ordinance
• Water and Sewerage Plan
• Land Preservation, Parks and Recreation Plan
• Solid Waste Management and Recycling Plan
• Building and Housing Codes
• Hazard Mitigation Plan
• County Watershed Improvement Plans
• Comprehensive Plans of incorporated municipalities
This Plan is intended to provide a snapshot of existing processes and analyze future projections to inform future decision makers when updating land use documents and policies. Within this chapter is a listing of goals, objectives and recommendations to implement this plan as it relates to the eight (8) overarching goals of the Plan listed in Chapter 2. This chapter summarizes information included in the previous chapters and provides a schedule to assist in the implementation of the Plan. The tables included below are organized to show implementation in one of three categories;

Short-Term (0-5 years)
Medium Term (6-10 years)
Long-Term (11+years)
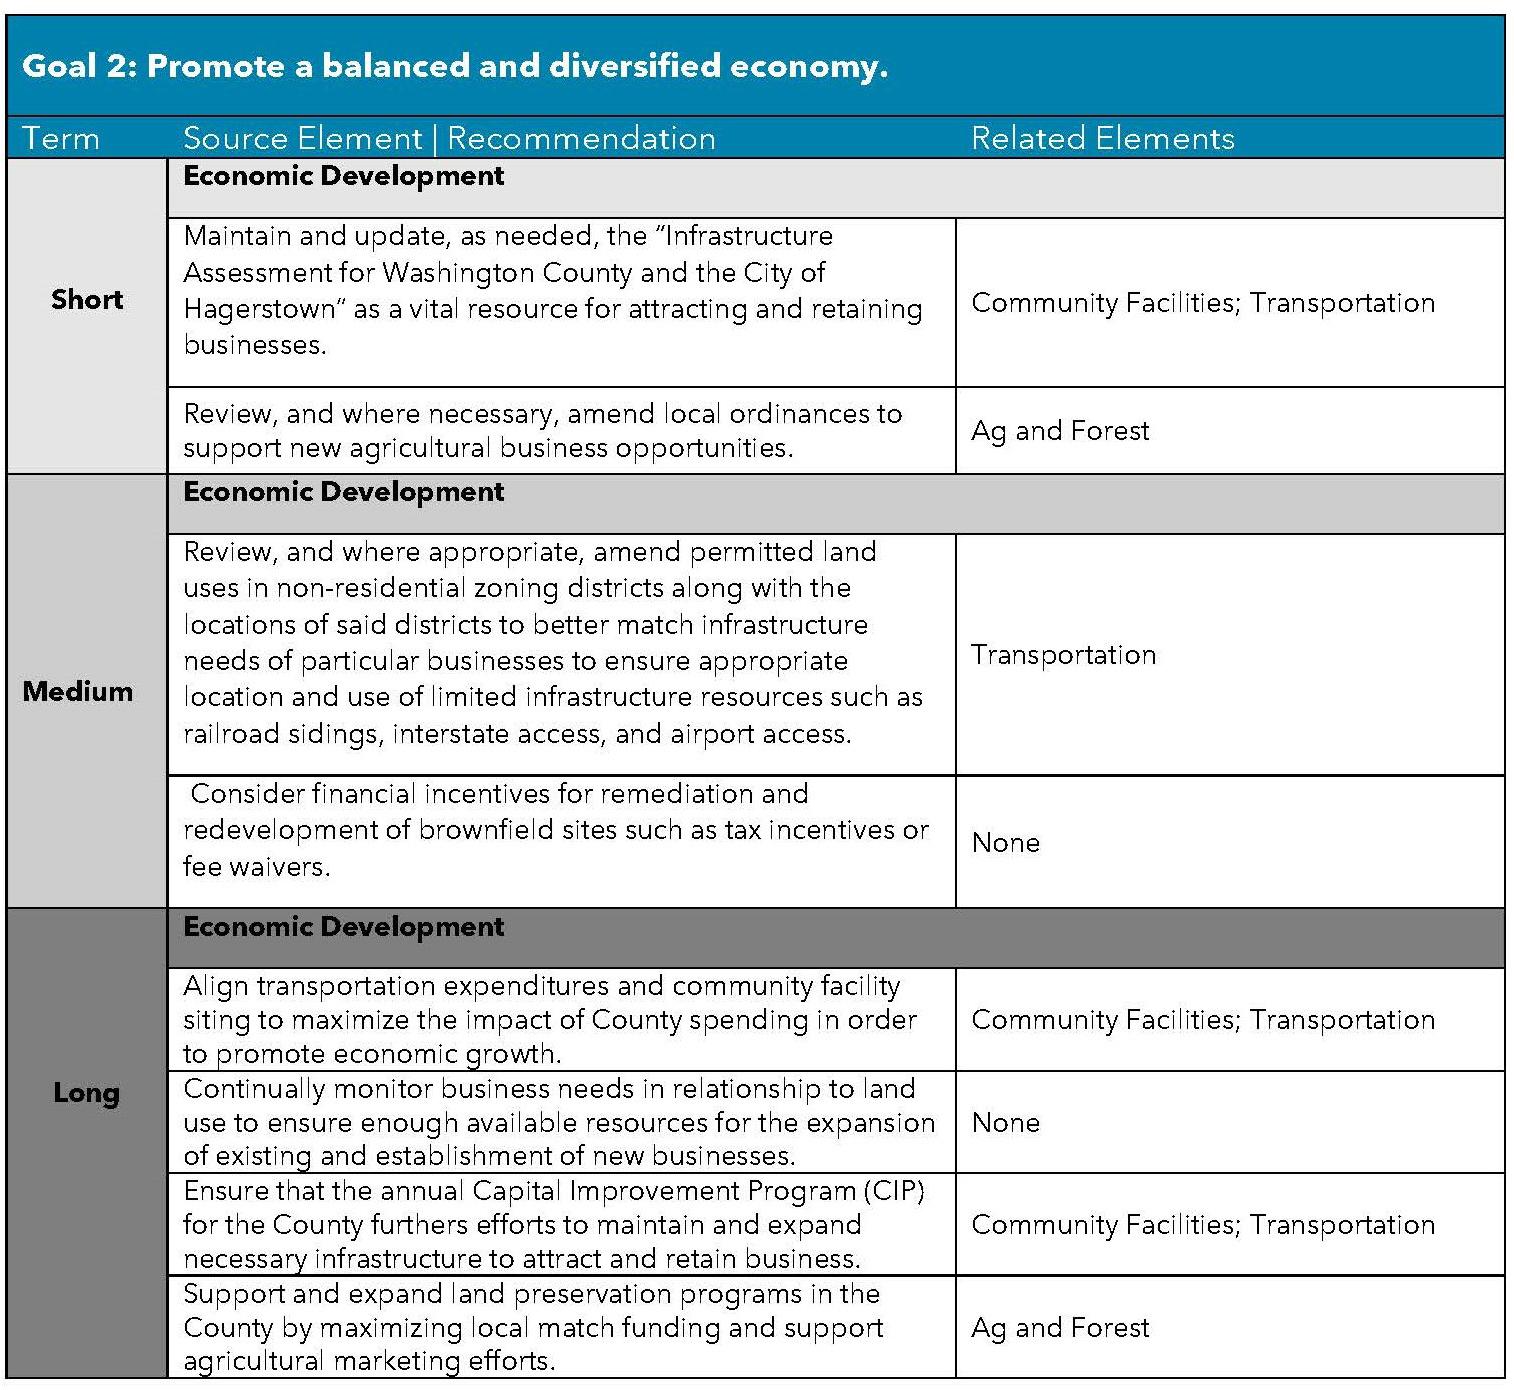
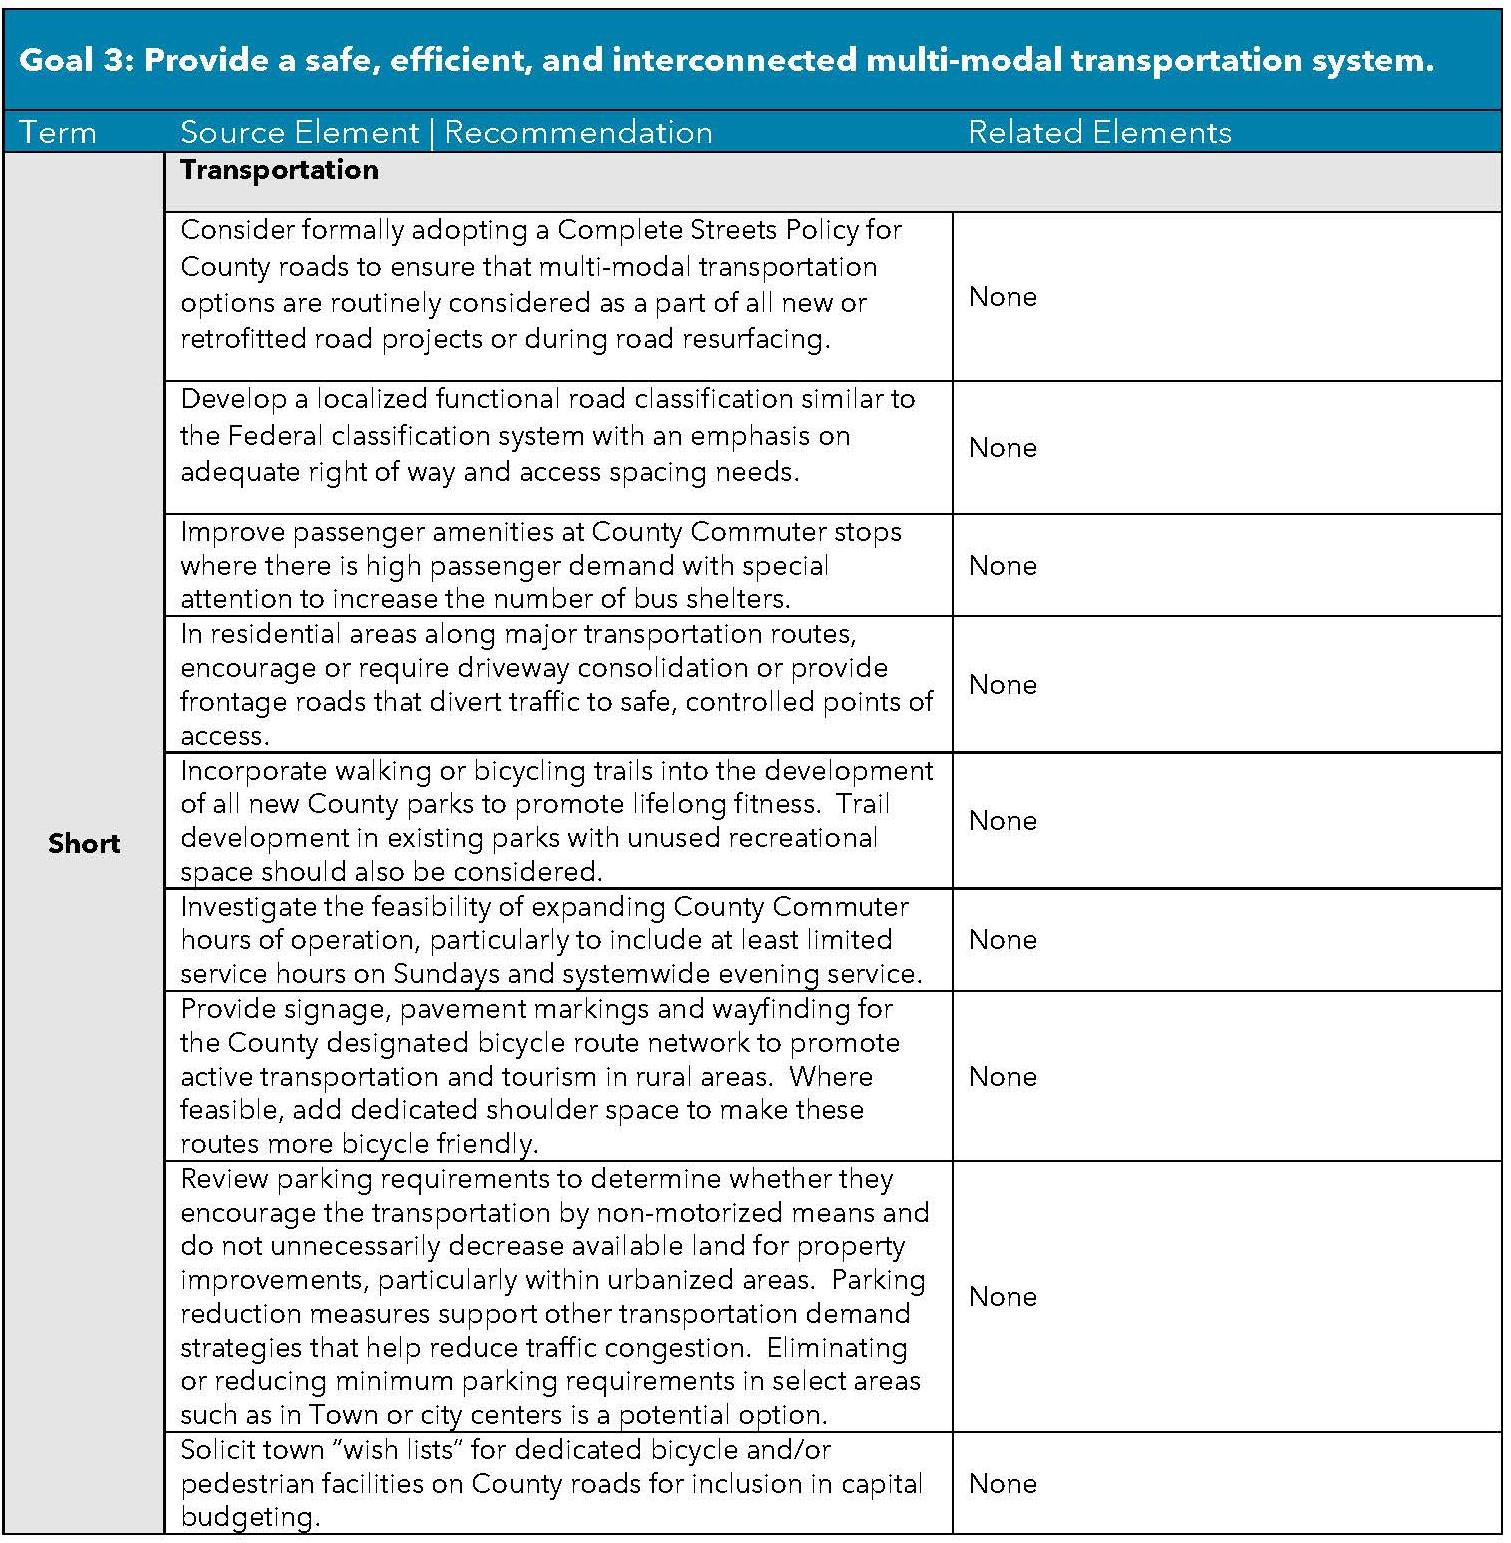
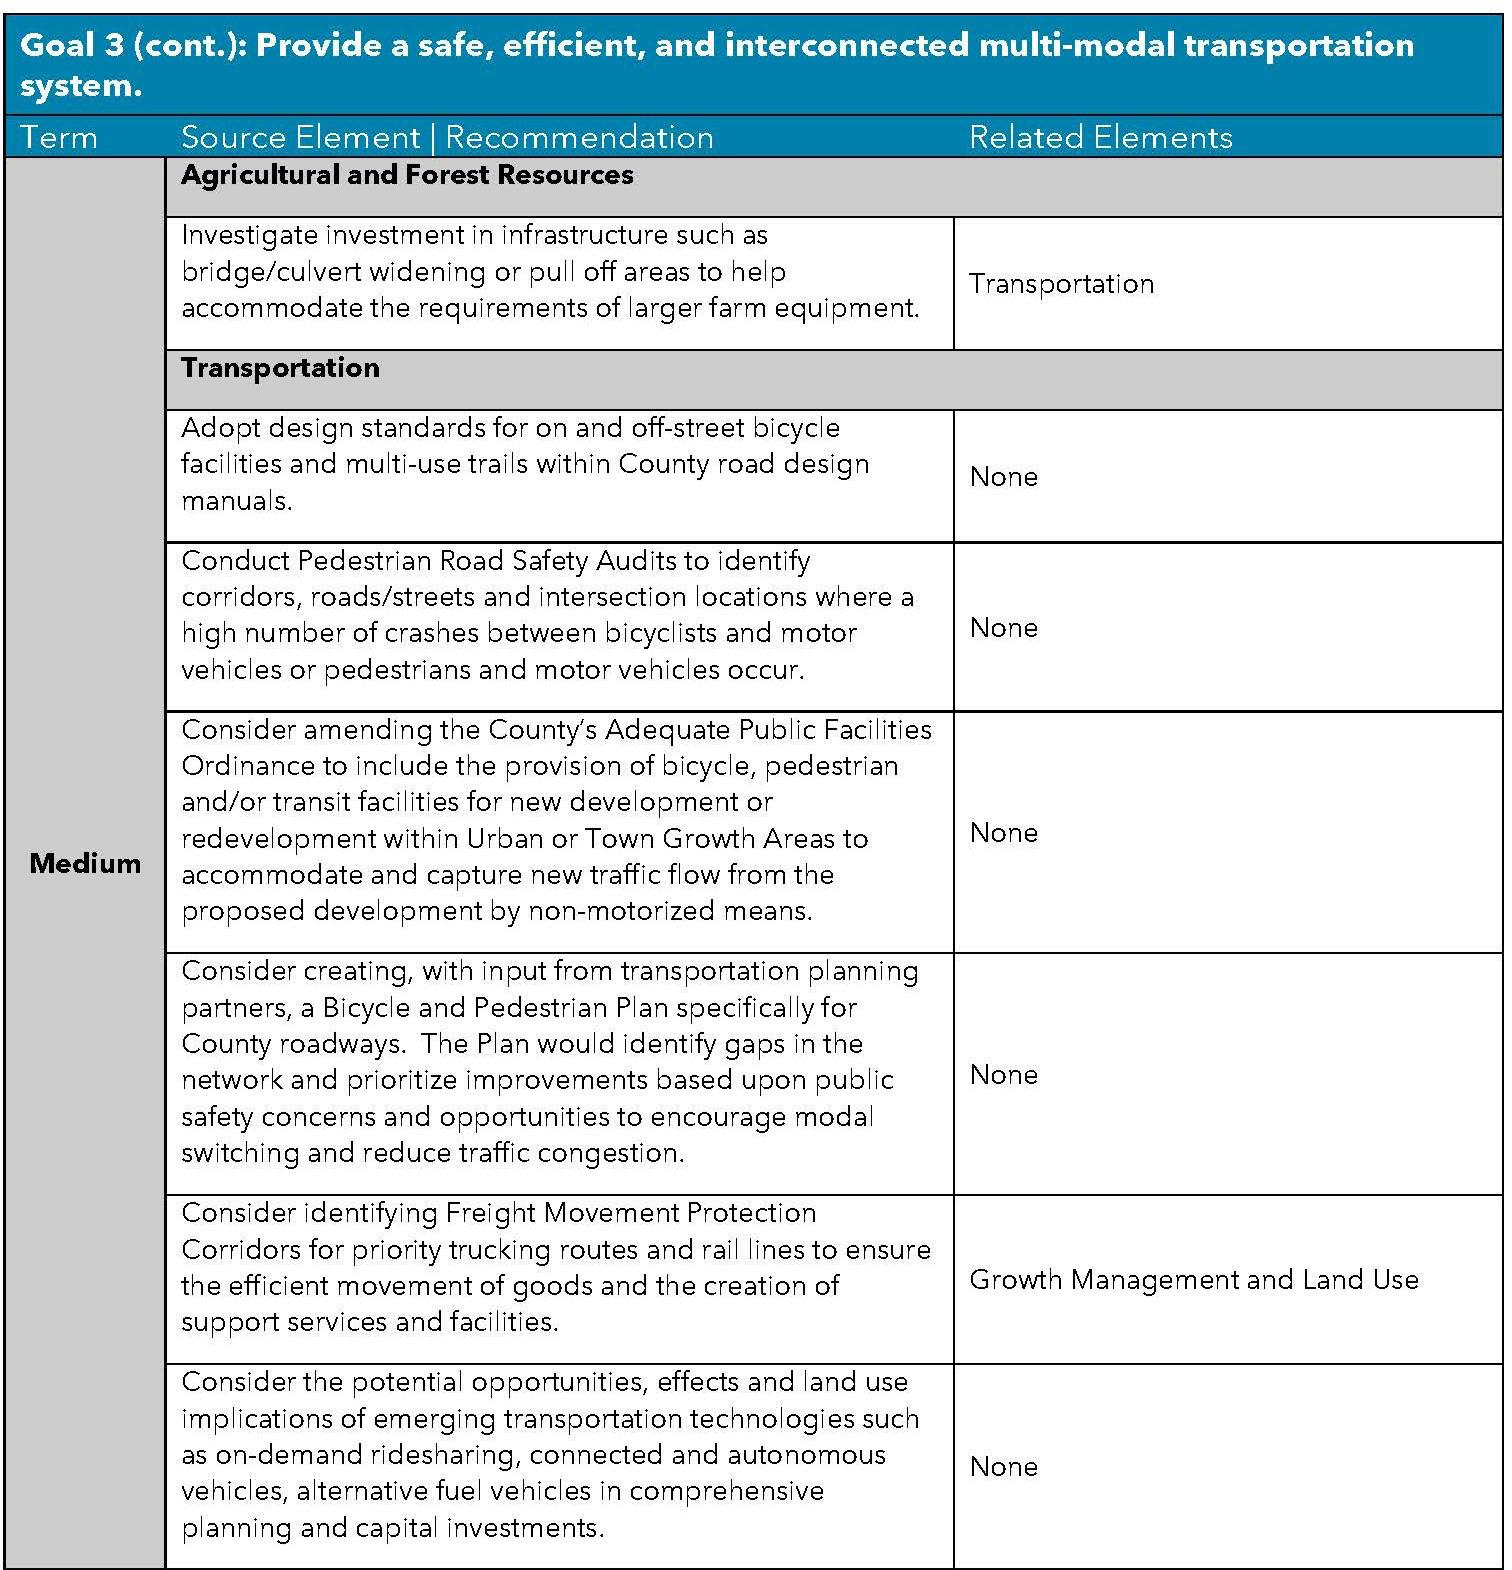
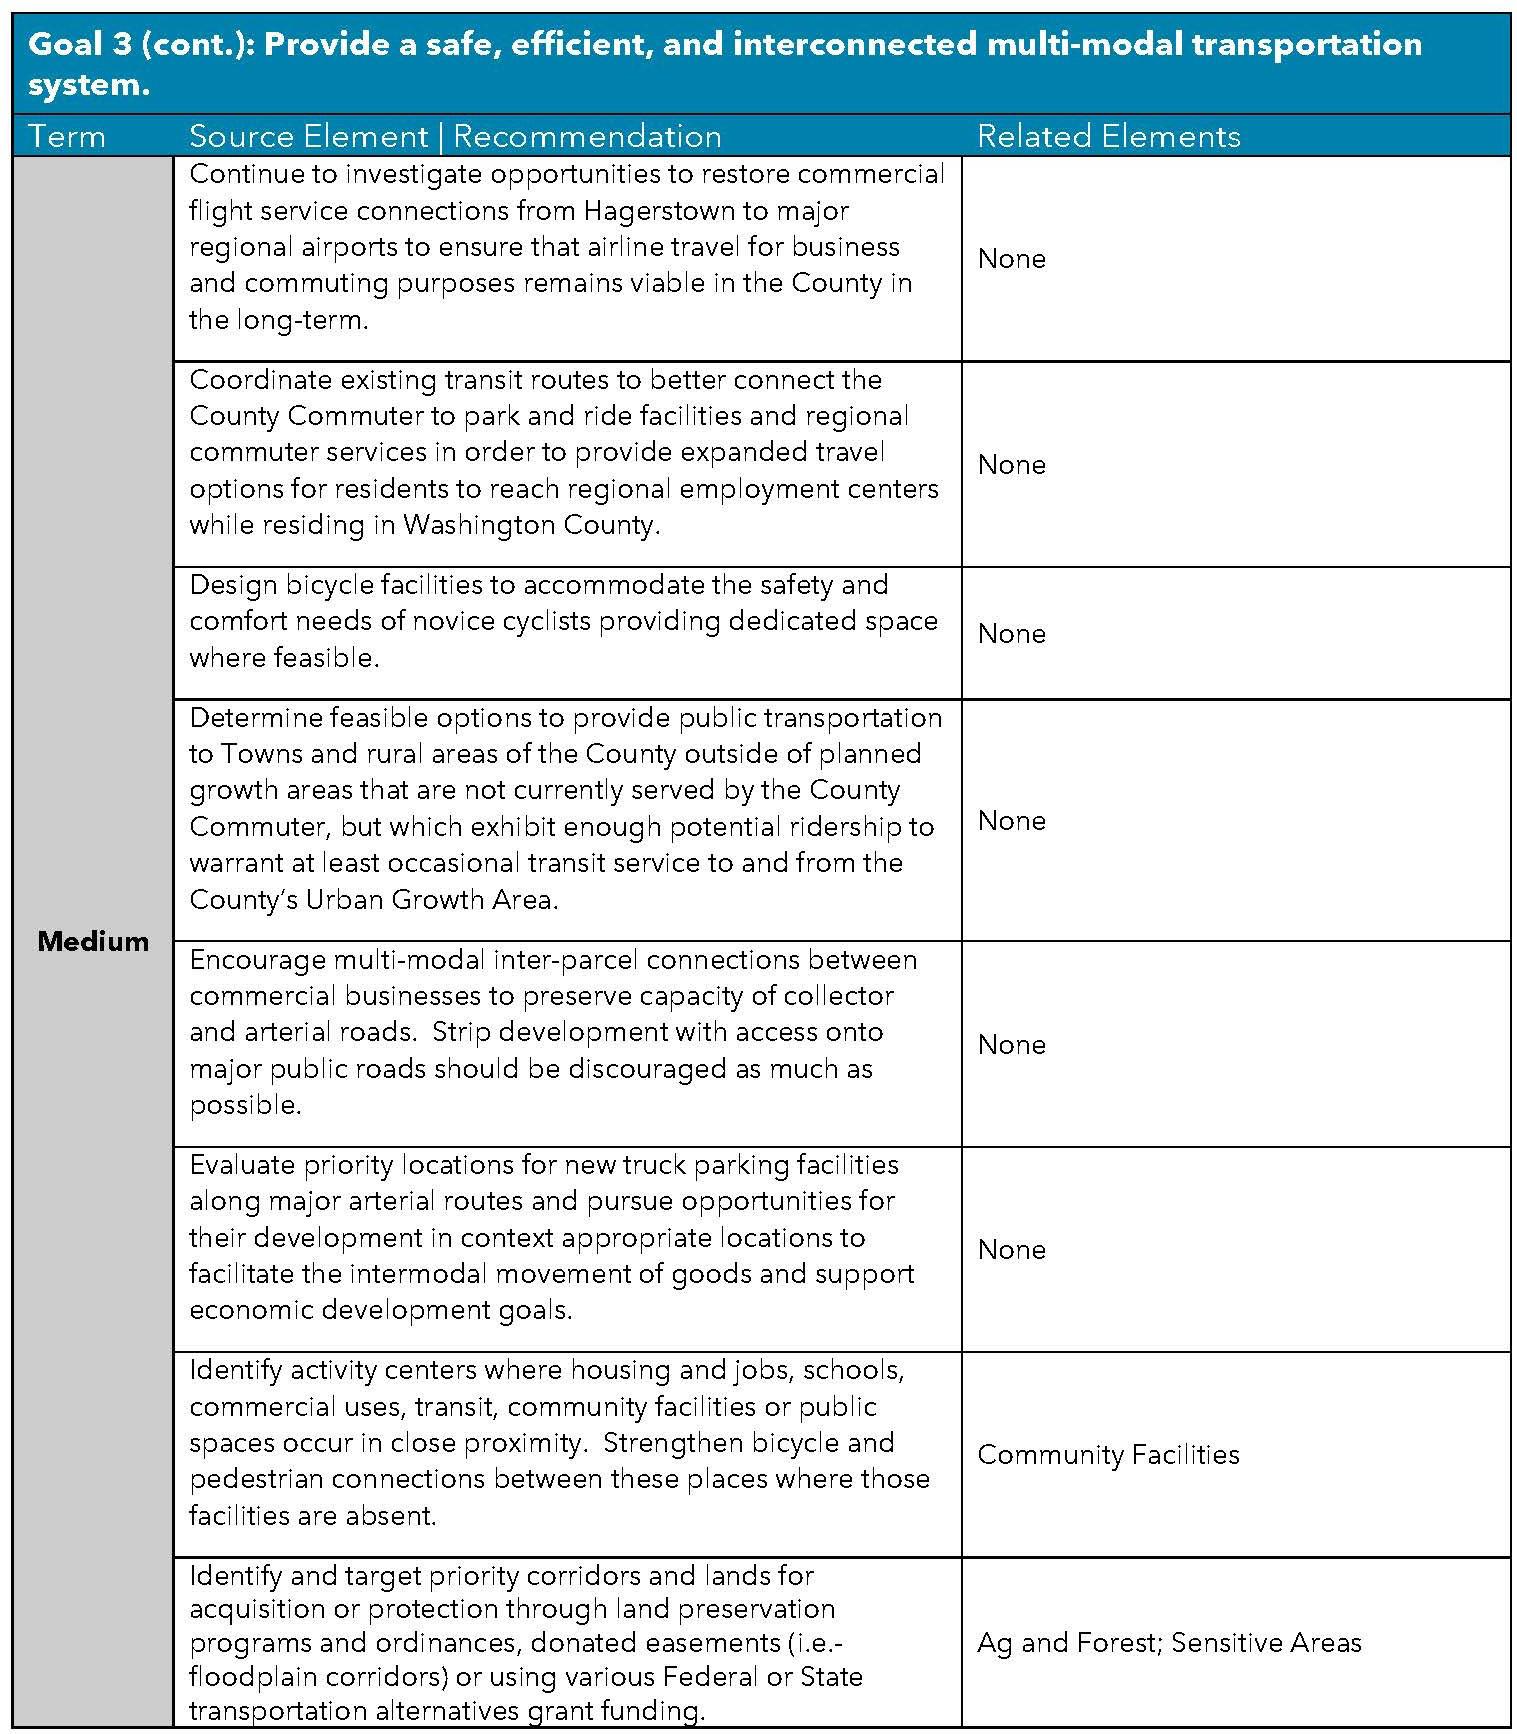
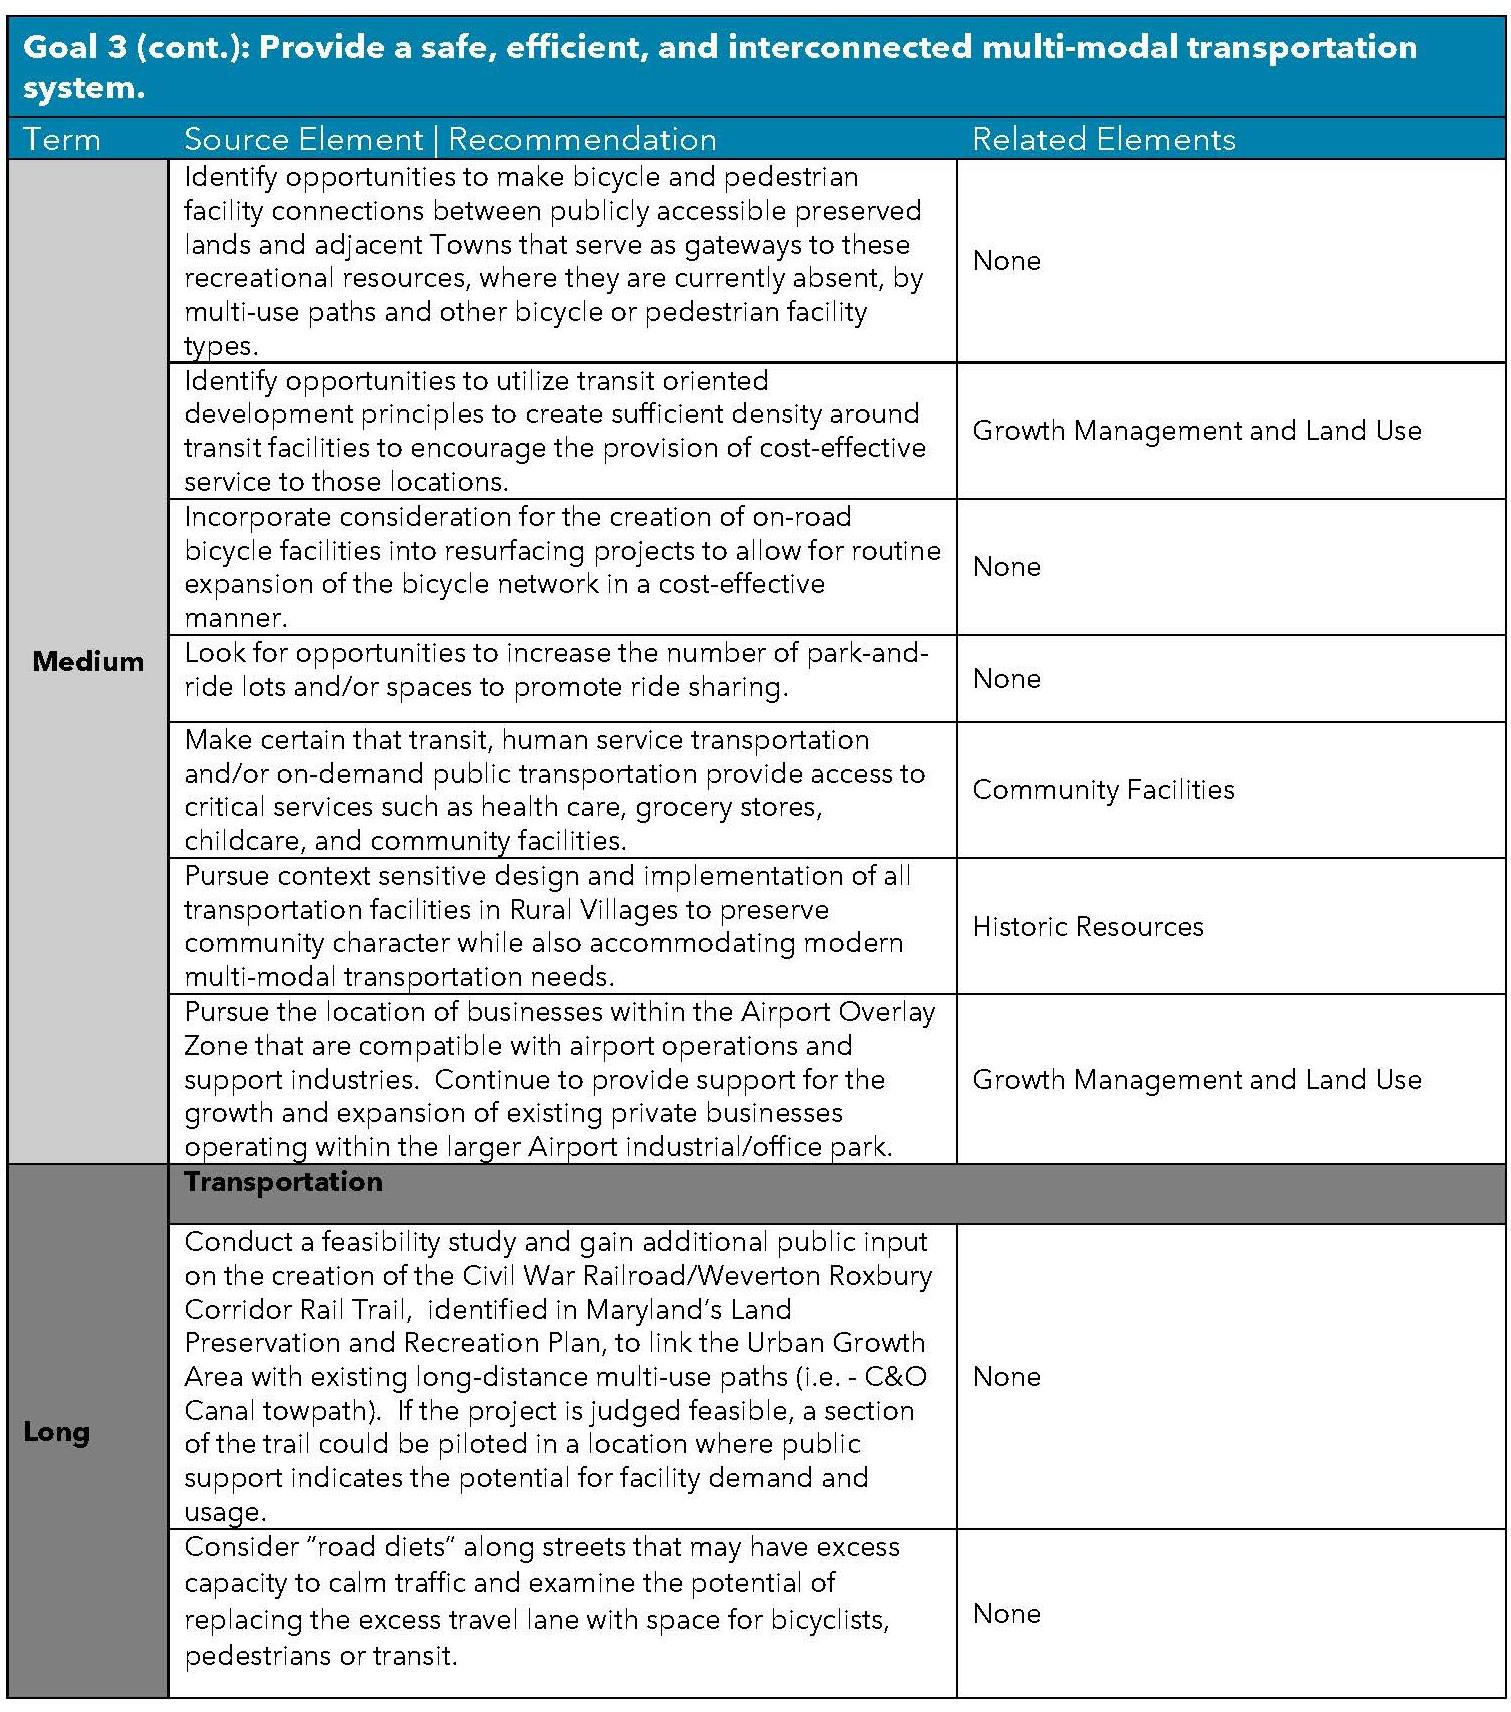
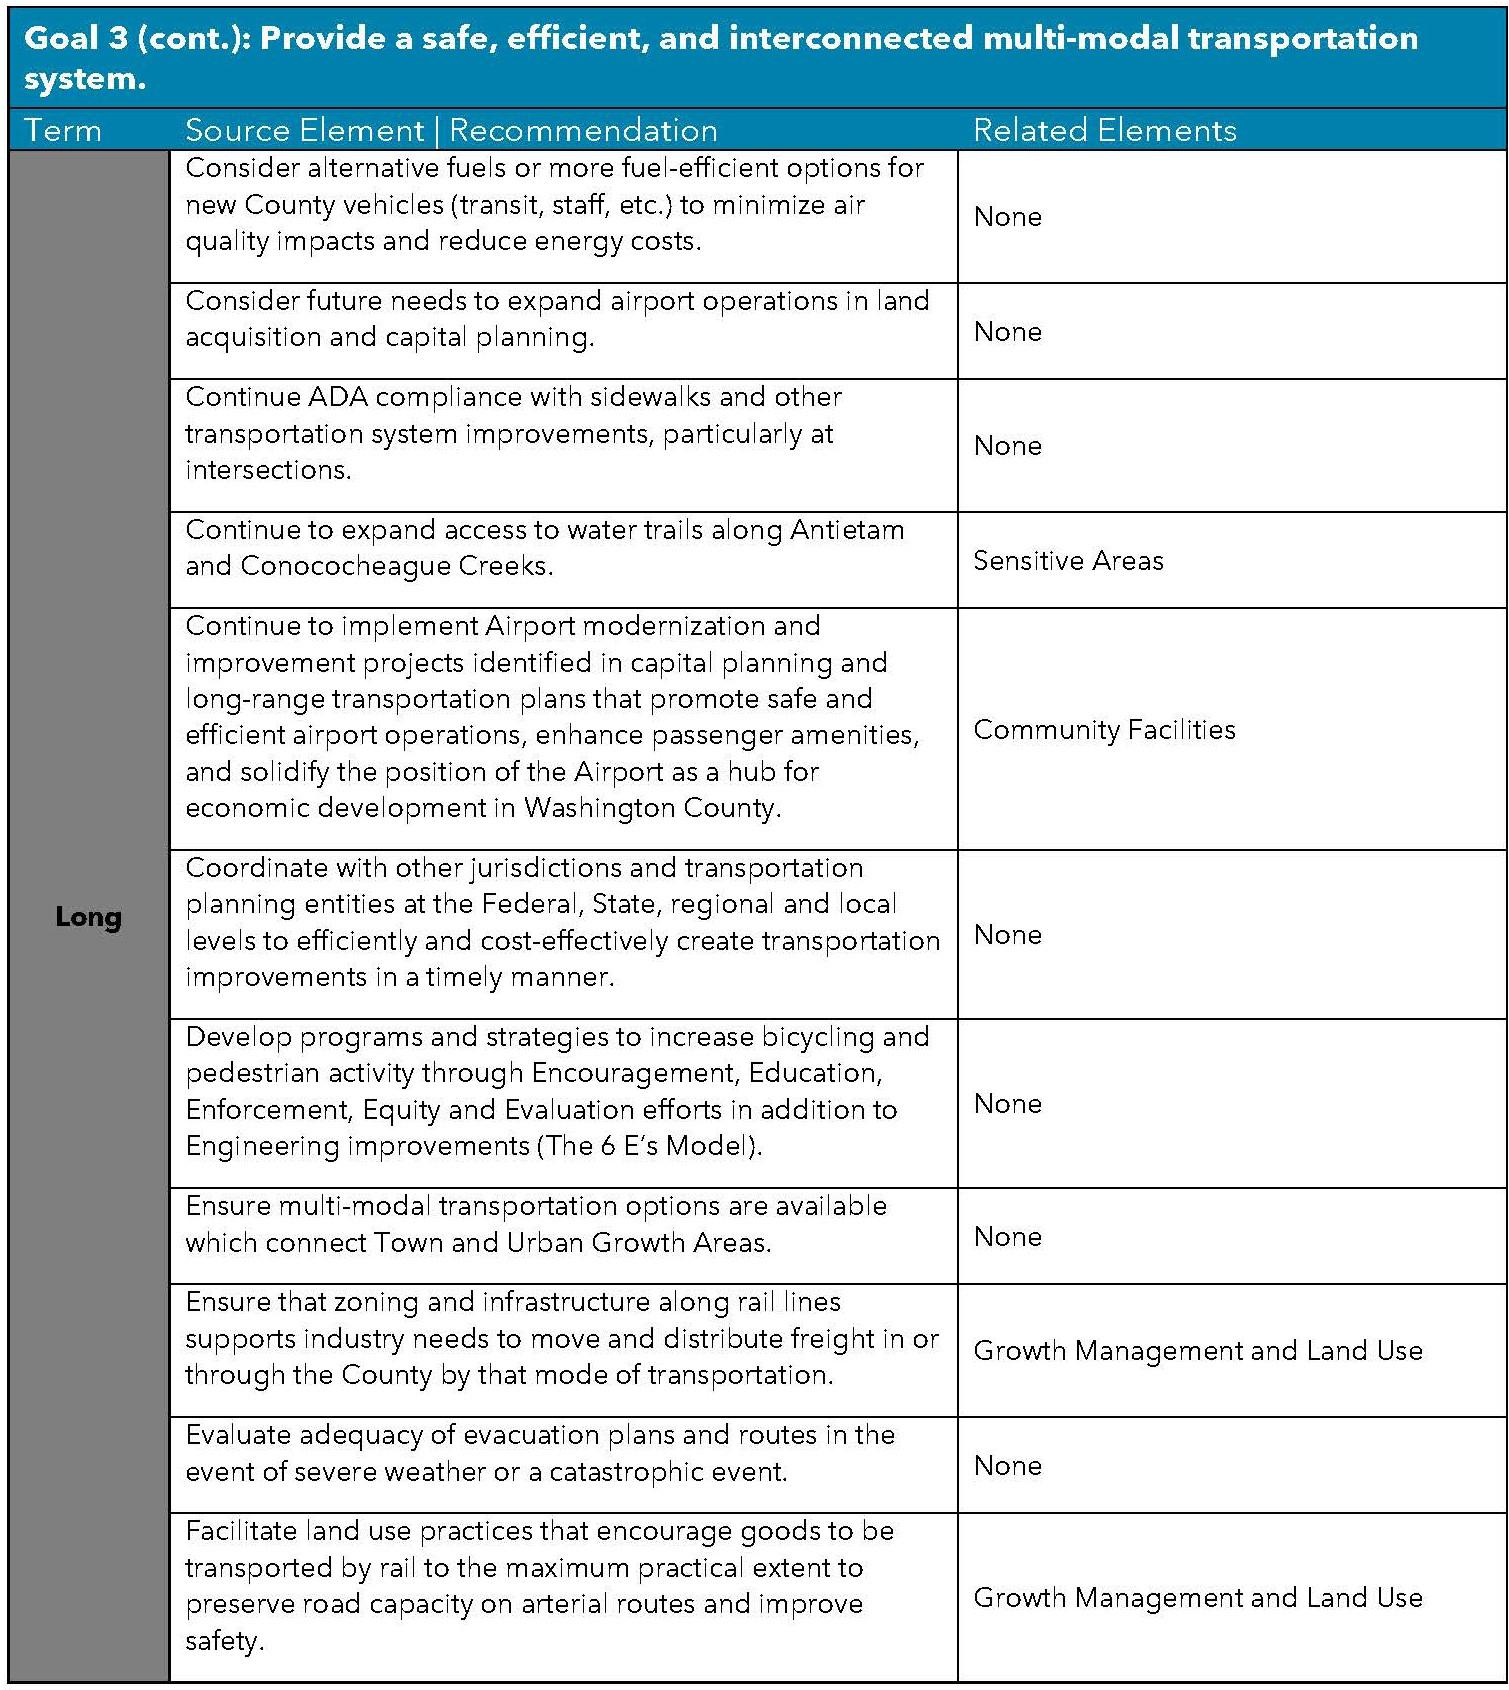

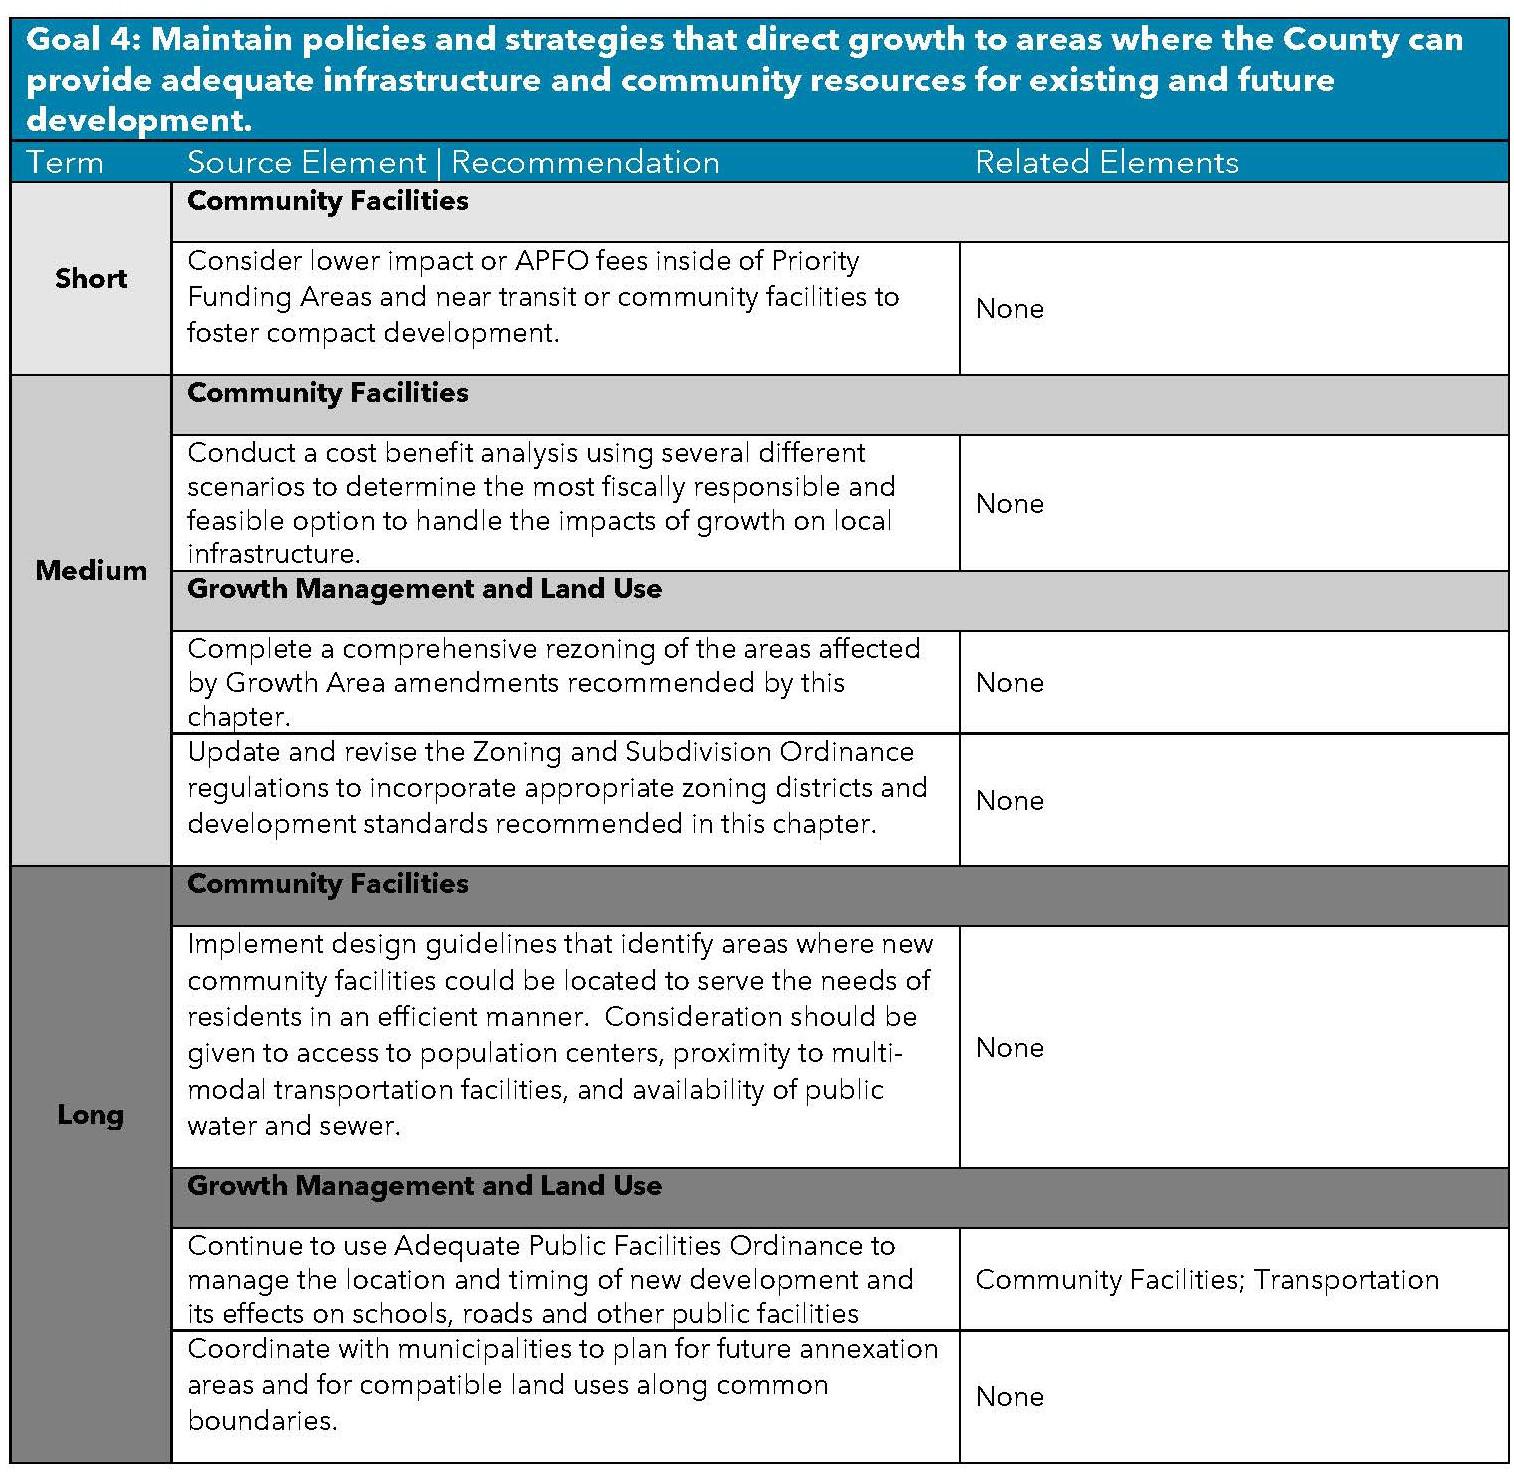

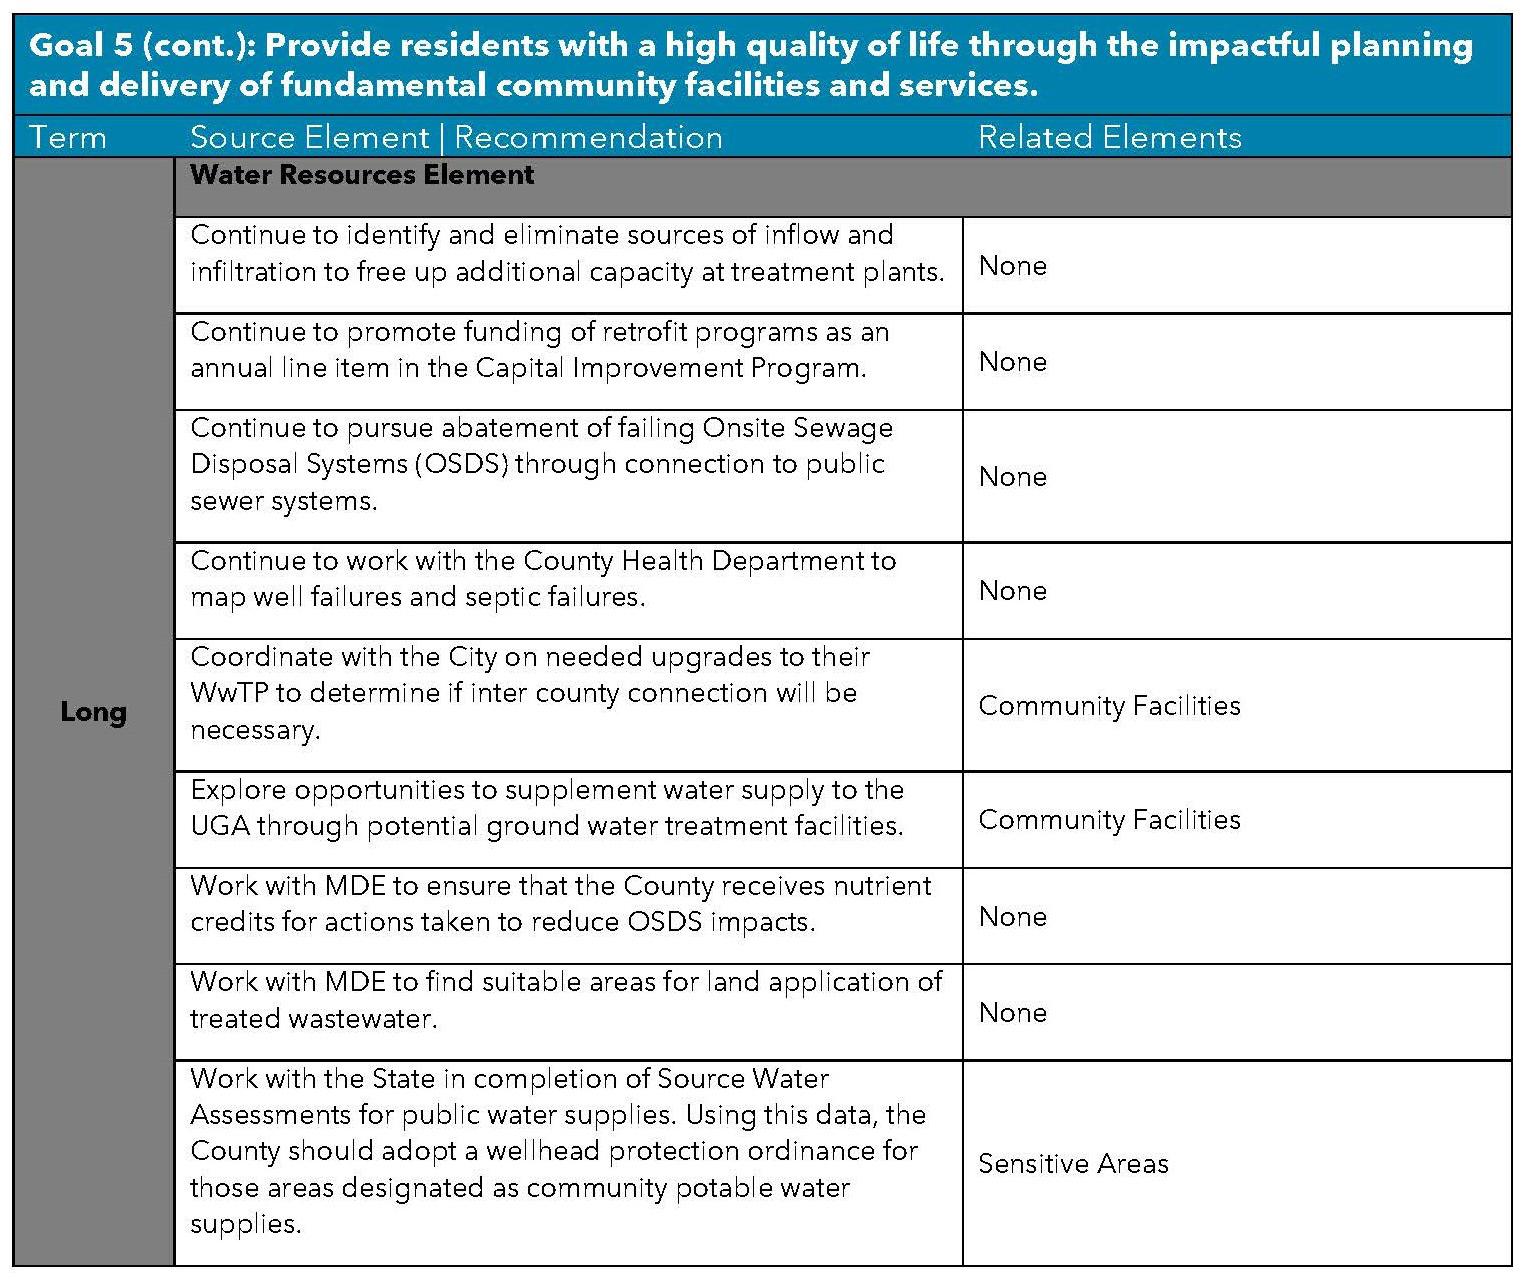

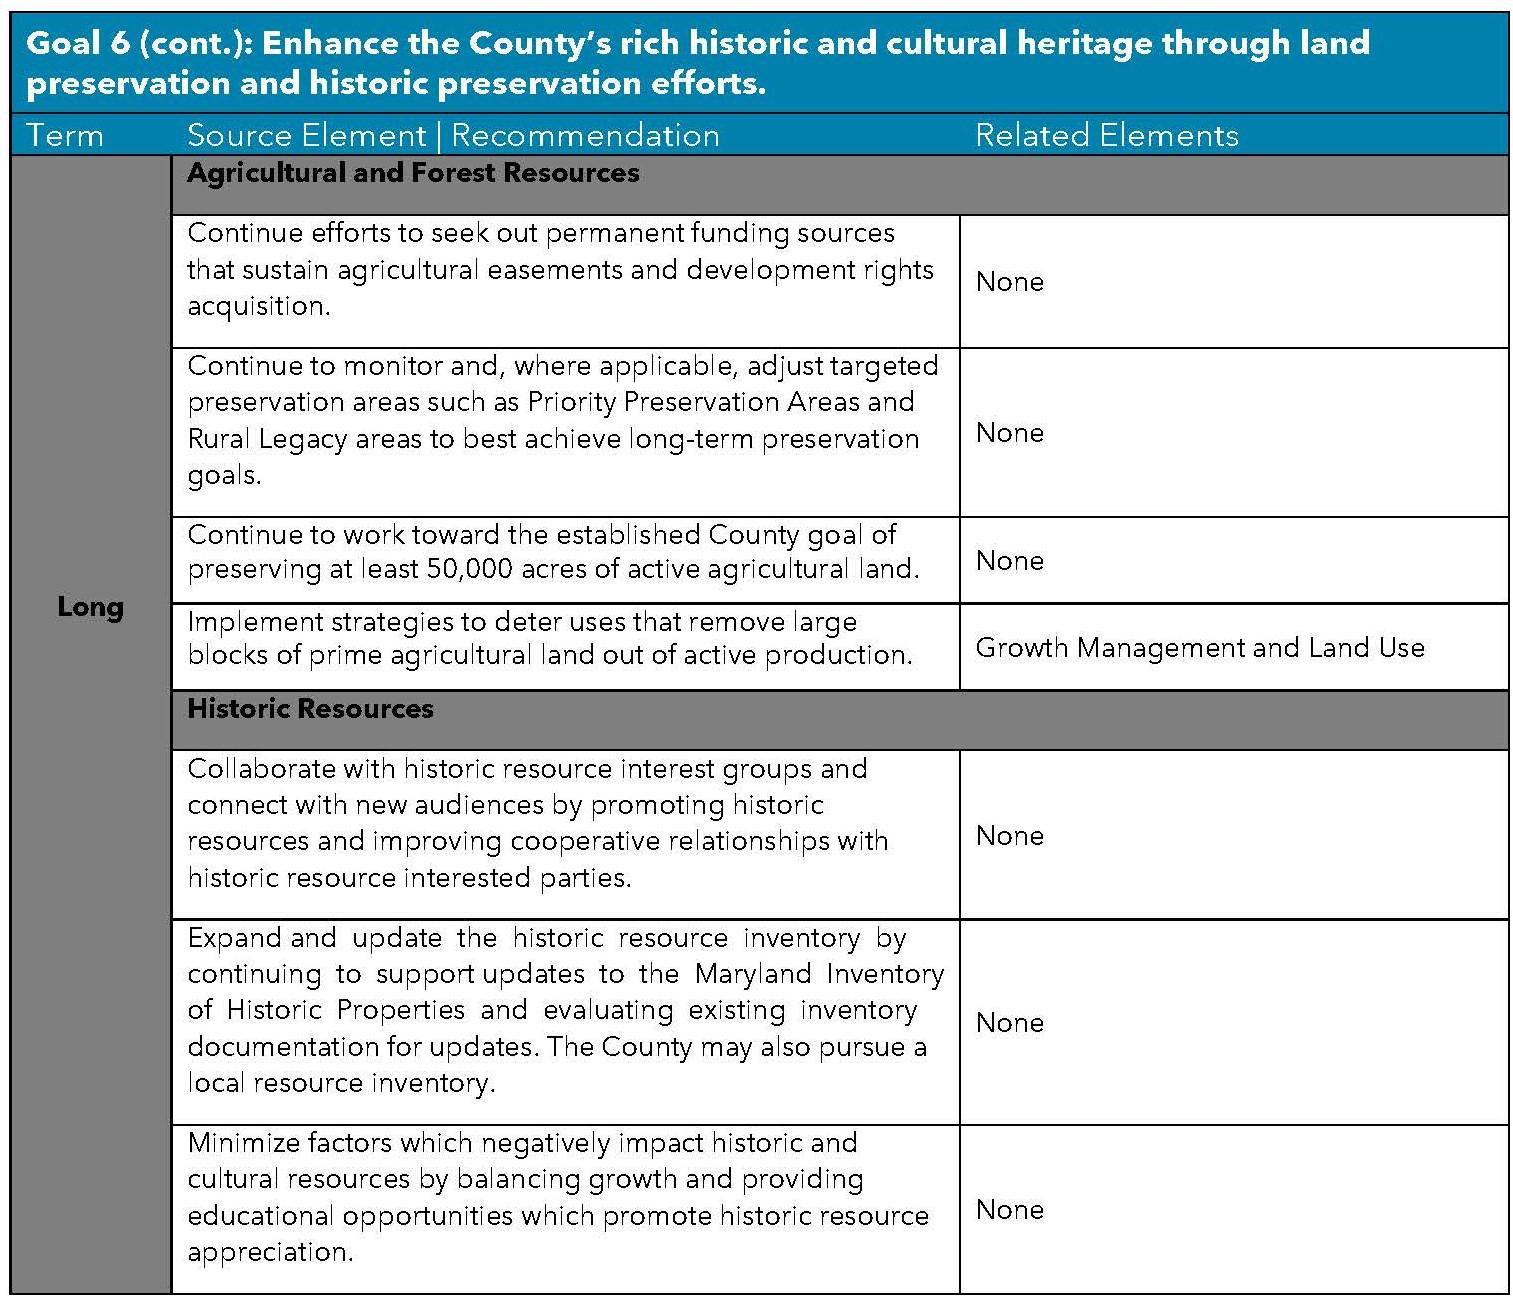


The transportation concepts and standards that follow are intended to provide further understanding of the content that has been included in the Transportation Element of the Comprehensive Plan. The intent of this material is to offer further context for the recommendations contained within the chapter, and to broaden reader understanding of key design concepts, regulatory standards and academic research into multi-modal transportation planning. It should be used for informational purposes only and is not intended to comprehensively cover all aspects of multi-modal transportation planning or replace authoritative plans, manuals, standards or guides developed by public or private transportation planning entities. For further reading, consult the long-range transportation plans and other publications referenced in the chapter and within the text below.
The maximum hourly rate of persons or vehicles that can be expected to traverse a given road segment or point, such as signalized intersections, under prevailing road, traffic and control conditions is known as its capacity. A road facility’s stated capacity defines a flow of traffic that can be achieved repeatedly for peak periods of demand. Thus, because transportation facilities operate poorly at full capacity, stated capacity is not the highest flow rate recorded at a facility. Instead, qualitative measures such as a roadway’s level of service seek to better describe the facility’s performance under prevailing conditions.
Level of service (LOS) measures operational conditions experienced by users within a flow of traffic or at an intersection. Quality levels are assigned based upon performance measures such as traffic volume compared to facility capacity, travel time, and user comfort derived from multiple variables like road conditions, safety hazards and travel distance. Publications such as the Federal Highway Administration’s Highway Capacity Manual or the American Association of State Highway Transportation Officials Geometric Design of Highways and Streets (“Green Book”) are the primary guidance documents used to grade the service of a facility.
Typical Level of Service systems assign a letter designation from A to F, with LOS A being the best operating conditions and LOS F the worst. These terms are defined below and on the following page:
¾ LOS A: Free Flow. Traffic flows at or above the posted speed limit and motorists have complete maneuverability between lanes
¾ LOS B: Reasonably Free Flow. LOS A speeds are maintained, maneuverability within the traffic stream is slightly restricted.
¾ LOS C: Stable Flow. Ability to maneuver through lanes is noticeably restricted and lane changes require more driver awareness. Declines in comfort and convenience.
¾ LOS D: Approaching Unstable Flow. Speeds slightly decrease as traffic volume slightly increases. Freedom to maneuver within the traffic stream is much more limited and driver comfort levels continue to decrease.
¾ LOS E: Unstable Flow, Operating at Capacity. Flow becomes irregular and speed varies rapidly because there are virtually no usable gaps to maneuver in the traffic stream and speeds rarely reach the posted limit. Comfort and convenience have reached poor levels.
¾ LOS F: Forced or Breakdown Flow. Every vehicle moves in lockstep with the vehicle in front of it with frequent slowing required. Travel time cannot be predicted, with generally more demand than capacity. Accident exposure increased significantly.
In addition to analyzing roadway segments, engineers also look at the level of service at roadway intersections. Intersections can cause a high level of disruption in traffic flow on individual segments of a road network. This disruption is measured in terms of time waiting for an opportunity to make a turn onto another road segment. Intersection level of service becomes extremely important in maintaining the safety of our local road network. The table below outlines the average wait times and their corresponding level of service.
Source: Highway Capacity Manual 5th Edition (2010)
Functional classification is the process by which streets and highways are grouped into classes, or systems, according to the character of the service they intend to provide in moving the public through the transportation network.
Federal guidelines define three primary classification categories that are used: Arterial, Collector, and Local. Arterial and Collector roads also have sub-classifications that further define their mobility characteristics. These sub-categories have changed over the years. The most recent guidance provided by Federal Highway Administration is outlined in
Highway Functional Classification Concepts, Criteria and Procedures 2013 Edition. According to these new guidelines, the focus of road classification should be on the function of the road and not whether the road is located in an urban, rural or rural context. Table 2 below shows the changes to the Functional Classification System, followed by definitions for the current Federal Functional Classifications.
New Functional Classifications
Old Urban Functional Classifications
Old Rural Functional Classifications
Interstate Urban Interstate Rural Interstate
Other Freeways and Expressways
Urban Other Freeways and Expressways
Other Principal Arterial Urban Principal Arterial Rural Other Principal Arterial
Minor Arterial Urban Minor Arterial Rural Minor Arterial
Major Collector Urban Collector
Rural Major Collector
Minor Collector Rural Minor Collector
Local Urban Local Rural Local
Source: FHWA Updated Guidance for the Functional Classification of Highways Memorandum, October 14, 2008
Ì Arterial: Interstate/Expressway/Freeway
¾ Provide for the continuous and efficient routes for movement of high-volume traffic over long distances;
¾ Controlled roadway access points limit access to adjacent land uses;
¾ Higher posted speed limits;
¾ Multiple travel lanes separated by physical barrier;
¾ Usually funded and maintained by state government;
¾ Supports regional mobility;
Ì Arterial: Other Principal Arterial
¾ Serve high-volume traffic in major centers of metropolitan areas;
¾ Adjacent land uses may be served directly through at grade intersections or driveways to specific parcels;
¾ Typically funded and maintained by a local government;
¾ Supports regional mobility;
Ì Minor Arterial
¾ Serve moderate length trips and geographical areas;
¾ May serve local bus routes and include sidewalks, signalized intersections, or on-street parking;
¾ Typically maintained by local government, but capital costs may be the responsibility of state government;
Ì Collector (Major and Minor)
¾ Gather traffic from local roads and funnel into arterial network;
¾ Major collectors usually have longer, fewer driveways, higher speed limits and traffic volumes and more travel lanes than minor collectors;
¾ Provide traffic circulation within residential neighborhoods as well as commercial, industrial or civic districts;
¾ Generally designed, constructed, and funded by local government;
Ì Local
¾ Provide direct access to adjacent land uses over short travel distances;
¾ Lower posted speed limits;
¾ Designed to discourage through traffic;
¾ Not typically a part of transit routes;
¾ Usually funded by local government.
An alternative approach to addressing congestion related issues in transportation planning from expanding road capacity is demand management. Transportation demand management (TDM) looks at a range of strategies to reduce front end demand for road facilities, such as expanding transportation choices, financial incentives, land use management, and other policies and programs. At the State level, Commuter Choice Maryland is Maryland’s TDM Program. This program includes programs and investments in transit facilities and services, carpool and rideshare information and facilities, bicycle and pedestrian facilities, teleworking assistance, Maryland Commuter Tax Credit, education and marketing to individuals and employers, and Guaranteed Ride Home for transit users or those carpooling. Additional strategies such as promoting compact development, toll or road pricing strategies, fuel taxes, and parking management all fall under the larger umbrella of TDM beyond what is promoted by the State’s program.
The Hagerstown Eastern Panhandle Metropolitan Planning Organization (HEPMPO), in consultation with the State Highways Administration (SHA), completed a "Transportation Systems Management and Operations Plan" in 2020 for I-81 and I-70 in Washington County. Both I-81 and I-70 are priority freight corridors, experience on-going construction activities and have a history of weather-related travel impacts and severe accidents. This plan identifies non-capacity adding strategies to help optimize traffic flow during recurring and non-recurring congestion on existing facilities. The plan focuses on three different categories of strategies for implementation: (1) geometric and safety improvements, (2) traffic flow and signals and (3) intelligent transportation systems (ITS) expansion. Examples of demand management strategies for arterial roads include real-time traveler information, corridor management, ramp metering, the use of freeway shoulder for peak period travel, HOV lanes, reversible lanes, ramp metering and signalization, variable speed limits, park and ride facilities, connected and automated vehicle deployment, weather and traffic incident management, and more.
Traffic calming uses a variety of street design and management techniques to improve the safety of roadways for multiple modes of transportation while enhancing the livability of adjacent communities. Traffic calming measures, which are typically installed in urbanized areas where current street conditions may present an unsafe or undesirable environment for non-motorized users, can encompass a wide range of design interventions. Examples include reducing lane widths and speed limits, managing traffic flows, creating roundabouts, speed bumps, pavement treatments, pinch points, landscaping in medians or along rightof-ways, refuge islands for pedestrians and many other techniques. Many communities in Washington County, by virtue of their historic settlement and development prior to the advent of automobile transportation, already possess some of these characteristics such as reduced lane widths in urban and town centers. Considering additional supportive design measures such as those described above, some of which have already been implemented in select locations, could further enhance the safety and livability of many urbanized areas in the County.
Accounting for variability and vulnerability in transportation planning, design and construction helps to improve the safety, reliability and sustainability of the transportation network as a whole. With weather and climate patterns becoming more unpredictable, creating a resilient transportation network that can adapt to rapidly changing conditions has become increasingly important. For example, severe flash flooding affected southern Washington County in May 2018 which damaged roadways in 73 different locations and necessitated the rescue of several local residents. Given the immense costs associated with cleaning up from these major events, planning for uncertainty in advance plays a large role in the ability of communities to recover in the aftermath of these unforeseen events.
Strategies for creating a resilient or adaptive transportation network can take many forms, including:
¾ Expanding network connectivity and access to multi-modal transportation options so that when one mode of transportation becomes gridlocked, other choices are available
¾ Identifying existing transportation infrastructure within the limits of floodplains or other natural hazards and considering new route alignments
¾ Improving associated drainage and stormwater management infrastructure
¾ Utilizing materials and techniques for paving which adapt to extremes in temperature and precipitation
Context sensitive design recognizes that mobility is not the only goal in transportation planning. Since the 1990s, federal, state and local governments have increasingly considered how transportation facilities impact an area’s quality of life. This broader view of transportation development has sought to solicit greater input from a variety of stakeholder groups to achieve projects that positively impact communities in a manner that supports their desired pattern of development and protects sensitive resources.
One program that supports these larger objectives related to context sensitive design is the Scenic Byways program. Presently, both Federal and State roads can be given Scenic Byway designation. Roads given the National Scenic Byway designation possess one or more of six “intrinsic qualities”: archeological, cultural, historic, natural, recreational, and scenic. The program was established by Congress in 1991 with the passage of the Intermodal Surface Transportation Efficiency Act (ISTEA) to promote tourism and economic development while conserving heritage resources along these roadway corridors. The designation requires the preparation of corridor management plans, with public involvement, to conserve the roadways intrinsic qualities and aid in regional economic development.
The Maryland SHA, in partnership with the Maryland Department of Planning, has created its own program modeled on the Federal program. These entities work with local communities to develop corridor management plans and assist in their efforts to protect and enhance these desirable routes.
The Federal National Scenic Byway designation has been applied to two routes that passthrough Washington County, the Historic National Road (U.S.-40 and US ALT. 40) and “Journey Through Hallowed Ground.” The former route commemorates the nation’s first federally funded interstate highway which opened western lands for settlement and the transportation of goods. The latter route travels primarily through the Catoctin Mountains passing by notable Civil War sites and natural areas, including MD-77 to Smithsburg.
Portions of the State-designated “Antietam Campaign” Scenic Byway pass by places integral to the events of that pivotal Civil War battle in 1862, including several roads in southern Washington County. The “Chesapeake and Ohio Canal” State Scenic Byway follows 236 miles of country roads and state highways in the immediate vicinity of one of the first major transportation routes that moved goods and people into the Country’s interior before the dawn of the age of Railroads. The Byway follows numerous State and County maintained roads in the proximity of the Canal. The C&O Canal is also a 184-mile National Historic Park overseen by the National Park Service.
The preservation of corridors for the protection of sensitive environmental or historic resources is touched upon in the Sensitive Areas and Historic Resources chapters of the Comprehensive Plan.
Transit Oriented Development (TOD) is an urban planning tool which promotes a compact, mixed-use pattern of development by the clustering of residential, commercial and other complementary land uses within reasonable walking distances from transit hubs. The successful implementation of TOD depends on access and density around transit facilities. Typically, TOD areas are located within a ¼ to ½ mile radius of a central transit stop such as a train, light rail, or bus stop.
TOD can be difficult to achieve in a primarily rural area such as Washington County where there is no passenger train, light rail or bus rapid transit system in place and population density to foster higher transit ridership is reduced outside of the City of Hagerstown. The greatest potential for the implementation of TOD in Washington County outside of Hagerstown lies within portions of the Urban Growth Area where residential and business uses are clustered at a reasonably high density. As the County becomes more urbanized and transit services continue to expand incrementally with available funding, TOD may become more viable. Incorporating TOD principles, such as creating mixed-use communities at a pedestrian-scale clustered around activity centers, offers and alternate bridge strategy which is discussed further in the Housing chapter of the Comprehensive Plan.
The appropriate type of bicycle, pedestrian or trail facility typically depends on a variety of factors, particularly the context in which the facility is being designed as well as the larger planning objectives such as user safety or modal switching. Modern road, street or trail design offers facility types which meet the full spectrum of transportation planning objectives.
SHA has produced the guidance document Bicycle Policy & Design Guidelines to provide uniform criteria for bicycle facilities along all State roads. The publication incorporates national guidelines, standards and best practices for use by State and local governments and is consistent with the manual produced by The American Association of State Highway Transportation Officials (AASHTO) Guide for the Development of Bicycle Facilities. Maryland’s design guide contains definitions for each of the typical bicycle facilities deployed on roads throughout the State.
The figure on the following page shows the most common on-street and off-street bicycle facilities, arranging them according to the amount of separation from adjacent vehicle traffic, from least to most. Below a brief glossary taken from the Maryland Bicycle Policy and Design Guidelines manual defines each basic type and notes the corresponding image in the photo above in parentheses, where applicable.
Ì Bikeway - General term denoting any trail, path, part of a highway, surfaced or smooth shoulder or any other travel way specifically signed, marked, or otherwise designated for bicycle travel. Bikeways include bike lanes, shared lanes, shared-use paths, trails, and bike routes.
Ì Bike Route – A system of bikeways connecting two or more points that is deemed most desirable for bicycling. A bike route is designated with guide signs, pavement markings, maps or other means. A bike route may include any of the various types of bikeways or a combination thereof.
Ì Shared Lane (Image 2A) – A roadway lane which is open to both bicycle and motor vehicle travel, without assigned space for each. Specific pavement markings and/or signs (such as that seen at left) may be used to provide positive guidance for drivers and bicyclists allowing them to share the same lane.
Ì Bike Lane (Image 2B) – Any portion of a roadway or shoulder which has been designated for single directional flow and includes pavement markings for the preferential or exclusive use of bicyclists.
Ì Buffered Bike Lanes (Image 2C) – Conventional bicycle lanes paired with a designated buffer space separating the bicycle lane from the adjacent motorized vehicle travel and/ or parking lane. Separation is made by lane markings, not a physical barrier.
Ì Cycle Tracks (Image 2D) – Exclusive bikeways that are at street level and use a variety of methods for physical separation from motorized vehicle traffic and pedestrians. A oneway cycle track may be combined with a parking lane or other barrier (such as plastic bollards, a raised median or planters) between the cycle track and motor vehicle travel lane. Cycle tracks should be placed adjacent to the curb. Cycle tracks combine the user experience of a separated path with the on-street infrastructure of a bike lane.
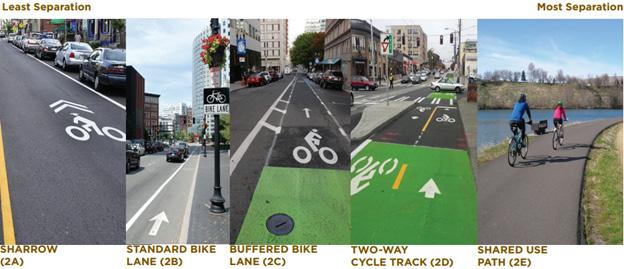
Ì Shared-Use Path (Image 2E) – A paved or unpaved bikeway outside the motor vehicle travel way and physically separated from motorized vehicular traffic by an open space, curb, curb and gutter, or barrier and either within the highway right-of-way or within an independent alignment. Shared-use paths are open to use by pedestrians and other authorized non-motorized users. A shared-use path typically allows two-way travel and is therefore wider than an on-road bikeway. Recreational trails and Greenways fall largely within this category of bike facility, differing only in the setting where they are constructed (rural or natural areas instead of urban) and sometimes in the materials used (unpaved instead of paved).
Ì Paved Shoulder – Where a roadway right-of-way offers enough width, a paved shoulder accommodates bicycle traffic without the need to dedicate a portion of the vehicle travel lane to bicycles. These facilities are most commonly applied along roads traveling through rural areas.
The bicycle facilities described above represent some of the most common types in use, but others, such as bicycle boulevards and a variety of intersection or lane treatments and traffic signals exist to provide greater recognition of bicyclists as being equal users of road space. Metrics such as traffic volume, traffic speed, setting (urban or rural), cost, road width and other measures help to determine what type of bicycle facility can be accommodated on different roadway classifications. The chart below gives a general idea of what facility may be appropriate under these varied travel conditions.
Source: Memphis MPO 2014 Regional Bicycle and Pedestrian Plan
Ì End-of-Trip Facilities – These are amenities designed to remove additional barriers that prevent people from choosing to travel by bike. Bicycle parking is the most common end-of-trip facility, but additional facilities include locker rooms, showers, bicycle lockers, bike pump and repair stations and many others.


In contrast to bicycle facility types, which tend to require a greater degree of context sensitive design to meet the needs of users, pedestrian facilities tend to be somewhat less specialized and are also more familiar to the general public.

Ì Sidewalk (photo 2a) – Physically separated from travel lanes but within the public rightof-way, sidewalks can include a variety of paving materials such as concrete or brick that are appropriate to the neighborhood context. The buffer between the sidewalk and the travel lane is generally wider on roads with high traffic speeds or volumes.
Ì Crosswalk (photo 2b) – Indicates the optimal or preferred location for pedestrians to safely cross the street while also correctly positioning motor vehicles at controlled intersections. A variety of striping patterns and pavement treatments are employed along busy roadways to provide enhanced pedestrian recognition. Crosswalks are often augmented by pedestrian signals at each end of the street crossing which provide visual and/or verbal instructions on when users can safely enter the street.
Ì Curb Ramps (photo 2c) – To meet the needs of individuals with disabilities, mobility impairments or people pushing mobile objects (like strollers), curb ramps provide a seamless transition between the sidewalk and the road. Treatments on the ramp’s surface provide warning and resistance to pedestrians entering the roadway to alert them that they are entering the vehicular lane. Curb ramps comply with the requirements of the Americans with Disabilities Act.
Ì Intersection Improvements (photo 2d) – On roadways where marked crosswalks aren’t adequate to the task of altering motorists to the presence of pedestrians (such as where there are high levels of pedestrian or vehicle traffic) other design measures may be taken. These may include median or island refuges, curb extensions and other strategies which reduce crossing distances and provide visual cues to drivers. Traffic calming measures such as roundabouts or traffic circles also fall under the general heading of intersection improvements which provide benefits to pedestrians.
Ì Amenities (photo 2e) – Additional streetscape improvements such as benches, wayfinding signs, streetlights, trees and landscaping help to encourage increased pedestrian activity in similar fashion to end-of-trip bicycle facilities by providing comfort, convenience, and security.


While the physical context is integral in planning the appropriate type of bicycle facility for a particular location, the comfort of an individual bicyclist can vary widely depending on his or her subjective perception of their traveling conditions. It therefore follows logically that measuring the adequacy of bicycle infrastructure to provide both safety and comfort, to bicyclists who possess widely different levels of experience cycling in different conditions, can be a significant challenge.
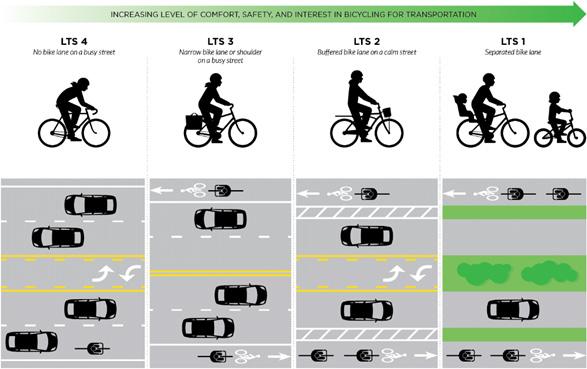
The traditional measure used nationally to quantify the adequacy of bicycle facilities is Bicycle Level of Comfort or Bicycle Level of Service (BLOC, BLOS). These measures are used by both MDOT and the MPO to assess bicycle conditions on State and local roadways in their planning efforts. BLOC assesses conditions on roadway segments based on roadway characteristics such as outside travel lane width, shoulder or bike lane width, speed limit, traffic volume, truck volume, pavement condition and the presence of medians or on-street parking. The segment is then assigned a letter grade of A-F, with A grade representing the highest level of comfort and F offering the lowest level of rider comfort.
The BLOC measure has limitations in offering a true assessment of bicycle facility adequacy in meeting the needs of users to feel safe and comfortable. Specifically, BLOC fails to adequately account for rider experience in assigning letter grades as it assumes cyclists are already comfortable riding on the street and doesn’t account for conditions offered by offstreet or separated facilities (e.g. – multi-use paths, cycle tracks, etc.) that may be preferred by less confident bicyclists.
In order to better account for both the safety and comfort of bicyclists in the planning and design of bicycle infrastructure, BLOC is typically either replaced or supplemented by the Level of Traffic Stress (LTS) measure. LTS includes inputs that both overlap and expand upon BLOC, including posted or observed speed limit, presence and width of bikeways, intersection control, proximity to motor vehicle parking, blockage of the bikeway by motor vehicles, traffic volumes and truck route designation, and gaps in the bikeway network. Road segments are then given a rating between 1 and 4, with a segment graded 1 being the lowest stress and 4 as the most stressful bicycling environment. A sample depiction of the differing environments corresponding to these numerical grades is shown below.
Source: Alta Planning + Design
The scoring system and philosophy embedded in LTS relates to academic research on bicyclist comfort, particularly the “Four Types of Cyclists” characterization developed by City of Portland, Oregon Bicycle Coordinator Roger Geller beginning in 2006. Geller came up with a typology that classifies cyclists into four categories depending on their comfort level bicycling in different environments and not necessarily just by their current bicycling behavior. These categories include “Strong and Fearless,” “Enthused and Confident,” “Interested but Concerned” and “No Way No How.” As one might expect, “Strong and Fearless” represents the most confident group cycling in any conditions while “No Way No How” represents the least confident.
The value of these comfort measures lies in understanding what groups to target for their potential to switch some daily trips from motorized to active transportation modes such as bicycling or walking. Geller estimated that Portland cyclists fell into these four categories at the following percentages: Strong and Fearless (less than 1%), Enthused and Confident (7%), Interested but Concerned (60%), Now Way No How (33%). Subsequent research by Portland State University largely validated these figures nationally as can be seen in the chart below:

The group within this typology of greatest interest to transportation planners is the “Interested but Concerned” group because they are both the most numerous and most amenable to potentially diverting some trips to non-motorized modes of transportation. “Interested but Concerned” cyclists already engage in some utilitarian bicycling but are often deterred from expanding their participation further by having to share the road with cars. Therefore, improvements in bicycle infrastructure that provides dedicated space to cyclists has the potential to attract significant numbers of new riders.
Transportation planning entities are aware of the academic research surrounding bicyclist comfort and have been integrating its principles into long range plans and regulatory standards for some time. MDOT, for example, is actively developing its own LTS system to better quantify cyclist comfort in planning and designing bicycle facilities. Pedestrian Level of Service and Pedestrian Level of Traffic Stress measures have also been developed using similar criteria as outlined above for bicycles
While brick and mortar efforts like improved bicycle infrastructure go a long way to encourage modal shifting, additional “soft” policies are also needed in the push to encourage wider participation in active transportation modes. A highly useful framework for understanding how to incorporate these soft policies into wider efforts to promote greater bicycle and pedestrian travel is the “6 E’s.” The League of American Bicyclists developed this multipronged strategy to advance safe bicycling and it awards a Bicycle Friendly designation to communities, businesses, and universities who have completed a certification program to validate improvements in these areas.
Ì Engineering - refers largely to the physical construction of bicycle or pedestrian specific infrastructure which alters the built environment to be more safe and friendly to these users, using the types of facilities previously described.
Ì Education - involves giving people of all ages and abilities the skills and confidence to ride through bicycle and pedestrian safety training and other methods.
Ì Encouragement - differs from education in that it is more event or program focused. Walk or Bike to School (or work) Days, bikeshare systems, and recreational or competitive events which generate enthusiasm around engaging in these modes of travel would be examples of encouragement activities.
Ì Enforcement - ensures safe roads for all users through the work of law enforcement, citizen safety groups (neighborhood watch, crossing guards) and others to ensure that traffic laws are obeyed, and community awareness is increased.
Ì Evaluation - refers to the efforts required to quantify existing conditions for bicyclists and pedestrians and then measure progress towards goal achievement. Efforts like bike or pedestrian counts, quantifying return on capital investments or identifying crash reduction trends are examples of evaluation methods.
Ì Equity - is the underlying objective of the framework as a whole. It involves providing transportation choices by removing barriers to entry and ensuring universal access to bicycling by focusing attention on providing transportation options where they are most needed.
As stated in the text of the Growth Management and Land Use chapter, analysis and delineation of the Environmental Conservation policy area was completed through use of our GIS database. It is anticipated that a similar methodology may be used to create other environmental/scenic inventories mentioned in this, and other chapters.
As shown in the Map A-1, the Environmental Conservation layer was created through a method of weighted scoring. Using seven (7) different feature classes, each feature was given the score of 1, and they were combined into one feature class. The feature classes that were used in this weighted scoring are Streams, Wetlands, Floodplain, Wellhead Protection Areas, Wildlife Management Areas, Special Planning Areas, and Tree Canopy. To determine the weighted score, wherever there was an overlap of features, a new score was calculated. As shown on the map, the dark green areas are where multiple feature classes overlap, therefore giving it a higher score. Areas with the highest scores were designated as Environmental Conversation.

The first step in estimating population projections was to review information pertaining to past population projections compiled internally and by Maryland Department of Planning (MDP) and information compiled by the US Census Bureau. An in-depth analysis was done on the 70 years of historical data (1940 – 2010) associated with population numbers. Trends and historical averages were identified. An additional analysis was conducted utilizing 2010-2019 data due to the distinct socio-economic impacts that occurred during this time period.
Natality and Mortality rates for Washington County were obtained from Maryland Department of Health. These numbers were analyzed in order to identify trends, averages and spikes or dips in these particular cycles. When reviewing the birth and death rates for the most recent 10-year period (from 2010-2019), the net increase in population from these factors is +177 persons/year. This number is substantially less (366-177 = 189) or approximately half of the average net increase per year depicted during the previous 18-year time period from 19952012. Additionally, recent socio-economic indicators are predicting a sustained 15% decrease in birth rates in the near term. As a result of this additional analysis, it has been concluded that the sort-term population projections be reduced to include only a 1% population increase over the next 10-year period (or 0.10% annually) and then revert back to more historically trends of 0.25% per year in the 2030-2040 time frame.
The next step in breaking down population numbers was to determine the net rate of migration for Washington County. In June 2020, the Maryland Department of Planning published migration data for the first time since 2014. This newer data suggests that Total Migration rates for Washington County have fallen to approximately + 200 person/year from 2010 to 2019. This is a significant decrease from the + 1306 person/year that was projected back in 2014. Socio-economic factors such as the Great Recession and COVID-19 can be attributed to this decline, however our local housing market is starting to see a major up-tick in activity which would suggest that these numbers are rebounding. In addition, the 0.6% annual trend from 2000-2014 seems to be more in line with what is currently occurring in Washington County. Therefore, for the revised projections, it is estimated that net migration rate for 2020-2030 timeframe be reduced to 0.6% and that the rate return to the historical trend in the data of 0.89% annually from 2030-2040.
Also reviewed as part of the projection analysis was the historical numbers for the Group Quarters segment of the population. Adjustments had to be made to either factor in or discount the reallocation of a portion of the MD State prison population housed at the facilities south of Hagerstown due to the adjustment in the Census Bureau’s data about where inmates are counted. Based on historical comparisons (with the 2000 Group Quarter number thrown out due to difference in the manner in which records were kept), the average rate of Group Quarter Growth in Washington County is approximately + 114 persons/year. This translates into an approximate population increase of 0.1% over a 10-year period (or 0.01% annually.) When these three factors are added together, (0.1+0.6+0.01) the annual growth rate could be assumed to be 0.71% over a 10-year census period. When compared to Washington County’s growth over the past 70 years of data, the historical trend calculated to 1.15% annually. The growth rate of 1.15% per year will resume as part of the calculations for the years from 2030 – 2040.
