Information contained in this report has
2,008 Active Listings CONTINUED ON BACK... Last
Luxury Market Summary
This
This
Christie ’ s international Real Estate
DEMAND - SALES
Last
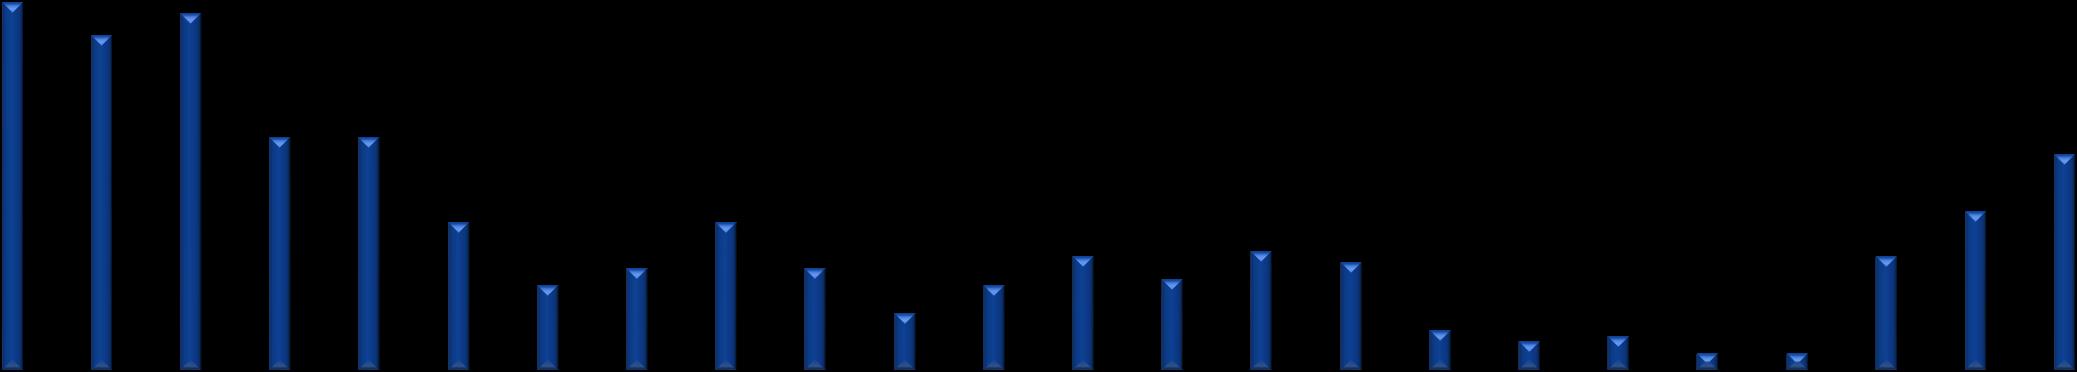
SUPPLY
This summary analyzes single family homes over $500,000 in all areas of the Northeast Valley, including Scottsdale, Paradise Valley, Arcadia, Biltmore, Carefree, Cave Creek, Fountain Hills and Rio Verde.
At the end of July, the active listing count was considerably higher than the month before, moving from 1,830 to 2,008. Such a rise is very rare during July since in most years we see a sharp fall instead. We measured 1,306 at the same time last year, so supply is up 54% since then. This is the third year-over-year increase since 2016, so the market is shifting quickly, making conditions more favorable for buyers. Homes between $500,000 and $1 million have seen supply rise 61% compared to a year ago. Listings between $1 million and $2 million are where the bulk of the additional supply has arrived. They are up 82% compared with a year ago. Homes over $2 million are up 32% from the same time last year. Distress remains very low. There are ten pre-foreclosures and two lender-owned homes.
The level of closing activity dropped dramatically between June and July. We counted only 409 closed listings during July, down 44% from July 2021 and the weakest July since 2017. Sales between $500,000 and $1,000,000 dropped the most – down 54% compared to a year ago. In contrast, the range over $2 million was down 32%, while sales of homes between $1 million and $2 million were down only 27%.
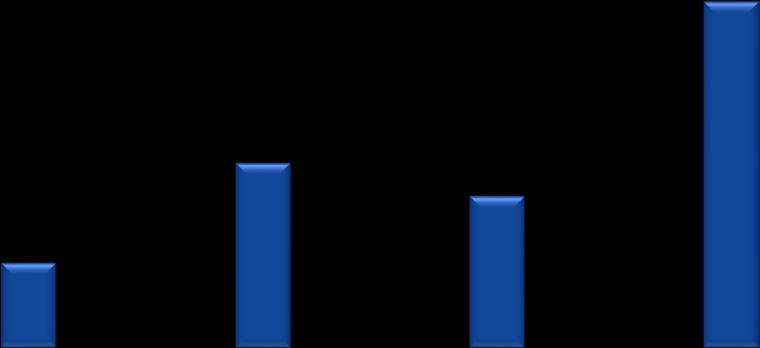
DEMAND – UNDER CONTRACT We can anticipate future sales by looking at homes under contract. We started August 2022 with 657 listings under contract, which is down 26% from 888 in August 2021. Demand is clearly dropping quickly, though the luxury sector is not affected as dramatically as the range below $1 million. We are likely to see closing numbers during August that are much lower than August 2021 and similar to July 2022. Homes over $1.5 million are surviving this down trend with 258 listings under contract, barely changed from August 2021. However, homes under $1.5 million are down from 629 to 399. Year 728 This Year 409 Sales been Danley Valley – – August 2022 Paradise Valley Office: 480.991.2050 Office: WaltDanley.com480.909.4577 Year 1,306 Year Year 888 Year 657 Danley
prepared by The Cromford Report exclusively for Walt
Last
Realty and their clients. All other use is expressly forbidden. © 2022 Northeast
# Homes Under Contract Walt
Scottsdale
SALES PRICING
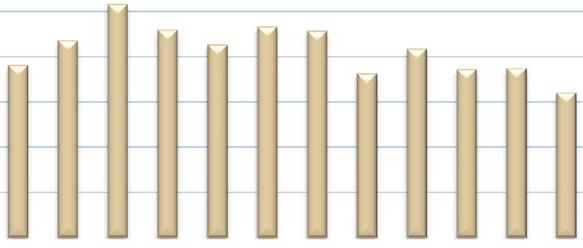
Due to relatively low volumes and a wide range of price points, the Northeast Valley luxury market can display a lot of volatility if measured monthly. We therefore prefer to measure price per sq. ft. over a longer period to identify trends more accurately. The twelve-month average currently stands at $468, up 27% from $369 in July 2021. The six-month average stands at $504, up 26% from $400 in July 2021 and the three-month average stands at $504, down $8 from last month because pricing has weakened sharply over the past two months due to the steep drop in demand and rising supply. The strong upward pricing trend that has persisted for many years has finally run out of steam and we expect the longer-term averages will gradually change direction like the threemonth average.
UNDER CONTRACT PRICING
Information contained in this report has been prepared by The Cromford Report exclusively for Walt Danley Realty and their clients. All other use is expressly forbidden. © 2022
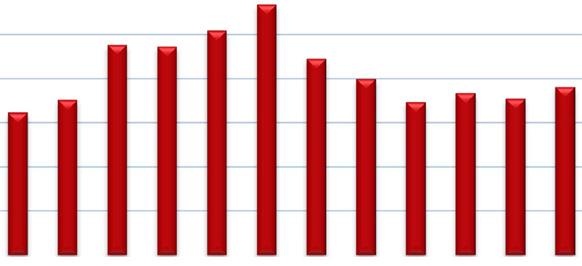
The average under contract price per square foot stands at $551, down sharply from $572 last month but far higher than the $441 on August 1st, 2021. This month the under-contract pricing reflects the significant weakening in price that has taken place in June and July.
Walt
Arcadia August, 2022
Market
Information is power and the real estate professionals of Walt Danley Christie’s International Real Estate are committed to providing our clientele with the most up-to-date market intelligence available. The information contained in this report has been compiled from the Arizona Regional Multiple Listing Service and various public records. This data is then scrubbed and analyzed in conjunction with The Cromford Report exclusively for the use of Walt Danley Realty and our clients. The number of active listings in Arcadia dipped from 49 to 44 during July but is still up 33% compared to August 2021. Closed sales came in at ten, down from 20 in July 2021 and the lowest total for July since 2011. Average price per sq. ft. is starting to weaken but this does not yet show in the longer-term averages. The twelve-month average has grown 27% from $504 to $642 over the last twelve months. The six-month moving average has risen 27% from $533 to $676, while the more volatile three-month moving average increased 22% from $560 to $684. However, it was $695 last month, so this is the first sign of a reversal. Data Report Danley Christie ’ s international Real Estate
Information contained in this report has been prepared by Walt Danley Realty in conjunction with The Cromford Report exclusively for WDR and their clients. All other use is expressly forbidden. © 2022 Paradise Valley Office: 480.991.2050 Scottsdale Office: WaltDanley.com480.909.4577

$750$650$550$450$350$250$150 Jul-05 Jan-06 Jul-06 Jan-07 Jul-07 Jan-08 Jul-08 Jan-09 Jul-09 Jan-10 Jul-10 Jan-11 Jul-11 Jan-12 Jul-12 Jan-13 Jul-13 Jan-14 Jul-14 Jan-15 Jul-15 Jan-16 Jul-16 Jan-17 Jul-17 Jan-18 Jul-18 Jan-19 Jul-19 Jan-20 Jul-20 Jan-21 Jul-21 Jan-22 Jul-22 12 Months Avg 756555453525155 20-Aug 20-Sep 20-Oct 20-Nov 20-Dec 21-Jan 21-Feb 21-Mar 21-Apr 21-May 21-Jun 21-Jul 21-Aug 21-Sep 21-Oct 21-Nov 21-Dec 22-Jan 22-Feb 22-Mar 22-Apr 22-May Jun-22 22-Jul Active Accepted Offers Closed 12 Months Avg 60% 65% 70% 75% 80% 85% 90% 95% 100% <90 <150 >150 >365 Days on the Market $3,414,535$3,672,667 $2,534,903 0 $1.0M $2.0M $3.0M $4.0M Active Under contract Sold - Last 12 Months Average Price per Square Foot for Closed Transactions the Last 17 Years Number of Listings by Status for the Last Two Years This graph shows the number of homes that were active in the area as of the 15th of the previous month. It also shows the number of offers that were accepted and the number of transactions that were closed within the entire month. This graph illustrates the importance of pricing your home properly from the beginning. The longer the property sits on the market, the steeper the discount. The average list price of Active listings is measured the 15th of each month. Note: The “Under Contract” price is the list price, not the contract price. The contract price is not revealed until the transaction closes. Sales Price as a Percentage of Original List Price Average Price Arcadia - August 2022 Information contained in this report has been prepared by Walt Danley Realty in conjunction with The Cromford Report exclusively for WDR and their clients. All other use is expressly forbidden. © 2022 Paradise Valley Office: 480.991.2050 Scottsdale Office: WaltDanley.com480.909.4577


7 36 No Active Inventory 2 11 1 1 12 1 3 5403020100 <$750K $0.75-$1.25M $1.25-2M $2M+ Active New This Month Offers Accepted This Month Sold This month No Sales 1.5 3.3 0 12 24 $0.75-$1.25M<$750K$1.25-2M$2M+ No Sales $692 $784 $583 $597 $816 $391 $509 $567 $682$850$750$650$550$450$350$250 <$750K $0.75-$1.25M $1.25-2M $2M+ Active Under contract Sold - Last 12 Mo 0% 2% 4% 6% 8% 10% 12% Jan Feb Mar Apr May Jun Jul Aug Sep Oct Nov Dec 0% 2% 4% 6% 8% 10% 12% Jan Feb Mar Apr May Jun Jul Aug Sep Oct Nov Dec 0% 2% 4% 6% 8% 10% 12% Jan Feb Mar Apr May Jun Jul Aug Sep Oct Nov Dec Seasonality New Listings by Month Accepted Offers by Month Closed Transactions by Month Inventory - Number of Months Supply Active listings were measured on the 15th of the previous month. The numbers for New This Month, Accepted Offers and Sold represent the quantities for the entire previous month. Market Activity by Price AverageRangePrice per Square Foot by Price Range The number of months it would take to sell all the currently active listings based on the rate of sales over the last 12 months assuming no new listings were added. Figures for Active and Under Contract were compiled on the 15th of the previous month. Note: The “Under Contract” price is the list price, not the contract price. The contract price is not revealed until the transaction closes. The charts above reflect activity by month. Each bar represents the percentage of annual business done within a specific month. Arcadia - August 2022 Information contained in this report has been prepared by Walt Danley Realty in conjunction with The Cromford Report exclusively for WDR and their clients. All other use is expressly forbidden. © 2022 Paradise Valley Office: 480.991.2050 Scottsdale Office: WaltDanley.com480.909.4577


Arcadia - August 2022 $635 $651 $685 $633 $606 $309$700$650$600$550$500$450$400$350$300$250 <2,500 2,501-3,500 3,501-5,000 5,001-7,500 7,501-10,000 10,000+ Price per Square Foot Based on size of the home (sold over the last twelve months) $639 $578 $556 $545 $662 $751 $725$800$750$700$650$600$550$500 <1970 1970s 1980s 1990s 2000s 2010s 2020s Price per Square Foot Based on the year built (sold over the last twelve months) $776 $680 $771 $687$651 $674$800$750$700$650$600$550 Traditional Short Sale REO Active Closed - Last Month Active- 12 Mo Avg Sold - 12-Mo Avg Price per Square Foot By Type Information contained in this report has been prepared by Walt Danley Realty in conjunction with The Cromford Report exclusively for WDR and their clients. All other use is expressly forbidden. © 2022 Paradise Valley Office: 480.991.2050 Scottsdale Office: WaltDanley.com480.909.4577


and their clients. All other use is expressly forbidden. © 2022 Paradise
in this report has been compiled from the Arizona Regional Multiple Listing Service and various public records. This data is then scrubbed and analyzed in conjunction with The Cromford Report exclusively for the use of
Scottsdale
with
Information
Information
estate professionals of
Report exclusively for
Danley Realty and our clients. Walt
Christie ’ s international Real Estate
The supply of active listings rose modestly from 23 to 17 during July, down from 19 this time last year and still very low compared to long term measurements. There were six closed sales during July, down from seven in July 2021. Pricing continues to rise on the Biltmore showing no sign of weakness yet and the twelve-month average has moved up 28% from $385 to $493 per sq. ft. over the last year. The six-month average is up 25% from $420 to $527, and the volatile three-month average has seen a 24% increase from $426 to $528. contained in this report has been prepared by Walt Danley Realty in conjunction The Cromford WDR Valley Office: 480.991.2050 Office: Data Report is power and the real Walt Danley Christie’s International Real contained Walt Danley
WaltDanley.com480.909.4577 Market
Estate are committed to providing our clientele with the most up-to-date market intelligence available. The information
Biltmore August, 2022

$600$500$400$300$200$100 Jul-05 Jan-06 Jul-06 Jan-07 Jul-07 Jan-08 Jul-08 Jan-09 Jul-09 Jan-10 Jul-10 Jan-11 Jul-11 Jan-12 Jul-12 Jan-13 Jul-13 Jan-14 Jul-14 Jan-15 Jul-15 Jan-16 Jul-16 Jan-17 Jul-17 Jan-18 Jul-18 Jan-19 Jul-19 Jan-20 Jul-20 Jan-21 Jul-21 Jan-22 Jul-22 12 Months Avg 55453525155 20-Aug 20-Sep 20-Oct 20-Nov 20-Dec 21-Jan 21-Feb 21-Mar 21-Apr 21-May 21-Jun 21-Jul 21-Aug 21-Sep 21-Oct 21-Nov 21-Dec 22-Jan 22-Feb 22-Mar 22-Apr 22-May 22-Jun 22-Jul Active Accepted Offers Closed 12 Months Avg 60% 65% 70% 75% 80% 85% 90% 95% 100% <90 <150 >150 >365 Days on the Market $1,774,843$2,133,045 $942,459 0 $500K $1.0M $1.5M $2.0M $2.5M Active Under contract Sold - Last 12 Months This graph shows the number of homes that were active in the area as of the 15th of the previous month. It also shows the number of offers that were accepted and the number of transactions that were closed within the entire month. This graph illustrates the importance of pricing your home properly from the beginning. The longer the property sits on the market, the steeper the discount. The average list price of Active listings is measured the 15th of each month. Note: The “Under Contract” price is the list price, not the contract price. The contract price is not revealed until the transaction closes. Average Price Biltmore - August 2022 Average Price per Square Foot for Closed Transactions the Last 17 Years Number of Listings by Status for the Last Two Years Sales Price as a Percentage of Original List Price Information contained in this report has been prepared by Walt Danley Realty in conjunction with The Cromford Report exclusively for WDR and their clients. All other use is expressly forbidden. © 2022 Paradise Valley Office: 480.991.2050 Scottsdale Office: WaltDanley.com480.909.4577


7 1 3 3 8 7 2 1 1 22 2 2 11 1 4 11086420 <$500K $500K-$1M $1M-1.5M $1.5-2M $2M+ Active New This Month Offers Accepted This Month Sold This month 0.31.31.22.0 9.6 0 12 24 $500K-$1M<$500K$1M-1.5M$1.5-2M$2M+ $365 $477 $501 $709 $931 $368 $534 $548 $297 $426 $451 $520 $575$950$850$750$650$550$450$350$250$150 <$500K $500K-$1M $1M-1.5M $1.5-2M $2M+ Active Under contract Sold - Last 12 Mo 0% 2% 4% 6% 8% 10% 12% Jan Feb Mar Apr May Jun Jul Aug Sep Oct Nov Dec 0% 2% 4% 6% 8% 10% 12% Jan Feb Mar Apr May Jun Jul Aug Sep Oct Nov Dec 0% 2% 4% 6% 8% 10% 12% Jan Feb Mar Apr May Jun Jul Aug Sep Oct Nov Dec Seasonality New Listings by Month Accepted Offers by Month Closed Transactions by Month Inventory - Number of Months Supply Active listings were measured on the 15th of the previous month. The numbers for New This Month, Accepted Offers and Sold represent the quantities for the entire previous month. Average Price per Square Foot by Price Range The number of months it would take to sell all the currently active listings based on the rate of sales over the last 12 months assuming no new listings were added. Figures for Active and Under Contract were compiled on the 15th of the previous month. Note: The “Under Contract” price is the list price, not the contract price. The contract price is not revealed until the transaction closes. The charts above reflect activity by month. Each bar represents the percentage of annual business done within a specific month. Biltmore - August 2022 Market Activity by Price Range Information contained in this report has been prepared by Walt Danley Realty in conjunction with The Cromford Report exclusively for WDR and their clients. All other use is expressly forbidden. © 2022 Paradise Valley Office: 480.991.2050 Scottsdale Office: WaltDanley.com480.909.4577


$770 $494 $660 $443$900$800$700$600$500$400$300$200 Traditional Short Sale REO Active Closed - Last Month Active- 12 Mo Avg Sold - 12-Mo AvgNo SalesNo Sales Price per Square Foot By Type Biltmore - August 2022 $365 $520 $490 $439 $463 $453$550$500$450$400$350$300 <2,000 2,001-3,000 3,001-4,000 4,001-5,000 5,001-7,500 7,500+ Price per Square Foot Based on size of the home (sold over the last twelve months) $453 $409 $399 $528 $718$750$700$650$600$550$500$450$400$350 <1980 1980s 1990s 2000s 2010s Price per Square Foot Based on the year built (sold over the last twelve months) Information contained in this report has been prepared by Walt Danley Realty in conjunction with The Cromford Report exclusively for WDR and their clients. All other use is expressly forbidden. © 2022 Paradise Valley Office: 480.991.2050 Scottsdale Office: WaltDanley.com480.909.4577


Information contained in this report has been prepared by Walt Danley Realty in conjunction with The Cromford Report exclusively for WDR and their clients. All other use is expressly forbidden. © 2022 Paradise Valley Office: 480.991.2050 Scottsdale Office: WaltDanley.com480.909.4577
Walt Danley Christie ’ s international Real Estate
The supply of active listings rose from 122 to 133 during July. This total is up 40% from the 95 that we saw on August 1st, 2021. There were 31 closed sales during July, down from 35 in July 2021. This is a strong sales reading compared with the rest of the market. Pricing continued to rise with no sign of the weakness we saw in many other locations. The twelve-month average price per sq. ft. came in at $357 in July, up 26% from $284 a year earlier. The six-month average rose from $309 to $393 over the last year while the volatile three-month average was $409 per sq. ft., up 30% from $315 a year earlier.
Fountain Hills August, 2022
Market Data Report
Information is power and the real estate professionals of Walt Danley Christie’s International Real Estate are committed to providing our clientele with the most up-to-date market intelligence available. The information contained in this report has been compiled from the Arizona Regional Multiple Listing Service and various public records. This data is then scrubbed and analyzed in conjunction with The Cromford Report exclusively for the use of Walt Danley Realty and our clients.

1159575553515 20-Aug 20-Sep 20-Oct 20-Nov 20-Dec 21-Jan 21-Feb 21-Mar 21-Apr 21-May 21-Jun 21-Jul 21-Aug 21-Sep 21-Oct 21-Nov 21-Dec 22-Jan 22-Feb Mar-22 Apr-22 22-May 22-Jun 22-Jul Active Accepted Offers Closed 12 Months Avg $450$400$350$300$250$200$150$100 Jul-05 Jan-06 Jul-06 Jan-07 Jul-07 Jan-08 Jul-08 Jan-09 Jul-09 Jan-10 Jul-10 Jan-11 Jul-11 Jan-12 Jul-12 Jan-13 Jul-13 Jan-14 Jul-14 Jan-15 Jul-15 Jan-16 Jul-16 Jan-17 Jul-17 Jan-18 Jul-18 Jan-19 Jul-19 Jan-20 Jul-20 Jan-21 Jul-21 Jan-22 Jul-22 12 Months Avg 60% 65% 70% 75% 80% 85% 90% 95% 100% <90 <150 >150 >365 Days on the Market $1,360,132$1,385,489 $979,268 0 $500K $1.0M $1.5M Active Under contract Sold - Last 12 Months This graph shows the number of homes that were active in the area as of the 15th of the previous month. It also shows the number of offers that were accepted and the number of transactions that were closed within the entire month. This graph illustrates the importance of pricing your home properly from the beginning. The longer the property sits on the market, the steeper the discount. The average list price of Active listings is measured the 15th of each month. Note: The “Under Contract” price is the list price, not the contract price. The contract price is not revealed until the transaction closes. Average Price Fountain Hills - August 2022 Average Price per Square Foot for Closed Transactions the Last 17 Years Number of Listings by Status for the Last Two Years Sales Price as a Percentage of Original List Price Information contained in this report has been prepared by Walt Danley Realty in conjunction with The Cromford Report exclusively for WDR and their clients. All other use is expressly forbidden. © 2022 Paradise Valley Office: 480.991.2050 Scottsdale Office: WaltDanley.com480.909.4577


57 22 9 12 8 30 7 7 4 5 19 7 2 5 1 23 4 1 2 16050403020100 $500K-$1M $1-$1.5M $1.5-2M $2-3M $3M+ Active New This Month Offers Accepted This Month Sold This month 1.72.83.3 4.8 12.0 0 12 24 $500K-$1M$1-$1.5M$1.5-2M$2-3M$3M+ $327 $367 $442 $571 $654 $349 $414 $438 $566 $654 $319 $359 $388 $425 $613$700$650$600$550$500$450$400$350$300$250$200 $500K-$1M $1-$1.5M $1.5-2M $2-3M $3M+ Active Under contract Sold - Last 12 Mo 0% 2% 4% 6% 8% 10% 12% Jan Feb Mar Apr May Jun Jul Aug Sep Oct Nov Dec 0% 2% 4% 6% 8% 10% 12% Jan Feb Mar Apr May Jun Jul Aug Sep Oct Nov Dec 0% 2% 4% 6% 8% 10% 12% 14% Jan Feb Mar Apr May Jun Jul Aug Sep Oct Nov Dec Seasonality New Listings by Month Accepted Offers by Month Closed Transactions by Month Active listings were measured on the 15th of the previous month. The numbers for New This Month, Accepted Offers and Sold represent the quantities for the entire previous month. Average Price per Square Foot by Price Range The number of months it would take to sell all the currently active listings based on the rate of sales over the last 12 months assuming no new listings were added. Figures for Active and Under Contract were compiled on the 15th of the previous month. Note: The “Under Contract” price is the list price, not the contract price. The contract price is not revealed until the transaction closes. The charts above reflect activity by month. Each bar represents the percentage of annual business done within a specific month. Fountain Hills - August 2022 Inventory - Number of Months MarketSupplyActivity by Price Range Information contained in this report has been prepared by Walt Danley Realty in conjunction with The Cromford Report exclusively for WDR and their clients. All other use is expressly forbidden. © 2022 Paradise Valley Office: 480.991.2050 Scottsdale Office: WaltDanley.com480.909.4577


$425 $396 $390 $321 $322$349 $292 $289$450$400$350$300$250$200 Traditional Short Sale REO Active Closed - Last Month Active- 12 Mo Avg Sold - 12-Mo Avg Price per Square Foot By Type Fountain Hills - August 2022 $307 $317 $343 $372 $467 $550$600$550$500$450$400$350$300$250 <1980 1980s 1990s 2000s 2010s 2020s $342 $365 $378 $376 $342$400$350$300 <3,000 3,001-4,000 4,001-5,000 5,001-7,500 7,501-10,000 10,000+ No Sales Price per Square Foot Based on size of the home (sold over the last twelve months) Price per Square Foot Based on the year built (sold over the last twelve months) Information contained in this report has been prepared by Walt Danley Realty in conjunction with The Cromford Report exclusively for WDR and their clients. All other use is expressly forbidden. © 2022 Paradise Valley Office: 480.991.2050 Scottsdale Office: WaltDanley.com480.909.4577


©
Information is power and the real estate professionals of Walt Danley Christie’s International Real Estate committed to providing our clientele with the most up-to-date market intelligence The information contained in this report has been compiled from the Arizona Regional Multiple Listing various This data then scrubbed and in conjunction with The Cromford Report exclusively for the of Walt Danley Realty and Danley Christie ’ s international Real Estate
On August 1st, we had 534 active listings, up 36% from 393 a year ago. Closed sales totaled just 95 during July, down 56% from 245 in July 2021 and the lowest July total since 2016. Prices continued to rise in North Scottsdale, unlike the southerly areas. The twelve-month moving average $/SF came in at $493, up 28% from $384 in July 2021, while the six-month average rose from $418 to $535. The volatile three-month average was $549 having been $430 a year earlier, an increase of 28%.
use
is
Paradise
North Scottsdale 85255, 85262, 85266 August, 2022
are
Service and
analyzed
Scottsdale
is
our clients. Walt
available.
Market
Information contained in this report has been prepared by Walt Danley Realty in conjunction with The Cromford Report exclusively for WDR and their clients. All other use expressly forbidden. 2022 Valley Office: 480.991.2050 Office: WaltDanley.com480.909.4577 Data Report
public records.

85065045025050 20-Jul 20-Aug 20-Sep 20-Oct 20-Nov 20-Dec 21-Jan 21-Feb 21-Mar 21-Apr 21-May 21-Jun 21-Jul 21-Aug 21-Sep 21-Oct 21-Nov 21-Dec 22-Jan 22-Feb Mar-22 22-Apr 22-May 22-Jun Active Accepted Offers Closed 12 Months Avg $600$550$500$450$400$350$300$250$200$150 Jun-05 Dec-05 Jun-06 Dec-06 Jun-07 Dec-07 Jun-08 Dec-08 Jun-09 Dec-09 Jun-10 Dec-10 Jun-11 Dec-11 Jun-12 Dec-12 Jun-13 Dec-13 Jun-14 Dec-14 Jun-15 Dec-15 Jun-16 Dec-16 Jun-17 Dec-17 Jun-18 Dec-18 Jun-19 Dec-19 Jun-20 Dec-20 Jun-21 Dec-21 Jun-22 12 Months Avg 60% 65% 70% 75% 80% 85% 90% 95% 100% <90 <150 >150 >365 Days on the Market $3,243,889 $1,720,067$2,304,164 0 $1.0M $2.0M $3.0M Active Under contract Sold - Last 12 Months This graph shows the number of homes that were active in the area as of the 15th of the previous month. It also shows the number of offers that were accepted and the number of transactions that were closed within the entire month. This graph illustrates the importance of pricing your home properly from the beginning. The longer the property sits on the market, the steeper the discount. The average list price of Active listings is measured the 15th of each month. Note: The “Under Contract” price is the list price, not the contract price. The contract price is not revealed until the transaction closes. Average Price North Scottsdale - August 2022 Average Price per Square Foot for Closed Transactions the Last 17 Years Number of Listings by Status for the Last Two Years Sales Price as a Percentage of Original List Price Information contained in this report has been prepared by Walt Danley Realty in conjunction with The Cromford Report exclusively for WDR and their clients. All other use is expressly forbidden. © 2022 Paradise Valley Office: 480.991.2050 Scottsdale Office: WaltDanley.com480.909.4577


68 63 56 62 127 68 60 33 33 56 38 40 23 17 15 41 41 27 19 28125105856545255 $500K-$1M $1-$1.5M $1.5-2M $2-3M $3M+ Active New This Month Offers Accepted This Month Sold This month 1.21.42.02.6 5.8 0 12 24 $500K-$1M$1-$1.5M$1.5-2M$2-3M$3M+ $361 $428 $477 $614 $959 $348 $434 $479 $614 $781 $348 $391 $435 $518 $714$1,000$900$800$700$600$500$400$300$200 $500K-$1M $1-$1.5M $1.5-2M $2-3M $3M+ Active Under contract Sold - Last 12 Mo 0% 2% 4% 6% 8% 10% 12% Jan Feb Mar Apr May Jun Jul Aug Sep Oct Nov Dec 0% 2% 4% 6% 8% 10% 12% Jan Feb Mar Apr May Jun Jul Aug Sep Oct Nov Dec 0% 2% 4% 6% 8% 10% 12% Jan Feb Mar Apr May Jun Jul Aug Sep Oct Nov Dec Seasonality New Listings by Month Accepted Offers by Month Closed Transactions by Month Active listings were measured on the 15th of the previous month. The numbers for New This Month, Accepted Offers and Sold represent the quantities for the entire previous month. Average Price per Square Foot by Price Range The number of months it would take to sell all the currently active listings based on the rate of sales over the last 12 months assuming no new listings were added. Figures for Active and Under Contract were compiled on the 15th of the previous month. Note: The “Under Contract” price is the list price, not the contract price. The contract price is not revealed until the transaction closes. The charts above reflect activity by month. Each bar represents the percentage of annual business done within a specific month. North Scottsdale - August 2022 Inventory - Number of Months MarketSupplyActivity by Price Range Information contained in this report has been prepared by Walt Danley Realty in conjunction with The Cromford Report exclusively for WDR and their clients. All other use is expressly forbidden. © 2022 Paradise Valley Office: 480.991.2050 Scottsdale Office: WaltDanley.com480.909.4577


$734 $359 $572 $678 $373$482 $311$800$700$600$500$400$300$200$100 Traditional Short Sale REO Active Closed - Last Month Active- 12 Mo Avg Sold - 12-Mo Avg No Active Inventory Price per Square Foot By Type North Scottsdale - August 2022 $409 $426 $504 $560 $595 $845$850$800$750$700$650$600$550$500$450$400$350 <3,000 3,001-4,000 4,001-5,000 5,001-7,500 7,501-10,000 10,000+ Price per Square Foot Based on size of the home (sold over the last twelve months) $449 $441 $431 $482 $573$600$550$500$450$400 1980s 1990s 2000s 2010s 2020s Price per Square Foot Based on the year built (sold over the last twelve months) Information contained in this report has been prepared by Walt Danley Realty in conjunction with The Cromford Report exclusively for WDR and their clients. All other use is expressly forbidden. © 2022 Paradise Valley Office: 480.991.2050 Scottsdale Office: WaltDanley.com480.909.4577


Scottsdale Office: WaltDanley.com480.909.4577
Walt Danley Christie ’ s international Real Estate
Information contained in this report has been prepared by Walt Danley Realty in conjunction with The Cromford Report exclusively for WDR and their clients. All other use is expressly forbidden. © 2022
Information is power and the real estate professionals of Walt Danley Christie’s International Real Estate are committed to providing our clientele with the most up-to-date market intelligence available. The information contained in this report has been compiled from the Arizona Regional Multiple Listing Service and various public records. This data is then scrubbed and analyzed in conjunction with The Cromford Report exclusively for the use of Walt Danley Realty and our clients.
Paradise Valley August, 2022 Bucking the general trend once again, supply in Paradise Valley rose only slightly during July, from 126 to 132 active listings as of the beginning of July 2022. This is down 12% from 150 at the same time last year. Closing counts came in at just thirteen for July, the lowest July count we have ever recorded (since 2000). Prices are starting to weaken although the twelve-month average price per square foot now stands at $694, up 34% from $518 in July 2021. The six-month average stands at $742, up 33% from $558 last year, while the three-month average came in at $750, up 28% from $537 in July 2021, but down from $770 last month.
Paradise Valley Office: 480.991.2050
Market Data Report

$800$700$600$500$400$300$200 Jul-05 Jan-06 Jul-06 Jan-07 Jul-07 Jan-08 Jul-08 Jan-09 Jul-09 Jan-10 Jul-10 Jan-11 Jul-11 Jan-12 Jul-12 Jan-13 Jul-13 Jan-14 Jul-14 Jan-15 Jul-15 Jan-16 Jul-16 Jan-17 Jul-17 Jan-18 Jul-18 Jan-19 Jul-19 Jan-20 Jul-20 Jan-21 Jul-21 Jan-22 Jul-22 12 Months Avg 60% 65% 70% 75% 80% 85% 90% 95% 100% <90 <150 >150 >365 Days on the Market $3,977,563$5,428,105$6,921,045 0 $2.0M $4.0M $6.0M $8.0M Active Under contract Sold - Last 12 Months This graph shows the number of homes that were active in the area as of the 15th of the previous month. It also shows the number of offers that were accepted and the number of transactions that were closed within the entire month. This graph illustrates the importance of pricing your home properly from the beginning. The longer the property sits on the market, the steeper the discount. The average list price of Active listings is measured the 15th of each month. Note: The “Under Contract” price is the list price, not the contract price. The contract price is not revealed until the transaction closes. Average Price Paradise Valley - August 2022 Average Price per Square Foot for Closed Transactions the Last 17 Years Sales Price as a Percentage of Original List Price 205155105555 20-Aug 20-Sep 20-Oct 20-Nov 20-Dec 21-Jan 21-Feb 21-Mar 21-Apr 21-May 21-Jun 21-Jul 21-Aug 21-Sep 21-Oct 21-Nov 21-Dec 22-Jan 22-Feb 22-Mar 22-Apr 22-May Jun-22 22-Jul Active Accepted Offers Closed 12 Month Avg Information contained in this report has been prepared by Walt Danley Realty in conjunction with The Cromford Report exclusively for WDR and their clients. All other use is expressly forbidden. © 2022 Paradise Valley Office: 480.991.2050 Scottsdale Office: WaltDanley.com480.909.4577 Number of Listings by Status for the Last Two Years


2 15 25 49 8 9 9 No Active Inventory 1 2 6 5 1 2 3 46050403020100 <$1M $1-$2M $2-3M $3-5M $5M+ Active New This Month Offers Accepted This Month Sold This month 0.5 1.82.5 7.1 0 12 24 $1-$2M<$1M$2-3M$3-5M$5M+ No Sales $536 $756 $684 $1,113 $598 $618 $1,037 $562 $532 $632 $852$1,150$1,050$950$850$750$650$550$450$350 $1-$2M $2-3M $3-5M $5M+ Active - Under contract - Sold - Last 12 Mo0% 2% 4% 6% 8% 10% 12% Jan Feb Mar Apr May Jun Jul Aug Sep Oct Nov Dec 0% 2% 4% 6% 8% 10% 12% Jan Feb Mar Apr May Jun Jul Aug Sep Oct Nov Dec 0% 2% 4% 6% 8% 10% 12% Jan Feb Mar Apr May Jun Jul Aug Sep Oct Nov Dec Seasonality New Listings by Month Accepted Offers by Month Closed Transactions by Month Active listings were measured on the 15th of the previous month. The numbers for New This Month, Accepted Offers and Sold represent the quantities for the entire previous month. Average Price per Square Foot by Price Range The number of months it would take to sell all the currently active listings based on the rate of sales over the last 12 months assuming no new listings were added. Figures for Active and Under Contract were compiled on the 15th of the previous month. Note: The “Under Contract” price is the list price, not the contract price. The contract price is not revealed until the transaction closes. The charts above reflect activity by month. Each bar represents the percentage of annual business done within a specific month. Paradise Valley - August 2022 Inventory - Number of Months MarketSupplyActivity by Price Range Information contained in this report has been prepared by Walt Danley Realty in conjunction with The Cromford Report exclusively for WDR and their clients. All other use is expressly forbidden. © 2022 Paradise Valley Office: 480.991.2050 Scottsdale Office: WaltDanley.com480.909.4577


$986 $858 $747 $886 $974 $682$1,000$900$800$700$600$500 Traditional Short Sale REO Active Closed - Last Month Active- 12 Mo Avg Sold - 12-Mo AvgNoSales Price per Square Foot By Type Paradise Valley - August 2022 $736 $620 $666 $693 $689 $783$800$750$700$650$600 <3,500 3,501-5,000 5,001-7,000 7,001-9,000 9,001-12,000 12,000+ Price per Square Foot Based on size of the home (sold over the last twelve months) $658 $606 $600 $606 $658 $846 $943$950$900$850$800$750$700$650$600$550 <1970 1970s 1980s 1990s 2000s 2010s 2020s Price per Square Foot Based on the year built (sold over the last twelve months) Information contained in this report has been prepared by Walt Danley Realty in conjunction with The Cromford Report exclusively for WDR and their clients. All other use is expressly forbidden. © 2022 Paradise Valley Office: 480.991.2050 Scottsdale Office: WaltDanley.com480.909.4577


Walt Danley Christie ’ s international Real Estate
Paradise Valley Office: 480.991.2050 Office: WaltDanley.com480.909.4577 Data Report
Information is power and the real estate professionals of Walt Danley Christie’s International Real Estate are committed to providing our clientele with the most up-to-date market intelligence available. The information contained in this report has been compiled from the Arizona Regional Multiple Listing Service and various public records. This data is then scrubbed and analyzed in conjunction with The Cromford Report exclusively for the use of Walt Danley Realty and our clients.
Scottsdale
Scottsdale August, 2022
Information contained in this report has been prepared by Walt Danley Realty in conjunction with The Cromford Report exclusively for WDR and their clients. All other use is expressly forbidden. © 2022
On August 1st, Scottsdale’s active listing counts was 1,264, an 11% increase on 1,137 at the beginning of July. This is up 55% from the same time last year. In July we counted just 266 closed sales, down 46% from the 492 we saw in July 2021. Although prices are still far above last year, the last two months have shown increasing price weakness. The twelve-month moving average $/SF came in at $456, up 27% from $359 a year earlier. The six-month moving average stands at $492 up 26% from $389 a year ago and the more volatile three-month average was $502, up from $401 in July 2021, a rise of 25%, but down from $504 last month.
Market

$550$500$450$400$350$300$250$200$150 Jul-05 Jan-06 Jul-06 Jan-07 Jul-07 Jan-08 Jul-08 Jan-09 Jul-09 Jan-10 Jul-10 Jan-11 Jul-11 Jan-12 Jul-12 Jan-13 Jul-13 Jan-14 Jul-14 Jan-15 Jul-15 Jan-16 Jul-16 Jan-17 Jul-17 Jan-18 Jul-18 Jan-19 Jul-19 Jan-20 Jul-20 Jan-21 Jul-21 Jan-22 Jul-22 12 Months Avg 60% 65% 70% 75% 80% 85% 90% 95% 100% <90 <150 >150 >365 Days on the Market $1,809,167$1,991,535 $1,334,098 0 $500K $1.0M $1.5M $2.0M Active Under contract Sold - Last 12 Months This graph shows the number of homes that were active in the area as of the 15th of the previous month. It also shows the number of offers that were accepted and the number of transactions that were closed within the entire month. This graph illustrates the importance of pricing your home properly from the beginning. The longer the property sits on the market, the steeper the discount. The average list price of Active listings is measured the 15th of each month. Note: The “Under Contract” price is the list price, not the contract price. The contract price is not revealed until the transaction closes. Average Price Scottsdale - August 2022 Average Price per Square Foot for Closed Transactions the Last 17 Years Number of Listings by Status for the Last Two Years Sales Price as a Percentage of Original List Price 1000800600400200 20-Aug 20-Sep 20-Oct 20-Nov 20-Dec 21-Jan 21-Feb 21-Mar 21-Apr 21-May 21-Jun 21-Jul 21-Aug 21-Sep 21-Oct 21-Nov 21-Dec 22-Jan 22-Feb Mar-22 22-Apr 22-May 22-Jun 22-Jul Active Accepted Offers Closed 12 Month Avg Information contained in this report has been prepared by Walt Danley Realty in conjunction with The Cromford Report exclusively for WDR and their clients. All other use is expressly forbidden. © 2022 Paradise Valley Office: 480.991.2050 Scottsdale Office: WaltDanley.com480.909.4577


406 215 134 116 166 263 130 54 32 35 177 69 44 27 22 117 70 34 27 175004003002001000 $500K-$1M $1-$1.5M $1.5-2M $2-3M $3M+ Active New This Month Offers Accepted This Month Sold This month 1.82.12.83.1 5.9 0 12 24 $500K-$1M$1-$1.5M$1.5-2M$2-3M$3M+ $395 $433 $491 $576 $917 $379 $427 $485 $612 $788 $366 $408 $454 $524 $710$900$800$700$600$500$400$300$200 $500K-$1M $1-$1.5M $1.5-2M $2-3M $3M+ Active Under contract Sold - Last 12 Mo 0% 2% 4% 6% 8% 10% 12% Jan Feb Mar Apr May Jun Jul Aug Sep Oct Nov Dec 0% 2% 4% 6% 8% 10% 12% Jan Feb Mar Apr May Jun Jul Aug Sep Oct Nov Dec 0% 2% 4% 6% 8% 10% 12% Jan Feb Mar Apr May Jun Jul Aug Sep Oct Nov Dec Seasonality New Listings by Month Accepted Offers by Month Closed Transactions by Month Active listings were measured on the 15th of the previous month. The numbers for New This Month, Accepted Offers and Sold represent the quantities for the entire previous month. Average Price per Square Foot by Price Range The number of months it would take to sell all the currently active listings based on the rate of sales over the last 12 months assuming no new listings were added. Figures for Active and Under Contract were compiled on the 15th of the previous month. Note: The “Under Contract” price is the list price, not the contract price. The contract price is not revealed until the transaction closes. The charts above reflect activity by month. Each bar represents the percentage of annual business done within a specific month. Scottsdale - August 2022 Inventory - Number of Months MarketSupplyActivity by Price Range Information contained in this report has been prepared by Walt Danley Realty in conjunction with The Cromford Report exclusively for WDR and their clients. All other use is expressly forbidden. © 2022 Paradise Valley Office: 480.991.2050 Scottsdale Office: WaltDanley.com480.909.4577


$599 $388 $491 $611 $416 $220 $455 $334 $295$600$500$400$300$200$100 Traditional Short Sale REO Active Closed - Last Month Active- 12 Mo Avg Sold - 12-Mo Avg Price per Square Foot By Type Scottsdale - August 2022 $408 $434 $500 $543 $590 $853$900$850$800$750$700$650$600$550$500$450$400$350$300 <3,000 3,001-4,000 4,001-5,000 5,001-7,500 7,501-10,000 10,000+ Price per Square Foot Based on size of the home (sold over the last twelve months) $426 $423 $414 $420 $479 $583 $655$700$650$600$550$500$450$400$350 <1970 1970s 1980s 1990s 2000s 2010s 2020s Price per Square Foot Based on the year built (sold over the last twelve months) Information contained in this report has been prepared by Walt Danley Realty in conjunction with The Cromford Report exclusively for WDR and their clients. All other use is expressly forbidden. © 2022 Paradise Valley Office: 480.991.2050 Scottsdale Office: WaltDanley.com480.909.4577