City Report


In 2024, Denver welcomed 37.1 million visitors, on par with the previous record set in 2023. This record number of visitors also generated $10.3 billion in tourism revenue, consistent with 2023's record-breaking year.
“Tourism is vital to the Denver economy, and we are pleased to see 2024 numbers in line with 2023, which matched our expectations,” said Richard W. Scharf, President and CEO of Visit Denver. "After 2023’s strong results, where Denver’s results exceeded those of many other cities that did not fully recover until 2024, keeping pace is an accomplishment that shows the combined strength of the tourism product in Denver and the promotional efforts of the organization. We are proud that Denver had such a strong showing with the economic headwinds last year and in an increasingly competitive market. We are equally proud that the tourism industry was able to support 73,500 jobs across the metro area last year, and to generate millions in state and local taxes.” (Employment figures source: Dean Runyan Associates 2024 Economic Impact of Travel Study)
Overnight visitors totaled 19.8 million, generating $8.7 billion in spending, which is on par with 2023. Overnight leisure visitors totaled 17.4 million, consistent with 2023's record-setting year.
The study confirmed that Denver is a year-round destination with overnight visitation spread evenly throughout the year, with a modest surge in the warmer months. Denver saw 22% of visitors in Q1, 26% in Q2, 28% in Q3 and 23% in Q4.
Key numbers for 2024 include:
• Denver welcomed 37.1 million total visitors in 2024, including 19.8 million overnight visitors and 17.3 million day visitors.


• Overnight leisure visitors totaled 17.4 million in 2024. That includes a record 8.7 million “marketable” visitors, those most open to tourism promotions, a 14% increase over 2023.
• Denver visitors spent $10.3 billion in 2024, including $8.7 billion from overnight visitors and an additional $1.7 billion in spending from day visitors.
• Expenditures by overnight visitors averaged $437 per person per trip with year-over-year increases in each tracked category:
o Transportation spending within the destination reached nearly $3 billion.
o Lodging spending hit $2.5 billion.
o Restaurant Food and Beverage spend reached nearly $1.5 billon.
o Retail Purchases totaled just over $1 billion, with 57% of visitors shopping at locally-owned businesses compared to 48% nationally.
o Recreation, Sightseeing and Entertainment totaled $735 million.
The Mile High City welcomes everyone! We are committed to making the core values of diversity, equity, and inclusion a way of life for our organization, our partners in the hospitality industry, and our visitors.

At Visit Denver, we believe that travel makes the world a smaller and more connected place. It brings people together and fosters interaction among diverse cultures. It builds understanding, appreciation, empathy and respect for one another. This philosophy is essential to who we are as a community and why Denver is one of the top destinations in the country to live and to visit.
Denver celebrates its rich cultural heritage across our vibrant neighborhoods with attractions, restaurants, festivals and events throughout the year. Go to Diverse Denver, where you will find our Accessibility Guide, our Land Acknowledgment to support Indigenous people, and more.


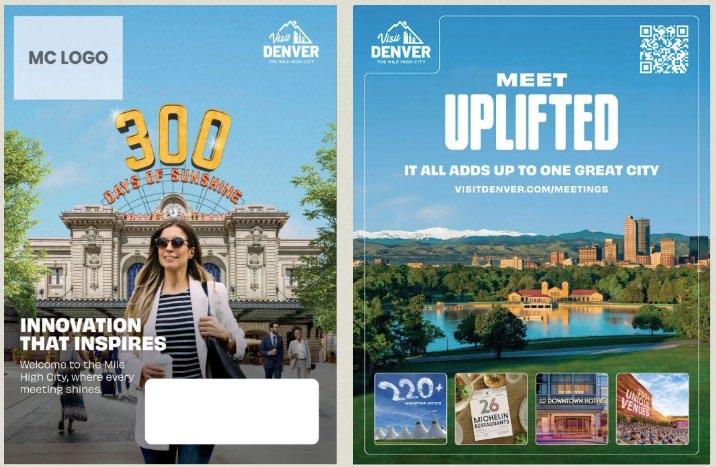
The Conventions ad campaign ran in August with a total of 2,832,653 impressions for the month.
There were 16,861 conversions on the Visit Denver website.
The August LinkedIn organic total impressions were 9,152.
The campaign is designed to both inspire and inform and will run in meeting planner website and magazines.

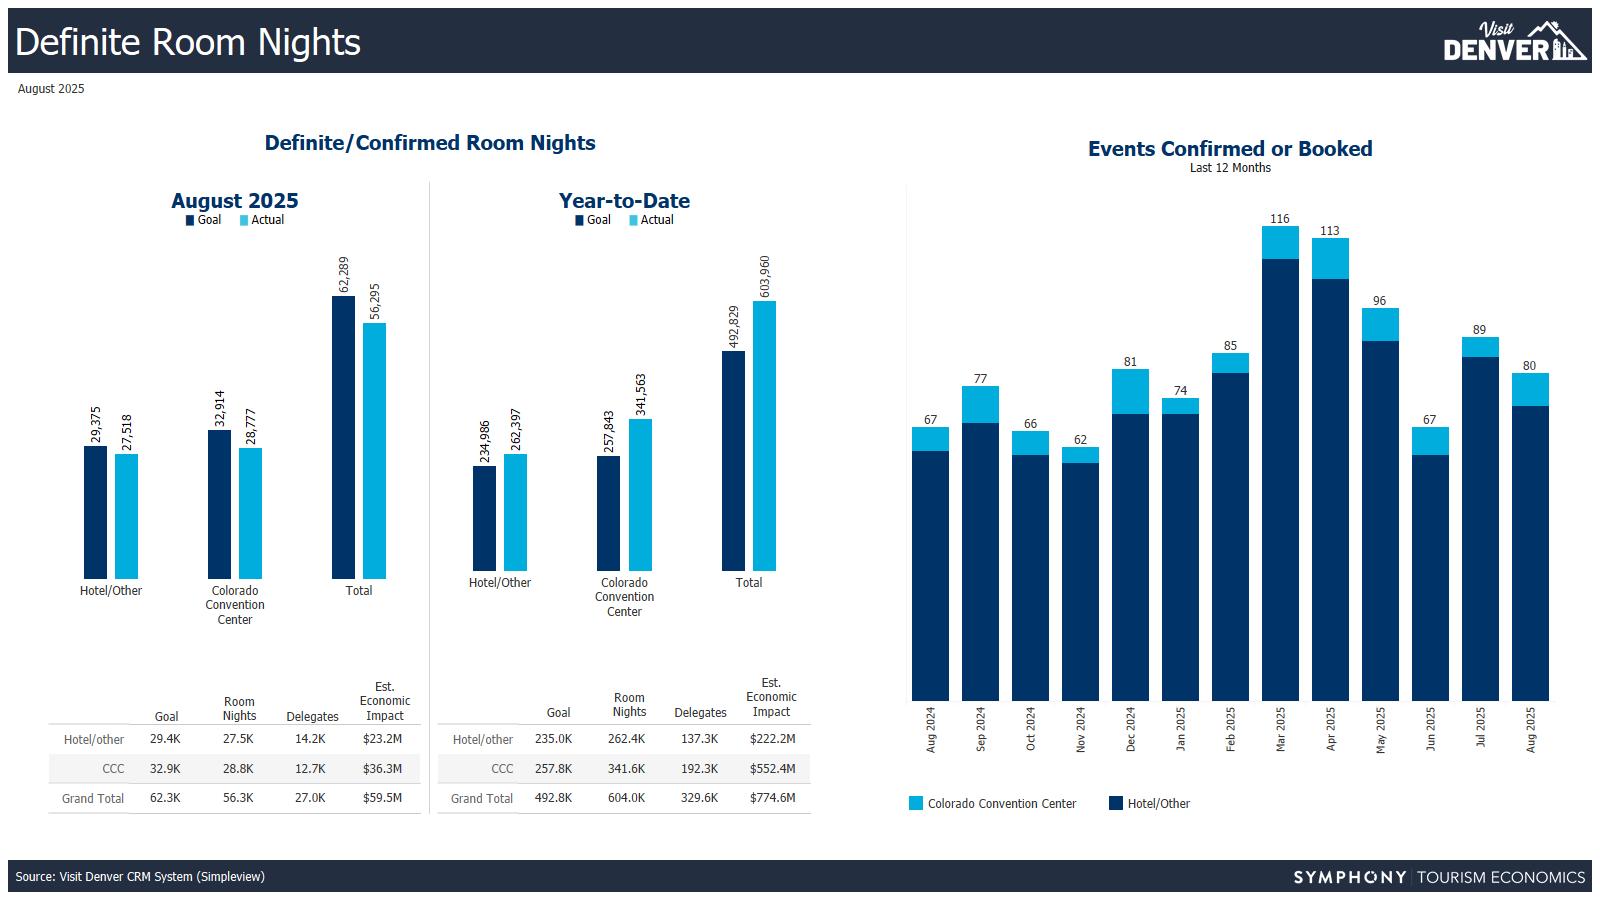
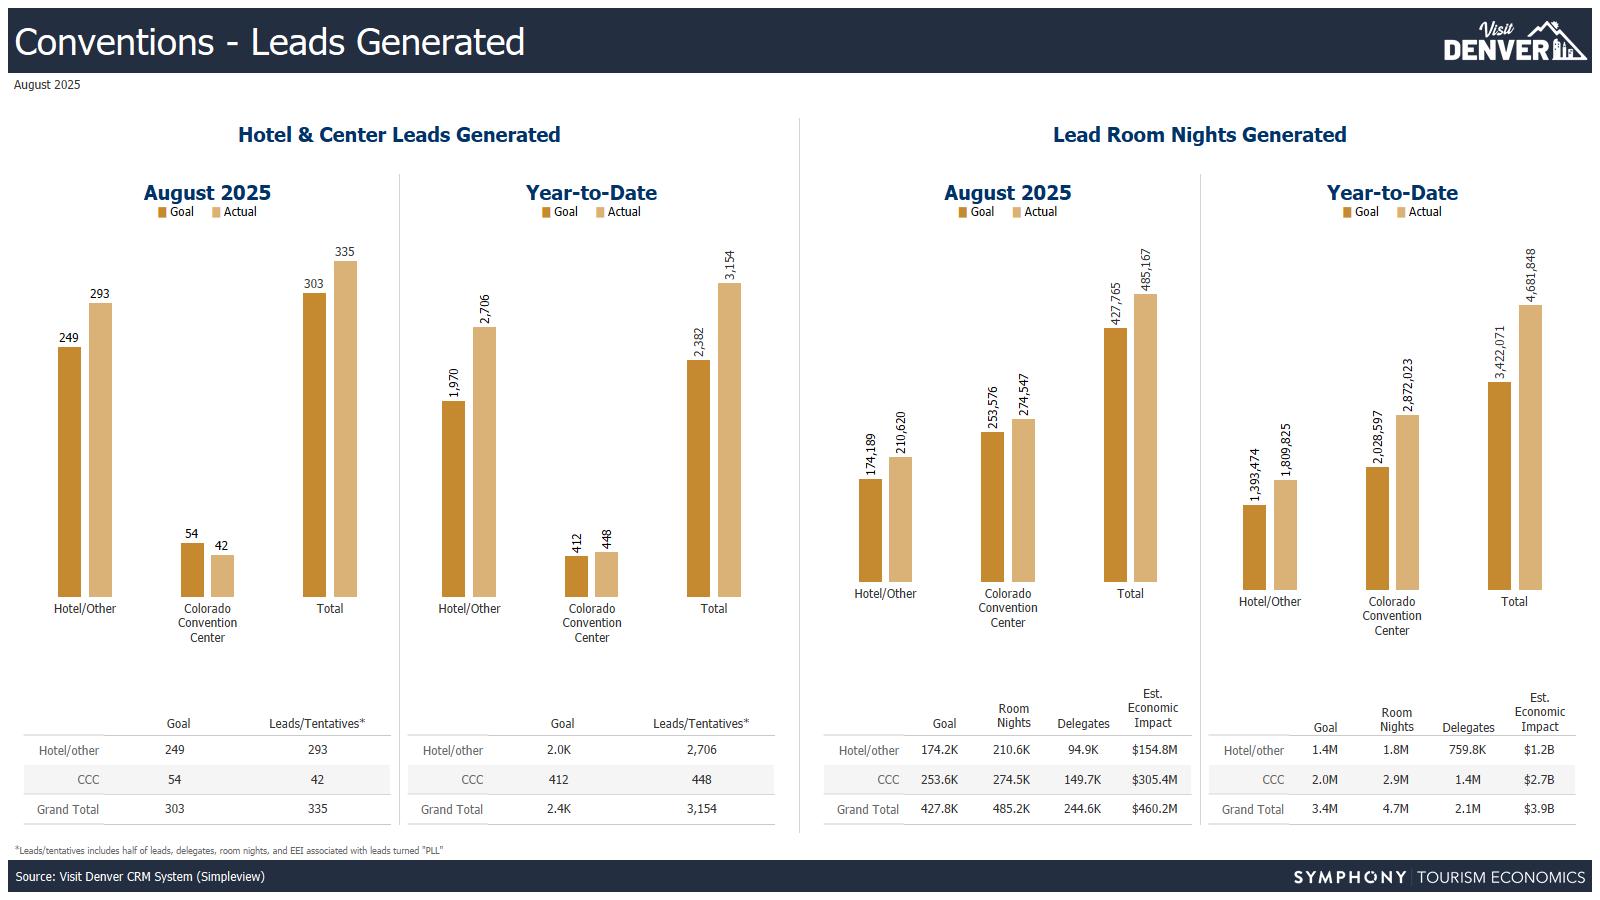
The Convention Sales team had strong production month finishing at 56,295 RN booked for the month of August
Key conventions booked were:
The Project Management Institute, October
Pediatric Academic Societies April 2031
The sales team was busy in the month of August showcasing Denver as a premier meetings and events destination while attending ASAE, Maritz Activate, Connect Marketplace and the HPN Global Partner Conference.
In August, our Services team was busy hosting American Psychological Association with 10,000 attendees and Informa Connect Newtopia with 15,000 attendees.



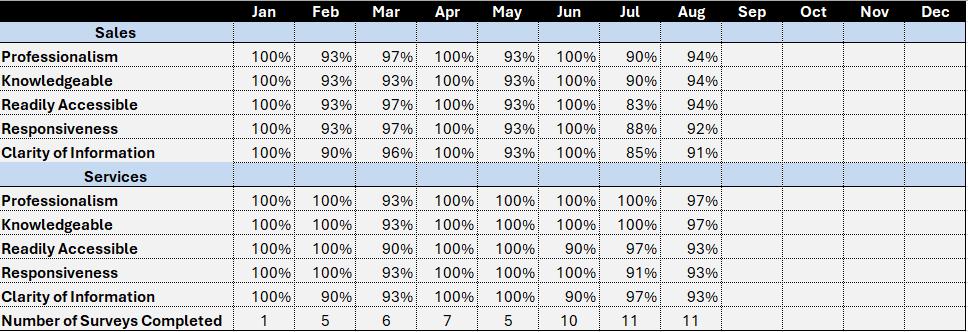
Immediately following a convention or meeting in Denver, the meeting planner is sent a survey regarding their experience with VISIT DENVER's Sales and Service staff and effort.
As of August 2025, Denver International Airport (DEN) proudly holds the No. 1 spot in the nation for the most nonstop domestic destinations, making it the premier gateway to more U.S. cities than any other airport.
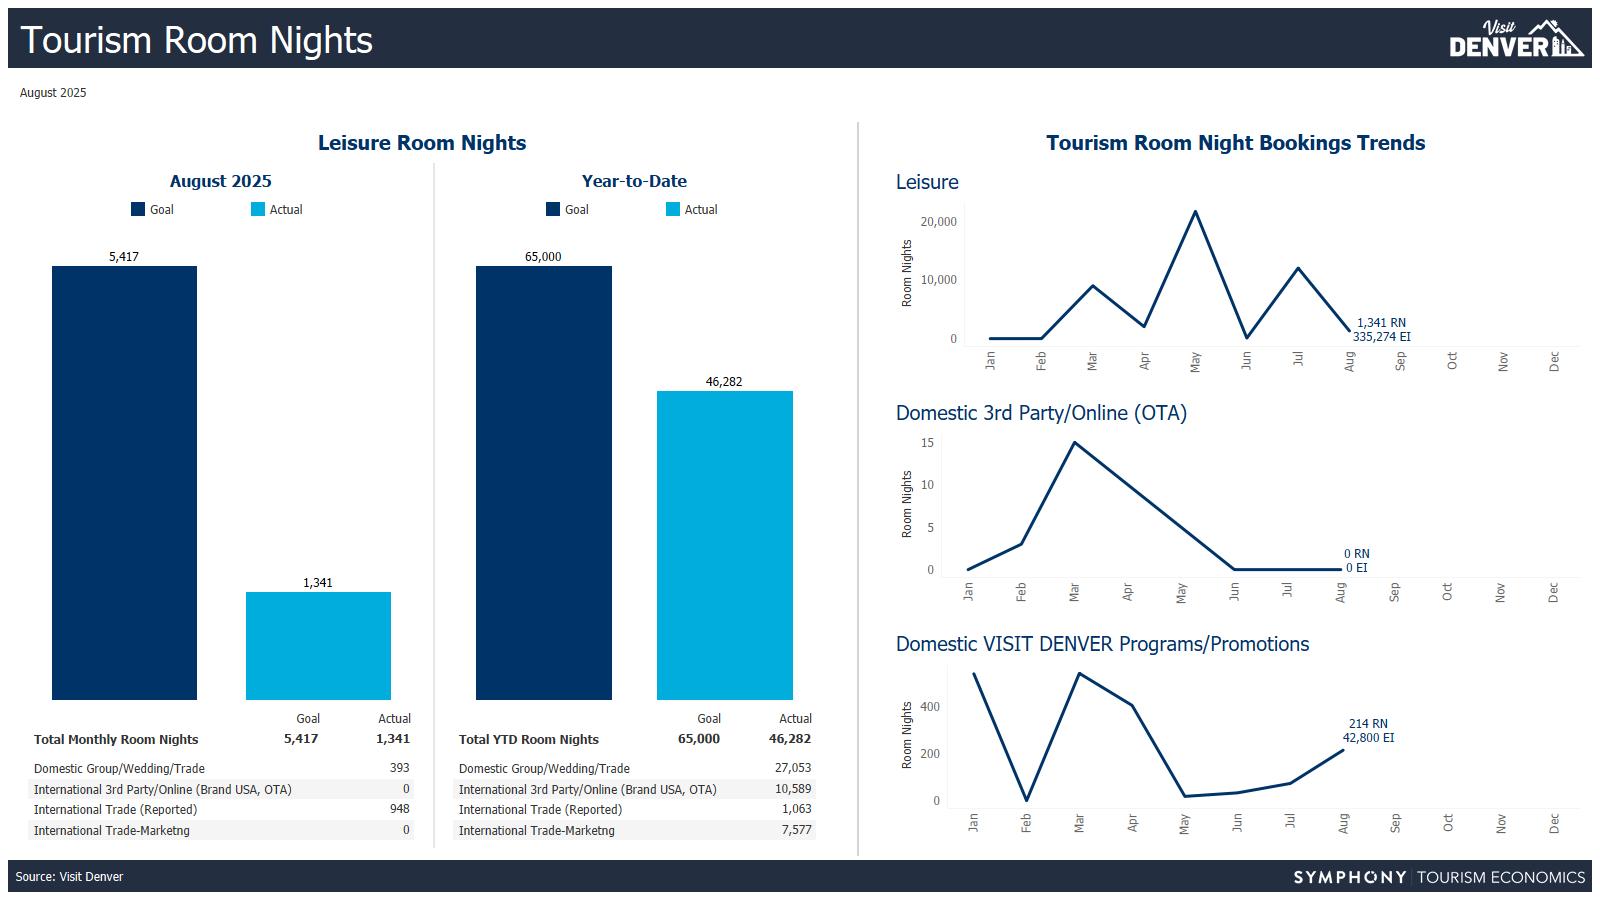
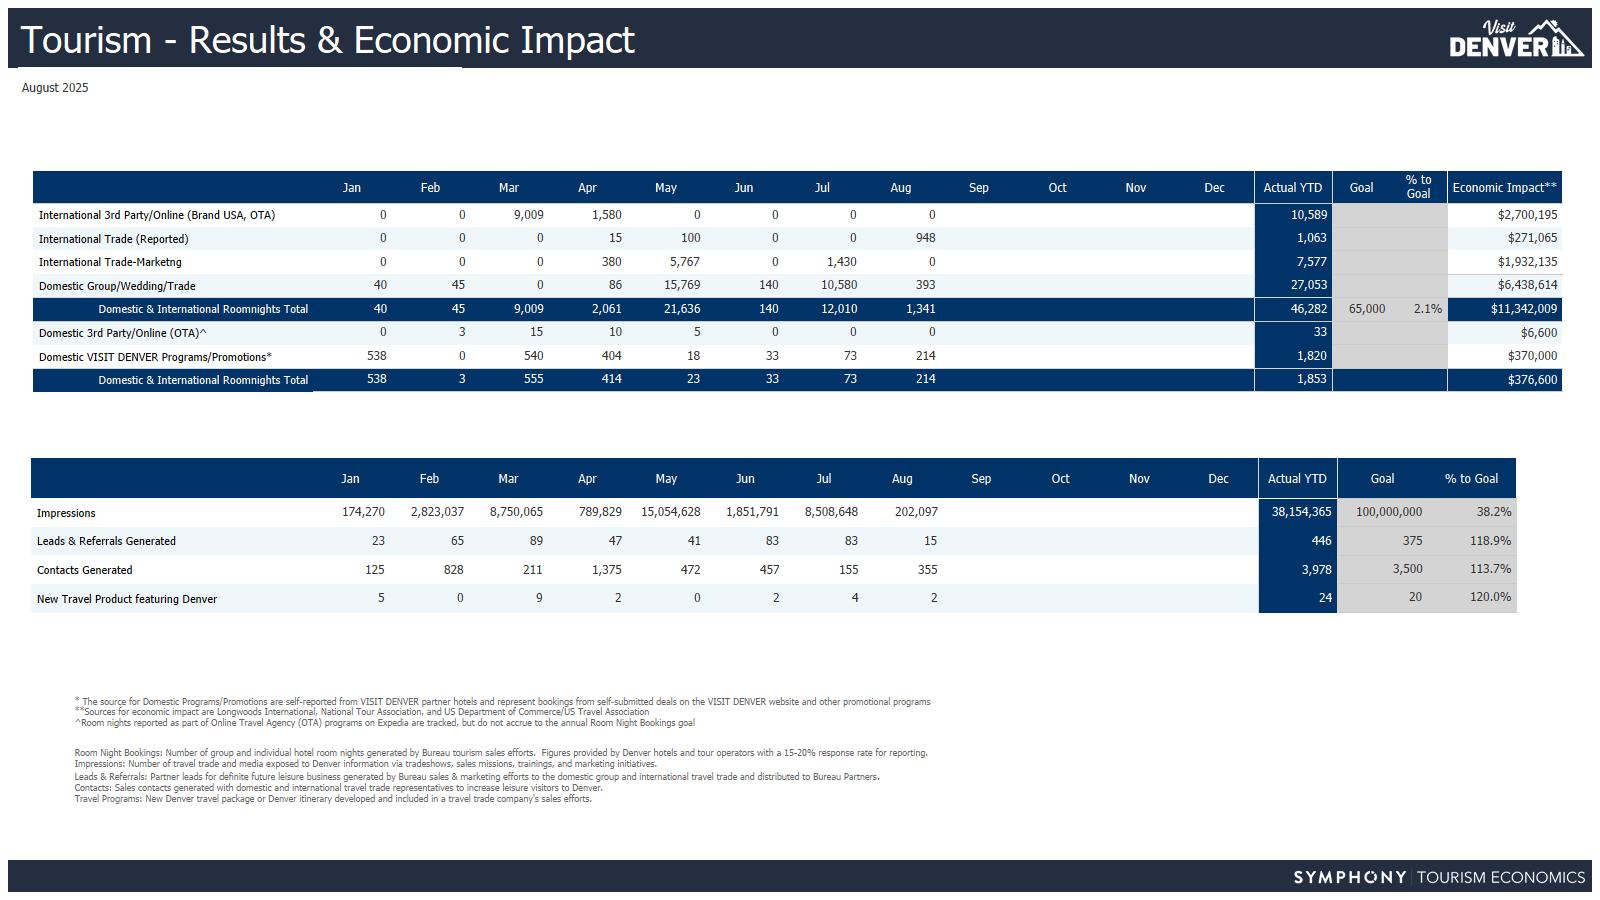
Room nights: 1,341 (YTD: 46,281; Domestic: 27,052 and International: 19,229)
� 0: 3rd Party/Online (YTD: International: 10,589)
� 948: Travel Trade direct-Despegar Mexico (YTD: Domestic: 10,400; International: 1,063)
� 0: Travel Trade marketing (Domestic: 15,569; International: 7,577)
� 393: Wedding groups domestic (YTD: 1,083)
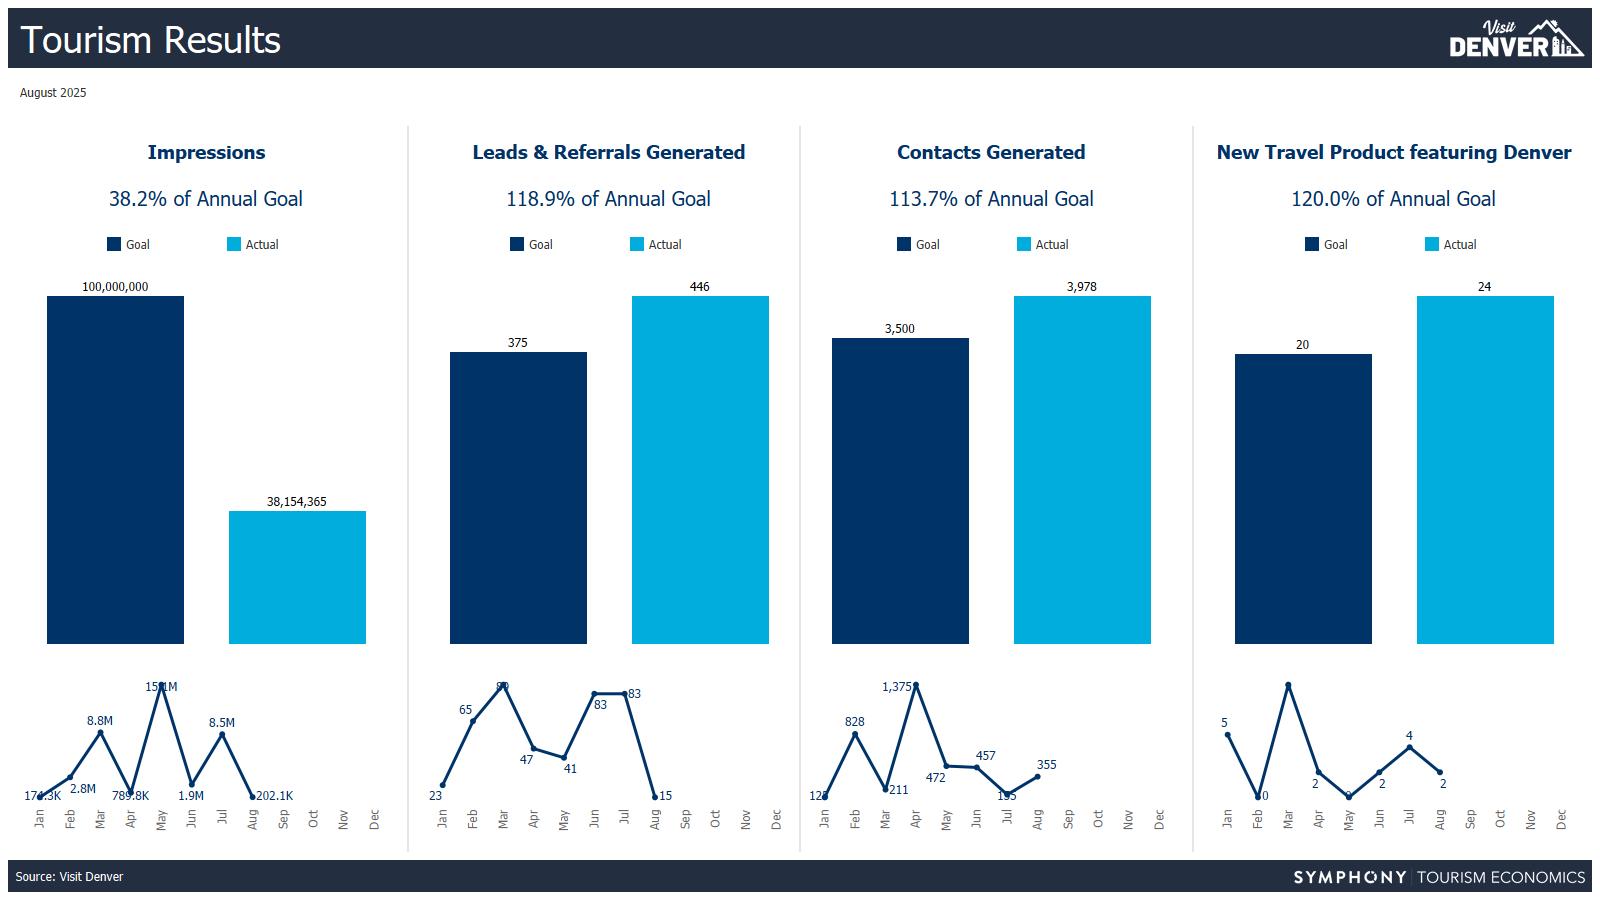
Marketing Initiatives: 4 representing 202,097 impressions (YTD: 57 representing 38,154,365 impressions; International: 55 representing 29,428,342 impressions; Domestic: 2 representing 8,726,023 impressions)
� Visit USA (Germany): 22,600 impressions from e-newsletter
� Brand USA Global Inspiration Guide: 175,000 printed guides
� Brand USA VisitTheUSA.com (Global): 4,261 website impressions. (ongoing initiative)
� Visit USA Association (UK): 236 website impressions. (ongoing initiative)
Tradeshow/Sales Mission: YTD: 10 with 436 international & 18 domestic contacts
Travel Trade Trainings: 3 with 289 trained (YTD: 35 with 3,177 trained; 34 International with 2,162; 1 Domestic with 15 trained)
� Colorado Tourism Office (Australia, France & Germany): Trained 289 travel trade agents
New Programs 2 total; 1 international & 1 Domestic (YTD: 24 total; 22 International, 2 Domestic)
� Collette Tours (USA): Rocky Mountaineer group tour with multiple departure dates
� Erlebe (Germany): Denver city package
Site Inspections YTD: 29 international site inspections with 210 travel trade participants; 183 International & 27 Domestic participants





The regional campaign continued in August. Last month, it generated over 27 million impressions and over 77,000 conversions on the website. To-date this year, over 174,000 room nights and more than $30 million in hotel sales has been generated by those viewing the ads.
The national spring/summer campaign wrapped in August. Last month, it generated more than 59 million impressions and more than 116,000 conversions on the website. Since the start of the campaign, more than 239,000 room nights and $49 million in hotel sales has been generated by those viewing the ads.
The local metro version of the campaign also finished in August. While not explicitly intended to generate hotel sales, it generated a total of more than 19,000 room nights and nearly $3.5 million in hotel sales by those viewing the ads.
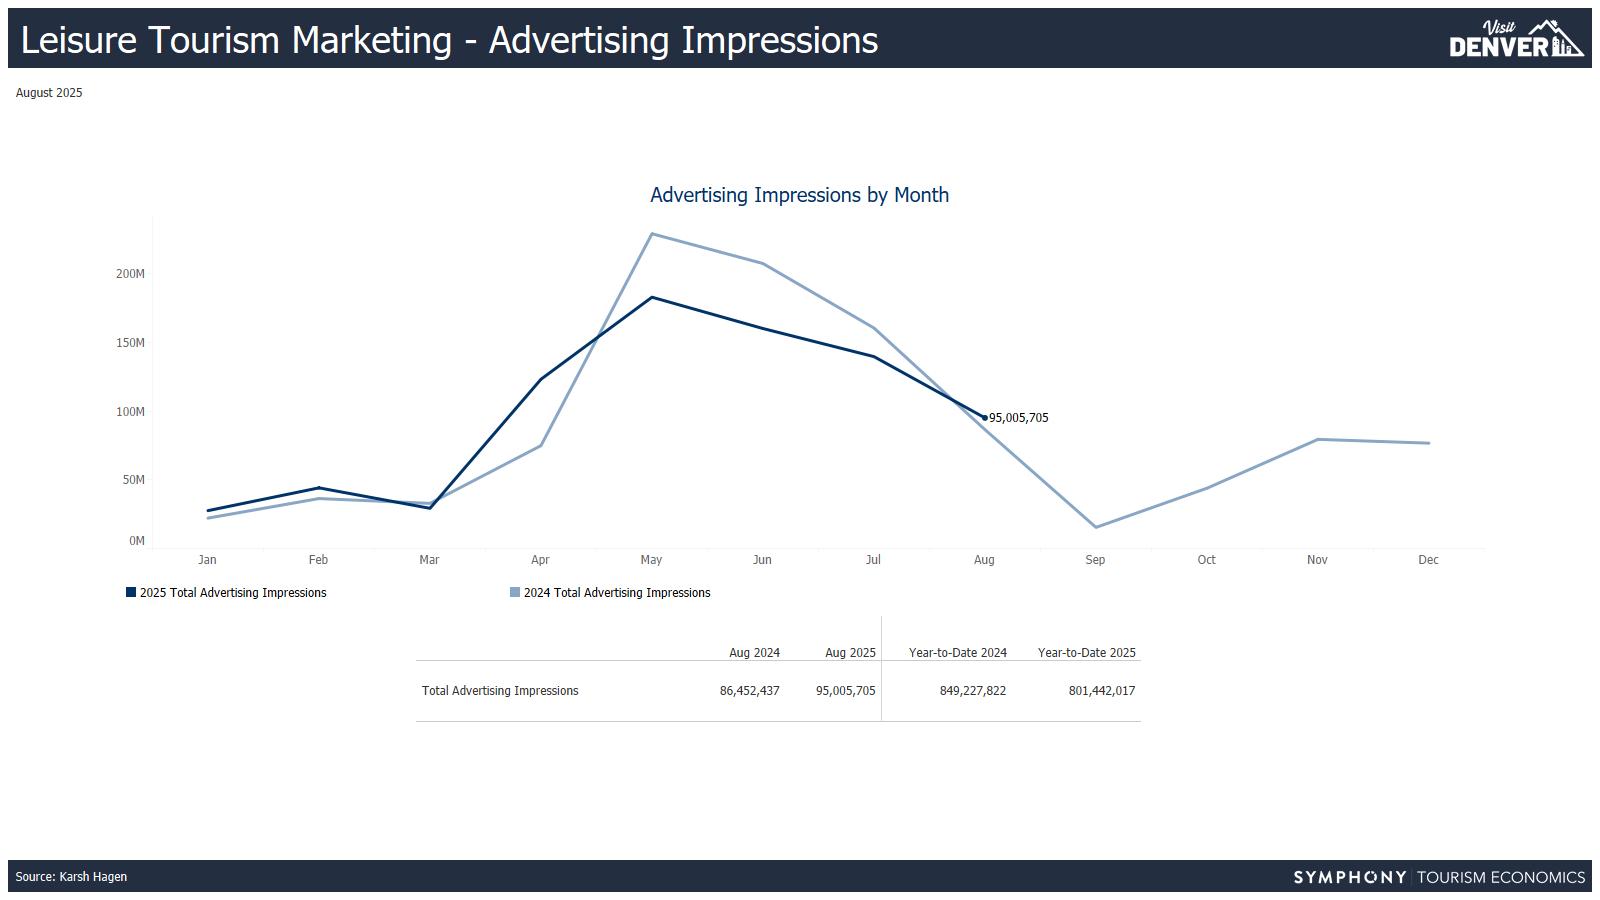
Total consumer campaign impressions in August: 95,005,705. Total consumer campaign website conversions in August: 216,152.
Mile High Culture Pass:
• Visit Denver sells the pass as a three-day option newly priced at $41 per pass. 42 tickets sold in August via visitdenver.com
Denver CityPASS:
• 332 tickets sold in August via visitdenver.com v. 245 sales in August 2024. Year-to-date sales totals $10,907 in tickets.





• In August, Visit Denver held the bi-monthly Digital Marketing Roundtable. Salim Bourget, Visit Denver's Director of Web & Content, presented on how AI is reshaping visibility of businesses across the digital landscape. A record number of more than 80 partners joined the meeting either in-person or virtually.
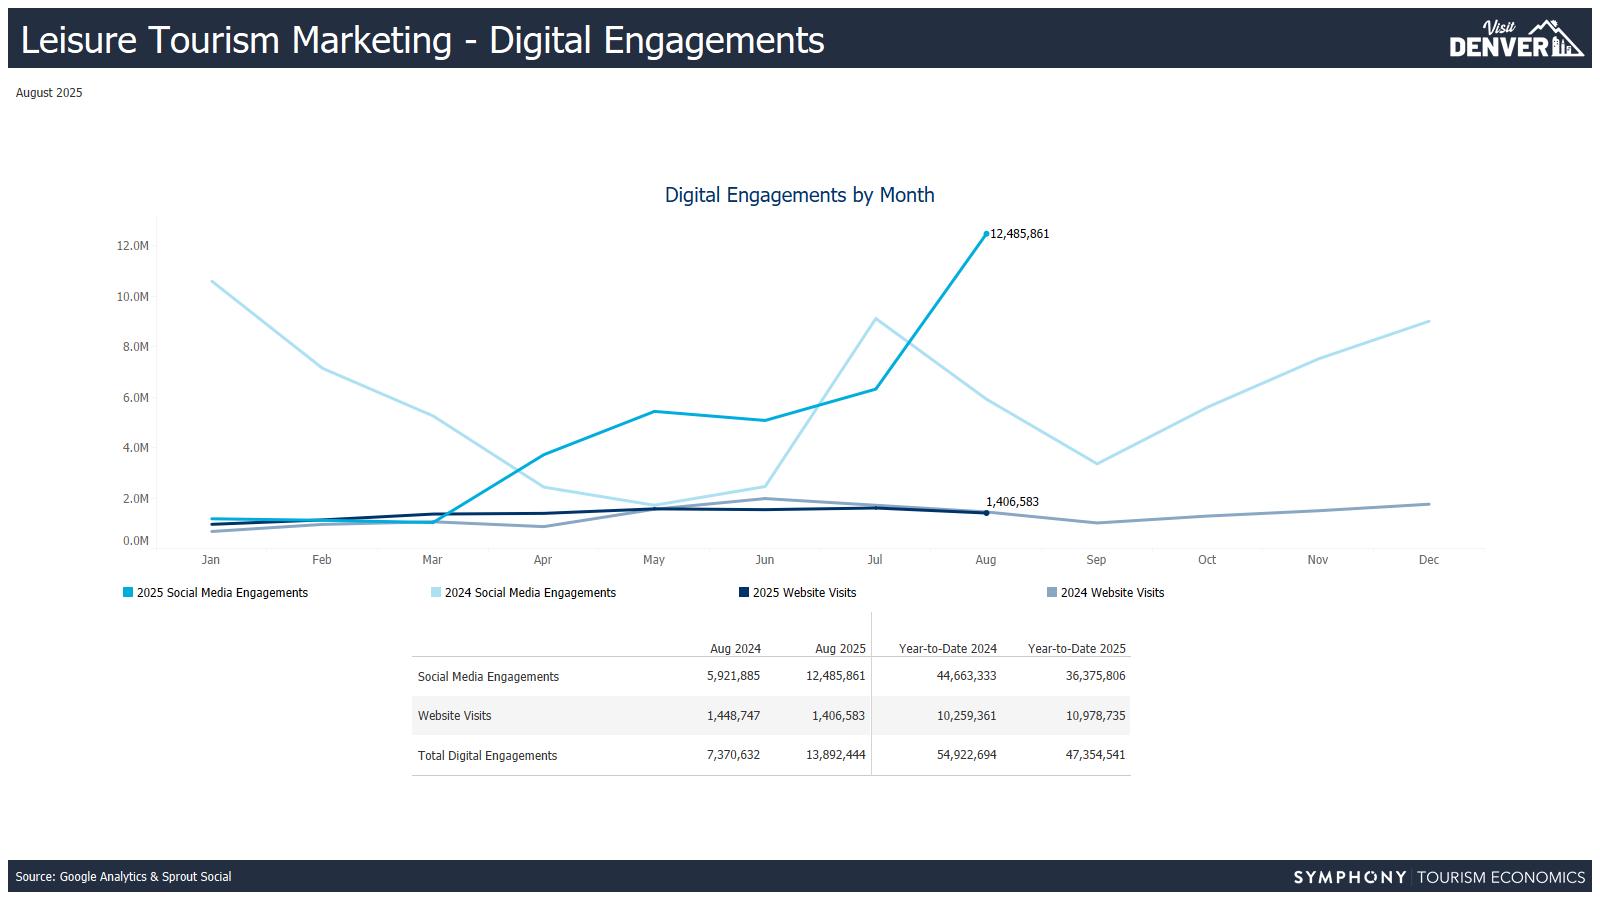
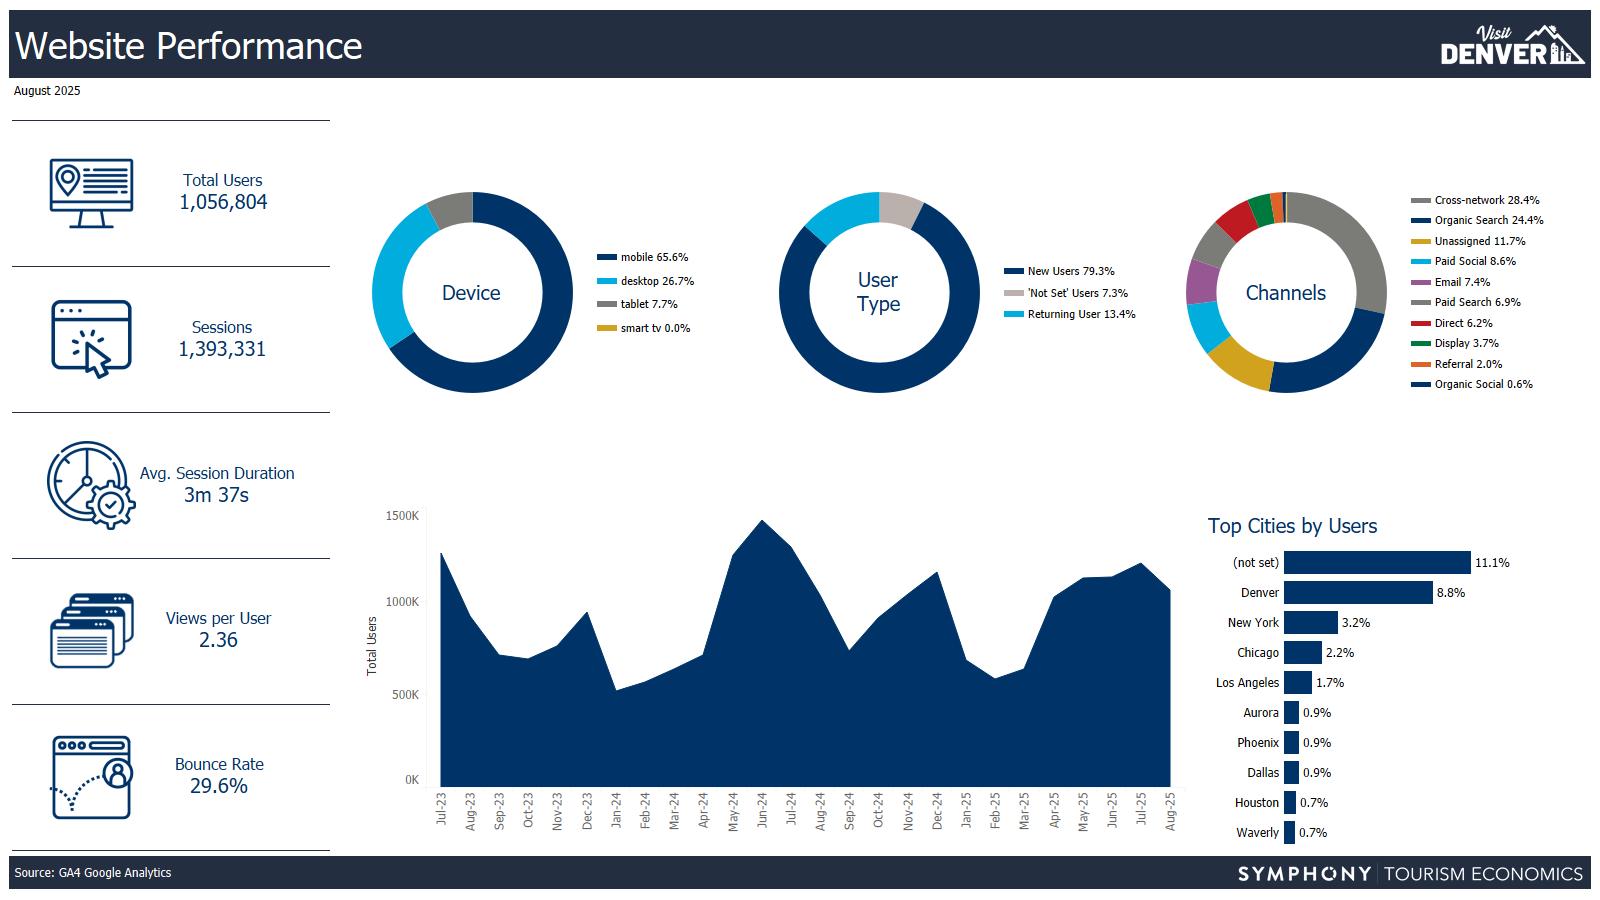
• Total monthly sessions to all websites in August were 1,406,583 sessions, which is down 3% from August 2024.
• Top landing pages included Discover Denver | Visit Denver (over 157K) and Denver Arts and Culture | Visit Denver (128k).


• Total social media engagements (paid and organic) were 12,485,861 in the month of August. Primary platforms include Facebook and Instagram.



In January of 2025, Visit Denver started intercepting visitors when they arrive in Denver Metro and at the Colorado Convention Center. Visitors are served dynamic ads for places to eat, places to go and attraction passes
Year over Year Reporting on Geofencing will begin in 2026
Tourism – Sales & Marketing
YTD Geofencing served as a new touchpoint at 10,313 conversions on our website







A. Convention Sales Performance
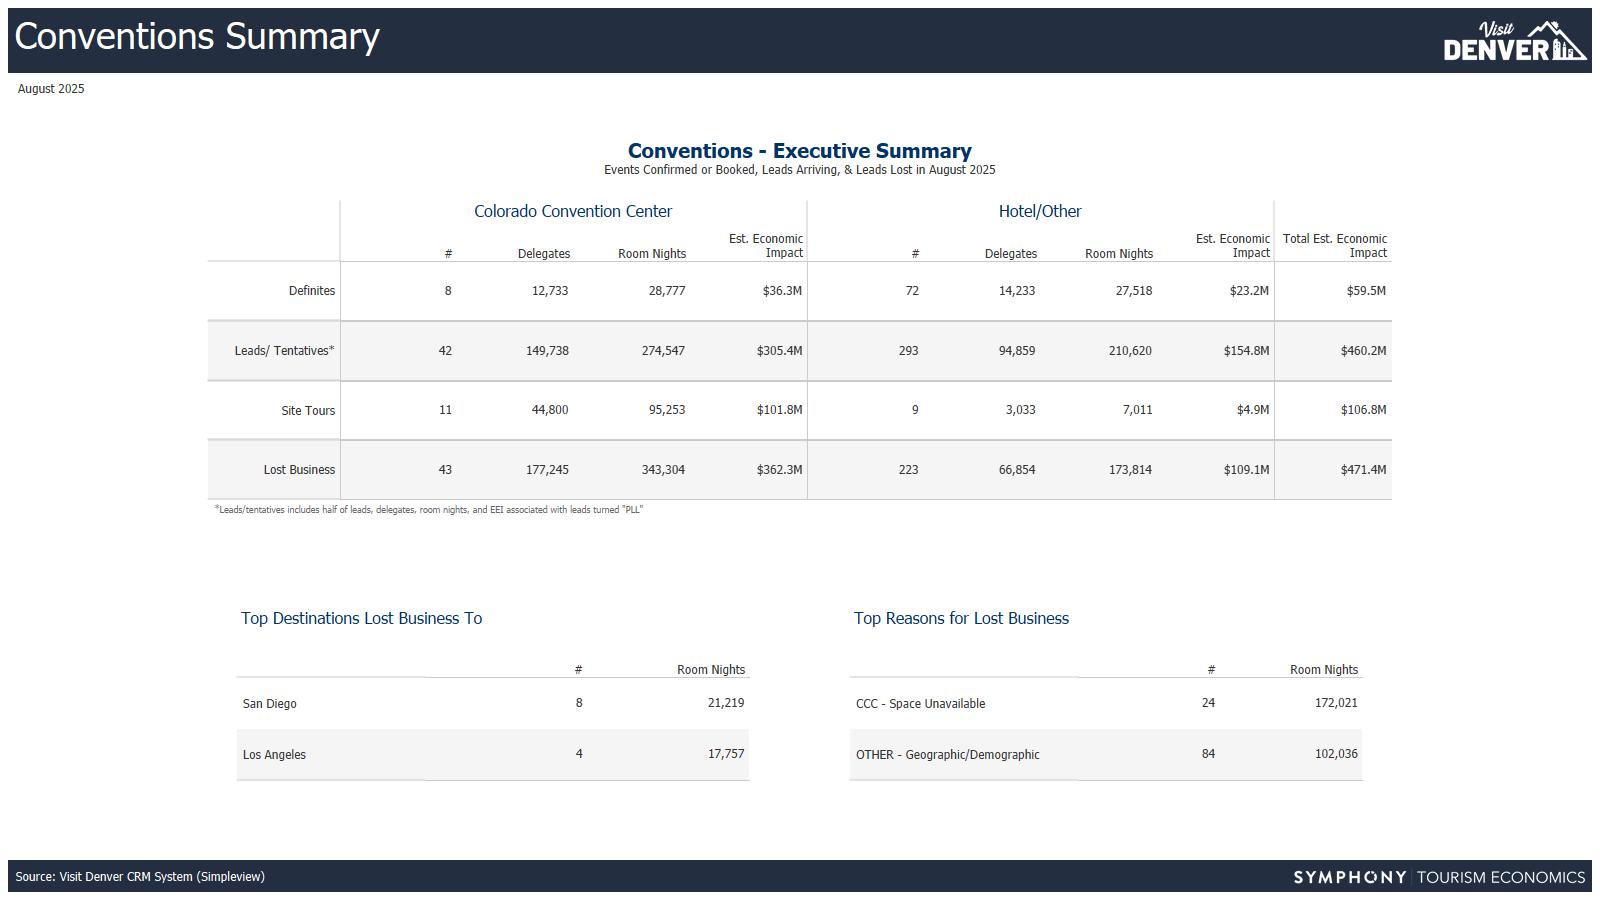
A.1 Convention Room Nights & Estimated Economic Impact Conventions Summary
A.1.a Lead (Tentative} and Definite/Confirmed
A.2 Hotel Leads Generated
B. Leisure Tourism
B.1 Leisure Room Nights Booked & Estimated Economic Impact
Conventions Summary
Conventions Summary
Tourism Room Nights
The monthly results can fluctuate from projections because the majority of international and domestic group room nights are obtained in Q3-Q4 by self-reporting of consumed room nights from clients; and only 15-20 percent of active clients provide room night results. Room nights reported as part of domestic leisure Online Travel Agency (OTA) programs on Expedia, which were reported as part of this goal in 2021, will continue to be tracked, but do not accrue to the annual Room Night Bookings goal.
B.2 Leisure Tourism Marketing Tourism Room Nights
B.2.a Advertising impressions
B.2.b Digital engagements (website/mobile visits & social media)
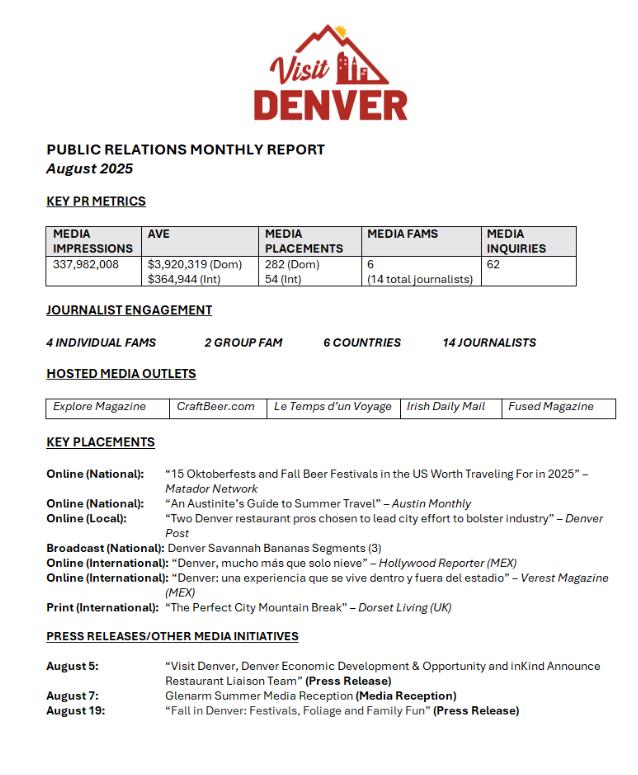
C Public Relations
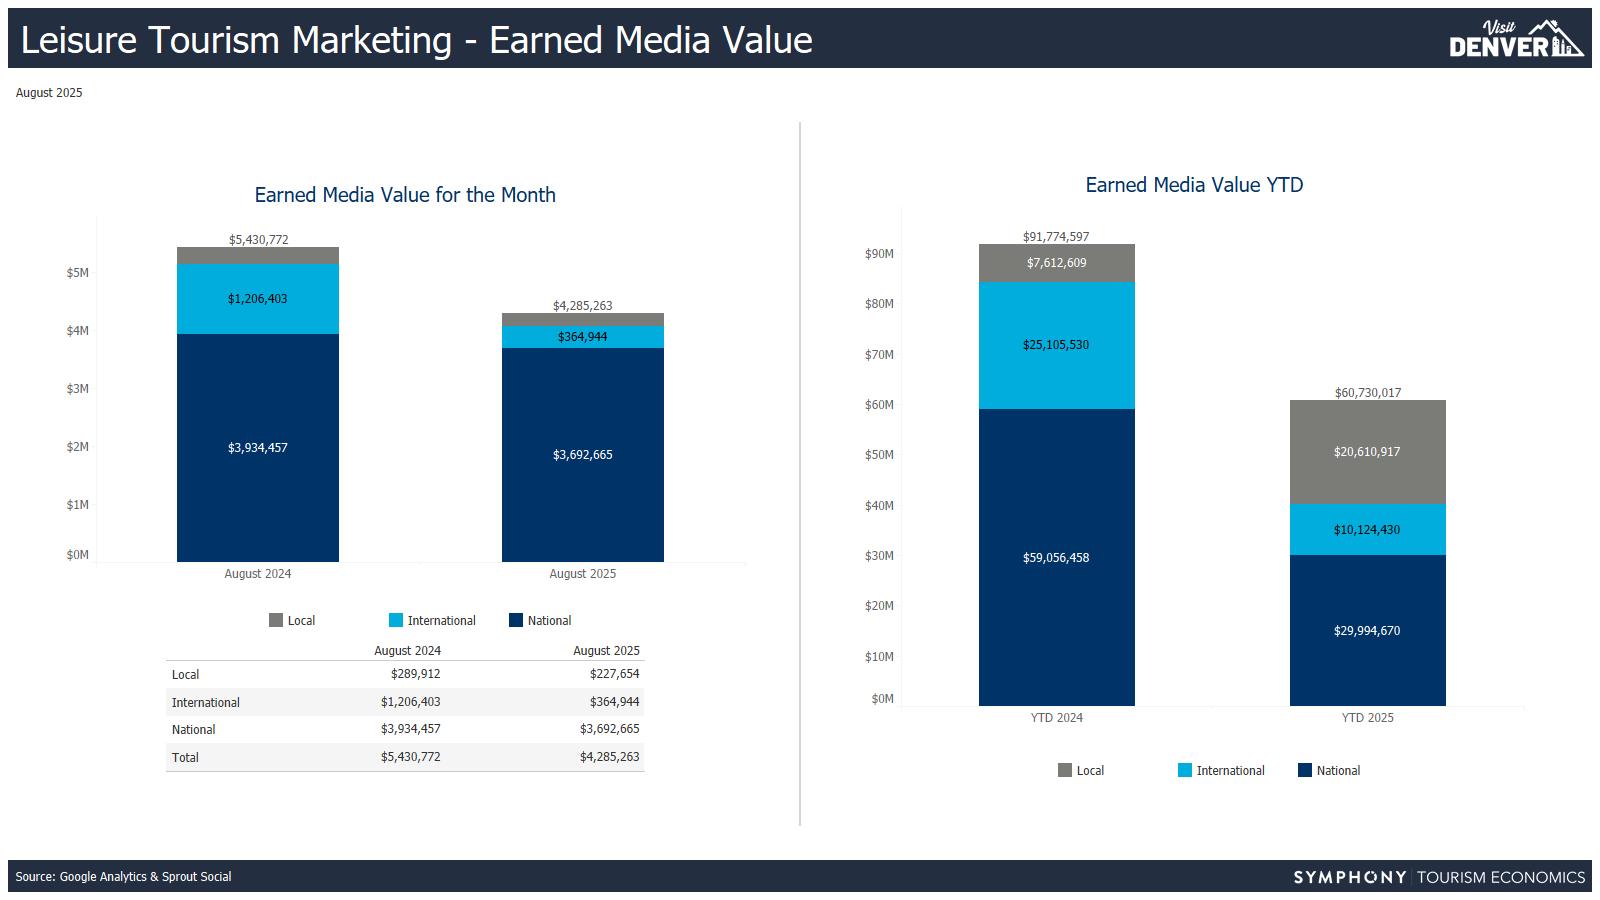
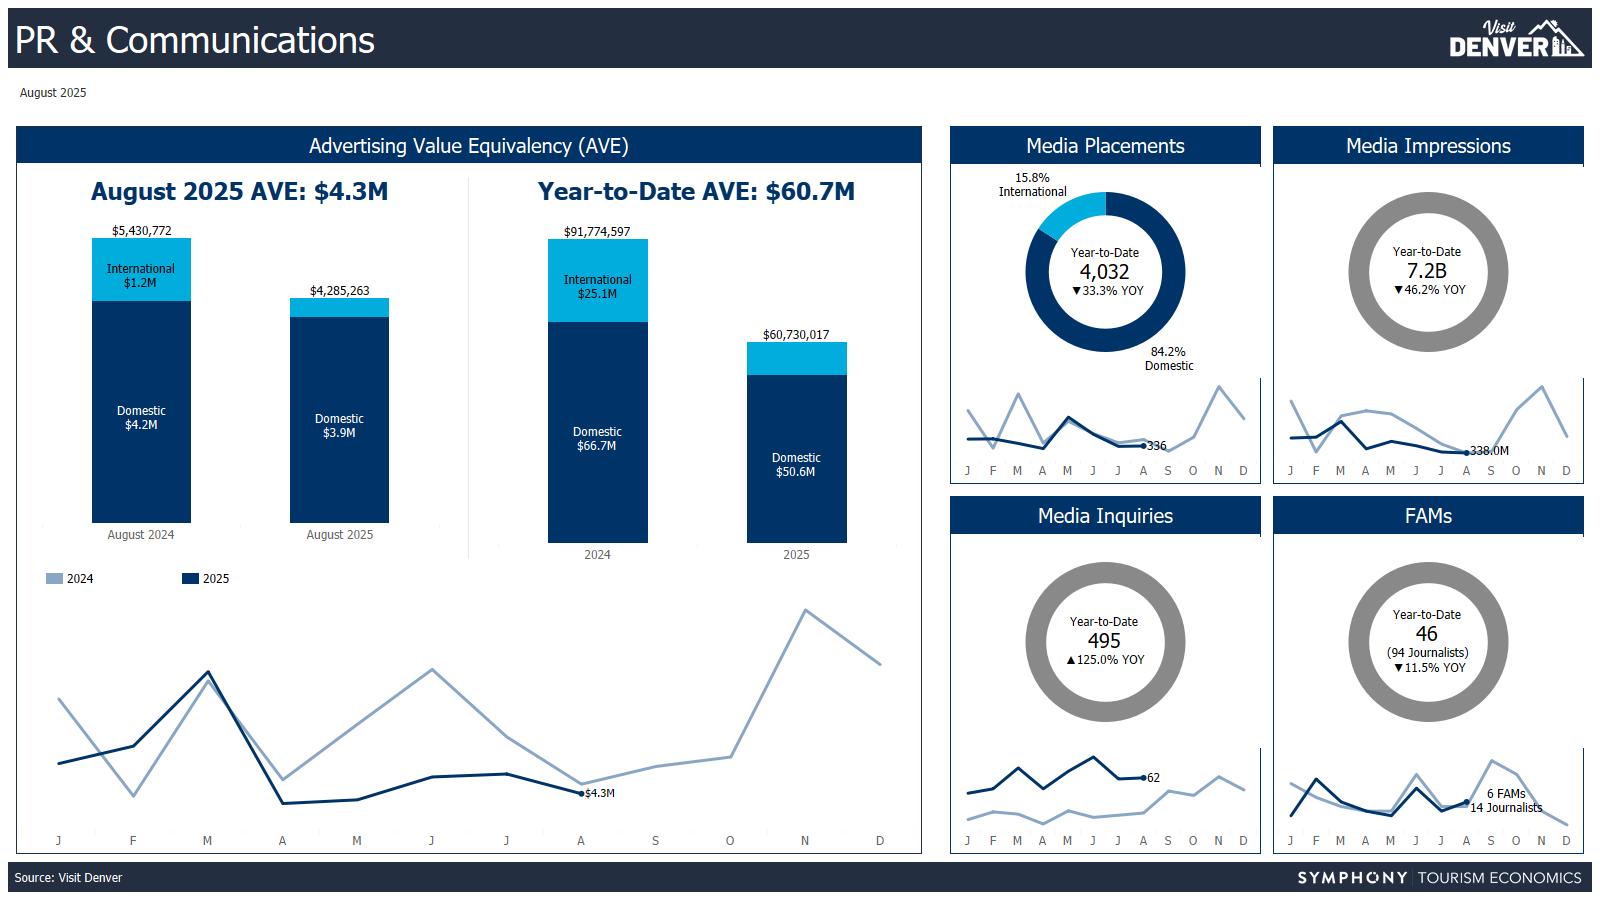
C.1 Earned Media Value & Number of Stories or Mentions: Local, National, International PR & Communications
D. Visitor Inquires/Touchpoints
D.1 Interactive Impressions
D.1.a Website visits - Desktop & Mobile
D.l.b Mobile Application Visits
D.1.c Social Media engagements
D.2 Visitor lnquires/Touchpoints
D.1 Visitors assisted at Information Centers
D.2 Request for Offical Visitor publications & 1-800 calls
D.3 Subscribers to online newsletters & promotions
Interactive Touchpoints
Website Performance
Website Performance
Social Media
Tourist Inquiry Touchpoints
This metric measures the value of print, broadcast and internet editorial coverage that is positive to the bureau and was assisted by the PR staff (non-advertising), which is provided by Cision, Burrelles Luce, PR Newswire and TV Eyes in 2022.
Touchpoints are a rollup of visits to the VISITDENVER.com desktop and mobile sites, uses of the VISIT DENVER mobile app and social media interactions (Facebook engagements, video views and lnstagram engagements).
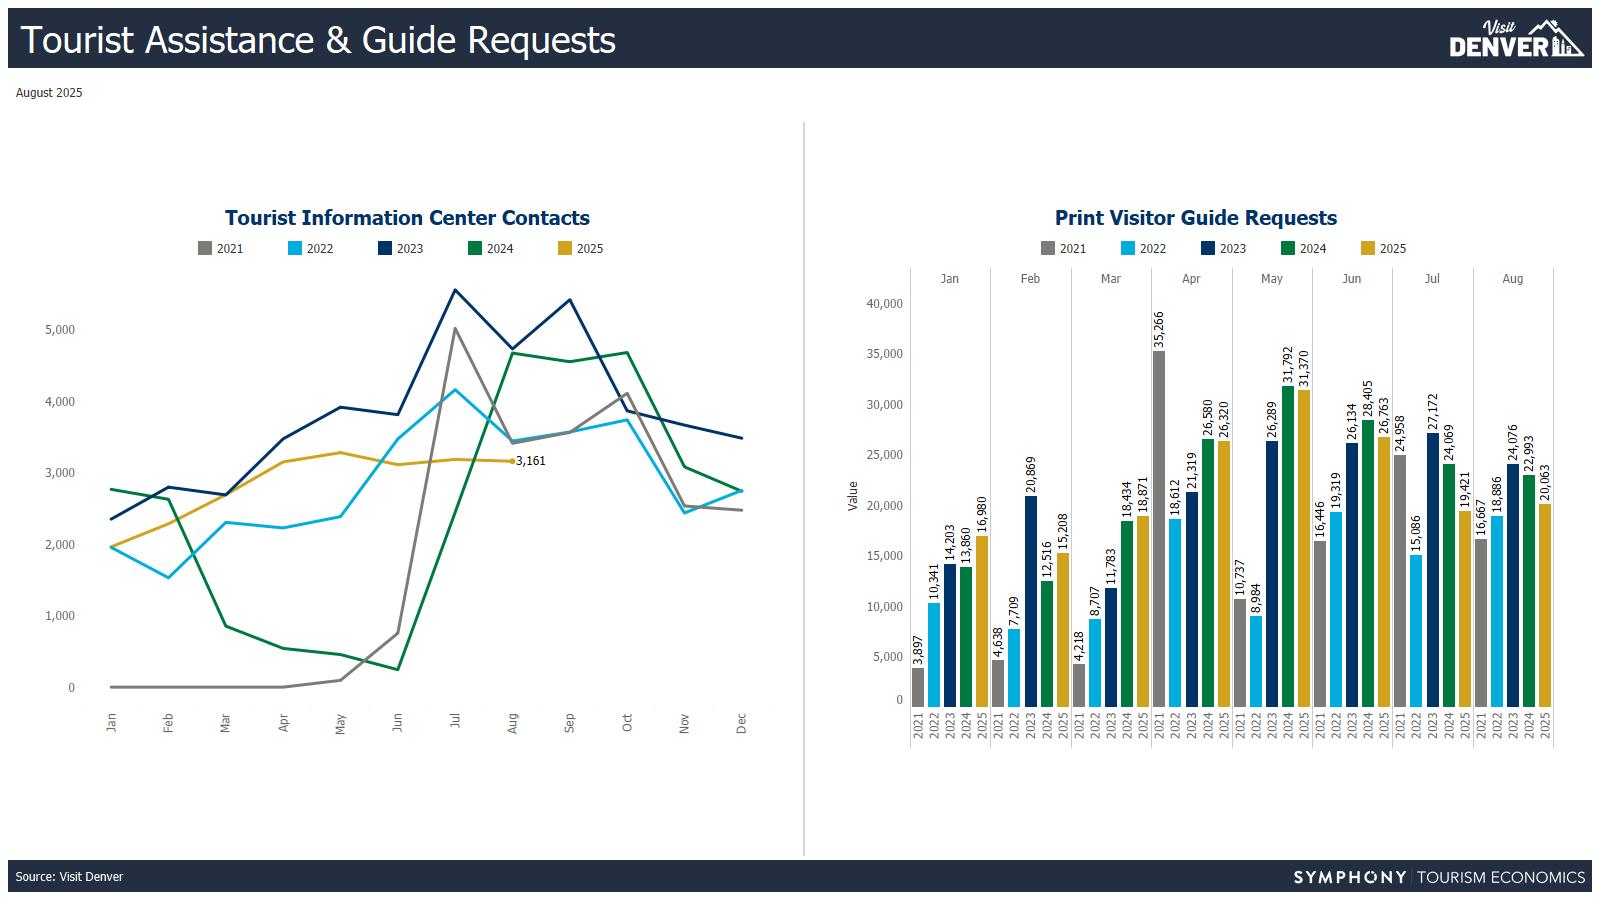
Tourist Assistance & Guide Requests Downtown and DEN tourist information centers have been closed since mid-March 2020.
Tourist Inquiry Touchpoints
Touchpoints are a rollup of visits to the four Tourist Information Centers, requests for the Official Visitors Guide, calls to the toll-free number and the aforementioned Interactive Impressions number.
D.4 Other digital information sources (e.g. chatbot, QR codes, etc.)
E. VISIT DENVER Customer Service Evaluation Survey Performance
EXHIBIT C REPORTING INDICATORS
Monthly Convention and tourism marketing report
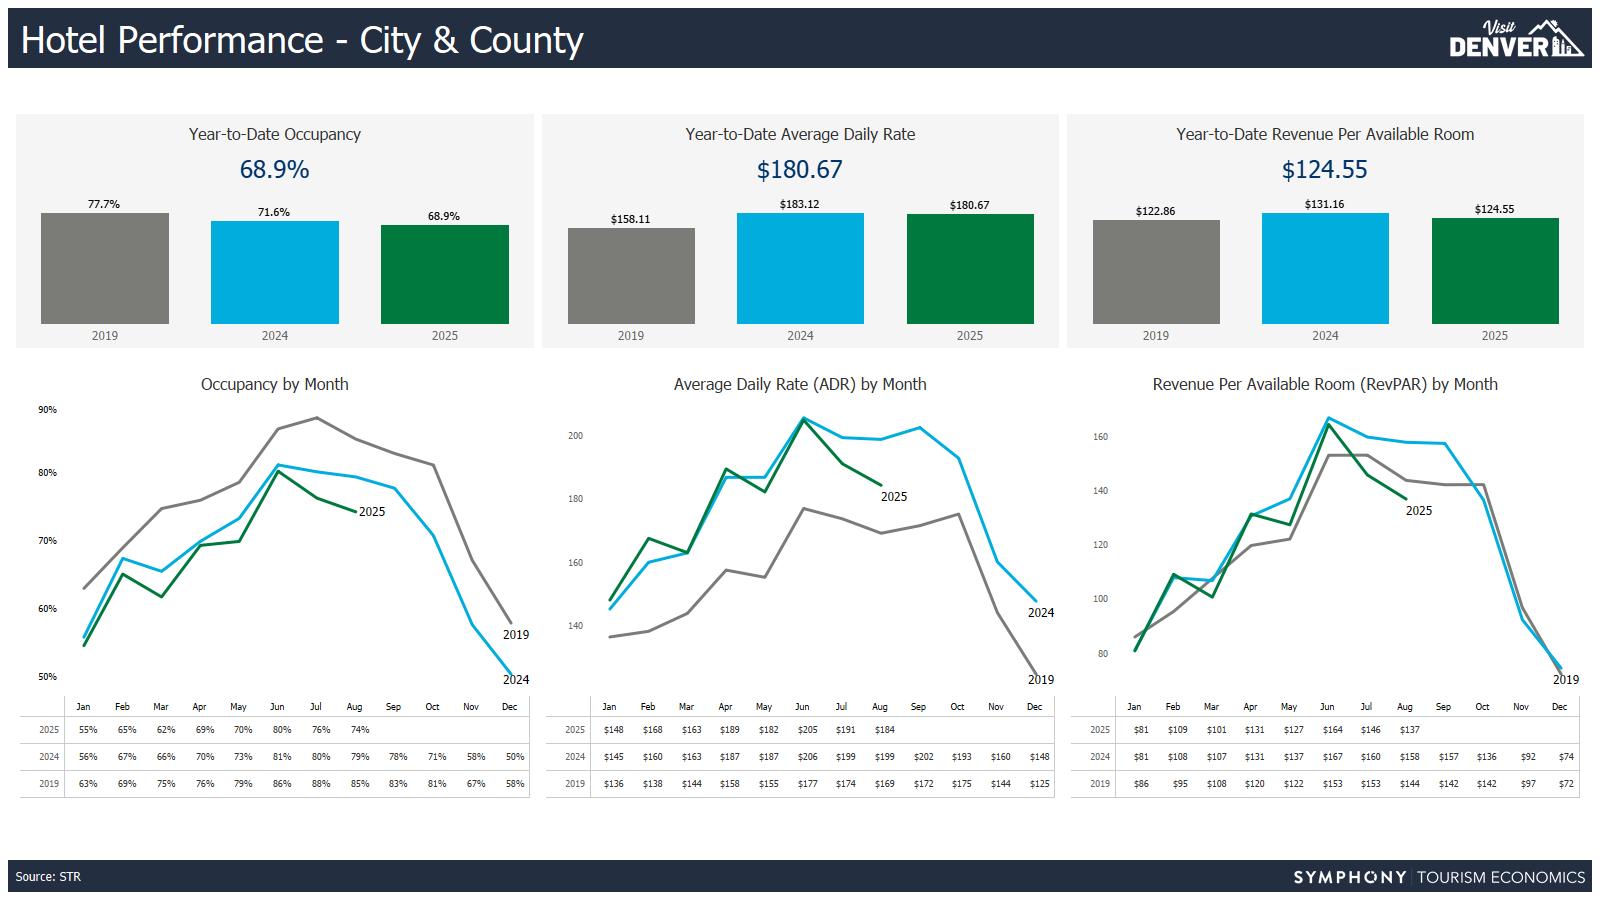
Denver City and County hotel occupancy, daily average rates and RevPAR data
VISIT DENVER Online/Interactive Traffic to City & County of Denver websites
Website Local Referrals
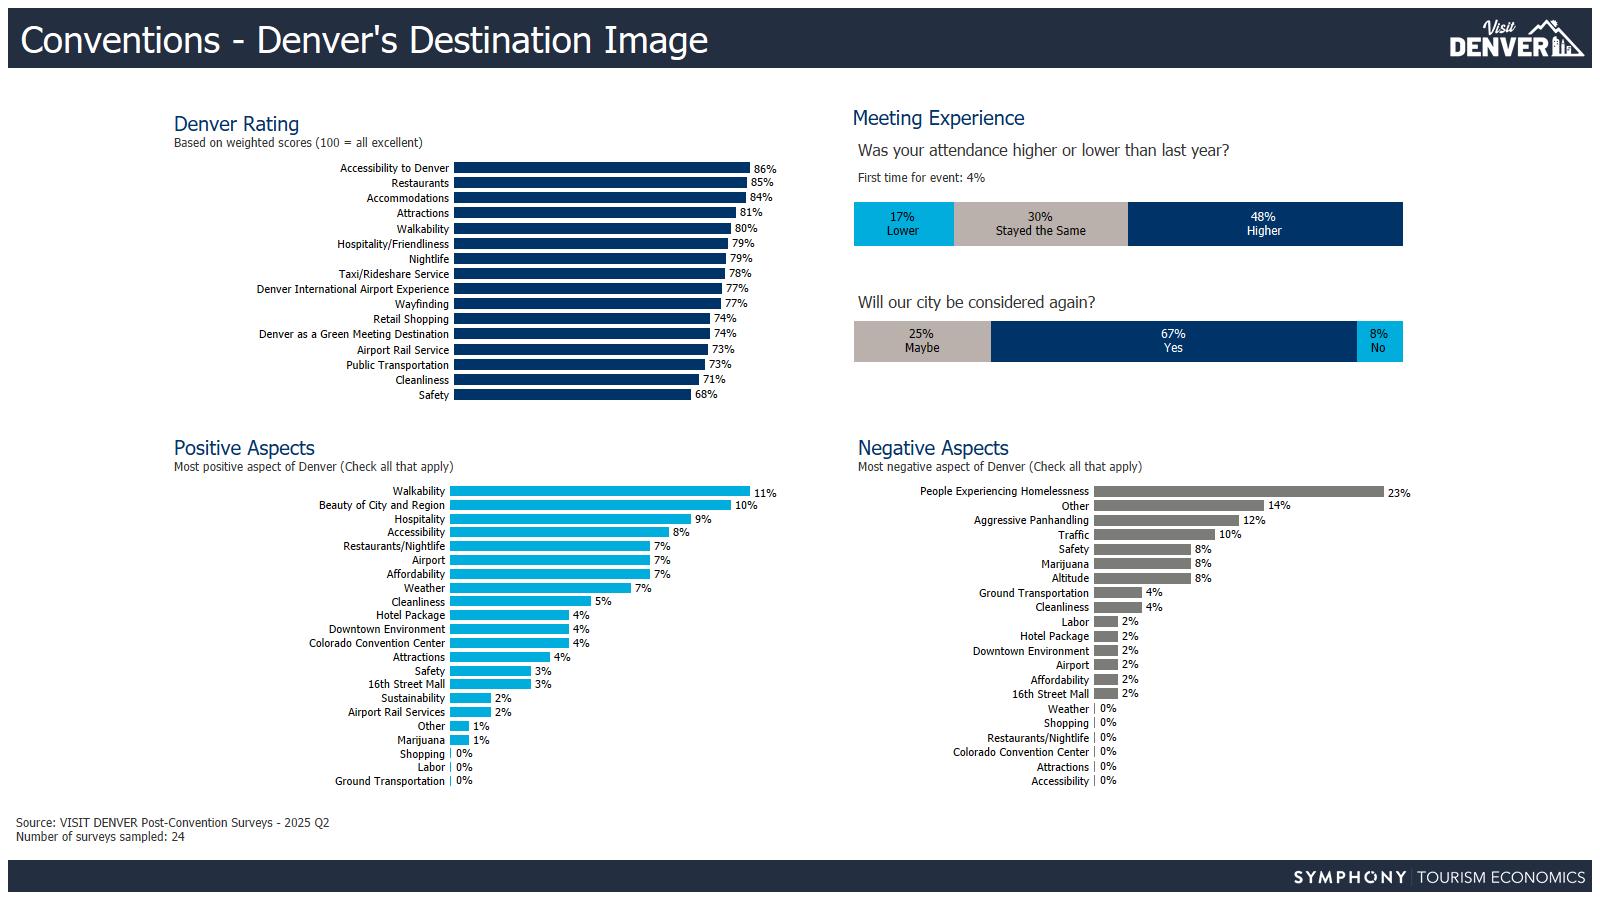
VISIT DENVER Post Convention Survey Results on Denver's image as a destination Conventions - Denver's Destination Image Source: VISIT DENVER Post-Convention Surveys - 20221st Quarter. Number of surveys sampled: 11. Five most visited Denver.org web pages
Quarterly Look ahead to upcoming meetings/conventions, including attendance and hotel room nights
Annually Convention Sales Conversion: Lead (Tentative} Bookings to Definite/Confirmed
Convention Sales Lost Business
Top Website Landing Pages
Conventions Summary
VISIT DENVER Post Convention Survey Results for Hotel and Center Performance Conventions- Customer Service Evaluations
Participation levels in VISIT DENVER events (e.g. Restaurant Week, Arts Week, etc.)
VISIT DENVER Tourist, Meeting Planners and Branding Research when commissioned
Advertising Return on Investment (ROI) research when commissioned
Domestic Leisure Visitors and Spending
International Leisure Visitors
Economic Impact Research including Job Development
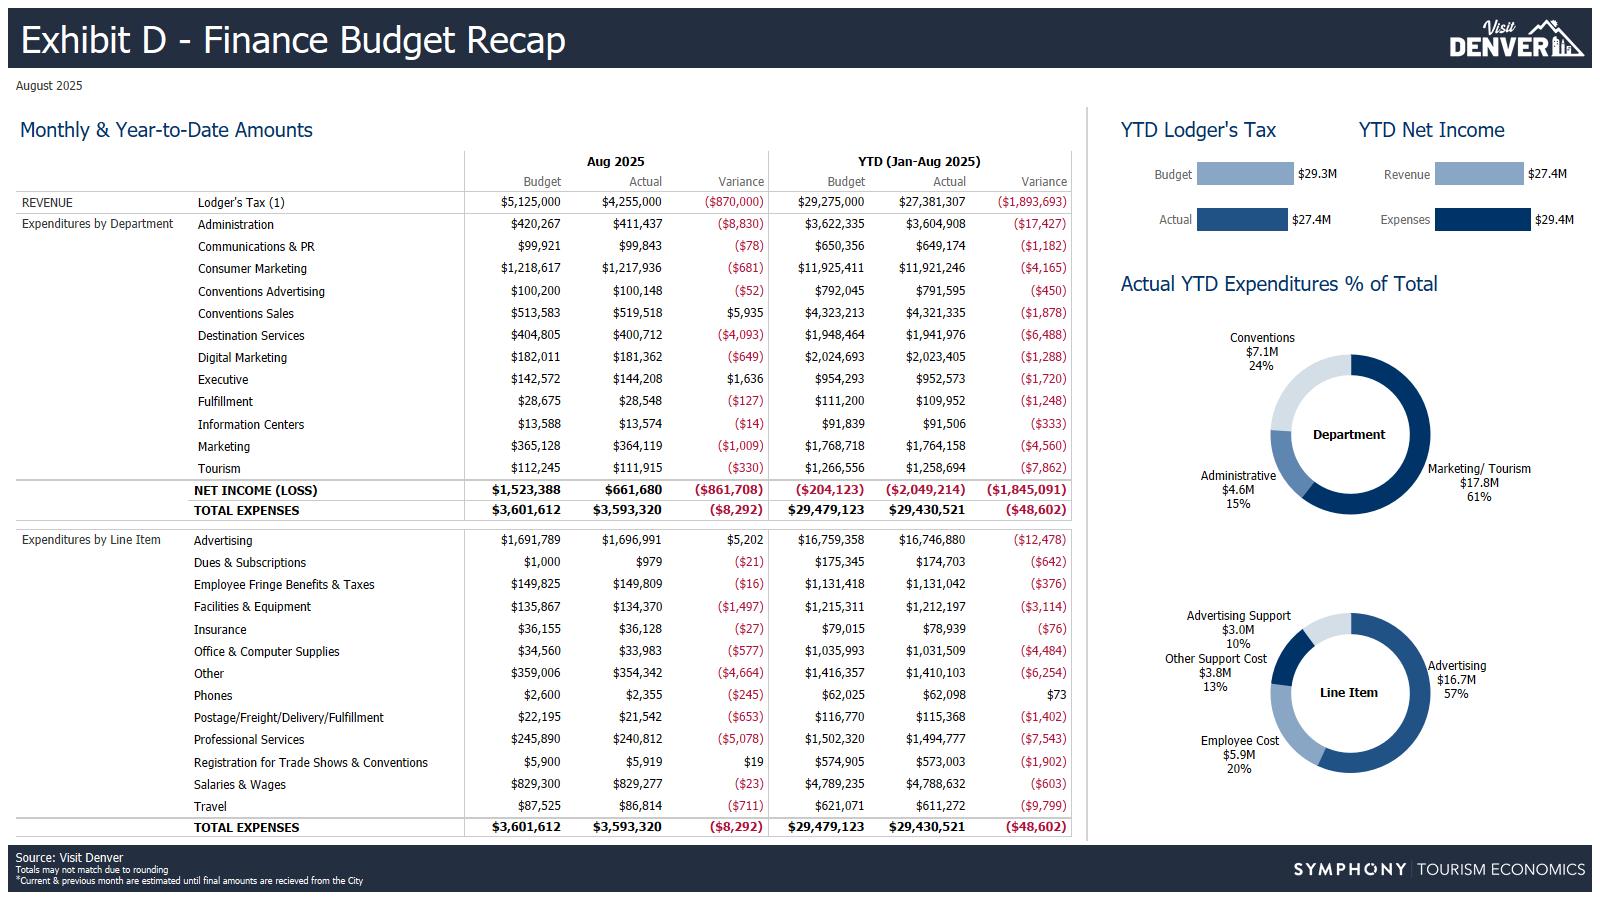
EXHIBIT D MONTHLY EXPEDITURE, FUNDING AND BUDGET
Conventions Summary