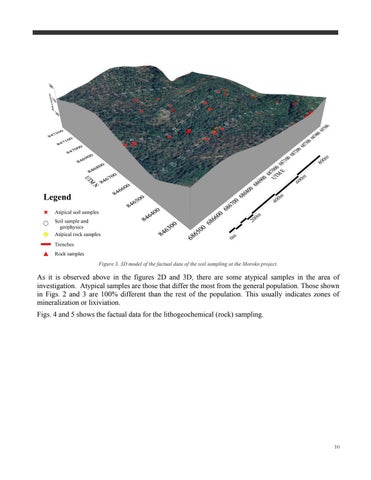
Figure 3. 3D model of the factual data of the soil sampling at the Moroko project.
As it is observed above in the figures 2D and 3D, there are some atypical samples in the area of investigation. Atypical samples are those that differ the most from the general population. Those shown in Figs. 2 and 3 are 100% different than the rest of the population. This usually indicates zones of mineralization or lixiviation. Figs. 4 and 5 shows the factual data for the lithogeochemical (rock) sampling.
10


