
2024 Showcase Exploring the Cutting-Edge Research of The University of Tulsa Ph.D. Students


Cyber

2024 Showcase Exploring the Cutting-Edge Research of The University of Tulsa Ph.D. Students
Cyber

The Cyber Fellows initiative brings together a diverse group of talented Ph.D. students from various programs, all united by their passions for pushing the boundaries of knowledge in their respective fields, cyber security research projects, and entrepreneurship. The exceptional academic papers authored by these dedicated scholars offer a glimpse into the depth and breadth of their research.
Each paper represents the culmination of months, if not years, of tireless effort, intellectual curiosity, and unwavering commitment to advancing their disciplines. These students have worked with their esteemed faculty advisors, whose guidance and expertise have been instrumental in shaping the direction and quality of their research.
From cutting-edge advancements in cybersecurity and artificial intelligence to groundbreaking insights in data science and network systems, the papers showcased here demonstrate the immense potential of these scholars. Their work contributes to the academic community and holds the promise of real-world applications that can transform industries and improve lives.
As you explore the abstracts and delve into the full papers, you will be struck by the originality of their ideas, the rigor of their methodologies, and the clarity of their presentations. Each paper is a testament to the power of academic inquiry and the importance of nurturing the next generation of researchers.
We invite you to join us in celebrating the achievements of these remarkable Cyber Fellows. Please take a moment to appreciate the dedication and brilliance that shines through in their work. We encourage you to engage with their research, ask questions, and share your thoughts. Who knows? You may discover the next groundbreaking idea and ignite a spark of inspiration to engage with a Cyber Fellow in the entrepreneurial spirit to help build their ideas into successful companies.
Let us embark on this exploration of knowledge and innovation. We hope you will find the papers as captivating and thought-provoking as we have. Thank you for being a part of this celebration of academic excellence.
Cameron Alred and Joshua Schultz
BRAT Research Group
Dept. of Mechanical Engineering, University of Tulsa
Traditional servomotors have served the field of robotics well for decades. They are powerful and precise, relatively affordable, and are well-understood. However, as the field of biomimetic and soft robotics advances, there has been increasing interest in actuators that mimic the impressive capabilities of vertebrate skeletal muscles. Muscles are appropriately sized to their role, they are robust against damage, and they are able to elastically store energy and even modulate their mechanical impedance. The first two of these benefits are directly owed to the fact that muscle tissue is composed of cells. The body contains the genetic information to produce several different types of muscle cell, and grows more or less cells as needed, whether for the tiny muscles in the face or the large, powerful muscles in the legs. Furthermore, when cells die or are damaged, the many other undamaged fibers of cells continue to function. Minor muscle damage does not lead to immobilization, only pain, soreness, and fatigue. Thus, in order to capture the full benefits of muscles, we may take inspiration from the cellular nature of muscle and construct actuators which are made of many discrete interconnected actuation units. Ueda et al. provide a good overview of this field in their 2017 book, in which they are referred to as cellular actuators. These discrete muscle-like actuators promise many of the inherent advantages of skeletal muscle. However, they are far from straightforward to model and control: the more units are connected together, the more complex and high-order the dynamical behavior of the overall actuator becomes. Thus, in order to make this type of actuator function, we must first solve this modeling and control challenge.
This challenge is multifaceted. There are numerous ways in which contractile actuation units can be connected together – they can be placed in series chains, parallel bundles, some combination thereof, and possibly cross-linked. For every new configuration of units, a new dynamic input-output response is produced. Thus, it is not sufficient to produce one plant model and develop a controller for it – a new control algorithm must be generated for a given number and connectivity arrangement of units, in addition to the control integration into the robot or system itself. Thus, the goal is not to develop a single controller, but a controller generator – a function that takes the dynamics of an actuation unit and the configuration of some number of them as input, and utilizes the calculated actuator dynamics to produce a controller as output. Also, for a given level of contraction, there are multiple possible distributions of contraction across the various actuation units.
The other aspect of developing discrete muscle-inspired actuators is the hardware itself. There have been several approaches to this studied – from pneumatic muscles to shape memory alloys. Each
offers its unique advantages and drawbacks. Our approach, first published by Mathijssen et al. in 2015, is to utilize binary solenoids as the primary contractile element. Solenoids possess the advantage of requiring less power to maintain their contracted state after contraction occurs; once the plunger has made magnetic contact with the back, they can drop to a lower “holding” current. They also respond nearly instantaneously and require only an electrical power source to operate, and lack the need for pneumatic compressors and valves (as air muscles do) or time to heat up and cool down (as SMAs do). The design considerations are instead the magnetic performance (how efficiently the electromagnet functions) and thermal performance (keeping the solenoids cool under load). Because they are either on or off, and aren’t inherently elastic, they must be combined in series with an elastic element (a spring), forming a “motor unit.” These motor units may be arranged in parallel with one another to allow quantized contraction level, achieved by energizing different numbers of solenoids. Thus, more force is developed at a given strain the more solenoids are energized because activating the solenoids changes the effective resting length of the elastic element. This design also has the potential for variable-impedance behavior - because the solenoid plungers transition from rigid attachment (coil energized) to a damping action (de-energized/sliding), the system behavior changes a function of the pattern of activation across the discrete units that comprise an actuator. This behavior will factor into the development of controllers, but it is not yet understood what impact this has on control, and how it could be exploited.
The goal of our research is to develop the field of discrete muscle-inspired actuators by modelling their behavior in a flexible way that is agnostic of configuration or number, to develop and test a smart controller generator, and to validate this modeling and control strategy on improved prototype hardware.
Cameron Alred is a lifelong Tulsa resident who received his BS in mechanical engineering from the University of Tulsa in 2020. He joined the first cohort of the TU Cyber Fellows program and began his PhD work that same year, and is currently pursuing his PhD in mechanical engineering. In 2021, he worked as a robotics intern with the US Army Corps of Engineers ERDC. His research surrounds muscleinspired actuators, and his interests include bio-inspired robotics and the biology of movement and sensation, as well as robotic prosthesis and augmentation.
Dr. Schultz has been the director of the Biological Robotics At Tulsa research group since 2013. His research interests are in all aspects of robot motion and control. This includes grasping and manipulation, legged locomotion, and actuators that are inspired by muscle physiology. He tends to approach problems in this area from the standpoint of how they are accomplished in the bodies of humans and animals.
Dr. Schultz received his Ph.D. from Georgia Institute of Technology in 2012 and was a postdoctoral researcher at Istituto Italiano di Tecnologia before joining The University of Tulsa.
Mathijssen, G., Schultz, J., Vanderborght, B., & Bicchi, A. (2015). A muscle-like recruitment actuator with modular redundant actuation units for soft robotics. Robotics and Autonomous Systems, 74, 40–50. https://doi.org/10.1016/j.robot.2015.06.010
Ueda, J., Schultz, J. A., & Asada, H. H. (2017). Cellular Actuators: Modularity and Variability in Muscleinspired Actuation. In Cellular Actuators: Modularity and Variability in Muscle-inspired Actuation. Elsevier Inc.


About Cameron
Professional Experience Preference
Working Location Preference
Internships / RA / TA / Work History


Jacob Regan and Dr. Mahdi Khodayar
Tandy School of Computer Science
The University of Tulsa
Seth Hastings
The University of Tulsa seth-hastings@utulsa.edu
Corey Bolger
The University of Tulsa corey-bolger@utulsa.edu
Abstract Authentication logs can be helpful to Security Operations Centers (SOCs), but they are often messy, reporting details more relevant to system configurations than user experiences and spreading information on a single authentication session across multiple entries. This paper presents a method for converting raw authentication logs into user-centered “event logs” that exclude non-interactive sessions and capture critical aspects of the authentication experience. This method is demonstrated using real data from a university spanning three semesters. Event construction is presented along with several examples to demonstrate the utility of event logs in the context of a SOC. Authentication success rates are shown to widely vary, with the bottom 5% of users failing more than one third of authentication events. A proactive SOC could utilize such data to assist struggling users. Event logs can also identify persistently locked out users. 2.5% of the population under study was locked out in a given week, indicating that interventions by SOC analysts to reinstate locked -out users could be manageable. A final application of event logs can identify problematic applications with above average authentication failure rates that spike periodically. It also identifies lapsed applications with no successful authentications, which account for over 50% of unique applications in our sample.
A Security Operations Center (SOC) serves as the “nerve center” of an organization’s cybersecurity efforts. It should receive inputs from multiple sources, be sensitive to stimuli that may signal danger, and present the organization with a comprehensive representation of its environment. The primary functions range from monitoring, assessing, and defending against cyber threats, to surveillance of networks, servers, applications
Philip Shumway
The University of Tulsa philip-shumway@utulsa.edu
Tyler Moore
The University of Tulsa tylermoore@utulsa.edu
and users. This enables the SOC to identify pain points, potential vulnerabilities, and areas for improvement.
As such, a SOC is heavily limited by the quality of its inputs, i.e., its data sources. Many tools are utilized to develop and leverage data sources, such as Security Information and Event Management (SIEM) systems, Intrusion Detection Systems (IDS), vulnerability management tools, and other analytical tools. These systems work together to enable SOCs to detect, investigate, and respond to issues at speed.
Workshop on SOC Operations and Construction (WOSOC) 2024
1 March 2024, San Diego, CA, USA ISBN 979-8-9894372-3-8 https://dx.doi.org/10.14722/wosoc.2024.23xxx www.ndsssymposium.org
One primary data source for SOCs is authentication logs. Controlling who uses a given service or application, and in what capacity, is key to both proper security and functionality. Many organizations have deployed single sign-on (SSO) services such as Microsoft Azure AD (now Azure Entra AD) to streamline their users’ authentication experience.
Currently, authentication logs are used to investigate user and application issues, as well as sources for systems that generate alerts of suspicious activities [13], [9]. For example, SOC analysts can identify potential account takeovers when logs indicate login attempts from an unexpected country or high frequency failures.
Increasingly, artificial intelligence (AI) and machine learning (ML) models are employed to flag anomalies, promising to reduce time to detection. However, Zhao et al [14] identify several limitations including difficulty dealing with complex abnormal log patterns, poor interpretability of alerts, and lack of domain knowledge.
Traditional monitoring involves engineers examining logs and writing keyword and regular expression based rules for detection. This method is growing more challenging as the number of components and variety of logs increases, resulting in noisy datasets that require extensive domain knowledge to interpret, with new and updated service components producing ever diversifying log messages. While AI and ML systems can offer sensitivity to abnormality, they struggle with interpretation: engineers might be alerted that a given state is anomalous, but it is unclear why something is an anomaly, and what a “normal” pattern would look like. Raw authentication logs are noisy. They have not been created with easy interpretability in mind. A single login attempt often generates dozens of log entries, each apparently disconnected from another. Wading through that mess, either manually or with an automated system, can be problematic.
In this paper, we describe a process to construct interpretable, user-centric “event logs” from raw authentication logs that reduce noise, eliminate redundant entries, and combine entries into discrete user experiences. This event-focused dataset can be implemented in several ways: as an input for an IDS that allows for more interpretable alerts, as a more straightforward dataset for investigation that lowers the bar for domain knowledge, and as a means of generating performance metrics that enable proactive identification of struggling users or applications.The paper is organized as follows. Section II reviews related work. Section III describes the method for distilling raw authentication logs into distinct events. Section IV explores examples of how event data can be leveraged. Finally, we conclude in Section V.
Prior work incorporating authentication logs falls into a few broad categories. First, a small group of usability research on multi-factor authentication (MFA), some of which has used authentication logs to measure adoption rates and basic counts of errors associated with MFA use[11] [3] [10]. The most relevant examples being from Reynolds et al., who tracked users through a 90 day MFA adoption period at a university. They introduced “recovery time”, defined as the time between a failed login attempt and the next successful login for a given user [12]. They also performed some basic data cleaning, including removing duplicate log entries and malformed logs. Note that they used an individual log row as the unit for analysis, and did not use aggregation of log entries.
Our next and larger body of work uses authentication logs to create metrics and derivatives to directly identify
insider threats and profile groups of users with similar behaviors. Recently, Sonneveld et al. published a study examining the non-intrusive security relevant information available to an SOC [13]. Through examining which resources users accessed, and when they were accessing them, they were able to identify each “ITAdmin” user. Using similar measures, they clustered users and tested deviation from cluster baselines as a potential indicator of insider threats. Carnegie Mellon’s synthetic “Insider Threat” data set was used to test their methodology. Using this data set, they correctly detected 80% of insider threats in the ITAdmin group [6]. Intuitively, having high cluster consistency is key to getting a consistent measure for deviation; however, when they applied the clustering methodology to realworld data, consistency was cut in half. They attribute this partially to the much higher granularity of the real world data compared to the synthetic data. For other work clustering users, see Garchery and Freeman [5] [4].
Third, there is similar research that focuses on indicators of compromise or impersonation rather than insider threats, again using authentication logs to derive relevant metrics and measures. Liu et al. [7] created a behavior-based model to detect compromise using only two features: consecutive failures and login time of day. Their low computation-cost probabilistic model showed a good true positive to false positive trade off with high accuracy and low false positive ratio. They used a realworld private dataset of 4 million logs, and state that it contains no authentication compromises. This paper is of particular interest to us due to the unique way they construct derivative authentication “events” as their unit of analysis, rather than using individual log entries as atomic units. The authors aggregated raw log rows into series of 0-n failures prior to a success; series that don’t result in success are discarded. The maximum gap between a failed log row and the following success is not stated. The resulting “events” do not include failures, and some “events” may span time periods longer than the user’s interaction. See Bian et al [2] for similar work using to identify lateral movement.
Finally, we note the work of Alahmadi [1], who surveyed SOC practitioners investigating analysts perspectives on security alerts. They report an excessive number of alerts experienced across organizations, which contributes to analyst fatigue and human error. This is exacerbated by the low interpretability of the alerts being generated. These findings, in combination with Zhao et al. [14] who found that log data was used in over 30% of incident diagnoses, with indicators that this portion would be larger if the logs had greater interpretability, suggest the potential benefit that could accompany more interpretable logs and alerts.
Using data obtained through the University of Tulsa IT department, and approved for analysis by the
Institutional Review Board (IRB), we developed a process to capture user authentication “events” from raw authentication logs. We define an event as:
The occurrences reflected in log data that are directly experienced by a user, beginning when an authentication to a particular application is initiated, and terminated upon the eventual success, or abandonment of the authentication attempt.
By filtering sign-in logs to events directly experienced by the user, we can construct event-based metrics of usage and performance while reducing noise and increasing interpretability. In this section we provide an overview of the process to translate authentication logs to events, followed by a description of each step, and concluded with a description of the resulting events.
Before we dive into details of the process, we first give a high level example in Figure 1. The steps are:
1) De-Identify: These logs are first stripped of four direct identifiers which are replaced by the “Participant ID” attribute1
2) Row Code: Each row is assigned one of 46 “Row Codes” which captures both the overall success or failure result and detail about the action performed. This row code is the backbone of the encoding system, and will be explained in greater detail in IIIC.
3) Reduce: Several helper attributes are added, such as “event number” to indicate which “event” a particular authentication entry is associated with. An attribute tracking if a password is entered is added by cross referencing an entry’s “RequestID” with its entry(s) in the “authDetails” files. These attributes are used in combination with the row code to produce the “interactive” attribute. Duplicates and known or suspected malicious entries are removed.
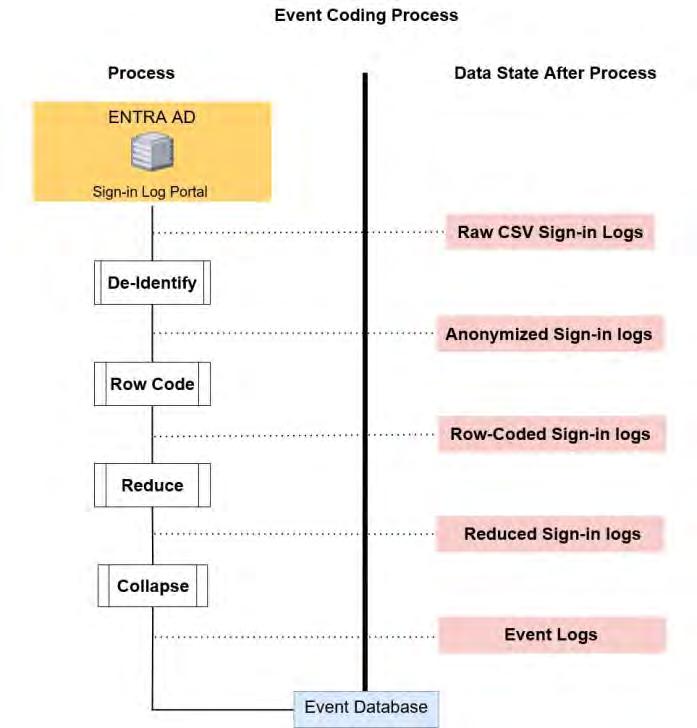
4) Collapse: Finally, we create a derivative data set by aggregating the key attributes from all rows for a given event, tracking the number and type of errors encountered, the form of MFA used, etc. This yields a smaller data set comprised of rows with 20 attributes, each row describing a complete authentication attempt to a particular application. The final set of attributes is easily adjusted based on the attributes available in the raw data.
The author’s university utilizes Microsoft Entra AD for authentication. Data is first collected through the Entra AD portal, which presents the sign-in logs broken down into six categories. The first four categories are interactive and noninteractive sign-in logs and their corresponding interactive and non-interactive “auth details” files. The final two categories are called “Application logs” and “MSISignins”; these refer to authentications by service principals, and authentications by an Azure Managed Identity, respectively. Interactive logs are defined by Microsoft as those sign-ins where “a user provides an authentication factor, such as a password, a response through an MFA app, a biometric factor, or a QR code”.
To investigate user experience, we ignore the application and managed identity logs, as they are not indicative of human interaction. Microsoft’s labeling of interactive and noninteractive may be helpful in some cases; however, it does not strictly adhere to the definition
1 This step is only necessary in a research context where the users remain anonymous to the researcher.
of interactivity we use in this paper. For example, we want visibility into the errors that occur prior to or following presentation of an authentication factor. Thus, both files and their associated authentication details are downloaded. A single log entry contains 44 attributes
TABLE I RAW AZURE AD SIGNIN LOG ATTRIBUTES
Category Attributes
Direct ID User, User ID, Username, Sign-in Identifier
Device Device ID, Operating System, Browser
Connection IP Address, Location, Latency
Connection IP (seen by resource)
Session Info Date (UTC), Application, Application ID
Session Info Resource, Resource ID, Resource Tenant ID
Session Info Home Tenant ID, Home Tenant Name, Request ID
Session Info Correlation ID, Cross Tenant Access Type
Session Info Incoming Token Type, Unique Token Identifier
Session Info Client app, Client Credential Type
Session Info Autonomous System Number, Token Issuer Type
Session Info Incoming Token Type, Token Issuer Name
User
Provenance User Type, Compliant, Managed, Join Type
Authentication Info Authentication Protocol, Conditional Access
Authentication
Result Info Status, Sign-in Error Code, Failure Reason
Result Info MFA Result, MFA Auth Method, MFA Auth Detail and describes a single system interaction. A small period of user interaction can generate several to dozens of log entries per minute, many of which may represent backend processes that users don’t directly experience within an authentication attempt. The process described below is implemented on Entra AD logs, but is designed to be generalize to other sources of authentication logs.
Table I summarizes the attributes, which we have split into 7 broad categories. Direct ID attributes identify the specific user, which are immediately removed and replaced with a unique user number. Device and Connection attributes detail the network connection and device characteristics. Session Info attributes comprise the bulk of the data, including the name and ID of the application and resource being used, token information, client application, and so on. Redundant attributes will be dropped in processing, such as alpha-numeric “ID” fields like “Resource ID”; as “Resource” is retained, which is the name of the Resource. The “Request ID” field is always retained, as it is the unique key linking a particular log item with other associated data in the Azure AD system. The User Provenance category includes information about a particular user’s account, such as their user type (member or guest) and join type (Azure AD Registered, Azure AD Joined, Hybrid Azure AD Joined). The smallest category is Authentication Info. Relevant attributes include “Authentication Requirement”, which indicates if the authentication requires single or multi-factor authentication, and “Conditional Access”, which indicates any conditional access policies that were applied and the result. Finally, the Result Info category includes details about the authentication attempt and result.
The “Status” attribute has one of three values: Failure, Interrupted, and Success. Note that many “Failure” results are not caused by improper user action, and “Interrupted” results often do not tangibly disturb the user experience. The “Sign-in error code” attribute contains a numerical error code when an error is present, which is true for any entry that is not labeled “Sucesss”. This error code is the key attribute used to assign
row codes for non-pass rows. The “Failure reason” attribute contains a description of the error code result when an error is present, and detailed descriptions of errors and remediation are available from Microsoft on their website [8]. There are three MFA-related fields: “MFA result” provides a text description of the authentication result; “MFA auth method” contains the type of MFA used when applicable, and “MFA auth detail”, which may contain a phone number associated with the MFA with the last two digits revealed. The last field is a Boolean “Flagged for review”, which is only true when an admin flags a user account.
Adding a row code enables us to distill the 44 attributes included in raw log instances to a minimal expression. Thus, a set of 46 row codes were created to capture critical information about an authentication attempt’s result. There are two broad results that a single entry can indicate: Pass (Success), or Fail, indicated by the attempt concluding in an entry marked “Failure” or “Interrupted” in the “Result” field of raw sign-in logs. A selection of row codes can be seen in Table II and Table III below.
Nine categories of logs were identified that indicate authentication has passed as seen in Table II. These 9 categories are variations of 3 basic results: Token Successes, Remembered Device Successes, and MFA Successes. Token Successes are split between single and multi-factor authentications, and all multi-factor authentications that are not token-related are either a primary form of MFA such as Text message, OATH, etc. or fulfilled through remembered device. Six row codes capture the various forms of MFA Successes, and two capture the remaining single factor successes.
The remaining row codes are used for entries that do not indicate an authentication pass, and we group these 36 row codes into 3 primary categories of errors: Interrupts, User Errors, and Configuration Errors.
Interrupts occur when the “Failure” (or Interruption) reported is not a true failure, it is a redirect or part of the intended authentication flow. In our user-centric paradigm, this means the user is not met with an error message, they do not experience a failure. One example is Row Code #9: Token Failure: it is not an error in the sense that the user or application had an issue; rather, it is an expected part of a token’s life-cycle. When this Token Failure error occurs, a user has entered their password and asserts a token that would otherwise satisfy the second factor requirement, but that token is invalid for one of many reasons. The user experiences this as being directed to their MFA prompt screen after inputting their password. This is a typical use case and not experienced as failure or extra delay. “Interrupts” do not detract from typical user experience.
The key difference between user and configuration errors is the agency of the user to resolve the error. Any error that was either directly caused by the user, or is within the user’s power to resolve, is considered a user error. 8 row codes are used for the user errors. For example, row code #27 indicates a user initiated a multifactor sign in but never provided the second factor, and row code #26 indicates a user input an incorrect password.
An additional 8 row codes are used for configuration errors, which includes transient errors. Row Code #18 is a good example, wherein a user tries to authenticate to an application, but is denied because their account has no associated role in the application. The error message presented indicates that an administrator must give the user access, it can not be dynamically requested, making this an error outside direct control of the user. Finally, we have codes that capture behavior identified by Azure AD as malicious, and a catchall for uncategorized errors. We now describe the process of creating these row codes, beginning with non-pass entries. Three of the co-authors, two with high domain knowledge and one with low domain knowledge, independently inspected log samples encompassing each unique “Sign-in Error Code” present in the dataset. Co-authors labeled each error code with one of four categories: Interrupt, User Error, Configuration Error, or Hacking Error. Each error was
considered alongside all available documentation and examples of the error appearing in the data. Krippendorff’s alpha was 0.73 considering all three raters, and 0.86 for the two raters with high domain knowledge. Majority opinion was sufficient for all but one of 127 unique error codes labeled, and each labeling was reviewed and confirmed by the authors. Labeled errors were then grouped into row codes by similar themes within each category of error. These processes yielded the final set of 36 error groupings, which were then given integer representations
TABLE IV EVENT LOG ATTRIBUTES
Attribute Category Comments
Direct ID User Participant ID
Device OS String
Device Browser String
Connection IP Address Alpha-numeric
Session Info Event# Int
Session Info Application String
Session Info Service String
Session Info ClientApp String
Session Info Start DateTime
Session Info End DateTime
Auth Info MFA Type String
Auth Info AuthReq. Single/Multi-Factor
Result Info Result Success/Failure
Result Info Detail Result Details
Result Info Password Entries Int
Result Info Elapsed Elapsed Time in Seconds
Result Info TA Time Away in Minutes
Result Info UEs User Errors Count
Result Info IEs Int. Errors Count
Result Info CEs Config Errors Count
Result Info Error Codes Int List of Errors beginning after the 10 “Pass” row codes. In total, 127 distinct sign-in error codes from the logs were mapped to 36 row codes. This is best explained using examples.
1) Row Code 11: There are 2 error codes that indicate MFA Completion is required. They redirect the user to use their second factor for the authentication, “Sign-in Error Code” 50074 and 50076.
2) Row Code 18: error codes 50105 and 50177 both describe a user who has not been granted specific access to an application, and is classified as a configuration error. This is distinct from a user who is dynamically requesting access to an application, which is classified as an interrupt, as it is an intended step in the authentication cycle, not the result of incorrect permissions or any failure.
There are four steps taken to reduce the authentication logs after row coding. Here, we note that the focus of this paper and the authors’ related research has been on measuring and characterizing legitimate use. As such, we discard known and suspected malicious authentication attempts when constructing events. First, we discard logs from non-standard user agents including POP and IMAP, and logs categorized as “Hacking Errors”, such as those with row code #34: “Blocked for Malicious IP”, as these attempts are unlikely to be from legitimate users
interacting with our applications. Second, we discard logs from authentication attempts made to “API” resources, which are not indicative of interactive user authentication, as these are authentications performed by some user-side application to access a third party resource. Third, we discard duplicate logs, defined as logs with identical attributes occurring within one second of each other. Finally, we also discard any logs whose row codes are not labeled as interactive, which is a subattribute of our row codes. These reductions ensure we have non-redundant data that focuses on legitimate, interactive user behaviors and experiences.
Returning to our definition, we define an event as:
The occurrences reflected in log data that are directly experienced by a user, beginning when an authentication to a particular application is initiated, and terminated upon the eventual success, or abandonment of the authentication attempt.
Each event captures the number of errors encountered before eventual success or failure, as well as the type of errors involved, time spent on an attempted authentication, and the type of authentication used. Since these characteristics are reflected in the row codes outlined above, tracking their occurrence in events is straightforward.
Events are constructed by aggregating rows with the same “Event Number”. This number is created by first sorting entries by user and datetime, and setting a boolean “New Event” to TRUE if the gap between the current entry and prior entry exceeds 90 seconds. A cumulative sum is run on the “New Event” attribute to assign an event number to each log. In an enterprise environment without SSO implementation, a second condition is introduced: the successful completion of an authentication. In our SSO environment, once an authentication succeeds, any subsequent authentications to related sites will be non-interactive and fulfilled by the token presented by the user, resulting in no authentication interaction.
By defining events in this manner, we are flexible enough to accommodate situations where the user initiates multiple applications simultaneously. For example, a user might first be prompted for MFA on their desktop Outlook client. If that fails, a user could authenticate using a web-based interface instead. For our purposes, this is treated as a single event when occurrin g in close temporal proximity, which is effective for our enterprise environment in which there are many different applications which can be satisfied by completing authentication in any one service. The resulting “event” provides a clear indication of overall success, the application used, MFA Type, time spent, count and
2 TA is similar to “recovery time” reported by [12], which captures the time between a failure and the next success.
classification of errors, and provides the error codes associated with the errors to enable user and population metrics.
“Events” are comprised of the 21 attributes listed in Table IV. The first attributes tell us who authenticated, the system they used to do so, and total time elapsed. We also retain authentication information (MFA type and whether one or two factors were required). The final 9 attributes capture relevant details about the authentication experience by aggregating the observed row codes for log entries in the event. Note that a user can experience one or more errors, from misconfigurations to failed passwords or MFA prompts, before ultimately succeeding in the authentication. Such impediments are reflected in the other fields, such as the “Password Entries” attribute that tracks the number of times the user input their password during the authentication event. The “Elapsed” attribute is calculated by the difference between the first and
V SAMPLE
last rows in a sequence that collapses into an event. Because there is no indicator in the raw sign-in logs when a Multifactor prompt is initiated, this measure captures the extra time spent due to errors and interruptions in the authentication process. Time Away (TA) measures the gap in time between a failed authentication event and the next attempted login 2 . The final attributes tally the number of User, Interrupt, and Configuration Errors experienced during the authentication event.
Table V illustrates the “event” log with example events. Event #3 shows a simple failure with a single “Configuration Error” (CE). A “Time Away” of 4 minutes is listed, indicating that 4 minutes elapsed before the next successful authentication, event #4. Event #4: App-based MFA was used to successfully sign into the Azure Portal on a Windows device after a single “User Error” (UE), an invalid password entry. The authentication process took 16 seconds after initiation, significantly longer than that observed by [10], which is likely a consequence of the failed password entry. Event #6 offers another example of a simple success with no errors that takes 0 seconds after initiation to complete. This zero second time reflects the complete lack of friction in the event, as we do not know when the user started to input their password, use MFA, etc; we only know when the user hit ENTER or otherwise
imitated the authentication. By breaking down authentication logs into discrete user-centric events, we can provided meaningful insight into the user experience and application health, as we demonstrate next.
For this section of the paper, we utilize a subset of collected data that centers around three semesters: Spring and Fall of 2022 and Spring of 2023. These slices include one week prior to the first day of class and end one week after the semester concludes; January 8th through May 17th for the spring semesters, and August 13th to December 19th for the Fall. After filtering for users that had at least one successful authentication, we are left with 1.7m events across 7,419 users, an average of 77 authentication events per user, per semester.
The examples discussed in this section demonstrate the utility of user-focused event aggregates and their derivatives. A proactive SOC may directly utilize some of these capabilities beyond the standard authentication log use cases of alert diagnosis and incident response. For example, the detection of lapsed applications discussed in section IV-C could be used to reduce threat surfaces by retiring unused applications. As we consider the utility of an event-based approach to authentication logs in a SOC, we begin by examining the basic unit of analysis, the event, before moving on to derivative measures. As we see in Table V, each event reports success or failure, the time elapsed, the form of MFA used, types of errors encountered, and application being authenticated to. The most straightforward measure then, is failure rate, the complement of success rate.
An intuitive way to examine failure rates is by error content: does error type impact the user experience differently? We anticipate that errors caused by users are both more common and more easily resolved; passwords can be re-entered, MFA can be properly completed, etc. We find that over 80% of users who encounter a configuration error will never succeed when they experience a configuration error, and 94% of events containing a configuration error end in failure. Conversely, we find that only 7% of users who encounter user errors will never succeed when they experience a user error, and only 56% of events with user errors conclude in failure. While configuration errors are clearly more difficult to resolve, they are also less common. 93% of users experience user errors, while only 27% of users experience configuration errors. This confirms our expectation that user errors are both more common and more easily resolved.
Examining the cumulative distribution function (CDF) plots in Figure 2, the majority of our 7,305 valid users experience a very low failure rate. Mean failure rate is 8%, with the 10% worst users failing over 20% of authentications, and the 10% best users fail only 0.4%. The failure rate increases substantially for our worst users
when we examine those who ever experience configuration errors, plotted here in red. The 10% best users fail only 1.5% of authentication events, whereas the 10% worst fail over 30% of authentications. The bottom 5% fail an astounding 47% of authentication attempts. We can take away a few lessons from these distributions for utilizing event data in a SOC. First, configuration errors may be worth investigating, as they reliably trigger failures through no fault of the user. Second, relatively few users fail frequently, and it may be beneficial to target efforts at assisting these struggling users.
Creating derivative metrics lends greater utility, such as the ability to identify locked-out users. An alert prompted by a lockout metric might trigger automated assistance, which in turn could forestall help tickets and issue early alerts for developer issues that cause service interruptions.
To construct this measure, we first add helper variables to our event dataset: we add a “consecutive failures” and “hours away” attribute to each event. Next, we set a variable “lockout” to true when consecutive failures is greater than one and time away exceeds twelve hours. Each week is summarized by the longest lockout experienced for each user.


Figure 3 shows the number of users locked out for each week of the semesters. The average number of users locked out for more than 12 hours, each week in the semester, was approximately 2.5% (152 of 6017) of the total. If we filter this for lockouts over 24 hours in duration, it shifts to 105 users per week, or 1.7% of our users.
Next we plot another set of CDFs, this time examining the duration of lockouts. As configuration errors affect failure rates more than user errors, we plot Figure 4 with a series of mixed errors in black, and a series with only configuration errors in red. Across three semester, we observe 8350 lockouts for 2656 unique users, which is 36% of our total user base. We note that nearly 93% of lockouts were associated with both user and configuration
errors, and the mean ratio of CEs to UEs for those lockouts was 3.7. Over 6% of lockouts only had configuration errors, and less than 1% only had user errors. Lockouts commonly persist beyond 12 hours, with a median lockout duration of 43 hours, and the 90th percentile being locked out for over 193 hours, or 8 days. Lockout times begin to diverge based on error composition after the 24 hour mark and are longer when caused by configuration errors.
Lockouts happen often enough to benefit from proactive investigation and resolution, but they are uncommon enough to not overwhelm analysts. Moreover, since lockouts can persist for a long time, steps to eliminate them sooner would bring substantial value.
Maintaining the security and performance of enterprise applications is a key function of a SOC. Applications that are unused and/or not associated with any successful authentications present a security risk; these applications are more likely to lapse into unsafe states, and misuse may be harder to detect. In our data, we observe 689 unique applications across three semesters, 348 of which never show a successful authentication. In our organization, over 50% of applications can be easily identified and classified as lapsed, and may be de-
Locked Out Users Per Week


3 We do not currently posses a master list of applications for our organization, and can only detect applications with at least one authentication
commissioned to increase security. 3 These lapsed applications may otherwise persist for long periods of time, as we observe in the bar chart 6, which shows the number of valid and invalid applications per semester.
The next utility is early identification of struggling applications. Using the most recent semester, SP23, we first filter out the lapsed applications with no record of successful authentications. This results in a median success rate of 95% percent, closely matching our median user success rate for that semester of 94%. The mean success rate per application is somewhat lower, at 76%, indicating that some of our highly used applications have lower success rates. Examining the 20 most used applications, which in our data incur an average of 140 unique users per week, we plot the per application success rate over time to observe struggling applications. We define a struggling application as an application experiencing a success rate 50% below its mean success rate across the semester. In Figure 5 we report the lagging top 20 applications per week in the SP22 semester.
As one might expect, the top applications usually perform well, but it is not uncommon for one or a few to be lag-
Application Counts by Semester


5. Lapsed and Active Applications per Period
Struggling Top 20 Applications

6. Lagging Top Applications per Week
ging. Taking a specific application as an example, Microsoft Teams had a fairly low mean success rate of 53% in the SP23 semester, compared to 78% in the SP22 semester. Our “Lagging” metric flags a per-day success rate of under 10% on the last day of week 9, pointing to acute issues with the application. The graph in Figure 7 shows the downward trend of weekly success rate and its impact on the success rate across all applications in the following weeks. Early identification of such issues is key in reducing the impact of lagging applications on an organization.
In this paper we described a process to distill raw authentication logs into more meaningful events, then applied that methodology to real-world data. The process utilized was designed to incorporate a level of domain knowledge to improve the utility of raw logs, but be broad enough to generalize to other sources of authentication logs. These examples are simple demonstrations of the type of utility the events provide, such as identifying struggling users and lapsed applications.
We contend that the event view developed for the analysis has the potential to improve SOC analysts’ performance by


Fig. 7. Success Rate of Microsoft Teams vs All Applications
providing a human readable summary of a user ’ s experience that collapses numerous otherwise difficult to read log entries. This enables cybersecurity teams to quickly assess the state of a user’s authentication and note changes in usage and performance patterns when investigating alerts. Finally, this new unit of analysis allows for the creation of event-based metrics that can better capture subtleties of authentication usage and performance. Future work is planned to develop and deploy an event-based dashboard in the university SOC. This will help to evaluate the measures and incorporate feedback from real-world usage.
This paper’s primary goal was to describe and demonstrate a methodology for constructing userfocused authentication event logs. We attempt to filter out entries that do not reflect user interaction, but some events are inevitably missed. There is ongoing work by coauthors to utilize this event data in a diary study tracking users’ authentication experiences. This should provide a valuable opportunity to validate the approach and examine if the events as constructed match the users’ perceived experience.
In future research, we could apply event-based authentication logs to user clustering in a system that detects malicious activity. It is possible that our eventbased log method would remove noise that may have contributed the lack of cluster consistency found by [13] in their 2023 study, and “tune” our tools to the input we’re most interested in. Our approach also introduced derivative measures that embed a baseline of domain knowledge, such as distinctions between user errors and configuration errors, which can help differentiate two behaviors or experiences that might otherwise appear similar.
The authors thank Sal Aurigemma and Bradley Brummel for their feedback and acknowledge support from Tulsa Innovation Labs via the Cyber Fellows Initiative.
[1] B. A. Alahmadi, L. Axon, and I. Martinovic, “99% false positives: A qualitative study of SOC analysts’ perspectives on security alarms,” in 31st USENIX Security Symposium (USENIX Security 22) . Boston, MA: USENIX Association, Aug. 2022, pp. 2783–2800. [Online]. Available: https://www.usenix.org/conference/ usenixsecurity22/presentation/alahmadi
[2] H. Bian, T. Bai, M. A. Salahuddin, N. Limam, A. A. Daya, and R. Boutaba, “Uncovering Lateral Movement Using Authentication Logs,” IEEE Transactions on Network and Service Management , vol. 18, no. 1, pp. 1049–1063, Mar. 2021, conference Name: IEEE Transactions on Network and Service Management.
[3] J. Colnago, S. Devlin, M. Oates, C. Swoopes, L. Bauer, L. Cranor, and N. Christin, “It’s not actually that horrible: Exploring adoption of twofactor authentication at a university,” 04 2018, pp. 1–11.
[4] D. Freeman, S. Jain, M. Duermuth, B. Biggio, and G. Giacinto, “Who Are You? A Statistical Approach to Measuring User Authenticity,” in
Proceedings 2016 Network and Distributed System Security Symposium San Diego, CA: Internet Society, 2016. [Online]. Available: https://www.ndss-symposium.org/wpcontent/uploads/2017/ 09/who-are-you-statistical-approachmeasuring-user-authenticity.pdf
[5] M. Garchery and M. Granitzer, “Identifying and Clustering Users for Unsupervised Intrusion Detection in Corporate Audit Sessions,” in 2019 IEEE International Conference on Cognitive Computing (ICCC). Milan, Italy: IEEE, Jul. 2019, pp. 19–27. [Online]. Available: https://ieeexplore.ieee.org/document/8816990/
[6] B. Lindauer, “Insider Threat Test Dataset,” 9 2020.
[Online]. Available: {{https://kilthub.cmu.edu/articles/dataset/Insider Threat Test Dataset/12841247}}
[7] M. Liu, V. Sachidananda, H. Peng, R. Patil, S. Muneeswaran, and M. Gurusamy, “Log-off: A novel behavior based authentication compromise detection approach,” in 2022 19th Annual International Conference on Privacy, Security Trust (PST), 2022, pp. 1–10.
[8] Microsoft. (2024) Error documentation. [Online]. Available: https: //login.microsoftonline.com/error
[9] G. Pannell and H. Ashman, “Anomaly Detection over User Profiles for Intrusion Detection,” Proceedings of the 8th Australian Information Security Mangement Conference, vol. Edith Cowan University, p. 30th November 2010, 2010, medium: PDF Publisher: Security Research Institute (SRI), Edith Cowan University. [Online]. Available: http://ro.ecu.edu.au/ism/94
[10] K. Reese, “Evaluating the usability of two-factor authentication,” 2018.
[11] K. Reese, T. Smith, J. Dutson, J. Armknecht, J. Cameron, and K. Seamons, “A usability study of five two-factor authentication methods,” in Proceedings of the Fifteenth USENIX Conference on Usable Privacy and Security, ser. SOUPS’19. USA: USENIX Association, 2019, p. 357–370.
[12] J. Reynolds, N. Samarin, J. D. Barnes, T. Judd, J. Mason, M. Bailey, and S. Egelman, “Empirical measurement of systemic 2fa usability,” in USENIX Security Symposium, 2020.
[13] J. J. Sonneveld, “Profiling users by access behaviour using data available to a security operations center,” Jan. 2023, publisher: University of Twente. [Online]. Available: https://essay.utwente.nl/94221/
[14] N. Zhao, H. Wang, Z. Li, X. Peng, G. Wang, Z. Pan, Y. Wu, Z. Feng, X. Wen, W. Zhang, K. Sui, and D. Pei, “An empirical investigation of practical log anomaly detection for online service systems,” Proceedings of the 29th ACM Joint Meeting on European Software Engineering Conference and Symposium on the Fo undations of Software Engineering, pp. 1404–1415, Aug. 2021, conference Name: ESEC/FSE ’21: 29th ACM Joint European Software Engineering Conference and Symposium on the Foundations of Software Engineering ISBN: 9781450385626 Place: Athens Greece Publisher: ACM. [Online]. Available: https://dl.acm.org/doi/10.1145/3468264.3473933
REGRESSION (C‐NPDR) FEATURE SELECTION FOR CORRELATION
PREDICTORS WITH APPLICATION TO A RESTING‐STATE FMRI
Student Author
Elizabeth Kresock (Computer Science PhD Candidate) Advisor
Dr. Brett McKinney
Additional Authors
Elizabeth Kresock1, Bryan Dawkins2, Henry Luttbeg1, Yijie (Jamie) Li1, Rayus Kuplicki3, B. A.McKinney1,4
1Tandy School of Computer Science, The University of Tulsa, Tulsa, OK 74104
2SomaLogic Operating Company, Boulder, CO 80301
3Laureate Institute for Brain Research, Tulsa, OK 74136
4Department of Mathematics, The University of Tulsa, Tulsa, OK 74104
Nearest-neighbor projected-distance regression (NPDR) is a metric-based machine learning feature selection algorithm that uses distances between samples and projected differences between variables to identify variables or features that may interact to affect the prediction of complex outcomes. Typical bioinformatics data consists of separate variables of interest like genes or proteins. Contrastingly, resting-state functional MRI (rs-fMRI) data is composed of time-series for a set of brain Regions of Interest (ROIs) for each subject. These within-brain time-series can be transformed into correlations between pairs of ROIs, and these pairs can be used as input variables of interest for feature selection. Straightforward feature selection would return the most significant pairs of ROIs; however, it would be beneficial to know the importance of individual ROIs. We extend NPDR to compute the importance of individual ROIs from correlation-based features. We present correlation-difference and centrality-based versions of NPDR. The centrality-based NPDR can be coupled with any centrality method and with importance scores other than NPDR, such as random forest importance. We develop a new simulation method using random network theory to generate artificial correlation data predictors with differences in correlation that affect class prediction. We compare feature selection methods based on detecting functional simulated ROIs, and we apply the new centrality NPDR approach to a restingstate fMRI study of major depressive disorder (MDD) and healthy controls. We determine that the brain regions that are the most interactive in MDD patients include the middle temporal gyrus, the inferior temporal gyrus, and the dorsal entorhinal cortex.


Figure 1: Illustration of resting-state fMRI data used for machine learning feature selection. Regions of interest (ROIs) are made up of groups of voxels within the brain. Three ROIs (a) are used for illustration (green, blue, and red cubes/voxels), but the number of ROIs is typically on the order of 200. Each voxel has an associated time series, which are averaged within ROIs to create the green, red and blue time series (b). From these time-series, pairwise ROI correlations are calculated and stored in a matrix for each subject (c). The upper triangle of each subject’s correlation matrix can be stretched into a sample vector, si, to form rows of a dataset (d), where the predictors (columns) are ROI-ROI correlations.

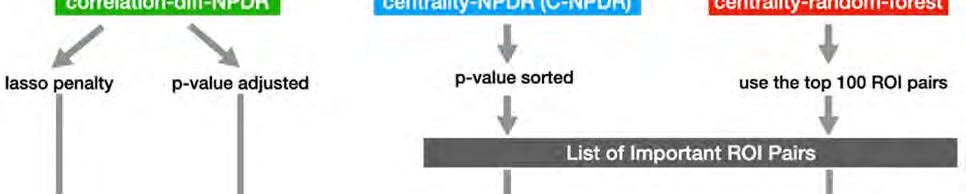
Figure 2: Analysis methods for rs-fMRI data with correlation-based features and a class variable. On the left, correlation-diff-NPDR (Eq. 2) can directly rank the importance of ROIs using P-values or penalized regression coefficients. On the right, centrality-NPDR (C-NPDR, Eq. 1) and centrality random forest (c-rf) rank the importance of pairs of ROIs, and then centralities of the resulting ROI-ROI networks are used to rank the importance of individual ROIs.


Figure 3: Brain diagrams that represent the anatomical location of some of the most significant individual ROIs yielded using the Brainnetome Atlas. From left to right we have ROI 84, ROI 95, and ROI 115. Located on the left hemisphere of the brain is ROI 84, the middle temporal gyrus, which is critical for semantic memory processing, visual perception, and language processing [17]. Also on the left hemisphere of the brain is ROI 95, the inferior temporal gyrus, which processes visual information in the field of vision and is involved with memory [18]. Located on the right hemisphere of the brain is ROI 115, the entorhinal cortex, which is involved in working memory, navigation, and the perception of time [19]. The image for the entorhinal cortex is a bisection of the brain to reveal where the entorhinal cortex appears in the right hemisphere.
Elizabeth is passionate about artificial intelligence and innovation! Elizabeth graduated from the University of San Diego with majors in Math and Computer Science. Now she is 1 of 37 Cyber Fellows (and one of only four women) that were selected for a full tuition scholarship and stipend to pursue a PhD in Computer Science at the University of Tulsa (TU). Elizabeth’s dissertation topic is machine learning (ML) algorithms that analyze which brain regions have increased activity in patients with major depressive disorder in comparison to healthy control patients. She is on track to finish her PhD in May 2024. Elizabeth is also 1 of 500 international students selected to be an Amazon AWS Machine Learning Scholar! This scholarship allowed her to complete Udacity certifications for AI Programming with Python and ML Fundamentals, which taught machine learning techniques, such as neural networks and image classification.
Elizabeth combines her computer science interests with her hobby of content creation. Through her YouTube channel “Liz Victoria”, she posts educational videos about artificial intelligence technology, advice for people interested in computer science, and her life as a PhD student. She has been able to monetize these platforms and form partnerships with businesses, and now she is working with mentors to develop her own entrepreneurial ideas. Elizabeth is the founder of “Pigment of Imagination”, a technological product that combines makeup and AI-generated art! She has gained insights into how to create products that solve problems, and she has practiced these skills by participating in business pitch competitions. Additionally, Elizabeth is the president of a student-run entrepreneurship club at TU called the JOLT Creativity Club!
About Dr. Brett McKinney
Brett McKinney, Ph.D., is a theoretical physicist and professor of computer science who specializes in the development of machine learning (ML) and AI algorithms for problems in the biomedical and physical sciences. He has made important contributions to methods that detect networks of interacting variables for accurate and interpretable ML models. He applies these explainable ML methods in close collaboration with researchers in neuroscience, immunology, geochemistry and astrobiology. He has also developed theoretical approaches to understand the foundations of quantum mechanics, such as the role of the dimensionality of space on many-body systems like Bose-Einstein condensates.
Dr. McKinney is a professor in the Tandy School of Computer Science with a joint appointment in the Department of Mathematics. He is a native Tulsan who did his undergraduate work summa cum laude in mathematics and physics at The University of Tulsa where he was a member of Phi Beta Kappa and the honors program. He did his graduate work at the University of Oklahoma, obtaining a Ph.D. in theoretical physics, followed by a postdoctoral fellowship in biomathematics and computational biology at the
Vanderbilt University Medical Center. Before joining TU, he was an assistant professor of genetics at the University of Alabama Birmingham School of Medicine.
[1]
M. P. Van Den Heuvel and H. E. Hulshoff Pol, “Exploring the brain network: A review on resting-state fMRI functional connectivity,” European Neuropsychopharmacology, vol. 20, no. 8, pp. 519–534, Aug. 2010, doi: 10.1016/j.euroneuro.2010.03.008.
[2]
R. Salvador, J. Suckling, M. R. Coleman, J. D. Pickard, D. Menon, and E. Bullmore, “Neurophysiological Architecture of Functional Magnetic Resonance Images of Human Brain,” Cerebral Cortex, vol. 15, no. 9, pp. 1332–1342, Sep. 2005, doi: 10.1093/cercor/bhi016.
[3]
A. Iraji et al., “The connectivity domain: Analyzing resting state fMRI data using feature-based data-driven and model-based methods,” NeuroImage, vol. 134, pp. 494–507, Jul. 2016, doi: 10.1016/j.neuroimage.2016.04.006.
[4]
M. G. Preti, T. A. Bolton, and D. Van De Ville, “The dynamic functional connectome: State-of-the-art and perspectives,” NeuroImage, vol. 160, pp. 41–54, Oct. 2017, doi: 10.1016/j.neuroimage.2016.12.061.
B. B. Biswal et al., “Toward discovery science of human brain function,” Proc. Natl. Acad. Sci. U.S.A., vol. 107, no. 10, pp. 4734–4739, Mar. 2010, doi: 10.1073/pnas.0911855107.
[5]
[6]
S. M. Smith et al., “Network modelling methods for FMRI,” NeuroImage, vol. 54, no. 2, pp. 875–891, Jan. 2011, doi: 10.1016/j.neuroimage.2010.08.063.
[7]
K. R. A. Van Dijk, M. R. Sabuncu, and R. L. Buckner, “The influence of head motion on intrinsic functional connectivity MRI,” NeuroImage, vol. 59, no. 1, pp. 431–438, Jan. 2012, doi: 10.1016/j.neuroimage.2011.07.044.
[8]
X.-N. Zuo and X.-X. Xing, “Test-retest reliabilities of resting-state FMRI measurements in human brain functional connectomics: A systems neuroscience perspective,” Neuroscience & Biobehavioral Reviews, vol. 45, pp. 100–118, Sep. 2014, doi: 10.1016/j.neubiorev.2014.05.009.
[9]
A. Fornito, A. Zalesky, and M. Breakspear, “Graph analysis of the human connectome: Promise, progress, and pitfalls,” NeuroImage, vol. 80, pp. 426–444, Oct. 2013, doi: 10.1016/j.neuroimage.2013.04.087.
[10]
L. Fan et al., “The Human Brainnetome Atlas: A New Brain Atlas Based on Connectional Architecture,” Cereb. Cortex, vol. 26, no. 8, pp. 3508–3526, Aug. 2016, doi: 10.1093/cercor/bhw157.
J. Zhuo, L. Fan, Y. Liu, Y. Zhang, C. Yu, and T. Jiang, “Connectivity Profiles Reveal a Transition Subarea in the Parahippocampal Region That Integrates the Anterior Temporal–Posterior Medial Systems,” J. Neurosci., vol. 36, no. 9, pp. 2782–2795, Mar. 2016, doi: 10.1523/JNEUROSCI.1975-15.2016. [12]
A. Al-Zubaidi, A. Mertins, M. Heldmann, K. Jauch-Chara, and T. F. Münte, “Machine Learning Based Classification of Resting-State fMRI Features Exemplified by Metabolic State (Hunger/Satiety),” Frontiers in Human Neuroscience, vol. 13, 2019, Accessed: Feb. 05, 2024. [Online]. Available: https://www.frontiersin.org/articles/10.3389/fnhum.2019.00164 [13]
J. D. Álvarez, J. A. Matias-Guiu, M. N. Cabrera-Martín, J. L. Risco-Martín, and J. L. Ayala, “An application of machine learning with feature selection to improve diagnosis and classification of neurodegenerative disorders,” BMC Bioinformatics, vol. 20, no. 1, p. 491, Oct. 2019, doi: 10.1186/s12859-019-3027-7.
[14]
C. Shi, J. Zhang, and X. Wu, “An fMRI Feature Selection Method Based on a Minimum Spanning Tree for Identifying Patients with Autism,” Symmetry, vol. 12, no. 12, p. 1995, Dec. 2020, doi: 10.3390/sym12121995
[15]
T. T. Le, B. A. Dawkins, and B. A. McKinney, “Nearest-neighbor Projected-Distance Regression (NPDR) for detecting network interactions with adjustments for multiple tests and confounding,” Bioinformatics, vol. 36, no. 9, pp. 2770–2777, May 2020, doi: 10.1093/bioinformatics/btaa024.
[16]
L. Breiman, “Random Forests,” Machine Learning, vol. 45, no. 1, pp. 5–32, 2001, doi: 10.1023/A:1010933404324.
[17]
D. Loh, “Middle temporal gyrus | Radiology Reference Article | Radiopaedia.org,” Radiopaedia. Accessed: Feb. 05, 2024. [Online]. Available: https://radiopaedia.org/articles/middle-temporal-gyrus
[18]
D. Loh, “Inferior temporal gyrus | Radiology Reference Article | Radiopaedia.org,” Radiopaedia. Accessed: Feb. 05, 2024. [Online]. Available: https://radiopaedia.org/articles/inferior-temporal-gyrus [19]
F. Gaillard, “Entorhinal cortex | Radiology Reference Article | Radiopaedia.org,” Radiopaedia. Accessed: Feb. 05, 2024. [Online]. Available: https://radiopaedia.org/articles/entorhinal-cortex
[20]
C. Ma et al., “Resting-State Functional Connectivity Bias of Middle Temporal Gyrus and Caudate with Altered Gray Matter Volume in Major Depression,” PLoS ONE, vol. 7, no. 9, p. e45263, Sep. 2012, doi: 10.1371/journal.pone.0045263.
[21]
T. Onitsuka et al., “Middle and Inferior Temporal Gyrus Gray Matter Volume Abnormalities in Chronic Schizophrenia: An MRI Study,” AJP, vol. 161, no. 9, pp. 1603–1611, Sep. 2004, doi: 10.1176/appi.ajp.161.9.1603.
[22]
I. B. Kim and S.-C. Park, “Neural Circuitry–Neurogenesis Coupling Model of Depression,” IJMS, vol. 22, no. 5, p. 2468, Feb. 2021, doi: 10.3390/ijms22052468.
[23]
Y. Du, Z. Fu, and V. D. Calhoun, “Classification and Prediction of Brain Disorders Using Functional Connectivity: Promising but Challenging,” Front Neurosci, vol. 12, p. 525, Aug. 2018, doi: 10.3389/fnins.2018.00525.
[24]
Y. Chen, W. Zhao, S. Yi, and J. Liu, “The diagnostic performance of machine learning based on resting-state functional magnetic resonance imaging data for major depressive disorders: a systematic review and metaanalysis,” Front Neurosci, vol. 17, p. 1174080, Sep. 2023, doi: 10.3389/fnins.2023.1174080.
[25]
V. D. Calhoun and N. de Lacy, “Ten Key Observations on the Analysis of Resting-state Functional MR Imaging Data Using Independent Component Analysis,” Neuroimaging clinics of North America, vol. 27, no. 4, p. 561, Nov. 2017, doi: 10.1016/j.nic.2017.06.012.
[26]
S. E. Joel, B. S. Caffo, P. C. van Zijl, and J. J. Pekar, “On the relationship between seed-based and ICA-based measures of functional connectivity,” Magn Reson Med, vol. 66, no. 3, pp. 644–657, Sep. 2011, doi: 10.1002/mrm.22818.
[27]
B. A. Dawkins, T. T. Le, and B. A. McKinney, “Theoretical properties of distance distributions and novel metrics for nearest-neighbor feature selection,” PLOS ONE, vol. 16, no. 2, p. e0246761, Feb. 2021, doi: 10.1371/journal.pone.0246761.
[28]
T. A. Victor et al., “Tulsa 1000: a naturalistic study protocol for multilevel assessment and outcome prediction in a large psychiatric sample,” BMJ Open, vol. 8, no. 1, p. e016620, Jan. 2018, doi: 10.1136/bmjopen-2017016620.
[29]
E. T. Rolls, C.-C. Huang, C.-P. Lin, J. Feng, and M. Joliot, “Automated anatomical labelling atlas 3,” NeuroImage, vol. 206, p. 116189, Feb. 2020, doi: 10.1016/j.neuroimage.2019.116189.
Jack Tilbury LinkedIn
Jack - Tilbury@utulsa.edu
JackTilbury Google Scholar
● Security P roduct Manager
● Security,Risk & Resilient Strategy Consulting
● Security An alystOperations
● Research S cientist
Working Location Preference
Tulsa Area, Florida, Chicago, Washington, Remote
Internships / RA / TA / Work History
Year Position
2022Present Doctoral Researcher
20202022 Product Manager
University of Tulsa
Flash Mobile Vending & The Delta, South Africa
2019 Assistant Lecturer and Teaching Assistant Rhodes University
2018 Software Implementation Analyst Saratoga, Cape Town
JackTilburyisasecond-yearPh.D.studentatTheUniversityofTulsa.Heobtained hisresearch-basedMCominInformationSystemsfromRhodesUniversity,South Africa,in2019.JackwasawardedafullscholarshiptopursuehisMaster'sdegree, whichexploredthePropTechindustry–conductingrealestatetransactionsthrough blockchaintechnology. HegraduatedatthetopofhisInformationSystemshonors classasheobtainedaBusinessScienceundergraduatedegree.Sincearrivingin Tulsa,JackhasattendedandpublishedattheAnnualSecurityConferenceandhas beeninvitedtopresentattheUNESCOSafetyConference.Hisresearchincludes informationsystems,behavioralinformationsecurity,andautomateddecisionaidsin securityoperationcenters.BeforestartinghisPh.D.research,Jackworkedasa ProductManagerintheITindustryattwosoftwaredevelopmentcompanies.
JackworkedfortwoyearsasaProductManagerwithexperienceinstart-upand corporateenvironments,buildingandlaunchingmultipleproductstomarket.Jackis eagertocontributetothedevelopmentofsecurityproductseitherthroughleading productteams,engagingwithproductcustomers,orconductingproductresearch.


Compliance Graph Analysis Techniques for Identifying Violation Correction Priorities and Schemes, Predicting Future Violations, and Determining Risk
Noah L. Schrick and Dissertation Committee:
Peter J. Hawrylak, Chair
Stephen Flowerday
John Hale
Brett A. McKinney
Mauricio Papa
Compliance graphs are graphical representations of a system or set of systems and their statuses and relationships toward compliance and regulation standings. These graphs are similar to attack graphs, and are directed, acyclic graphs generated through exhaustive means. Each change to a system or set of systems is performed individually, with all possible permutations fully examined and represented in the resulting graph. These graphs are useful tools to determin e if a system or set of systems is at risk of falling out of compliance, and illustrate any and all possible routes to a violation. Though visualization of these graphs and manual analysis can undercover useful information about necessary or desired changes to a system or set of systems, there is an abundance of additional information that can be uncovered with further, in-depth analysis tailored toward specific goals. This work presents analysis techniques for compliance graphs to identify violation correction priorities and schemes, predict future violations, and determine risk. These techniques were employed on compliance graphs generated in the automotive, healthcare, and energy sectors to highlight the versatility and robustness of these methods. The example graphs range in size and connectivity, and each graph examines its compliance standing with local, private, and federal regulations for its sector, each with varying degrees in severity and violation repercussion. The analysis techniques are adaptive and multifaceted, and are intended to function alongside a sector’s regulatory requirements, as well as any user-defined requirements.
Compliance graphs are an alternate form of attack graphs, utilized specifically for examining compliance and regulation statuses of systems. Like attack graphs, compliance graphs can be used to determine all ways that systems may fall out of compliance or violate regulations, or highlight the ways in which violations are already present. These graphs are notably useful for cyber-physical systems due to the increased need for compliance. As the authors of [1], [2], and [3] discuss, cyber-physical systems have seen greater usage, especially in areas such as critical infrastructure and Internet of Things. The challenge of cyber-physical systems lies not only in the dema nd for cybersecurity of these systems, but also the concern for safe, stable, and undamaged equipment. The industry in which these devices are used can lead to additional compliance guidelines that must be followed, increasing the complexity required for examining compliance statuses. Compliance graphs ar e promising tools that can aid in minimizing the overhead caused by these systems and the regulations they must follow.
Governance, Risk, and Compliance (GRC) Officers assist groups or organizations with preventing or mitigating incurred costs as a result of a violation of a mandate. With the wide array of mandates that organizations may need to follow regarding health or personally identifiable information (PII), specific
industry standards such as FinCEN [4], FDA QSR [5], NERC-CIP [6], internal standards, or equipment maintenance schedules to avoid voiding a warranty, it becomes increasingly difficult for GRC Officers to manage and track all mandate statuses. In addition, organizations rapidly and frequently bring changes into environments with new software, new equipment, new products, new contracts, or new processes. Each of these changes propagates additional change, all of which may affect the standing in regard to a compliance or regulation mandate. Rather than manual compliance checks, compliance graphs can be automatically generated, and analysis can be conducted on the resulting graph to aid in decision-making and visualization.
The semantics of compliance graphs are simila r to that of attack graphs, but with a few differences regarding the information at each state. While security and compliance statuses are related, the information that is analyzed in compliance graphs is focused less on certain security properties, but is expanded to also examine administrative policies and properties of systems. Since compliance and regulation is broad and can vary by industry and appl ication, the information to analyze can range from safety regulations, maintenance compliance, or any other regulatory compliance, including internal company standards. However, the graph structure of compliance graphs is identical to that of attack graphs, where edges represent a modification to the system, and nodes represent all current information in the system.
Compliance graphs begin with a root node that contains all the current information of the system or set of systems. From this initial root state, all assets in the system are examined to see if any single modification can be made, where a modification can include a change in system policy, security settings, or standing in relation to a compli ance or regulatory mandate. If a modification can be made, an edge is drawn from the previous state to a new state that includes all of the previous state’s information, but now reflects the change in the system. This edge is labeled to reflect which change was made to the system. This process is exhaustively repeated, where all system properties are examined, all modification options are fully enumerated, all permutations are examined, and all changes to a system are encoded into their own independent states, where these states are then individually analyzed through the process.
After a compliance graph has been generated and obtained, it is useful to analyze the graph to identify characteristics or planning procedures for the environment. Though visualization can help identify immediate concerns or simple solutions, in-depth analysis can uncover information about an environment that can suggest correction schemes, uncover hidden or hard-to-find problems, or give insight on planning for maintenance or mitigation of future violations. Analysis of graphs range in technique and results based on what information is desired. This work implements analysis techniques of compliance graphs tailored toward answering or addr essing the needs present in most environments. This work designs, implements, and examines the use of analysis techniques that are compatible across industries and can be used in various application settings.
The objectives of this work are to design and implement compliance graph analysis techniques for:
• Determining a numerical risk factor of a current environment given a compliance graph.
• Predicting trends and likelihoods of future violations for an environment given a compliance graph.
• Identifying violation correction priority in an environment given a compliance graph.
• Presenting violation correction schemes for an en vironment with known violations given a compliance graph.
• Presenting violation correction mitigation scheme s for an environment with expected or predicted future violations given a compliance graph.
[1] J. Hale, P. Hawrylak, and M. Papa, “Compliance Method for a Cyber-Physical System.” U.S. Patent Number 9,471,789, Oct. 18, 2016.
[2] N. Baloyi and P. Kotz´e, “Guidelines for Data Privacy Compliance: A Focus on Cyberphysical Systems and Internet of Things,” in SAICSIT ’19: Proceedings of the South African Institute of Computer Scientists and Information Technologists 2019, (Skukuza South Africa), Association for Computing Machinery, 2019.
[3] E. Allman, “Complying with Compliance: Blowing it off is not an option.,” ACM Queue, vol. 4, no. 7, 2006.
[4] “Financial Crimes Enforcement Network, Title 31 U.S.C. 310,” 2010. Available: https://www.govinfo.gov/content/pkg/USCODE-2010-title31/html/USCODE-2010-title31-subtitleIchap3-subchapI-sec310.htm.
[5] Food and Drug Administration, “Quality System Regulations,” 1996. Federal Register: Volume 61, Number 195. 1996 [Online]. Available: https://www.fda.gov/scienceresearch/clinical-trials-and-humansubject-protection/quality-system-regulations.
[6] Federal Energy Regulatory Commission, “Critical Infrastructure Protection Reliability Standard CIP,” 2020. 85 FR 8161. 2020 [Online]. Available: https://www.federalregister.gov/documents/2020/02/13/2020-02173/critical-infrastructure-protectionreliability-standard-cip-012-1-cyber-securitycommunications.
About Cameron
Professional Experience Preference
●
●
Working Location Preference
Internships / RA / TA / Work History

Timothy Flavin
The University of Tulsa Timmy-Flavin@utulsa.edu
Abstract – This abstract briefly summarizes a sequence of projects with the goal of Producing Machine learning models for real world scenarios where reliability and human compatibility dominate. The most recent project, a multi-agent coordination algorithm called MATCH [2], allows for teams of artificial agents to dynamically learn a meritocracy-based command structure that allows them to approximate the performance of the best agent in the group. This algorithm allows cooperative AI to ignore bad actors while deferring to more experienced teammates. Our ongoing project in collaboration with the TU AI/ML club, jokingly referred to as Ultron, is a penetration testing LLM which is aligned with a reinforcement signal of compute resources the AI can accumulate via bash scripting and access to common tools. Our earliest project in the sequence, ML Democracy [1] is a method to combine an arbitrary list of machine learning models into a bagged ensemble so that the failure modes of each individual model may be avoided through pruning while the most capable models vote on classification.
Index Terms – Ensemble Learning, Human-AI, LLM, Penetration Testing, Reinforcement Learning Introduction
Modern state of the art Machine Learning, (ML), methods have shown great potential in real world domains from adaptive anomaly detection to robotic control and route planning. Despite these advances, there remains an ongoing challenge of creating ML models which conform to norms and constraints of human society. Such norms include 1. quick adaptation to novel scenarios. 2. controllable, limited, and explainable failure modes. 3. Better Generalization 4. The ability to communicate and behave in a human compatible way. 5. The ability to adhere to non-negotiable constraints. Our recent work with MATCH focuses on 1, 2, and 4 by allowing agents to communicate on human-readable channels to learn relevant adaptations to human teammates within the timescale of a single cooperative task. We hope to expand MATCH with examples for analysis of reward hacking algorithms in the context of
Sandip Sen
The University of Tulsa Sandip-Sen@utulsa.edu
altruistic reward agents of widely varying competency. Our work on ML Democracy attempts to enhance areas 2 and 3 by creating an ensemble of diverse methods in such a way that the probability and intensity of failure is dampened by the averaging effect of ensemble methods while remaining somewhat interpretable with reported metrics for which families of models caused the failure.
Our ongoing project with the TU AI/ML club, “Ultron” is a departure from the goal of increasing the capabilities of AI in the real world. Instead, Ultron is planned as a penetration testing agent which should behave by its very nature as an artificial intelligence with goals that are misaligned with the norms in this introduction. Ultron will attempt to subvert the failure controls put into place in human designed systems while remaining undetected and minimally interpretable by human beings. We hope that the existence of such a model in open-source spaces along with a list of methods for preventing it from subverting human norms will provide a set of guardrails for similar AI created by bad actors in the future.
In summary, our projects focus on the goal of creating AI systems which naturally integrate into human institutions while finding ways to mitigate the fallout caused by maladapted AI or AI used for malicious purposes by building upon existing work in Multi Agent Communication [4], social learning [8], constrained reinforcement learning [9], and language model alignment [10,11]. We would like to extend our research in reinforcement learning to mechanism design and defending against reward hacking to create more robust models in addition to our existing work on human compatible RL.
Past and Ongoing Projects Overview
Our algorithm, MATCH, works on the problem of fully decentralized zero-shot coordination among teams of agents. In other words, scenarios such as volunteer search and rescue or first response where agents must learn to cooperate with each other when no agent has access to the other agent’s parameters or observations, and no agents have been allowed to train with each other in the past. In this scenario,
humans naturally choose leaders such as the ingame leaders present in zero shot online gaming or team captains in recreational sports. When the ingame leader begins to make poor calls or if their performance is poor, another leader often steps up if they believe themselves to be more competent. This creates a natural social behavior which allows more competent players to share their skills with others in a timely manner before the conclusion of a single game.
Our algorithm replicates this desirable trait of human organization by using two multi-armed bandits to model incoming and outgoing commands. When receiving commands from multiple teammates, an agent must select one to listen to and then evaluate its performance after having followed the command. If it was beneficial, the agent should listen to that teammate more often in the future and if not, then the agent should learn to ignore that commander. Conversely, if a listening agent ignores a commanding agent’s advice, then the commanding agent may not want to speak to that listener again. By modeling each of these problems as a multi armed bandit we achieve great sample efficiency in learning a command structure where the competency flows down from the best agents to the worst. Additionally, malicious agents are quickly ignored. In this way we further quick adaptation, limited failure modes, and human communication/compatibility.
We tested MATCH on several benchmark environments, including a grid world exploration task where four agents
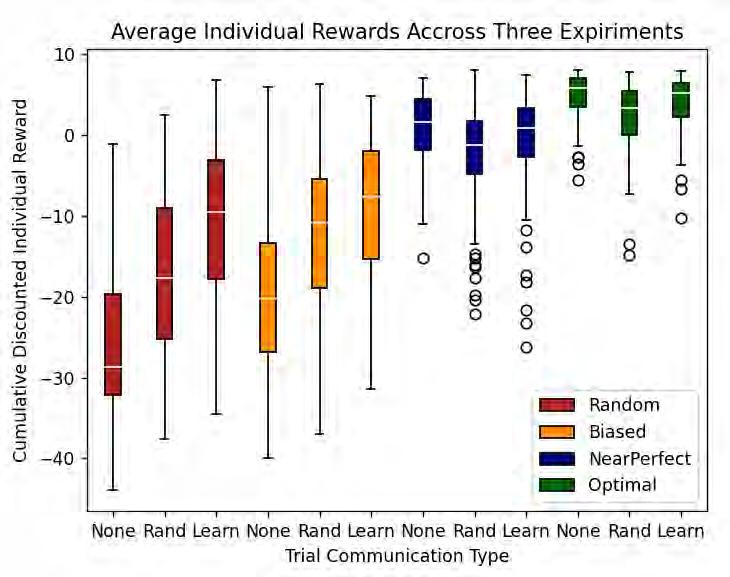
The ML Democracy project attempts to offer a general implementation for bagging ensemble methods. One successful and popular bagging technique is random forest. Random forest trains
several under parameterized decision trees as candidate learners and then allows them to vote on answers in order to generalize more effectively than a single large decision tree. The algorithm works by assuming some independence between candidate models where the best-case scenario would be complete independence. In the ideal case accuracy of N iid classifiers with accuracy p can be modeled by the summing the lower and upper halves of a binomial distribution given by ��������=������������������������ ∗ ���������������� (1−��������)��������−��������
The accuracy of the ensemble by number of members may then be visualized below:
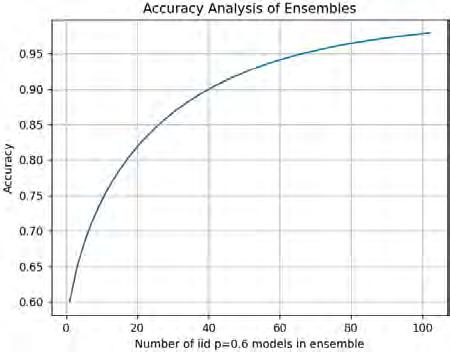
In the real world, models are trained from the same dataset or subsets of the same dataset, so their classifications will not be identically or independently distributed. Decision trees in Random Forest are popular because they have a high variance in training, and they are a universal function approximator, so they are highly independent in practice. We take a more general approach by allowing voting of any model in the ensemble. While this generates a lot of variances, it also leads to models that are largely more capable than others. In an ensemble of two where one model has 60% accuracy and the other has 90%, it is better not to vote. For this reason, models which perform one or more standard deviations below the average are removed, and votes are weighted by validation accuracy. With this scheme, ML Democracy’s worst case is that it selects a small group of standout models for it’s ensemble and so catastrophic failure is limited and rare.
ML Democracy was used successfully to predict motor imagery EEG data gathered by physio net [7] more effectively than a previously SOTA model, EEGNet [5] and a fusion EEGNet modification [6] without being an algorithm design specifically for signal processing. The results are shown on the next page.
481 N/A
0.7 91 N/A
Democracy 0.755 107 1
0.758 479 N/A
Democracy 0.775 47 1
ShallowConvNet 0.778 235 N/A
LDA 0.78 85 1 EEGNetI 0.781 443 N/A
1351 N/A
The current project in early stages in collaboration with members of the ML/AI club is to fine tune the Code Llama [3] LLM to write bash scripts for penetration testing. First, the LLM will be fine tuned on privilage escalation methods for poorly configured linux shells as well as attempts recorded in open source honeypot datasets. Next, the LLM will be given access to a remote terminal on a local network of raspberry pis which are poorly configured. The LLM will be aligned using reinforcement learning where the reward signal is given for an increase in privilages on a pi, or an increase in the number of pis successfully logged into. We want to track the AI’s current state on an attack graph generated for the local network in order to determine how much of the attack graph a language model can explore. Depending on the success or our model, we hope that it serves as a human-like attacker responding to terminal prompts and acting in real time with access to a list of known exploits and the ability to write custom scripts.
We beleve that the capabilities or LLMs to problem solve in this context is underexplored. Additionally, we hope to learn if our model will show different usage patterns than either humans or automated tools in such a way that could be studied to enrich or generate datasets for the future detection of intrusion attempts and anomolies. It will also be informative about whether guardrails will be necssary for current open source language models in order to prevent easier access to exploits among interested parties. We hope that the analysis of capabilities will allow for better external controls in addition to our other projects on internal failure modes.
[1] Flavin, Timothy, et al. ML Democracy: An Enhanced Voting Algorithm for Model Selection for Efficient EEG Data Assessment. 2022 21st IEEE International Conference on Machine Learning and Applications (ICMLA). IEEE, 2022..
[2] Flavin, Timothy, and Sandip Sen. A Bayesian Approach to Learning Command Hierarchies for Zero-Shot Multi-Agent Coordination. The Sixteenth Workshop on Adaptive and Learning Agents. 2024.
[3] Roziere, Baptiste, et al. Code llama: Open foundation models for code. arXiv preprint arXiv:2308.12950 (2023).
[4] Zhu, Changxi, Mehdi Dastani, and Shihan Wang. A survey of multi-agent reinforcement learning with communication arXiv preprint arXiv:2203.08975 (2022).
[5] Lawhern, Vernon J., et al. EEGNet: a compact convolutional neural network for EEG-based brain–computer interfaces Journal of neural engineering 15.5 (2018): 056013.
[6] Roots, Karel, Yar Muhammad, and Naveed Muhammad. Fusion convolutional neural network for cross-subject EEG motor imagery classification. Computers 9.3 (2020): 72.
[7] Goldberger, Ary L., et al. PhysioBank, PhysioToolkit, and PhysioNet: components of a new research resource for complex physiologic signals. circulation 101.23 (2000): e215-e220..
[8] Jaques, Natasha, et al. Social influence as intrinsic motivation for multi-agent deep reinforcement learning International conference on machine learning. PMLR, 2019..
[9] Garcıa, Javier, and Fernando Fernández. A comprehensive survey on safe reinforcement learning. Journal of Machine Learning Research 16.1 (2015): 1437-1480.
[10] Lee, Harrison, et al. "Rlaif: Scaling reinforcement learning from human feedback with ai feedback." arXiv preprint arXiv:2309.00267 (2023).
I. Sandip Sen
Sandip Sen is a professor in the Tandy School of Computer Science with primary research interests in artificial intelligence, intelligent agents, machine learning, and evolutionary computation. He advises the MASTERS research group with focuses in Human-AI Cooperation, Multi-Agent Systems, and Reinforcement Learning.

II. Tim Flavin
Tim Flavin is a current CS Ph.D. Student and Cyber Fellow at the University of Tulsa whose research focus is in Multi-Agent Reinforcement Learning, Signal Processing, and Human-AI cooperation. He is a part of the MASTERS research group.
[11] Liu, Yiheng, et al. Summary of chatgpt-related research and perspective towards the future of large language models Meta-Radiology (2023): 100017.

Alex Howe and Mauricio Papa
University of Tulsa
Tandy
School of Computer Science
This research focuses on the use of Machine Learning to create Anomaly-based Network Intrusion Detection Systems to help increase the security posture of Operational Technology (OT) networks. Critical infrastructure relies on the use of physical networks (often called SCADA networks or OT networks) to facilitate inter-device communication and remote monitoring and control. However, these networks often use legacy software and hardware and as a result suffer from a large number of vulnerabilities [1]. Due to the critical nature of these networks, it is often not feasible to shutdown operations and completely update/restructure the system. Thus, security tools which can be appended to the network, with minimal interference, have become a heavily researched area.
Network Intrusion Detection Systems (NIDS) are one popular solution, these tools monitor network activity and report any potential threat/malicious behavior. Signature-based NIDS are a commonly implemented tool which compares network traffic to a database of attack patterns, or signatures, to identify known malicious traffic. While effective, this method requires documentation of an attack in order to accurately identify it which can limit the scope of the NIDS, especially when it comes to novel attacks. These new attacks, or zero-day attacks, are becoming increasingly frequent and can potentially inflict disastrous damage (especially in critical infrastructures).
Anomaly-based systems are another variant of NIDS which builds a definition of normal operational behavior which is used to evaluate incoming network traffic [4]. Traffic instances which deviate significantly from this model can be flagged as malicious and sent to an operator for further review. By modeling normal behavior (instead of attack patterns), anomaly-based NIDS are capable of detecting any number of attacks as long as their behavior deviates from normal operational traffic. Creating an accurate and robust definition of what normal can be is difficult, especially in human-centric networks. Inaccurate models can result in a large amount of false positives which, in turn, can lead to alarm fatigue and distrust in security operators. However, OT networks consist of primarily machine-tomachine communication with well-defined polling behavior making anomaly-based NIDS a promising solution for detecting malicious traffic.
Machine learning is one of the most common methods for modeling normal network behavior due to its ability to handle large datasets and generalize on unseen data. This research is focused on evaluating
the performance of various machine learning fields for creating anomaly-based NIDS. Our work includes analyzing which characteristics of network traffic are the most important for modeling system behavior and evaluating different machine learning algorithms in order to identify promising solutions.
Transforming network traffic into usable datasets is the first, and potentially most important, step in applying machine learning algorithms. Manual feature engineering involves extracting defined features from network traffic packets (i.e. IP addresses, port numbers). One of our works involves the analysis of manual feature extraction, specifically we extract features from the packets and use an exhaustive algorithm to identify the performance impact of each feature in the feature space [2]. Several machine learning algorithms, both supervised and unsupervised, were evaluated providing a deep analysis of feature importance. We found that statistical-based features (i.e. average bytes per second, or average packets sent per second) were most successful for building accurate definitions of normal operational behavior. While effective, manual feature extraction can be tedious and requires domain expertise in both network security as well as machine learning. Additionally, extracting features from network traffic can result in a loss of spatial information (i.e. who regularly communicates with who).
Graph Neural Networks (GNNs) are a promising subfield of machine learning research focused on learning from graph-structured data. Many real-world applications are inherently graph-structured (i.e. social and computer networks) and applying graph learning approaches allows for effective spatial information. Network communication data is inherently graph-structured, traditional feature extraction methods can result in a loss of relationship related information, which can be vital for identifying more discrete attacks. Another area of our research is aimed at the use of GNNs for developing anomaly-based NIDS allowing for the retention of the original graph structure of the data leading to more accurate and realistic detection models [3].
Manual feature extraction can lead to accurate and high-performing models. However, generated features can be highly specific and unique to certain networks, greatly limiting the generalizability of the resulting model preventing any potential of transfer learning. Thus, another area of our research involves the evaluation of byte-based detection approaches. Rather than dissecting each packet into individual features, a byte-based approach simply analyzes each packet as a sequence of bytes. As network packet structures are rigorously defined, this approach can lead to highly generalizable models allowing for a detection system trained in one domain to be easily fine-tuned and applied to another. Byte-based detection models are much more feasible as organizations who do not have the resources to fully train new models can simply fine-tune pre-trained models to their network.
Alex Howe is a third-year Cyber Fellow and Ph.D. student at the Tandy School of Computer Science at the University of Tulsa. His undergraduate degree is in Computer Engineering through which he developed a
deep passion for robotics and software development. During his time with the University of Tulsa, Alex gained an appreciation for cybersecurity and machine learning leading him to pursue his current research topic. He has worked in multiple funded research projects helping to facilitate efforts for improving the security posture of OT networks. His other research interests include robotic systems, primarily in computer vision and swarm robotics.
Mauricio Papa is the Brock Associate Professor for The Tandy School of Computer Science and the School of Cyber Studies at The University of Tulsa.
His primary research area is critical infrastructure protection and operational technology (OT) security, areas in which he has helped design process control testbeds to support cybersecurity efforts. He has participated in funded research efforts (DARPA, DoD, DoJ, NSF, DoE and private industry) to develop cybersecurity solutions for the electric power sector, transportation sector, nuclear reactors and oil & gas sectors.
For the electric power sector, in a project funded through DARPA, Dr. Papa served as the lead researcher tasked with designing, building and deploying a critical infrastructure protection (CIP) lab. In the transportation sector, with funding from the Department of Justice and the NSF, he worked on projects involving heavy vehicles and forensic tools for use in crash reconstruction.
In a multi-institution project (The University of Tulsa, Washington State University and Pacific Northwest National Laboratory) funded by the Department of Energy, he participated in a project to simulate and explore solutions to secure control systems used in nuclear research reactors (NRRs).
He has also conducted research on predictive analytics and IoT to help secure and reduce maintenance costs in the oil and gas industry.
References:
[1] Cai, Ning, Jidong Wang, and Xinghuo Yu. "SCADA system security: Complexity, history and new developments." 2008 6th IEEE International Conference on Industrial Informatics. IEEE, 2008.
[2] Howe, Alex, and Mauricio Papa. "Feature engineering in machine learning-based intrusion detection systems for ot networks." 2023 IEEE International Conference on Smart Computing (SMARTCOMP). IEEE, 2023.
[3] A. Howe, D. Peasley and M. Papa, "Graph Autoencoders for Detecting Anomalous Intrusions in OT Networks Through Dynamic Link Detection," 2024 IEEE 21st Consumer Communications & Networking Conference (CCNC), Las Vegas, NV, USA, 2024
[4] Scarfone, Karen, and Peter Mell. "Guide to intrusion detection and prevention systems (idps)." NIST special publication 800.2007 (2007): 94.
Jack Tilbury LinkedIn
Jack - Tilbury@utulsa.edu
JackTilbury Google Scholar

JackTilburyisasecond-yearPh.D.studentatTheUniversityofTulsa.Heobtained hisresearch-basedMCominInformationSystemsfromRhodesUniversity,South Africa,in2019.JackwasawardedafullscholarshiptopursuehisMaster'sdegree, whichexploredthePropTechindustry–conductingrealestatetransactionsthrough blockchaintechnology. HegraduatedatthetopofhisInformationSystemshonors classasheobtainedaBusinessScienceundergraduatedegree.Sincearrivingin Tulsa,JackhasattendedandpublishedattheAnnualSecurityConferenceandhas beeninvitedtopresentattheUNESCOSafetyConference.Hisresearchincludes informationsystems,behavioralinformationsecurity,andautomateddecisionaidsin securityoperationcenters.BeforestartinghisPh.D.research,Jackworkedasa ProductManagerintheITindustryattwosoftwaredevelopmentcompanies.
● Security P roduct Manager
● Security,Risk & Resilient Strategy Consulting
● Security An alystOperations
● Research S cientist
Working Location Preference
Tulsa Area, Florida, Chicago, Washington, Remote
Internships / RA / TA / Work History
Year Position
2022Present Doctoral Researcher
20202022 Product Manager
Employer
University of Tulsa
Flash Mobile Vending & The Delta, South Africa
2019 Assistant Lecturer and Teaching Assistant Rhodes University
2018 Software Implementation Analyst Saratoga, Cape Town
JackworkedfortwoyearsasaProductManagerwithexperienceinstart-upand corporateenvironments,buildingandlaunchingmultipleproductstomarket.Jackis eagertocontributetothedevelopmentofsecurityproductseitherthroughleading productteams,engagingwithproductcustomers,orconductingproductresearch.


Abstract
Jacob Regan and Dr. Mahdi Khodayar
Tandy
School of Computer Science
The University of Tulsa
Remote sensing (RS) scene classification (RSSC) has broad applications across many fields ranging from city planning to disaster assessment [1] The goal of RSSC is to match an aerial image to a particular scene label based on its contents. Although the RSSC problem is closely related to natural image classification, there are some challenges specific to the remote sensing domain [1]. Firstly, RS images often consist of multiple ground objects that are collectively relevant for classification; for example, a golf course scene image may contain grass, water, trees, and sand traps. The challenge is that images belonging to other categories often share objects: images belonging to the riverbank or beach category are likely to contain sand, water, grass, and trees just like the golf course image. Consequently, classifying RS scene images requires distinguishing images that may share many of the same ground objects (grass, water, roads) but different semantic labels as well as matching scenes that are the same class but have significantly different object distribution and spatial layouts [2] Secondly, the same ground objects can vary significantly in both appearance and scale across images of the same class. Thirdly, many aerial scene images contain ground objects that are not relevant to its semantic label, but that may be relevant to recognition of another class. The impact of these issues is that RS aerial images tend to have large interclass similarity as well as large intraclass diversity, which makes solving the RSSC problem difficult.
With sufficient training data, deep learning (DL) models can achieve high performance. In practice, however, the sheer volume and diversity of RS data and the high cost of having RS experts manually labelling the data limits the performance of deep learning models especially for labelling novel classes [3]. To address the problem of insufficient annotated data, researchers have explored few-shot learning (FSL) which aims to train a model to generalize well to new, unseen categories using only a few labeled examples of each class. In FSL, a deep network is trained to quickly extract meaningful semantics from unseen classes using only a small amount of labeled samples for those new classes. Meta-learning, a widely adopted FSL method for RSSC, formulates a “learning-to-learn” training paradigm [4]. Instead of training a model on a single classification task, meta-learning trains a model on many small classification tasks so that it learns how to solve classification rather than how to classify a specific set of categories. For remote sensing classification, researchers have developed many few-shot RSSC (FS-RSSC) methods, with the most widely adopted being a meta-metric learning framework [3]. In meta-metric learning for FS-RSSC, the samples in a RSSC dataset are split by class into a training, validation, and testing set with nonoverlapping label spaces. During each training episode, an �������� -way �������� -shot meta-task is sampled from the training set which contains �������� classes and �������� labeled examples of each class. Generally, �������� is set to a small number such as 1 or 5. The labeled examples comprise the support set, and then the challenge is to correctly match each unlabeled image in a query set to the correct category using only the limited support sample. Metric-learning facilitates this goal by directing the DL model to learn a feature space suitable for clustering samples, and then a metric is adopted to measure the similarity between a query’s features and each support class’ features. The query is then classified as the category that yielded the highest similarity score.
In this framework, the performance is heavily dependent on the quality of the embedding space learned by the DL model [5] as well as the metric used to measure similarity. Most FS-RSSC methods leverage a convolutional neural network (CNN) for feature extraction, as CNNs are excellent at extracting local spatial features for visual processing. However, they struggle to extract long-range relationships in
images, which is particularly relevant for RS scene images, where the relationship between objects are important to distinguishing a class. Vision Transformers (ViT) can address this drawback using attention mechanisms but require more training data compared to CNNs [6]. More recently, researchers have developed graph neural network (GNN) architectures [7], [8], [9] based on Vision GNN (ViG) [10] that can capture long-range relationships between objects in scene images using graph convolutional operations. For metric learning, the similarity function can either be a defined distance function such as the Euclidean distance, or a deep learning network can be trained to compute the similarity, as in relation networks [11].
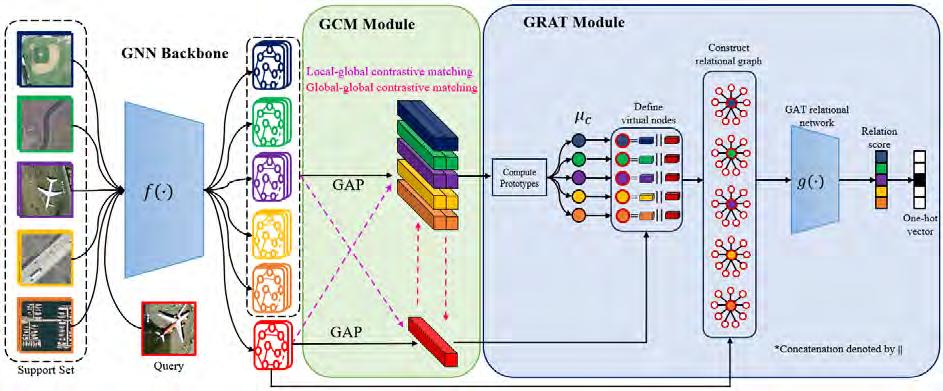
In this project, we develop a FSL framework for FS-RSSC that integrates deep graph learning into both the representational learning and similarity learning components of meta-metric learning. The overall framework is shown in Figure 1. Different from most other approaches, we leverage a GNN-based feature backbone, pyramid ViG, to learn high-level graph embeddings that capture both long-range dependencies within the scene and which incorporate multi-scale context. Instead of pooling the highlevel node embeddings into a single global graph vector for metric learning, we design a Graph Contrastive Matching (GCM) module consisting of a dual local-global and global-global graph contrastive objective and integrate it into the meta-learning framework. For each sample, the feature encoder produces a graph consisting of high-level node embeddings for which a global pooling operation is applied to obtain a global vector representation of the graph. We define local-global graph contrastive learning (GCL) between pairs of samples where the aim is to train the model to maximize the agreement between high-level nodes of one image with the global embedding of a same-class sample, thereby improving the long-range dependencies extracted by the extractor. To further improve the robustness of the backbone and stabilize the global embeddings, the global-global GCL loss is designed to explicitly maximize the agreement between same-class samples. Finally, we design the graph relational attention (GRAT) module, which concatenates the global representations of query and support samples and appends the resulting embedding as a virtual node to each query's high-level node graph. A global graph attention operation then aggregates query node features based on their relevance to the relational virtual node and combines the resulting transformed query representation with the virtual node embedding to learn relation scores for few-shot classification. By attending to node features based on their contribution to the query-support relation, GRAT can effectively reduce the negative impact of background noise to the representation.
Figure 2 shows an example of how FGRMNet extracts features from a golf course scene at different levels of the embedding network. At the lower levels in (2b), the receptive fields represented by the colored lines capture both local relationships and long-range, such as the connection between sand traps on opposite sides of the golf course. Importantly, as part of the deep GNN architecture, the edges representing the relationship between patches of the image dynamically change according to their similarity, which influences how high-level feature information propagates across the node embeddings.
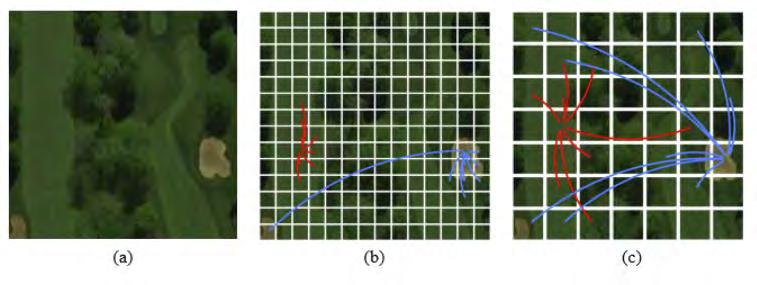
References
[1] G. Cheng, X. Xie, J. Han, S. Member, L. Guo, and G.-S. Xia, “Remote Sensing Image Scene Classification Meets Deep Learning: Challenges, Methods, Benchmarks, and Opportunities,” IEEE J Sel Top Appl Earth Obs Remote Sens, vol. 13, p. 2020, doi: 10.1109/JSTARS.2020.3005403.
[2] S. Dutta and M. Das, “Remote sensing scene classification under scarcity of labelled samples-A survey of the state-of-the-arts,” Comput Geosci, vol. 171, p. 105295, 2023, doi: 10.1016/j.cageo.2022.105295.
[3] C. Qiu et al., “Few-shot remote sensing image scene classification: Recent advances, new baselines, and future trends,” ISPRS Journal of Photogrammetry and Remote Sensing, vol. 209, pp. 368–382, Mar. 2024, doi: 10.1016/J.ISPRSJPRS.2024.02.005.
[4] A. Parnami and M. Lee, “Learning from Few Examples: A Summary of Approaches to Few-Shot Learning,” Mar. 2022, Accessed: Oct. 25, 2023. [Online]. Available: https://arxiv.org/abs/2203.04291v1
[5] L. Xing, Y. Ma, W. Cao, S. Shao, W. Liu, and B. Liu, “Rethinking Few-Shot Remote Sensing Scene Classification: A Good Embedding Is All You Need?,” IEEE Geoscience and Remote Sensing Letters, vol. 19, 2022, doi: 10.1109/LGRS.2022.3198841.
[6] M. Bi, M. Wang, Z. Li, and D. Hong, “Vision Transformer With Contrastive Learning for Remote Sensing Image Scene Classification,” IEEE J Sel Top Appl Earth Obs Remote Sens, vol. 16, pp. 738–749, 2023, doi: 10.1109/JSTARS.2022.3230835.
[7] Z. H. You et al., “Crossed Siamese Vision Graph Neural Network for Remote-Sensing Image Change Detection,” IEEE Transactions on Geoscience and Remote Sensing, vol. 61, 2023, doi: 10.1109/TGRS.2023.3325536.
[8] C. Zhang and B. Wang, “Progressive Feature Fusion Framework Based on Graph Convolutional Network for Remote Sensing Scene Classification,” IEEE J Sel Top Appl Earth Obs Remote Sens, 2024, doi: 10.1109/JSTARS.2024.3350129.
[9] Y. Zhang, S. Bu, B. Hu, P. Han, L. Weng, and S. Xue, “GCG-Net: Graph Classification Geolocation Network,” IEEE Transactions on Geoscience and Remote Sensing, 2023, doi: 10.1109/TGRS.2023.3293832.
[10] K. Han, Y. Wang, J. Guo, Y. Tang, and E. Wu, “Vision GNN: An Image is Worth Graph of Nodes,” Jun. 2022, doi: 10.48550/arxiv.2206.00272.
[11] F. Sung, Y. Yang, L. Zhang, T. Xiang, P. H. S. Torr, and T. M. Hospedales, “Learning to Compare: Relation Network for Few-Shot Learning.” pp. 1199–1208, 2018.
Cyber Fellow: Jacob Regan
Jacob Regan is a third-year Ph.D. student studying Computer Science at the University of Tulsa He previously completed bachelor’s degrees in computer science and in computer simulation and gaming as well as a master’s degree in computer science at the University of Tulsa. He has previously worked on research related to computer vision problems and is currently pursuing research involving interpretable AI for real-time traffic intersection optimization as well as interpretable AI for false-data injection in power grids. Jacob is particularly interested in areas involving Deep Graph Learning and Interpretable AI Last summer, Jacob participated in an entrepreneurship-oriented internship program with Atento Capital and Boddle Learning, where he developed an improved question scheduling system based on deep knowledge tracing.
Advisor: Dr. Mahdi Khodayar
Mahdi Khodayar, Ph.D., received his B.Sc. degree in computer engineering and the M.Sc. degree in artificial intelligence from K.N. Toosi University of Technology, Tehran, Iran, in 2013 and 2015, respectively, and a Ph.D. degree in electrical engineering from Southern Methodist University in 2020. He is currently an assistant professor of Computer Science at the University of Tulsa, and his primary research interests include machine learning and statistical pattern recognition with particular focus on deep learning, sparse coding, and spatiotemporal pattern recognition. Khodayar has served as a Reviewer for many reputable journals, including the IEEE Transactions on Neural Networks and Learning Systems, the IEEE Transactions on Industrial Informatics, the IEEE Transactions on Fuzzy Systems, the IEEE Transactions on Sustainable Energy, and the IEEE Transactions on Power Systems.
Eric Peterson and Sandip Sen
University of Tulsa
Tandy School of Computer Science
This research investigates the application of transformer neural networks in predicting the actions of human players within the context of video game playing. In modern gaming environments, non-player characters (NPCs) are most often governed by simple and static algorithms, such as if-else chains and behavior trees. This approach can lead to both repetitive and predictable behavior for such NPCs, which may negatively impact a human player’s enjoyment of the game. We seek to integrate AI-controlled agents capable of adapting to human behavior dynamically to provide more immersive gaming experiences. We coin the term Agent Player Character (APC) to describe such an agent.
One of the primary challenges faced when attempting to integrate an AI model into a video game environment is speed. Whereas many domains in which AI is prominently used are not time-sensitive and can afford to wait seconds, minutes, or even hours for results to be generated, video game environments run in real time, and it is expected by the player that the gameplay is smooth and without significant interruption. Previous neural network architectures commonly used for time series prediction tasks, such as recurrent neural networks (RNNs), gated recurrent units (GRUs), and long short term memory networks (LSTMs), require processing each successive timestep of the series in sequence. For environments which need to run at game speed, this is not sustainable, since prediction speed will degrade as the length of the predicted sequence increases.
To address this challenge, this research proposes the utilization of transformer neural networks, a deep learning architecture initially proposed by Vaswani et al. in the 2017 paper Attention Is All You Need that is renowned for its success in sequential data processing tasks. Transformers improve upon the previously mentioned RNNs, GRUs, and LSTMs in one key aspect: timesteps are no longer processed serially but in parallel all at once. This change allows for sequences of essentially arbitrary length to be predicted with minimal impact on speed. In addition, transformers have demonstrated remarkable performance on various tasks, including natural language processing and sentiment analysis. By adapting this architecture to the domain of video game playing, this research aims to explore its efficacy in capturing and predicting the temporal dynamics of human player actions.
The methodology involves the development and implementation of a transformer-based predictive model tailored specifically for video game environments. The model is trained on extensive datasets comprising historical gameplay sequences, where human player actions and state vectors are recorded over time.
Through its self-attention mechanism, the transformer network learns to discern meaningful patterns and dependencies within the temporal sequences, enabling it to make accurate predictions of future states and actions.
The findings of this research are expected to contribute significantly to the advancement of AI techniques in video game playing. By leveraging transformers for time series prediction, game developers can enhance the sophistication and realism of AI-controlled agents, thereby creating more immersive experiences for players. Additionally, the insights gained from this study may have broader implications for other domains requiring predictive modeling of sequential human behavior, such as anomaly detection and network security.
Eric is a fourth-year Ph.D. student at the University of Tulsa (TU) studying Computer Science. He received two undergraduate degrees from TU: a B.S. in Computer Simulation & Gaming and a B.S. in Computer Science. His research interests are in the field of artificial intelligence applied to video games. Specifically, Eric is interested in creating more human-like non-player characters (NPCs) in story-rich games to increase player immersion. Eric has a strong desire to be an entrepreneur, and his goal is to start his own game development studio after graduation.
Sandip Sen is a professor in the Tandy School of Computer Science with primary research interests in artificial intelligence, intelligent agents, machine learning, and evolutionary computation. He completed his Ph.D. on intelligent, distributed scheduling from the University of Michigan in December, 1993. He has authored approximately 300 papers in workshops, conferences, and journals in several areas of artificial intelligence. He received the prestigious NSF CAREER award in 1997. He has served on the program committees of major national and international conferences in the field of intelligent agents including AAAI, IJCAI, AAMAS, GECCO, etc. He regularly reviews papers for major AI journals and serves on the proposal review panels of the National Science Foundation. He has chaired multiple conferences, workshops and symposia on agent learning and reasoning. He has presented several tutorials on different multiagent systems topics in association with the leading international conferences on intelligent agents. He was elected to the position of Senior Member in the professional organization of AI researchers, the Association for the Advancement of Artificial Intelligence (AAAI), in 2014. He has been recognized with a lifetime Outstanding Researcher Award by The University of Tulsa in May, 2023.
References
Chen, L., Lu, K., Rajeswaran, A., Lee, K., Grover, A., Laskin, M., Abbeel, P., Srinivas, A., & Mordatch, I. (2021). Decision Transformer: Reinforcement Learning via Sequence Modeling. Advances in Neural Information Processing Systems (NeurIPS). https://sites.google.com/berkeley.edu/decision-transformer
Lee, K.-H., Nachum, O., Yang, M., Lee, L., Freeman, D., Xu, W., Guadarrama, S., Fischer, I., Jang, E., Michalewski, H., & Mordatch, I. (2022). Multi-Game Decision Transformers. Advances in Neural Information Processing Systems (NeurIPS). https://sites.google.com/view/multi-game-transformers Vaswani, A., Brain, G., Shazeer, N., Parmar, N., Uszkoreit, J., Jones, L., Gomez, A. N., Kaiser, Ł., & Polosukhin, I. (2017). Attention Is All You Need. Advances in Neural Information Processing Systems (NeurIPS).
Jack Tilbury LinkedIn
Jack - Tilbury@utulsa.edu
JackTilbury Google Scholar
● Security P roduct Manager
● Security,Risk & Resilient Strategy Consulting
● Security An alystOperations
● Research S cientist
Working Location Preference
Tulsa Area, Florida, Chicago, Washington, Remote
Internships / RA / TA / Work History Year
2022Present Doctoral Researcher
20202022 Product Manager Flash Mobile Vending & The Delta, South Africa
2019 Assistant Lecturer and Teaching Assistant Rhodes University
2018 Software Implementation Analyst Saratoga, Cape Town
JackTilburyisasecond-yearPh.D.studentatTheUniversityofTulsa.Heobtained hisresearch-basedMCominInformationSystemsfromRhodesUniversity,South Africa,in2019.JackwasawardedafullscholarshiptopursuehisMaster'sdegree, whichexploredthePropTechindustry–conductingrealestatetransactionsthrough blockchaintechnology. HegraduatedatthetopofhisInformationSystemshonors classasheobtainedaBusinessScienceundergraduatedegree.Sincearrivingin Tulsa,JackhasattendedandpublishedattheAnnualSecurityConferenceandhas beeninvitedtopresentattheUNESCOSafetyConference.Hisresearchincludes informationsystems,behavioralinformationsecurity,andautomateddecisionaidsin securityoperationcenters.BeforestartinghisPh.D.research,Jackworkedasa ProductManagerintheITindustryattwosoftwaredevelopmentcompanies.
JackworkedfortwoyearsasaProductManagerwithexperienceinstart-upand corporateenvironments,buildingandlaunchingmultipleproductstomarket.Jackis eagertocontributetothedevelopmentofsecurityproductseitherthroughleading productteams,engagingwithproductcustomers,orconductingproductresearch.

Student Author: Corey Bolger (corey-bolger@utulsa.edu)
Co-authors: Dr. Tyler Moore, Dr. Sal Aurigemma
Information security training is prevalent in all industries and is required by many regulations. Due to this, training programs have become increasingly standardized and one-size-fits-all. Training typically covers multiple topics at a very high level. These topics, while relevant to security awareness broadly, do not typically instruct users how to do their job securely. This research aims to investigate whether there are more effective interventions to use to improve cybersecurity outcomes than the standard training that is offered. We argue that while broad security awareness is useful, these security programs would be better suited targeting specific outcomes rather than general awareness.
In order to better focus efforts, we have decided to focus specifically on phishing and phishing reporting as phishing has consistently been one of the most prevalent and effective means for attackers to breach organizational networks (DBIR, 2023). While existing security awareness training does cover phishing and how to identify phishing emails from a high level, users are not typically given insight into the reasons they should report a phishing email. Existing training philosophies emphasize the “humans as a firewall” concept and attempts to train users to identify phishing emails with perfect accuracy. The shortcomings of this approach can be seen in the statistics. Phishing is among the top methods of network infiltration, and the mean time to detect and contain security incidents is 277 days according to the 2023 IBM Cost of a Data Breach report (Data Breach Report, 2023). The importance of enlisting users in the effort to combat phishing is clearly illustrated in the graphic below provided as a part of the internet crime report published by the FBI.
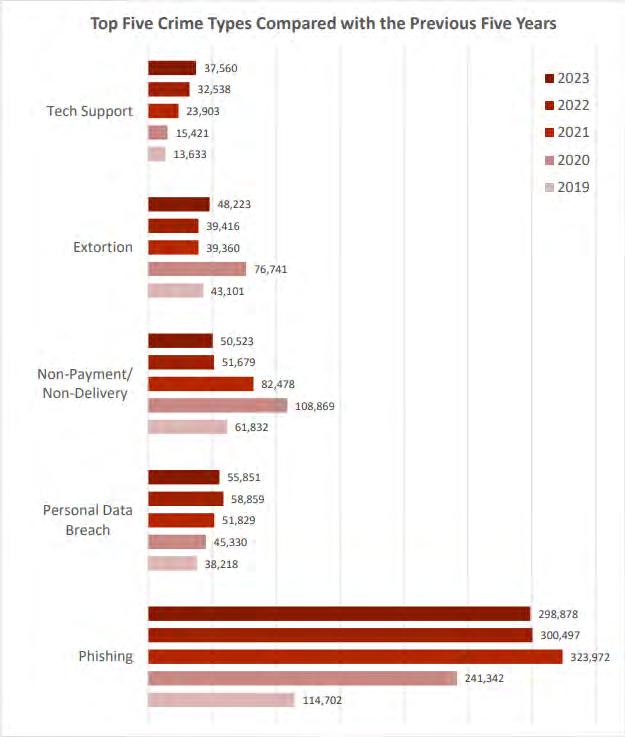
A primary issue with current phishing training is the lack of metrics used to gauge effectiveness. Typically, a large part of phishing training is ongoing test emails sent by the IT department to identify users who are likely to click on a real phishing email. These users are then sent to additional security training, but the training does not differ substantially from standard security training. Furthermore, these testing programs focus on one specific metric, the click-through rate. We argue that click-through rates alone are not significantly useful for lowering the amount of successful phishing attempts. The primary reason for this is simply that many users will not even see the email, which artificially drives down the click-through metric. This can lead IT departments to believe that their users are better equipped than they actually are.
This research evaluates a departure from this approach by implementing multiple interventions designed to increase user reporting rates of phishing emails. A primary goal of this research is to determine if specialized training targeting a specific outcome is a viable method for improving cybersecurity outcomes within organizations. Additionally, this research will attempt to replicate the success of previous research related to phishing and phish reporting by implementing several process
changes to the way that the IT department handles phishing reports. The interventions being tested will be implementing changes to make it easier for users to report suspicious emails, and providing more insight and feedback during and after the investigation into the email reported.
This research aims to answer several questions. First, is ease of reporting a significant factor influencing the rate of phishing reporting done by users? While simple, previous research has shown that reducing friction in the reporting process does increase reporting rates (Lain et al., 2022). We aim to validate this claim through this research by changing the process by which emails are reported as phishing. Second, can modifications to internal IT processes lead to greater rates of reporting? Again, previous research has shown that greater communication and insight into the investigation process can lead to increased rates of reporting (Lain et al., 2022). Finally, does training specifically designed to increase user rates of reporting have a significant impact compared to traditional security awareness training?
To test the training and interventions I have formulated three hypotheses. These hypotheses will be tested in a phased approach, implementing one of the suggested interventions one at a time and tracking phishing reporting rates over the course of several months. The planned order for this project is to implement a phishing button first, followed by the modifications to IT processes and communication regarding phishing investigations, and ending with the enhanced training provided to a random sample of users.
H1 The introduction of a phishing report button will significantly increase the reporting rates of phishing emails
H2 Modifications in IT processes will lead to an increase in reporting rates and the quality of phishing email reports
H3 Enhanced training will result in higher reporting rates and higher quality reports compared to current training methods
The methodology for this paper will follow a phased approach to allow for the measurement of each intervention individually and as a cumulative effect. The first phase will look at historical data from the university IT system to determine a baseline reporting rate from before the phishing button was implemented. Next, the period after the phishing button was implemented but no other training or interventions had taken place. During these two initial phases we will be focusing on the absolute rate of reporting on both an individual and organizational level. That is, we will be determining the amount of emails reported as phishing without consideration of the results of the investigation. We will also attempt to determine the accuracy of users individually and as a whole by looking at the outcome of the phishing
investigations. These metrics will then be used as a baseline to measure against for the duration of the study. The third phase will involve several changes to IT processes. The changes are primarily designed to increase the amount of communication to the user both before and after reporting. The specific process changes are (1) the implementation of an email warning banner, (2) the implementation of automatic notifications to the user upon the receipt of a phishing report, (3) the implementation of follow-up notifications regarding the results of the investigation, and (4) the implementation of a monthly email thanking users for reporting phishing emails and providing high-level statistics to show the impact that user reporting has on detection. Finally the last phase will introduce a custom training to be developed that focuses on educating users about their role in catching phishing and informing them of the processes that occur after they submit an email as suspicious.
The study will look at all university faculty and staff in order to provide generalizable results. The study seeks to establish the validity of outcome-based training as an alternative to existing training methodology. In addition, the study seeks to replicate previously validated process changes to increase phishing reporting. The theoretical foundation for this training is based upon previous works as well as research on reporting in other areas such as sexual harassment and ethical awareness.
FBI (2023). Internet Crime Report 2023. https://www.ic3.gov/Home/AnnualReports
Lain, D., Kostiainen, K., & Čapkun, S. (2022). Phishing in Organizations: Findings from a Large-Scale and Long-Term Study. 2022 IEEE Symposium on Security and Privacy (SP). https://doi.org/10.1109/sp46214.2022.9833766
Ponemon Institute (2023). Cost of a Data Breach Report 2023. https://ibm.com/reports/data-breach Verizon (2023). Data Breach Investigations Report. https://verizon.com/dbir/
Corey Bolger is a PhD student in the School of Cyber Studies at the University of Tulsa. He spent over five years working in the security industry as an information security consultant focusing on governance, risk and compliance. Within this role, Corey focused on information security program management and information security awareness training. His primary research goals are centered around security training and improving security outcomes for organizations.
Dr. Tyler Moore is the Tandy Professor of Cyber Security and Information Assurance in the School of Cyber Studies and the Tandy School of Computer Science at the University of Tulsa. His research focuses on the economics of information security, the study of electronic crime, and the development of policy for strengthening security. Prior to joining TU, Dr. Moore was a postdoctoral fellow at the Center for Research on Computation and Society (CRCS) at Harvard University, the Norma Wilentz Hess Visiting Assistant Professor of Computer Science at Wellesley College, and an assistant professor at Southern Methodist University. He completed his PhD at the University of Cambridge as a Marshall Scholar.
Dr. Sal Aurigemma is a professor in the Shidler College of Business at the University of Hawai’i at Manoa. His research focuses on the areas of information security, human-computer interaction, data networks, and communication theory. Prior to joining the University of Hawai’i, Dr. Aurigemma was an applied associate professor of cyber studies in the School of Cyber Studies and an associate professor of computer information systems at the University of Tulsa. Dr. Aurigemma also served as a computer engineer for the Space and Naval Warfare Systems Center Pacific before his work in academia.
About Cameron
Professional Experience Preference
●
●
Working Location Preference
Internships / RA / TA / Work History

Jacob Brue
The University of Tulsa jacob-brue@email.com
Machine learning models of increasing complexity are continuously being adopted despite being increasingly opaque to human understanding. This poses a variety of risks, including security and privacy. Our research focuses on understanding and evaluating communication between humans and AI systems. Explainable Artificial Intelligence (XAI), an important field in human-AI communication, aims to create transparency in modern AI models by offering explanations of the models to human users Part of our research includes a comparison of the many methods used within the field of XAI to evaluate explanation effectiveness. Additionally, we are also studying knowledge domain factors and human factors that affect which class of explanations are most preferable. Finally, we discuss plans for the start of new research in explanations for decreasing knowledge gaps between agents.
Explanations, XAI, evaluation, placebic explanations, actionable explanations
There are many ways in which researchers have attempted to evaluate the quality of XAI models, including objective measures like fidelity, and subjective measures like user surveys [1]. Most studies done within this field conduct simple user surveys to analyze the difference between no explanations and those generated by their proposed solution. We have not found adequate evidence that these evaluation metrics are each individually enough to determine if explanations are of good quality. We believe any kind of explanation will be “better” in most metrics when compared to none at all, but not every metric will distinguish “good” explanations from “poor” ones. We performed a study to test this pitfall: most explanations, regardless of quality or correctness, will increase user satisfaction. We compare the results of different evaluation methods across different classes of explanations. We also propose that emphasis should be placed on actionable explanations. We demonstrated the validity of our claims using an agent assistant that helps teach some chess concepts
Sandip Sen
The University of Tulsa sandip-sen@email.com
to a user. The results of this study will act as a call to action in the field of XAI for more comprehensive evaluation techniques for future research to prove explanation quality beyond user satisfaction.
The field of machine learning has been experiencing unprecedented growth over the past decade. This growth has often been fueled by major innovations in deep learning technology. Machine learning models have proven that function approximators can discover deep patterns within data. While modern machine learning models have been very successful at finding solutions for learning tasks, many challenges remain for translating model knowledge to human understanding. These challenges are diverse, affecting every type of stakeholder [2]. The field of explainable artificial intelligence (XAI) was created for research that addresses these challenges directly through the generation of explanations. While we believe explanation evaluation plays a significant role in many aspects of human-AI interaction, we study it primarily consider its benefit to XAI.
Even though many explanation generation algorithms have been proposed and used, what makes an explanation good is still fuzzy and underdefined. Some have focused on human explanations as a target for optimal agent explanations [3, 4]. Others believe that the best way to recognize a good explanation is by measuring how it achieves the set of goals for which it was designed. These include effective teaching, increased satisfaction and trust, while recognizing ethical and privacy concerns. We primarily focus on the goals of increasing user satisfaction and user understanding, some of the most prevalent aspects considered within the field.
A large variety of evaluation criteria have bene developed for assessing explanation effectiveness within the field of XAI [5, 6, 7]. We focus on two of the most common evaluation criteria, user surveys and comprehension tests.
One simple classification of explanations is actionable vs placebic explanations. A placebic explanation is an explanation that adds no new information about the subject of interest. An actionable explanation is one that has the potential to provide new information on the subject. We present our study, results, analysis, current work and future work.
This study aims to demonstrate that user satisfaction with an explanation is nearly always greater than user satisfaction without an explanation, regardless of the quality of the explanation. This is based on the principle that users positively receive an agent that communicates frequently, either because a willingness to communicate demonstrates openness and trustworthiness, or because it provides other social value. We will also show that user comprehension does not necessarily match with user satisfaction.
For our experimentation, we designed a user study to test user knowledge of chess forks and pins after receiving different kinds of explanations.

Users first take a practice section of ten chess puzzles. They receive either no explanation, placebic explanations, or actionable explanations from an onscreen chatbot agent. They then complete a user test to determine their comprehension of similar chess puzzles. Finally, they complete a survey on their experience, including their satisfaction with the explanations they received.
We confirmed some important hypotheses. There was not a significant difference in the satisfaction metric between the placebic and actionable explanations. We also confirmed that there is a significant increase in the comprehension test metric between the actionable and the placebic explanations.
Some of our hypotheses were not supported. We did not show that the satisfaction metric was significantly greater for placebic and actionable explanations than for no explanation.
This study successfully reached many of the most important conclusions. Additionally, it discovered some contrary results which will prove vital for further research into the evaluation of computergenerated explanations. We showed that measuring user satisfaction through user surveys alone may not always be enough to determine if an explanation is effective.
Based on the results of the explanation evaluation study, we are continuing to explore explanation effectiveness in terms of user satisfaction and user comprehension. We now expect that user satisfaction is strongly affected by the domain. We have identified some possible factors of the humandomain relationship that may influence the preferred explanation type.
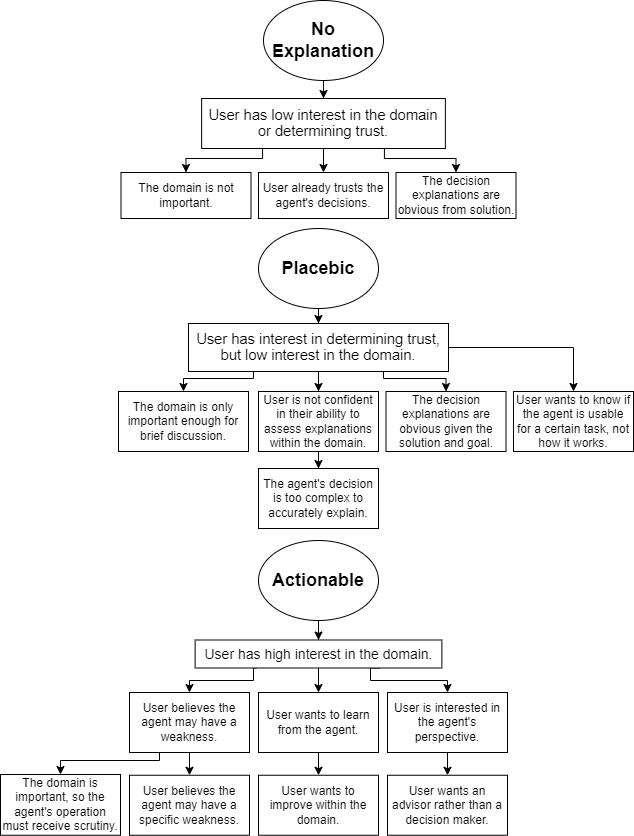
FIGURE 2. EXPLANATION PREFERENCE FLOWCHART
In Figure 2, we present our early predictions on user and domain factors that affect user preference of explanation types. These are based on our prior research and our results from our previous study.
Large language models have proven to be incredible tools for generating natural language. Many of these models are trained using an expensive process of human feedback. We are interested in evaluating these models on the task of finding knowledge gaps using standard communication. This is an important step in the process of giving explanations. We are also interested in using these evaluations as a loss function to train a large language model with the hope of improving its ability to provide new, interesting, and useful information to users.
References
[1] Renftle, M.; Trittenbach, H.; Poznic, M.; and Heil, R. 2022. Explaining Any ML Model?–On Goals and Capabilities of XAI. arXiv preprint arXiv:2206.13888.
[2] Langer, M.; Oster, D.; Speith, T.; Hermanns, H.; K ̈astner, L.; Schmidt, E.; Sesing, A.; and Baum, K. 2021. What do we want from Explainable Artificial Intelligence (XAI)?–A stakeholder perspective on XAI and a conceptual model guiding interdisciplinary XAI research. Artificial Intelligence, 296: 103473.
[3] Miller, T. 2019. Explanation in artificial intelligence: Insights from the social sciences. Artificial intelligence, 267: 1–38
[4] Mohseni, S.; Block, J. E.; and Ragan, E. 2021. Quantitative evaluation of machine learning explanations: A humangrounded benchmark. In 26th International Conference on Intelligent User Interfaces, 22–31.
[5] Eiband, M.; Buschek, D.; Kremer, A.; and Hussmann, H. 2019. The impact of placebic explanations on trust in intelligent systems. In Extended abstracts of the 2019 CHI conference on human factors in computing systems, 1–6.
[6] Ehsan, U.; and Riedl, M. O. 2021. Explainability pitfalls: Beyond dark patterns in explainable AI. arXiv preprint arXiv:2109.12480.
[7] Nourani, M.; Kabir, S.; Mohseni, S.; and Ragan, E. D. 2019. The effects of meaningful and meaningless explanations on trust and perceived system accuracy in intelligent systems. In Proceedings of the AAAI Conference on Human Computation and Crowdsourcing, volume 7, 97–105.

Jacob Brue is a Graduate Student at the University of Tulsa.
Jacob studied Computer Science and machine learning during his undergraduate. He has provided his machine learning expertise towards several interdisciplinary teams as a machine learning developer. He has worked with geologists on earthquake detection, speech and language pathologists on aphasia language processing, and cybersecurity professionals on cyberphysical sensor processing. He continues his work by studying natural language processing and explainable artificial intelligence.

Dr. Sandip Sen is a professor in the Tandy School of Computer Science with primary research interests in artificial intelligence, intelligent agents, machine learning, and evolutionary computation. He advises the MASTERS research group with focuses in HumanAI Cooperation, Multi-Agent Systems, and Reinforcement Learning.
About Cameron
Professional Experience Preference
●
●
Working Location Preference
Internships / RA / TA / Work History

Ryan Brue
Through the Spring of 2023, we worked with a cross-disciplinary group of electrical, petroleum, and computer engineers on the “Detecting Methane Gas Emissions into the Atmosphere” project. The idea of the project was to use a network of low-cost methane gas sensors and various other sensors for wind speed, humidity, etc. to determine the source of a methane gas leak throughout a wide range. Current methods for detecting methane gas emissions can be costly, and require a lot of maintenance. We constructed a prototype of a node on such a network, with all the sensors that the node would have in the real environment. We used this prototype to study how various sensors of differing costs and capabilities would react to a controlled methane gas release. We then extended the study to test how other gases would trigger the various sensors, and how differences in humidity, temperature, and wind speed affects the results. We used concentrations of methane gas ranging from 1% to 5% for the test, and tested various ranges from which the sensors could be triggered.
For future work in the area, once a node with a good enough cost to effectiveness ratio could be established, we could bring hundreds of these nodes into a mesh network and develop software to allow these nodes to collaborate in a mesh, using a low-power networking method such as LoRa. Such a system would need to have a low cost, a reasonable effectiveness, and require little maintenance.
In the Fall of 2023, we worked on the “VR for Smart Installation Experimentation and Security Analysis” project, which was done as part of a grant with the “U.S. Army Engineer Research and Development Center (ERDC)”. The main goal of the effort was to develop a prototype for a system which allows the creation of a “digital twin” – a VR modeled environment matching a real world environment. Since the work was abstract and involved many different smaller efforts, there were smaller teams that were formed to work on specific parts of the research.
As a part of the Knowledge core, we worked with data processing for the project, including processing sensor data from an array of sensors in a room – humidity, temperature, time-of-flight sensors, and more. Through the larger project, we used supervised learning models to assist in modeling a virtual environment. We used the sensors on-hand to construct a view of levels of occupancy in the room.
Future work in this section could include using unsupervised techniques such as clustering to determine levels of occupancy without the need of labeled data. Many VR installations could be constructed without the resources to train a neural network based on labeled data, and the problem type lends itself well to unsupervised learning.
In addition to determining levels of occupancy, we also used supervised learning to classify various “abnormal” behavior in the room, such as someone appearing in the room without using the entrance (this could mean someone came through a window, or through a usually locked door, etc.). This task typically lends itself to unsupervised learning, but due to external constraints, we worked with supervised learning for this task. By the end of the work, we were able to classify abnormal behavior to a reasonable degree.
Additionally in the Fall of 2023, we worked on a project involving industrial control systems. Industrial control systems involve machines sending different kinds of messages to each other across a network. For critical ICSs, it is important that these systems remain secure and impervious to network attacks. For some systems, it is feasible to simply keep the network cut off from the internet at large. For the systems that aren’t able to do so, they often have a set routine for how they access the internet, and the form of data that they send/receive from the internet.
In order to keep critical industrial control systems safe from network attacks, network administrators often enforce network policies and/or monitor the network for any unusual behavior. Previous work had been done on detecting abnormal network behavior using machine learning, and that work had found that the most effective methods of detecting abnormal network behavior were unsupervised learning techniques.
We experimented with using various unsupervised learning models on industry provided data of packets that go through ICS networks, including some data that is known to be anomalous. We wanted to study whether training an unsupervised model on the raw bytes of packets would be effective compared to engineering specific features from a packet (i.e. source address, destination address, etc.). We found that this byte-level approach was reasonably effective for the task of anomaly detection within these systems. The alternative of feature engineering is slightly more effective than the byte-level approach, albeit at a higher upfront cost to engineer specific features out of packets. The alternative also has the issue of not supporting unknown configurations, but the system could and probably should always just flag unknown configurations as anomalous anyways.
Future work in this field could include evaluating the maximum theoretical difference between the accuracy of byte-level approaches and feature engineered approaches, with an emphasis on how different parameters affect the accuracy. A more practical future work could be developing a simple to use framework for detecting anomalies in an industrial control system that network administrators could employ without any express knowledge of machine learning.
In the Spring of 2024, our research has been focused on studying and contributing to open-source initiatives, including many projects surrounding Linux. Linux is the most used operating system for server infrastructure, including critical data centers and security infrastructure. Contributing to various open source projects on the Linux stack provides an understanding of the interlocking projects that make up how Linux operates, beyond just the kernel. A particular area of interest within the open source community is application sandboxing. Efforts such as Flatpak have encouraged application developers to containerize their applications in distribution-agnostic ways, simplifying efforts to make their apps available to as many people as possible, while also providing the potential for security controls. The second part of this effort is xdg-desktop-portals, which define interfaces for apps to access information securely instead of using their own access methods. These portals can then be enabled or disabled in a permissions based system, similar to how iPhone and Android phones do permissions. In addition to studying open-source projects, we have worked on various non security critical projects, such as TuneD, which is a power management daemon for desktops and servers. Some contributions have been made to
an open source UI and game engine called Godot Engine, as well as several contributions to COSMIC, a suite of applications written in rust that make up a desktop environment. Developing in rust ensures that memory leaks happen far less, providing a more secure platform for doing security critical work.
Future work in this field involves studying more security hardening techniques and projects such as SELinux, which are being actively developed to help secure the Linux desktop and Linux servers.
Dallas Elleman and John Hale
The aim of this research is to discover how the network science concept of motifs can be applied or adapted to the class of cybersecurity threat models known as attack graphs. To do this, we seek to transfer formal knowledge and methods from the study of biological and other complex systems to the domain of cyberphysical systems using category theory. We explore whether motifs exist within attack graph representations of cyber-physical systems, and whether machine learning and large language models can be used to develop new motif-centered approaches to graph-based security modeling and analysis.
structure, behavior, and weaknesses, as well as knowledge of adversaries’ methods, tools, and resources [2].
vertices nodes edges links
attack graph created with TU’s RAGE Attack Graph Engine maps how an attacker’s actions (graph edges) progressively change the state (graph nodes) of the additive manufacturing system at TU’s Nor
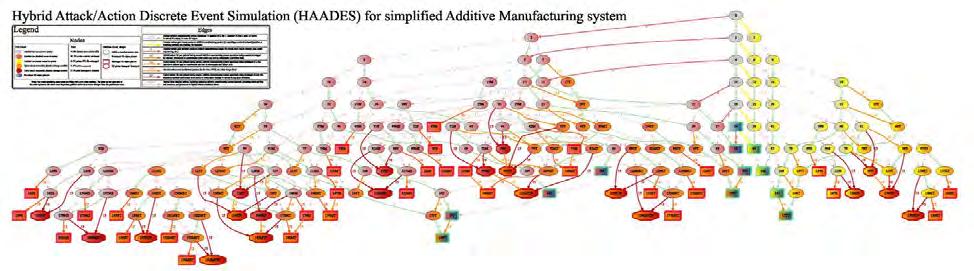
In the context of network science, motifs are repeated patterns or “building blocks” of significance profile of a network’s
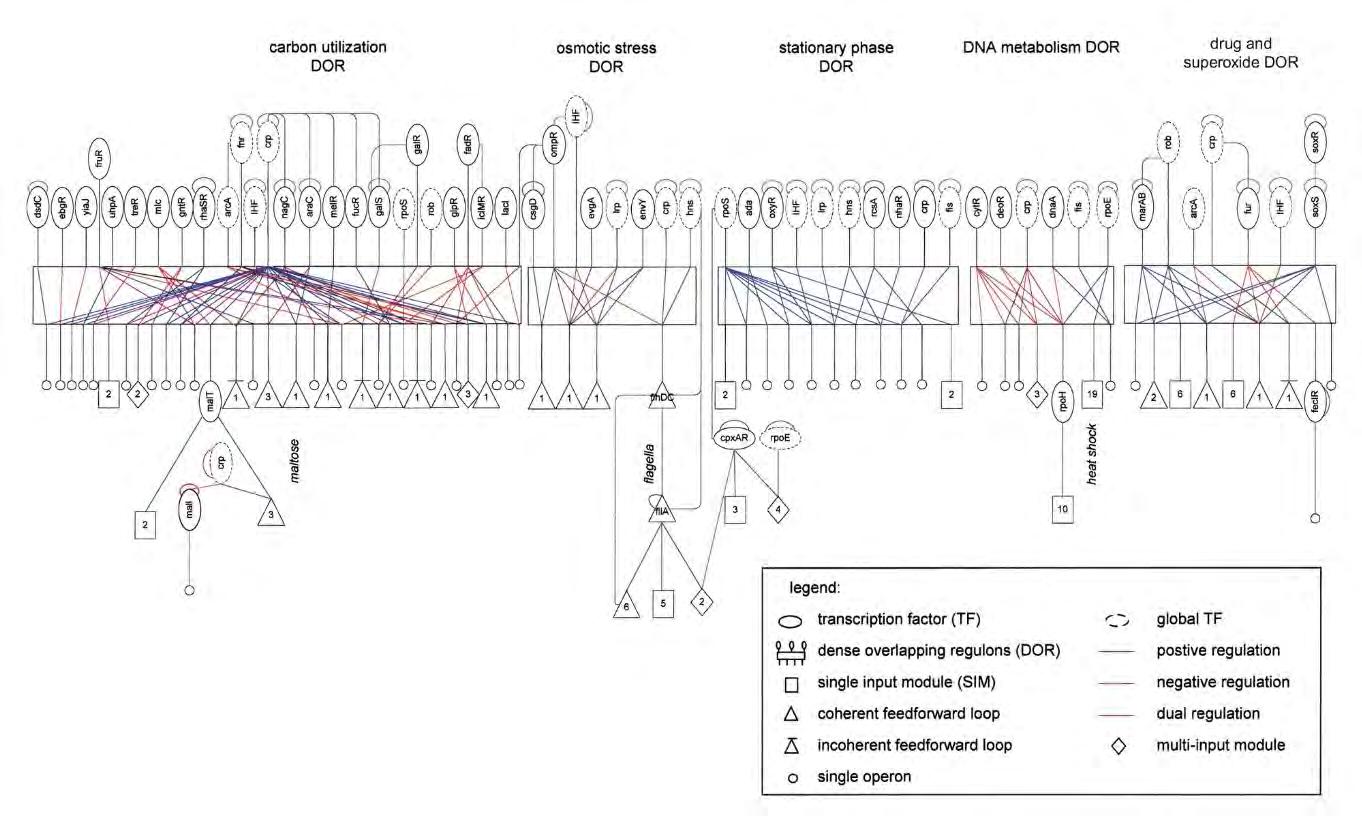
References
1. President’s Council of Advisors on Science and Technology, “REPORT TO THE PRESIDENT Infrastructure for a Digital World,” (2024).
2. Fitch, S. C. “Defendable Architectures.” White paper, Lockheed Martin Corporation
3. W. Xiong and R. Lagerström, “Threat modeling – A systematic literature review,” Computers & –
4. Lallie, Harjinder Singh, Kurt Debattista, and Jay Bal. “A Review of Attack Graph and Attack Tree Visual Syntax in Cyber Security.” Computer Science Review
5. Smith, Bailey, Whitney Caruthers, Dalton Stewart, Peter Hawrylak, and John Hale. “Network Modeling for Security Analytics.” In Proceedings of the 11th Annual Cyber and Information Security Research Conference –
6. U. Alon, “An Introduction to Systems Biology: Design Principles of Biological Circuits.” CRC Press
7. S. Yu, J. Xu, C. Zhang, F. Xia, Z. Almakhadmeh, and A. Tolba, “Motifs in Big Networks: Methods and Applications,” IEEE Access, vol. 7, pp. 183322–
8. A. K. Dey, Y. R. Gel, and H. V. Poor, “What network motifs tell us about resilience and reliability of complex networks,” Proc. Natl. Acad. Sci. U.S.A. –
9. and U. Alon, “Network motifs in the transcriptional regulation network of Escherichia coli,” Nat Genet, –
Authors
Dallas Elleman tech startup, as an intern at NASA’s Jet
recommendations for the White House with the President’s Council of Advisors on Science and Technology, training in design thinking at Google and at Stanford’s Hasso Plattner Institute of Design as a University
John Hale
About Cameron
Professional Experience Preference
●
●
Working Location Preference
Internships / RA / TA / Work History
Samantha Phillips
The University of Tulsa samantha-phillips@utulsa.edu
Abstract
Sal Aurigemma University of Hawaii
The University of Tulsa sa8@hawaii.edu
Situational Judgement Tests (SJTs) are a multidimensional measurement method commonly used in the context of employment decisions and widely researched in the field of industrial and organizational (I-O) psychology. However, the use of SJTs in the field of information system (IS) security is limited. Applying SJT research from the field of I -O psychology to IS security research, particularly research with behavioral components, could prove beneficial. SJT items typically present participants with realistic hypothetical work/job-related situations and potential response items. The use of SJTs in IS security research could provide researchers with a new measurement tool for a wide range of research goals.
Keywords: Situational judgment test, behavioral information security
A prevalent challenge when designing a research project is selecting suitable data collection methods. Fortunately, researchers in the field of information systems (IS) security can apply and build upon wellestablished methods from a range of fields, including industrial and organizational (I-O) psychology.
The purpose of this paper is to discuss the use of Situational Judgement Tests (SJTs) in the context of behavioral IS security research. SJT research is well established in the field of I -O psychology, but this approach has not been used often in IS research. SJTs are often used to study work and job-related behaviors and constructs. SJTs are also quite customizable because they can be presented in a variety of formats, how the response instructions are worded influences the measurement, and the scoring key can be built in a variety of ways (Weekley et al., 2005; McDaniel et al., 2007; Ployhart & MacKenzie, 2011; Ployhart & Ward, 2013).
Bradley Brummel University of Houston bjbrummel@uh.edu
Tyler Moore
The University of Tulsa tyler-moore@utulsa.edu
There has been increasing dialogue in the behavioral information security research community on the benefits of enhancing the contextual relevancy of field survey instruments and theoretical scoping to improve the practical impact of research efforts. Regarding instrumentation, Siponen and Vance (2014) note that some validated survey instruments in use in the field are rigorously tested for content valid ity but can lack the contextual specificity necessary to readily translate to practice. They recommend several guidelines to improve contextual relevance, including ensuring applicability of measured IS security actions to the organizational (or end-user) context and providing the appropriate level of specificity of the instrumentation for the phenomena of interest.
Additionally, although the IS field's top journals show a preference to publish broadly generalizable theoretical models (Davison & Martinson s, 2016; Aurigemma & Mattson, 2019), narrower-scope models provide the opportunity for theoretically deeper explanations and more accurate predictions (Siponen, Klaavuniemi, & Xiao, 2023). Siponen et al. (2023) argue that narrowing the range of phenomena examined in a scientific study can lead to improved explanatory or predictive accuracy. SJTs provide researchers the opportunity to not only ensure their field survey instruments are relevant to the organizational or environmental conditions of their sample frame, but they can also be used to provide a refined and focused examination of specific behavioral phenomena for the development and testing of new and existing behavioral models.
Section 2 provides a review of SJTs including what they are, presentati on formats, response instructions, scoring, and an example. Section 3 compares SJTs to the more familiar Likert scale and scenario measurement methods. Section 4 concludes by discussing some possible next steps for applying SJTs to behavioral IS security.
The purpose of this section is to provide a brief review of SJTs based on current literature. This section will cover what SJTs are, presentation formats, response instructions, scoring, and an example of SJT use in a non-security research field.
Situational judgment tests have traditionally been used to predict performance and to influence decisions in areas such as employment (hiring, promotions, etc.), the military, and education (Weekley & Ployhart, 2005; Ployhart & MacKenzie, 2011). A typical SJT presents participants with realistic hypothetical job/work-related situations, known as item stems, along with potential response options. Most SJTs provide participants with between four and six response options to evaluate per item stem (Ployhart & Ward, 2011). SJTs are described as a multidimensional method because they simultaneously measure a variety of latent constructs (Oostrom, De Soete & Lievens, 2015; Ployhart & MacKenzie, 2011; Ployhart & Ward, 2013; Pol lard & Cooper-Thomas, 2015). Weekley & Ployhart (2005) provide the following example to represent a typical SJT item. Ployhart & MacKenzie (2011) and Ployhart & Ward (2013) each present an example SJT of similar structure. While common, this is not the only structure that can be used as will be discussed in subsection 2.3
One of the people who reports to you doesn’t think he or she has anywhere near the resources (such as budget, equipment, and so on) required to complete a special task you’ve assigned. You are this person’s manager.
A. Tell him/her how he/she might go about it.
B. Give the assignment to another employee who doesn’t have the same objections.
C. Tell the person to “just go do it”.
D. Ask the person to think of some alternatives and review them with you.
E. Provide the employee with more resources.
Which response above do you think is the best?
Which response above do you think is the worst?
SJTs are a flexible measurement method that can be customized in numerous ways to meet research objectives. Ployhart & Ward (2013) outline the dimensions of SJTs that distinguish situational judgment items. Table 1 is from Ployhart & Ward (2013) and displays the item dimensions along with examples and variations for each.
Over time the presentation formats used for SJTs have expanded and evolved due to advances in technology and research. Some commonly used presentation formats include paper-and-pencil,
Table 1. Elements Distinguishing Different Situational Judgment Items
Dimension
Situation complexity
Response format
Response instructions
Reading level
Test length
Item independence
Homogeneity
Scoring
Representative example and variations
Relatively short, simple situations to complex, detailed situations
Multiple choice, true–false, constructed response (open ended), oral, verbal, behavioral enactment
Would do, should do, most or least appropriate, best, worst, Likert-type scales
Irrespective of complexity, items can be written at low or high reading levels
Short (roughly five to 10 items) to approximately 100 items; most between 20 and 40 items
Non-independent (e.g., branching, where response to an item influences the administration of subsequent items) to independent
Some tests written to target a single construct, but most a multidimensional composite of constructs
A single correct answer, points for multiple correct answers, different points depending on the appropriateness of responses, penalties (loss of points) for choosing inappropriate responses, continuous (Likert -type) scores on an item
Media or presentation format Paper and pencil, video (real media or computer -generated avatars), audio only, Web or smartphone applications
Note. From Ployhart, R. E., & Ward, A. (2013). Situational Judgment Measures.
internet/computer, multimedia, and audio (Ployhart & MacKenzie, 2011; Ployhart & Ward, 2013). Further distinctions are made between the various formats including text-based, video assessment, animated assessment, and assessment gamification.
Text-based SJTs present participants with written versions of situations and response options, such as the example item previously shown, using a paper-andpencil or digital format. Multimedia-based SJTs come with a higher development cost than text -based, but they outperform text -based SJTs by being able to predict interpersonally oriented criteria, being less ambiguous (multimedia provides details such as unspoken body language or facial cues that text -based cannot discreetly include), having a higher fidelity, and having less adverse impact (Pollard & CooperThomas, 2015).
Considerable research has been conducted that compares text-based and video-based SJTs, such as Chan & Schmitt (1997). Chan & Schmitt’s research “showed that the Black-White difference in situational judgment test performance and face validity reactions to the test were substantially smaller in the videobased method of testing than in the paper-and-pencil method” (Chan & Schmitt, 1997, p. 143).
A more recent study conducted by Karakolidis, O’Leary & Scully (2021) compares animated and textbased situational judgment test formats. Their research results indicated that “the variance attributed to construct-irrelevant factors was 9.5% lower in the case of animated versus the text -based SJT” (Karakolidis et al., 2021, p. 72), which is consistent with Chan & Schmitt’s (1997) findings. The findings in both papers relate to the reading demands placed on participants when utilizing text-based SJTs. In other words, the use of a multimedia SJT format compared to text -based formats reduces the impact of varying reading comprehension levels between SJT participants. Karakolidis et al. (2021) acknowledge in their paper that it may be difficult for SJT developers to justify using an animated format versus text -based due to the considerable cost involved in developing an animated SJT. The authors suggest that cost and complexity associated with developing an animated SJT makes them better suited for large -scale assessment contexts such as national and international assessments, university assessment programs, personnel selections, and credential/certification exams. However, recent i nnovations in artificial intelligence-assisted image generation (such as DALL-E, Stable Diffusion, and others) and video creation tools (such as Adobe Firefly for Video, Sythesia, and Kapwing) may offer researchers an affordable way to create customized animated SJTs.
An emerging aspect of SJT presentation formats is assessment gamification. Landers, Auer & Abraham (2020) described assessment gamification as “a design process used to add game elements to an existing measure or process to meet specific system-level goals” (p. 227). They explain that an SJT is “gamified” if it has gone through a redesign to add game elements not found in its original form. Based on their research study focused on redesigning an SJT about customer service to include immersion a nd control game elements, the authors conclude that gamification with high immersion elements is likely an expensive way to achieve a relatively small gain in applicant reactions for SJTs and the control elements, although less expensive, were not associated with significant gains in reactions. Landers et al. (2020) suggest that the gamification of SJTs is best considered as the “style” of assessment.
Overall, there are various presentation formats available for SJT developers to choose from when designing the assessment. Text-based and multimediabased SJTs appear to be the most established, with trade-offs in cost and complexity to be considered.
Another highly customizable component of SJTs is the response instructions, which refer to how respondents are prompted to answer each situational item. There are a few different options to consider when deciding the type of response instructions to use when developing an SJT. Before deciding on a response instruction format it is important to know what constructs the SJT is aiming to measure.
Response instructions can prompt for multiple or single responses to an item and include asking the respondent what they would do or should do, what they would most likely do, which response options are the best/worst, most appropriate/least appropriate or most effective/least effective , and rating or ranking response options (McDaniel et al., 2007; Ployhart & MacKenzie, 2011; Ployhart & Ward, 2013). There are other types of response instruction formats, but the ones listed are commonly implemented.
The type of response instructions that should be used for an SJT depends on the type of data the developer would like to collect, and the latent constructs being measured. Response instructions can be placed in one of two categories: knowledge and behavioral tendency (McDaniel et al., 2007).
Table 2 provides an IS security relevant SJT item and instruction examples along with their related knowledge or behavioral tendency category. SJ Ts with knowledge instructions are a maximal performance measure and SJTs with behavioral tendency
Situation/Item Stem
Response Options
Response Instructions
You see a coworker pick up a USB thumb drive in the bathroom, after no one says the USB thumb drive is theirs your coworker decides to take it with them.
A. The coworker plugs the USB thumb drive into their computer.
B. The coworker tries to find the owner of the USB thumb drive.
C. The coworker gives the USB thumb drive to the IT department.
D. The coworker throws the USB thumb drive away.
Response Category
What would your coworker do next with the USB thumb drive?
What would your coworker most likely do with the USB thumb drive?
What would your coworker least likely do with the USB thumb drive?
Rate and rank what your coworker would most likely do.
Rate your coworker’s tendency to perform each option on a Likert scale.
What should your coworker do next with the USB thumb drive?
Which response option do you think is the best?
Which response option do you think is the worst?
Which response option would be most appropriate?
Which response option would be least appropriate?
Which response option would be most effective?
Which response option would be least effective?
instructions are a measure of typical performance (McDaniel et al., 2007).
SJTs with knowledge instructions are considered maximal performance measures because they prompt the respondents to make judgments about what represents maximal/effective performance (McDaniel et al., 2007). Knowledge instructions motivate the respondents to accurately display their knowledge and abilities. Therefore, if an SJT developer wants to assess the knowledge respondents have about a construct, response instruction formats that fall under the knowledge instruction category would be appropriate to use.
SJTs with behavioral tendency instructions measure typical performance because the instructions ask them to report typical behavior in response to the situation (McDaniel et al., 2007). If an SJT developer would like to collect data on how a respondent wou ld typically respond to a situation, or how they think someone else would respond to a situation, then behavioral tendency instructions would be most appropriate to use.
It is important to consider that there are some concerns about the use of behavioral tendency instructions in SJTs. McDaniel et al. (2007) state that when self-reports are used to measure typical behavior there is a possibility of self-deception or impression
Behavioral tendency
Behavioral tendency
Behavioral tendency
Behavioral tendency
Knowledge
Knowledge
Knowledge
Knowledge
management. An example of self-deception would be a respondent reports they typically behave in an agreeable manner at work, but their actual typical behavior is known to be abrasive. An example of impression management would be a respondent who typically behaves in an unethical manner at work would respond to the situation that they would behave ethically. Pollard & Cooper-Thomas (2015) discuss the topic of fake ability regarding behavioral tendency instructions in their review paper. They conclude from their review that “there is a lack of evidence that test takers do actually distort their answers more when asked to indicate how they would act” (p. 16). Therefore, additional research may need to be conducted to fully determine the risk faking presents in SJTs with behavioral tendency response instructions.
Response instructions have been found to influence the constructs measured by an SJT (McDaniel et al., 2007), so the choice of response instruction format should not be taken lightly. It is important to note that the categories of knowledge and behavioral tendency are generic to SJTs in general and that the specific constructs/dimensions an SJT is measuring depends on the content of the SJT. Ployhart & Ward (2013) state, “situational judgment measures actually assess a variety of latent constructs
simultaneously (hence, their description as a multidimensional method)” (p. 552). Examples of constructs/dimensions that have been measured by an SJT include technical coordination; engineering cultures; and ethics, standards, and regulations in the context of global engineering competency (Jesiek et al., 2020), agency and communion in the context of medical school admission (Mielke et al., 2022), and the six HEXACO personality dimensions (Oostrom et al., 2018).
One potential approach in the IS space might be to ask employees to complete both a knowledge and behavioral tendency version of an SJT aligned with the organization’s IS policies. If done honestly, the organization could gain insight into whether they primarily have a training challenge around knowledge, or a performance issue around expected outcomes resulting from behavioral choices.
Just as there are various presentation formats and response instructions that can be used when developing an SJT, there are many potential scoring components to be considered. Instead of focusing on the specifics of scoring, such as how points could be assigned, this sub-section focuses on the foundational aspect of scoring keys. Weekley et al. (2005), Ployhart & MacKenzie (2011), St-Sauveur et al. (2014), De Leng et al. (2016), and Weng e t al. (2018) are a few examples of papers that discuss various scoring methods in more depth.
The foundational aspect of SJT scoring addresses how response options are evaluated. An SJT developer can apply various scoring techniques and point systems, but first the response options must be evaluated. In other words, without knowing the desired responses to the situational items an appropriate scoring key cannot be applied.
There are three basic approaches that have been defined in SJT literature for developing scoring keys: empirical, theoretical, and rational (Weekley et al., 2005). The empirical scoring approach involves establishing a scoring key based on the relationship between the responses obtained through a large pilot study and a criterion, such as job performance (Weekley et al., 2005; Pollard & Cooper Thomas, 2015; Whetzel et al., 2020). The theoretical scoring approach creates a key based on the “best” answer or appropriate rating as determined by a theory (Weekley et al., 2005; Whetzel et al., 2020). The rational approach, which is most prevalent, consists of consulting Subject Matter Experts (SMEs) to determine the scoring key (Weekley et al., 2005; Pollard & Cooper Thomas, 2015; Whetzel et al.,
2020). SMEs will provide what they believe is the “correct” answer to each SJT item. For example, if the SJT asks respondents to select the best response then the SMEs would respond in the same format by selecting what they believe is the best response. SMEs can be selected in a variety of ways such as f rom a specific field of research or supervisors/leadership in a company.
A benefit of using the rational approach for SJTs utilized in organizations is that the scoring key can be organization specific (Ployhart & MacKenzie, 2011). If the scoring key is created based on input from SMEs, then SJT developers could consult with leadership in each organization to determine an appropriate scoring key for their specific organization. Therefore, it is common for the same SJT items to be used in multiple organizations while the scoring keys are created separately for each. In terms of IS security, the Chief Information Security Officer or other IS security leaders would likely be considered the SMEs for creating the scoring key.
When it is time for an SJT developer to establish the scoring process it is important for them to first consider how the scoring approach will be determined (empirical, theoretical, or rational). For example, if the SJT developer does not have the resources f or a large pilot group, then the theoretical or rational approach could be more appropriate.
SJTs have prominently been used as a method for personnel selection for years, which is why the majority of SJT research in I-O psychology is focused on personnel selection (Ployhart & Ward, 2013). The use of SJTs has expanded and evolved over time, and now includes domains such as education, certification testing, and training & development.
The purpose of this sub-section is to provide a recent example of an SJT in a non-security related field. Jesiek, Woo, Parrigon, & Porter (2020) developed a situational judgment test for global engineering competency (GEC) in Chinese national/cultural context. The authors identified three dimensions of GEC: technical coordination; engineering cultures; and ethics, standards, and regulations. The three dimensions were used to guide the creation of situational items for the GEC-SJT. The GEC-SJT focused on the behavioral tendencies of the respondents and each situational item consisted of an item stem, response options, and the respondent being asked to rate the effectiveness of each response option on a 10-point scale. Table 3 provides an example SJT item from the GEC-SJT.
Table 3. GEC-SJT Example Item
As an American software engineer, you are working as a consultant for a Chinese software firm in Shenzhen. While helping to debug a new firewall application the firm is developing for the Propaganda Department of the Central Committee of the Communist Part y of China (CPC), you discover that the application uses a block of code originally developed at an American research university. The terms of use for this code indicate that it can be freely used for research, but not commercial purposes. The project deadline is rapidly approaching, and the central government is eager to have the firewall software to help deal with the problem of Internet addiction among Chinese youth. What would you do in this situation?
(Please rate the effectiveness of each item below on a scale from 1 = Not at all effective to 10 = Very effective)
Not at all effective
Very effective
Ask some Chinese colleagues for advice on how to handle the situation.
Suggest that the software firm negotiate a deadline extension so the problematic block of code can be licensed or rewritten.
Ignore the issue.
Report the issue to the American research university which controls the code.
Note. From Jesiek, B. K., Woo, S. E., Parrigon, S., & Porter, C. M. (2020). Development of a situational judgment test for global engineering competency.
The authors implemented a three -step process for developing the key elements of their GEC -SJT. The first step was to create hypothetical work situations, the second step was to generate behavioral response options, and the third step was to select the final set of SJT items and generate scoring keys using the rational approach. Once development was complete, the authors recruited 400 practicing engineers to participate in taking the GEC-SJT. The GEC-SJT scores were calculated based on the convergence between the respondent’s effectiveness ratings of the response items and the effectiveness ratings previously given by the SMEs. Specifically, the authors completed the following steps in the scoring process (p. 480):
1. Calculated the difference between the participant’s response & the SME rating for each item.
2. Squared the difference.
3. Took the mean of the differences across all items.
4. Multiplied the values by -1 so that higher scores (i.e., those closer to zero) represent SJT ratings that are more similar to the SME ratings.
For their analytic strategy, the authors calculated bivariate (Pearson) correlations among all the collected study variables to examine the relationships
between GEC-SJT performance scores and the other variables. For the specific results of the analysis and further discussion see Jesiek et al.’s (2020) full paper.
The purpose of this section is to compare SJTs with Likert-scale and Scenario vignette measurement methods which are prominently used in behavioral IS security research
A Likert-scale is a type of rating scale that is used to measure a variety of latent constructs, opinions, attitudes, and/or behaviors. A typical Likert -scale provides a question or statement followed by a series of five or seven response options. The respondent then chooses the response option that best corresponds wit h how they feel about the statement or question. Common Likert-scale response options include Agree – Disagree, Satisfied – Dissatisfied, and Always –Never.
In Kannelønning & Katsikas’ (2023) literature review of how cybersecurity-related behavior has been assessed they stated that “the most common way to collect subjective data is using a questionnaire with questions whose answers fit into a five - or seven-point
Likert scale” (p. 5). Likert -scales provide researchers with a simple method for gathering d ata on a continuum that is quantifiable. However, the interpretation of response options can vary between respondents (Dawes, 2008). For example, respondent A’s understanding of the option “Somewhat agree” could be different than respondent B’s understandi ng when taking the same survey.
Since the Likert-scale format is commonly used it has the benefit of providing familiarity, comfort, and ease of use for respondents. They are also typically low effort to complete and produce data in a consistent format that is easy to analyze. However, Likert -scale items are unable to obtain fine -grained information such as the actions a respondent would likely take in a given situation or if a respondent is factually knowledgeable about a topic.
Table 4 provides a Likert -scale item from Aurigemma & Mattson (2017) and a potentially comparable SJT item. The Likert -scale example aims to measure the perceived controllability of the respondent. According to Aurigemma & Mattson (2017), “perceived controllability addresses beliefs about the extent to which performing the behavior is up to them [the respondent] to carry out” (p. 221).
In comparison, the SJT example presents a realistic hypothetical work-related situation in which a coworker is violating the organization’s ISP and it asks the respondent what they would do from the given response options. The SJT example response instruction is worded using “would” so it would be placed in the behavioral tendency response category which correlates with typical performance.
Therefore, if a researcher is wanting to know to what extent a respondent believes it is in their control to enforce the ISP on their coworkers then the Likert -
Likert-scale Example
(Aurigemma & Mattson, 2017)
Carefully read the statement below and indicate your level of agreement or disagreement using the scale provided.
Enforcing specific guidance and actions directed in the ISP on your coworkers is within your control.
1 – Strongly disagree
2 – Disagree
3 – Somewhat disagree
4 – Neither agree nor disagree
5 – Somewhat agree
6 – Agree
7 – Strongly agree
scale item is appropriate to use, but if a researcher wants to know more fine-grained information such as the typical performance/behavior to expect from a respondent when placed in a situation in which a coworker is violating the ISP then the SJT item is more appropriate to use. The SJT could also be slightly modified in its response instructions to gather other types of information, such as changing “would” to “should” would make the SJT item knowledge focused instead of behavioral tendency focused.
SJT response instructions can also be formatted as a Likert-scale. For example, Weekley & Ployhart (2005) provide an SJT example that has five response options, and the respondent is asked to rate each option using a 6-point Likert-scale ranging from (1) highly ineffective to (6) highly effective. Utilizing the Likertscale in an SJT item could allow a researcher to gain the benefits provided from both measurement methods.
Scenario measurement methods are often used in behavioral IS security research. Aurigemma & Mattson (2019) identified eight research papers in toptier IS journals, ranging from 2009 to 2018, that utilized scenario vignettes including Chen et al. (2012), D’Arcy et al. (2014), D’Arcy et al. (2009), Guo et al. (2011), Johnston et al. (2015), Lowry & Moody (2015), Moody et al. (2018), and Siponen & Vance (2010).
All eight papers utilize a similar approach for their scenario-based measurement tool. Each study presented participants with at least one security related scenario (most of the studies presented more than one
SJT Example
While speaking with a coworker about using multifactor authentication they tell you that they found a way to bypass it, which is a violation of your organizations ISP. What would you do?
A. Tell your coworker that bypassing any security controls is a violation of your organizations ISP.
B. Ask your coworker to show you how to bypass the multifactor authentication for your own use.
C. Report the ability to bypass the multifactor authentication to the organization’s security team.
D. Change the topic of the conversation and take no further actions.
scenario), followed by a series of questions/state ments related to the scenario. All eight papers used Likertscales to rate various statements associated with the scenario(s) for the majority of their measurement tool. The left side of Table 5 provides a scenario example adapted from D’Arcy et al. (2014) and a small selection of the scenario-specific items participants were presented. The right side of Table 5 provides an SJT item for comparison.
Although the behavioral IS security scenario vignettes and SJTs both present participants with realistic hypothetical scenarios/situations, they have quite a few differences. SJTs present response options for participants to select from or rate while scenario vignettes present statements/questions related to the scenario that are assessed individually. For example, a single scenario vignette can have numerous statements/questions for participants to respond to while SJTs usually only have four to six response options per item that are assessed in conjunction. Another difference between the two measurement methods is that SJT items are specifically work/jobrelated while scenarios can cover broader topics.
While the use of scenario vignettes is appropriate for measuring the opinions, attitudes, and beliefs of respondents, SJTs are better suited to measure typical and maximal performance of individuals in an
organization. For example, statement 1 of the Scenario example in Table 5, “I could see myself sharing the password as Jim did”, measures ISP violation intention (D’Arcy et al., 2014) while the SJT example would measure the participants typical performance/behavior when presented with a situation about sharing their password. A participant selecting “strongly disagree” as their answer for statement 1 would indicate their ISP violation intention, but it would not provide detailed information about the actions they would likely take in that scenario.
Factorial surveys are another form of the scenario measurement method which have previously been used in behavioral IS security research. Factorial surveys are a “powerful tool for the study of human evaluation processes” or in other words how humans judge things (Rossi & Anderson, 1982, p. 15). Like the scenario-based method and SJTs, factorial surveys present respondents with hypothetical scenarios to evaluate (Rossi & Anderson, 1982; Jasso, 2006). However, the characteristics of the scenarios utilized in a factorial survey are varied to see how the changes impact the outcome variable of interest (Jasso, 2006). The types of questions respondents are asked about in a factorial survey align with that of the typical scenario method as shown in 2015 by Vance et al.’s use of the factorial survey method to address the problem of
(D’Arcy et al., 2014)
Jim is an employee in your organization. One day while Jim is out of the office on a sick day, one of his coworkers needs a file on Jim's computer. The coworker is of equal rank and performs job functions similar to Jim's. The coworker calls Jim and asks for the password. Although Jim knows that your organization has a policy that passwords must not be shared, he shares his password with the coworker.
Consider the scenario in the context of your organization and carefully read the statements below and indicate your level of agreement or disagreement using the scale provided.
1 – Strongly disagree 5 – Somewhat agree
2 – Disagree 6 – Agree
3 – Somewhat disagree 7 – Strongly agree
4 – Neither agree nor disagree
1. I could see myself sharing the password as Jim did.
2. It is against my moral belief to do what Jim did in that situation.
3. Jim would receive harsh sanctions for sharing the password.
4. It is alright to share a password to get work done quicker.
5. Sharing a password really won’t hurt the organization.
Your boss messages you on your day off and says they locked themselves out of a system only the two of you can access, they ask you to provide your password over the phone so they can access the system. What would you do?
A. Message your password to your boss.
B. Remind your boss that it is against company policy to share passwords.
C. Ignore your boss’s message.
D. Lie and tell your boss you can’t remember your password.
access-policy violations. Therefore, SJTs and factorial surveys differ in how the hypothetical scenarios are presented to respondents, the types of questions respondents are asked, and the overall goal of the research method.
Although scenario vignettes (including factorial surveys) and SJTs do have some structural commonalities, their differences lie in the type of data that is collected and what each one aims to measure. SJTs would be more advantageous to use, compared to scenarios and factorial surveys, when a researcher would like to measure the typical (behavio ral tendency) or maximal (knowledge) performance of individuals in an organization. Both scenarios and SJTs have the benefit of providing clear links to training interventions in which the situations can be used to teach employees the preferred responses to the situation and potential risks to the organization from making other behavioral choices.
SJTs are a prominent measurement method in I -O psychology that behavioral IS security research could benefit from utilizing. SJTs would provide a different perspective than Likert-scale and scenario vignettes which currently dominate the field. Since SJTs are built upon realistic job- and work-related situations, they are able to provide researchers the opportunity to ensure their field survey instruments are fitting to the organizational or environmental conditions of their sample frame. They also can be used to gather refined and focused data specific to individual organizations.
The flexibility and multidimensionality of SJTs make them a highly versatile measurement method that could be used for multiple research endeavors within IS. One research area in behavioral IS security that the use of SJTs could prove beneficial is in measuring information security culture in organizations (Phillips et al. , 2023).
Overall, SJTs would be a valuable measurement method for IS security researchers to consider when designing research projects. The capabilities of SJTs shown in other fields could also be used to influence new research ideas in the context of IS security.
Acknowledgements
The authors acknowledge support from Tulsa Innovation Labs via the Cyber Fellows Initiative.
Aurigemma, S., & Mattson, T. (2017). Privilege or procedure: Evaluating the effect of employee status on intent to comply with socially interactive information security threats and controls. Computers & Security, 66, 218–234. https://doi.org/10.1016/j.cose.2017.02.006
Aurigemma, S. & Mattson, T. (2019). Generally Speaking, Context Matters: Making the Case for a Change from Universal to Particular ISP Research. Journal of the Association for Information Systems, 20(12). https://doi.org/10.17705/1jais.00583
Chan, D., & Schmitt, N. (1997). Video-based versus paperand-pencil method of assessment in situational judgment tests: Subgroup differences in test performance and face validity perceptions. Journal of Applied Psychology, 82(1), 143-159. https://doi.org/10.1037/0021-9010.82.1.143
Chen, Y., Ramamurthy, K., & Wen, K. -W. (2012). Organizations’ information security policy compliance: Stick or carrot approach?. Journal of Management Information Systems , 29(3), 157-188.
D’Arcy, J., Herath, T., & Shoss, M. K. (2014). Understanding employee responses to stressful information security requirements: A coping perspective. Journal of Management Information Systems, 31(2), 285-318.
D’Arcy, J., Hovav, A., & Galletta, D. (2009). User awareness of security countermeasures and its impact on information systems misuse: a deterrence approach. Information Systems Research, 20(1), 79-98.
Davison, R. M., & Martinsons, M. G. (2016). Context is king! Considering particularism in research design and reporting. Journal of Information Technology, 31(3), 241-249.
Dawes, J. (2008). Do data characteristics change according to the number of scale points used? An experiment using 5-point, 7-point and 10-point scales. International Journal of Market Research, 50(1), 61–104. https://doi.org/10.1177/147078530805000106
De Leng, W. E., Stegers-Jager, K. M., Husbands, A., Dowell, J. S., Born, M. Ph., & Themmen, A. P. (2016). Scoring method of a situational judgment test: Influence on internal consistency reliability, adverse impact and correlation with personality?. Advances in Health Sciences Education, 22(2), 243–265. https://doi.org/10.1007/s10459-016-9720-7
Guo, K. H., Yuan, Y., Archer, N. P., & Connelly, C. E. (2011). Understanding nonmalicious security violations in the workplace: A composite beha vior model. Journal of Management Information Systems, 28(2), 203-236.
Jasso, G. (2006). Factorial Survey Methods for Studying Beliefs and Judgments. Sociological Methods & Research, 34(3), 334–423. https://doi.org/10.1177/0049124105283121
Jesiek, B. K., Woo, S. E., Parrigon, S., & Porter, C. M. (2020). Development of a situational judgment test for global engineering competency. Journal of
Engineering Education, 109(3), 470–490. https://doi.org/10.1002/jee.20325
Johnston, A. C., Warkentin, M., & Siponen, M. (2015). An enhanced fear appeal rhetorical framework: Leveraging threats to the human asset through sanctioning rhetoric. MIS Quarterly, 39(1), 113- 134.
Karakolidis, A., O’Leary, M., & Scully, D. (2021). Animated videos in assessment: Comparing val idity evidence from and test-takers’ reactions to an animated and a text-based situational judgment test. International Journal of Testing, 21(2), 57–79. https://doi.org/10.1080/15305058.2021.1916505
Kannelønning, K., & Katsikas, S. K. (2023). A systemati c literature review of how cybersecurity-related behavior has been assessed. Information & Computer Security https://doi.org/10.1108/ics-08-2022-0139
Landers, R. N., Auer, E. M., & Abraham, J. D. (2020). Gamifying a situational judgment test with Immersio n and Control Game Elements. Journal of Managerial Psychology, 35(4), 225–239. https://doi.org/10.1108/jmp-10-2018-0446
Lowry, P. B., & Moody, G. D. (2015). Proposing the control‐reactance compliance model (CRCM) to explain opposing motivations to comply with organisational information security policies. Information Systems Journal, 25(5), 433-463.
McDaniel, M. A., Hartman, N. S., Whetzel, D. L., & Grubb, W. L. (2007). Situational Judgment Tests, Response Instructions, and Validity: A Meta-analysis. Personnel Psychology, 60(1), 63-91. https://www.proquest.com/scholarlyjournals/situational -judgment-tests-responseinstructions/docview/220135151/se-2
Mielke, I., Breil, S. M., Amelung, D., Espe, L., & Knorr, M. (2022). Assessing distinguishable social skills i n medical admission: Does construct-driven development solve validity issues of situational judgment tests? BMC Medical Education, 22, 1–11. https://doi.org/10.1186/s12909-022-03305-x
Moody, G. D., Siponen, M., & Pahnila, S. (2018). Toward a unified model of information security policy compliance. MIS Quarterly, 42(1), 285-311.
Oostrom, J. K., De Soete, B., & Lievens, F. (2015). Situational Judgment Testing: A review and some new developments. Employee Recruitment, Select ion, and Assessment: Contemporary Issues for Theory and Practice, 172–189. https://doi.org/10.4324/9781315742175-18
Oostrom, J. K., de Vries, R. E., & de Wit, M. (2018). Development and validation of a HEXACO situational judgment test. Human Performance, 32(1), 1–29. https://doi.org/10.1080/08959285.2018.1539856
Phillips, S., Brummel, B., Aurigemma, S., & Moore, T. (2023). Information Security Culture: A look Ahead at Measurement Methods. In Proceedings of the Annual Information Institute Conference, Eds. Dhillon, G.; Furnell, S. Demetis, D; and Srivastava, S. May 9 – May 10, 2023. Las Vegas, NV. USA
Ployhart, R. E., & MacKenzie, W. I. (2011). Situational judgment tests: A critical review and agenda for the future. APA Handbook of Industrial and
Organizational Psychology, Vol 2: Selecting and Developing Members for the Organization., 237–252. https://doi.org/10.1037/12170-008
Ployhart, R. E., & Ward, A.-K. (2013). Situational Judgment Measures. APA Handbook of Testing and Assessment in Psychology, Vol. 1: Test Theory and Testing and Assessment in Industrial and Organizational Psychology., 551–564. https://doi.org/10.1037/14047030
Pollard, S., & Cooper-Thomas, H. D. (2015). Best practice recommendations for Situational Judgment tests. Australasian Journal of Organisational Psychology, 8. https://doi.org/10.1017/orp.2015.6
Rossi, P. H., & Anderson, A. B. (1982). The Factorial Survey Approach: An Introduction. In Measuring Social Judgments (pp. 15–67). essay.
Siponen, M., Klaavuniemi, T., & Xiao, Q. (2023). Splitting versus lumping: Narrowing a theory’s scope may increase its value. European Journal of Information Systems, 1–10. https://doi.org/10.1080/0960085x.2023.2208380
Siponen, M., & Vance, A. (2014). Guidelines for improving the contextual relevance of field surveys: The case of information security policy violations. European Journal of Information Systems, 23(3), 289–305. https://doi.org/10.1057/ejis.2012.59
Siponen, M., & Vance, A. (2010). Neutralization: New insights into the problem of employee systems security policy violations. MIS Quarterly, 34(3), 487-502.
St-Sauveur, C., Girouard, S., & Goyette, V. (2014). Use of situational judgment tests in personnel selection: Are the different methods for scoring the response options equivalent? International Journal of Selection and Assessment, 22(3), 225–239. https://doi.org/10.1111/ijsa.12072
Vance, A., Lowry, P. B., & Eggett, D. (2015). Increasing Accountability Through User-Interface Design Artifacts: A New Approach to Addressing the Problem of Access-Policy Violations. MIS Quarterly, 39(2), 345–366. https://doi.org/10.25300/misq/2015/39.2.04
Weekley, J. A., & Ployhart, R. E. (2005). An Introduction to Situational Judgment Testing. Situational judgment tests: Theory, Measurement and Application, 1-10. Psychology Press
Weekley, J. A., Ployhart, R. E., & Holtz, B. C. (2005). On the Development of Situational Judgment Tests: Issues in Item Development, Scaling, and Scoring. Situational judgment tests: Theory, Measurement and Application 157–182. Psychology Press.
Weng, Q. (Derek), Yang, H., Lievens, F., & McDaniel, M. A. (2018). Optimizing the validity of situational judgment tests: The importance of scoring methods. Journal of Vocational Behavior, 104, 199–209. https://doi.org/10.1016/j.jvb.2017.11.005
Whetzel, D. L., Sullivan, T. S., & McCloy, R. A (2020). Situational judgment tests: An overview of development practices and psychometric characteristics. Personnel Assessment and Decisions, 6(1). https://doi.org/10.25035/pad.2020.01.001
About Cameron
Professional Experience Preference
●
●
Working Location Preference
Internships / RA / TA / Work History
Author:
Advisor:Dr.
Logan Quirk
Rose Gamble
School of Cyber Studies
Extended Abstract
In December 2021, the National Institute of Standards and Technology (NIST) released NIST SP800-160 Vol. 2, Rev. 1: Developing Cyber Resilient Systems – A Systems Security Engineering Approach (NIST, 2021). This supporting document to the NIST SP800-160 Vol. 1 (NIST, 2021) focuses on developing cyber-resilient systems, which are internet-enabled systems capable of running in an environment with advanced persistent threats (APTs) while still achieving mission-essential objectives, despite faults, failures, and otherwise degraded states. The NIST SP800-160v2 identifies techniques geared towards enabling cyber-resilient systems. It takes the concept of a holistic cyber-resilient system and breaks it down into Candidate Mitigations (CMs), which are defined as general strategies to mitigate specific threats to cyber systems (NIST, 2021). The CMs are mapped to threats that are represented as adversary techniques detailed in MITRE’s ATT&CK Enterprise Matrix (NIST, 2021). This knowledge base is a well-respected source for representing and simulating possible threats to enterprise systems (Xiong et al., 2022) (Georgiadou, Mouzakitis, and Askounis, 2021). A given CM possesses multiple cyber resiliency controls (CRC), also detailed in the NIST SP800-160v2 that provide atomic actions a system can perform that supports the CM. This starting point identifies possible responses to a given attack technique, assuming its detection. Unfortunately, the connection between adversary threats and CMs, and thus CRCs, does not constitute a perfect solution. NIST SP800-160v2 states that the mappings do not include any conventional security methods that do not possess CRC defined in the document (NIST 2021, p. 162). Furthermore, for a given threat technique there are often multiple different CMs which each possess multiple different CRC’s. Some of these CRC’s may be applicable, while some may not be due to hardware, software, permission, or more general technological and fiscal constraints. Furthermore, if there are multiple possible CRC-based approaches, and only one is necessary, a decision needs to be made regarding which approach is chosen, including any possibly effective approaches that are not defined in the document.
The NIST SP800-160v2 also identifies cyber resiliency techniques used to provide a vocabulary on relevant approaches to achieve a resilient system (NIST, 2021, p. 12). One technique, called Adaptive Response, stands out as the most comprehensive and challenging approach for cyber resiliency. Adaptive Response incorporates nearly all other defined techniques, yet it operates without any defined conflicts with those techniques (NIST, 2021, p. 91). Thus, implementing Adaptive Response is a more efficient strategy than other defined techniques. It is characterized by the adoption of flexible strategies to mitigate risks in a contextual manner. A system that successfully utilizes adaptive capabilities should be able to use real-time information to “understand and consistently act upon … cybersecurity risks” as well as “adapt its cybersecurity practices based on lessons learned and predictive indicators” (NIST, 2024). Two distinct systems that employ Adaptive Response as their main approach may differ in their choices of mitigation for a specific threat, since the context of each system influences such decisions. In the NIST Cybersecurity
Framework 2.0, NIST identified an adaptive organization as the highest tier of cyber-resilience (NIST, 2024).
Despite breaking down and explaining the benefits of the Adaptive Response technique, NIST SP 800-160v2 states itself that it “is not intended to provide a ‘recipe’ for execution or a ‘cookbook’ approach to developing cyber-resilient systems. Rather, the publication can be viewed as a tutorial for achieving the identified cyber resiliency outcomes from a systems engineering perspective, leveraging the experience and expertise of the individuals in the organization to determine what is correct for its purpose” (NIST, 2021, p. 5). It also states that it is designed for stakeholders to pick and choose which constructs defined in the document to implement (NIST 2021). While this makes the document flexible and widely applicable, it provides little constructive advice towards implementing the constructs it describes, including the Adaptive Response technique.
Significant research has been performed on Self-Adaptive Systems (SAS) (Weyns et al., 2013) that may provide a foundation on which to determine how best to deploy an adaptive response that meets the NIST SP800-16v2 guidelines (Jahan et al., 2020) (Jahan et al., 2019). One of the long-standing processes used in SAS is the Monitor-Analyze-Plan-Execute (MAPE) loop (IBM, 2006). If historical or streaming knowledge is used to inform the MAPE loop, it is often referred to as the MAPE-K control loop. Under the context of a cyber resilient system, the Monitor and Analyze steps of the MAPE-K loop can be represented with an Intrusion Detection System (IDS) that can be adapted or, at least, tunable to properly achieve the goals of a MAPE-K loop (Riley, 2023). However, within the context of an IDS, the Planning and Execution stages of the loop often require human intervention due to the dynamic nature of APT’s, the open-ended nature of threat response, and the consequences of drastic response actions. The necessity of human interaction often reduces the effectiveness of an automated response and removes the possibility for embedding a self-awareness component that uses a MAPE-K loop to make real-time decisions. Requiring human intervention can also be a cumbersome process, with a human needing to evaluate the level of system compliance with possible responses and evaluate the post-response state of the system for additional mitigation. The requirement for leads to the common criticism of MAPE-K loops - that they are only applicable in advanced systems, built with their inclusion in mind and not applicable to legacy systems where human intervention is constantly required (Jahan et al., 2021). To achieve a truly adaptive response and the benefits prescribed in NIST SP800-160v2, there needs to be an adaptable component that is capable of planning and executing adaptations without constant supervision. The system should be able to distinguish whether human supervision is explicitly required in cases where it lacks the permissions to execute mitigations autonomously.
This work explores the addition of a software component designed to identify possible autonomous responses to threats, choose which should be executed, and then execute them if the necessary permissions are possessed. Research is being conducted on defining how NIST CMs are chosen to be both related to the alert and executable by the components within its scope, how adaptations are chosen based on the selected NIST CMs, and how to know when NIST CMs are insufficient. Various approaches are being evaluated, such as exploring the extent to which the knowledge component of the MAPE-K loop can itself be adapted and what form that could take, defining a layer to communicate with the target system to execute planned adaptations (with legacy constraints in mind), and prescribing a method that identifies when CMs as adaptations are chosen exclusively based on mappings to MITRE’s ATT&CK matrix and/or when adaptations are chosen based on predicted cost-effectiveness. Additional investigating includes how the limitations of other components of the system, like the monitoring agent and the architecture of the target system, affect the selection of CM’s and adaptations.
References
Georgiadou, A., Mouzakitis, S., & Askounis, D. (2021). Assessing MITRE ATT&CK Risk Using a CyberSecurity Culture Framework. Sensors, 21(9), 3267. https://doi.org/10.3390/s21093267
IBM. (2006, January). An architectural blueprint for autonomic computing. [Technical report]
Jahan, S., Pasco, M., Gamble, R., McKinley, P., & Cheng, B. (2019). MAPE-SAC: A framework to dynamically manage security assurance cases. In 2019 IEEE 4th International Workshops on Foundations and Applications of Self Systems (FASW) (pp. 146-151). Umea, Sweden. https://doi.org/10.1109/FAS-W.2019.00045
Jahan, S., Riley, I., Sabino, A., & Gamble, R. (2021). Towards a plug-in architecture to enable selfadaptation through middleware. In 2021 IEEE International Conference on Autonomic Computing and Self-Organizing Systems Companion (ACSOS-C) (pp. 214-219). Washington, DC, USA. https://doi.org/10.1109/ACSOS-C52956.2021.00054
Jahan, S., Riley, I., Walter, C., Gamble, R. F., Pasco, M., McKinley, P. K., & Cheng, B. H. C. (2020).
MAPE-K/MAPE-SAC: An interaction framework for adaptive systems with security assurance cases. Future Generation Computer Systems, 109, 197–209. https://doi.org/10.1016/j.future.2020.03.031
National Institute of Standards and Technology. (2024). The NIST Cybersecurity Framework (CSF) 2.0. (NIST CSF 2.0) US Dept. of Commerce. https://doi.org/10.6028/NIST.CSWP.29
NIST. (2021). Developing cyber-resilient systems: A systems security engineering approach (NIST SP 800-160, Vol. 2 Rev. 1). US Dept. of Commerce.
Riley, I., Marshall, A., Quirk, L., & Gamble, R. (2023). An Architectural Design to Address the Impact of Adaptations on Intrusion Detection Systems. Proceedings of the 56th Hawaii International Conference on System Sciences . Hawaii International Conferen ce on System Sciences 2023, University of Hawaiʻi at Mānoa. https://hdl.handle.net/10125/103466
Weyns, D., Schmerl, B., Grassi, V., Malek, S., Raffaela Mirandola, Prehofer, C., Wuttke, J., Andersson, R., Giese, H., & Göschka, K. M. (2013). On Patterns for Decentralized Control in Self-Adaptive Systems. Lecture Notes in Computer Science, 7475, 76–107. https://doi.org/10.1007/978-3-64235813-5_4
Xiong, W., Legrand, E., Åberg, O., & Lagerström, R. (2021). Cyber Security Threat Modeling Based on the MITRE Enterprise ATT&CK Matrix. Software and Systems Modeling, 21, 157–177. https://doi.org/10.1007/s10270-021-00898-7
Biographies
About Logan Quirk: Logan Quirk is a second-year PhD student in the Cyber Studies Program at the University of Tulsa. Logan completed their B.S. in Computer Science in 3 years at the University of Tulsa in 2022. Throughout his undergraduate degree at TU, he has worked on a variety of internships including the university's TURC program and the U.S. Navy's NREIP program. More recently he has been working with the University of Tulsa on ERDC funded projects including developing a prototype Self-Adaptive Network-Based Intrusion Detection System and a Semantic Complex Event Processor Engine for the purposes of facilitating smart buildings. This has led to various publications ofverSelf-Adaptive Systems and advanced software architecture.
About Rose Gamble: As vice president for research and economic development, Rose Gamble leads the activities surrounding the growth of the university research enterprise. This role oversees the Office of Research and Sponsored Programs, which manages proposal preparation and guidance, contracting with federal, state, corporate, and philanthropic partners and project award funding; the Technology Transfer Office, which manages the university intellectual property committee, invention disclosure, patent application and commercial licensing; and Research Compliance, which manages human and animal studies.
Prior to this role, Gamble served as the senior associate dean in TU’s College of Engineering and Natural Sciences where she worked with faculty on acquiring external research funding from public, private and philanthropic institutions. As the Tandy Professor of Computer Science and Engineering, Gamble’s research has focused on self-adaptive, autonomous systems, information system security and human-machine teaming.
Gamble graduated summa cum laude from Westminster College with a bachelor’s degree in mathematics and computer science. She received a master’s in computer science and a doctorate from Washington University in St. Louis, Missouri
About Cameron

Professional Experience Preference
●
●
Working Location Preference
Internships / RA / TA / Work History


S M Zia Ur Rashid and Weiping Pei
Abstract
The detection and prevention of money laundering operations pose a significant challenge for financial industries, owing to the prevalence of annotated datasets and the complexity of illicit networks involved. The objective of this research initiative is to apply unsupervised techniques for detecting anomalies in graphs as part of the anti-money laundering (AML) system, leveraging the capabilities of Graph AutoEncoders (GAEs) to uncover latent representations of financial transactions and relationships. We prioritize an unsupervised approach since it is extremely difficult to get real -world anti-money laundering (AML) datasets which do not often contain pre-labeled instances of fraud or money laundering.
Graph-based representations of financial networks capture a wealth of transactional and relational data within a unified structure. However, identifying and interpreting meaningful patterns within this data can be challenging, especially given the complexity of these networks. Our findings indicate that in homogeneous graphs where every node and edge is of the same kind Graph Auto-Encoders (GAEs) offer a useful remedy for this issue. GAEs are particularly effective in distilling latent representations by encoding the graph structure into a latent space and t hen reconstructing it, a process that unveils the fundamental properties of nodes and their interrelations. These latent representations, which encapsulate critical node attributes and edge dynamics, provide a profound insight into the underlying network s tructure. This understanding is crucial for tasks like node classification or edge classification, which can be accomplished within an unsupervised learning framework, without the need for pre-labeled data.
Our study classifies anomalies relevant to anti-money laundering (AML) efforts into four main types: contextual, structural, joint-type, and structure-type anomalies. Contextual anomalies are identified by significant differences in the features of individual nodes compared to typical patterns. Structur al anomalies are found through unusual network structures, like densely connected subgraphs, indicating irregular interaction patterns. Joint-type anomalies involve connections between nodes with markedly different features, suggesting unusual cross-segment interactions. Structure-type anomalies, a broader category, include both structural and joint -type anomalies, highlighting irregularities in the network's overall structure and connectivity. Our approach seeks to enhance the detection of these anomalies using Graph Auto-Encoders (GAEs), with an explicit focus on the meticulous reconstruction of the entire neighborhood of a node. This encompasses not only the immediate structural connections but also the intrinsic attributes of the node and its adjacent counterparts, predicated upon the individual node's representation. This methodology aims to precisely discern anomalies by conducting a comparative analysis of the neighborhood reconstruction loss that is observed between anomalous nodes and their normal counterparts.
This research, positioned at the intersection of unsupervised learning and anti -money laundering, focuses on the use of Graph Auto-Encoders (GAEs) for anomaly detection in financial networks. Although in its initial stages and without state-of-the-art results, it lays the groundwork for future advancements. The project aims to develop a scalable framework that leverages latent feature learning of GAEs, aspiring to improve the detection of sophisticated money laundering schemes and thus enhance global financial security. Through ongoing exploration, it seeks to contribute foundational insights to the field.
Index Terms – Anomaly Detection; Anti-Money Laundering; Fraud Detection; Unsupervised Learning; Graph Neural networks
References
[1] Tang, Mingyue, Carl Yang, and Pan Li. "Graph auto-encoder via neighborhood wasserstein reconstruction." arXiv preprint arXiv:2202.09025 (2022).
[2] Altman, Erik, et al. "Realistic synthetic financial transactions for anti -money laundering models." Advances in Neural Information Processing Systems 36 (2024).
[3] Egressy, Béni, et al. "Provably Powerful Graph Neural Networks for Directed Multigraphs." Proceedings of the AAAI Conference on Artificial Intelligence. Vol. 38. No. 10. 2024.
[4] Ai, Xing, et al. "Graph Anomaly Detection at Group Level: A Topology Pattern Enhanced Unsupervised Approach." arXiv preprint arXiv:2308.01063 (2023).
[5] ensen, R.I.T., Ferwerda, J., Jørgensen, K.S. et al. A synthetic data set to benchmark anti-money laundering methods. Sci Data 10, 661 (2023). https://doi.org/10.1038/s41597-023-02569-2
[6] Cardoso, Mário, Pedro Saleiro, and Pedro Bizarro. "LaundroGraph: Self -Supervised Graph Representation Learning for Anti-Money Laundering." Proceedings of the Third ACM International Conference on AI in Finance. 2022.
[7] Roy, Amit, et al. "GAD-NR: Graph Anomaly Detection via Neighborhood Reconstruction." Proceedings of the 17th ACM International Conference on Web Search and Data Mining. 2024.
About S M Zia Ur Rashid
Zia is a graduate student in the School of Cyber Studies at The University of Tulsa (TU). He is a TU Cyber Fellows and member of the Security and Privacy Research Group led by Dr. Pei, working on an Anti-money Laundering project. His focus is on using Graph ML to detect malicious accounts and fraudulent transactions in Financial Networks. Prior to his graduate studies, Zia held the position of Information Security Specialist at Augmedix Inc. and was an active member in the Synack Red Team (SRT). His involvement in the cybersecurity community extends to serving as a reviewer for the Defcon AI Village, as well as volunteering for the Defcon Cloud Village and Defcon Red Team Village. He earned his bachelor degree in Electrical and Electronic Engineering from the International Islamic University Chittagong, Bangladesh in 2019.
About Weiping Pei
Weiping Pei, Ph.D., is an assistant professor in the School of Cyber Studies at The University of Tulsa. Her research interests are broadly in the area of security and privacy, crowdsourcing, machine learning, and human-computer interaction, with the recent focus on (1) secure and privacy -preserving crowdsourcing, (2) robust and reliable machine learning, and (3) usable security and privacy. She received Ph.D. degree in computer science from the Colorado School of Mines in 2022. Before that, she earned a B.Eng. degree in microelectronics and an M.Eng. degree in software engineering from the Sun Yat -sen University in 2015 and 2017, respectively.
Jack Tilbury LinkedIn
Jack - Tilbury@utulsa.edu
JackTilbury Google Scholar
● Security P roduct Manager
● Security,Risk & Resilient Strategy Consulting
● Security An alystOperations
● Research S cientist
Working Location Preference
Tulsa Area, Florida, Chicago, Washington, Remote
JackTilburyisasecond-yearPh.D.studentatTheUniversityofTulsa.Heobtained hisresearch-basedMCominInformationSystemsfromRhodesUniversity,South Africa,in2019.JackwasawardedafullscholarshiptopursuehisMaster'sdegree, whichexploredthePropTechindustry–conductingrealestatetransactionsthrough blockchaintechnology. HegraduatedatthetopofhisInformationSystemshonors classasheobtainedaBusinessScienceundergraduatedegree.Sincearrivingin Tulsa,JackhasattendedandpublishedattheAnnualSecurityConferenceandhas beeninvitedtopresentattheUNESCOSafetyConference.Hisresearchincludes informationsystems,behavioralinformationsecurity,andautomateddecisionaidsin securityoperationcenters.BeforestartinghisPh.D.research,Jackworkedasa ProductManagerintheITindustryattwosoftwaredevelopmentcompanies.
JackworkedfortwoyearsasaProductManagerwithexperienceinstart-upand corporateenvironments,buildingandlaunchingmultipleproductstomarket.Jackis eagertocontributetothedevelopmentofsecurityproductseitherthroughleading productteams,engagingwithproductcustomers,orconductingproductresearch.

Observations
Nathan Rendon, Reuben Kabantiyok, and Will LePage
AMDG Research Group, Department of Mechanical Engineering, University of Tulsa nrr8160@utulsa.edu, rzk8374@utulsa.edu and lepage@utulsa.edu
Introduction
Inclusions and surface defects are the primary drivers of fatigue failures for Nitinol. Surface defects can take the form of die marks [1], surface roughness [2], or scratches [3 -4], and when present, these will typically be the sites for fatigue failures [1]. When such surface defects are not present, however, surface-exposed inclusions become the primary sites of fatigue failures. Surface-exposed inclusions are either fully embedded (no surrounding voids) or particle -void assemblies (PVAs). PVAs are up to 600 times more likely to be the sites of crack nucleation compared to fully embedded particles [1], so they are of primary interest. PVAs typically take the form of a single, small, and unbroken inclusion with one or two associated voids (coined a "teardrop"), or a longer, drawn -out, and broken-up inclusion with many voids (coined a "stringer").
In medical-grade Nitinol, most PVAs are below critical flaw size (15 -50µm for Nitinol [5]), where critical flaw size is the threshold for flaws that are large enough for Murakami’s theory [6]. Below the critical flaw size, fatigue life is typically limited by the fatigue strength of the material, rather than defect characteristics. Nonetheless, defects below the critical flaw size may still be the initiation sites for fatigue failures in Nitinol [7 -10]. Correspondingly, the mechanisms of crack nucleation and propagation at these small PVAs are not well understood. Therefore, the focus of this work is to clarify the micromechanical behavior of fatigue damage and cracking at inclusions that are smaller than the critical flaw size, including quantitative observations of how the inclusions separate from the matrix during crack formation, toward modeling efforts that may include cohesive zone modeling and finite element analysis.
Methods
This work utilizes scanning electron microscope digital image correlation (SEM-DIC) to measure the micromechanical behavior of inclusions during fatigue loading. For the speckle patterns for SEM-DIC, gold nanoparticles (AuNPs) with a diameter of ~40 nm were used (made follo wing Frens [11]). The patterning process was based on prior works (on HP Al [12], Mg [13], and Nitinol [14]). However, the present work made notable improvements for pattern density, AuNP clumping minimization, and abbreviated patterning duration (reduced from at least 16 hours to less than 2.5 hours). Figure 1 shows an AuNP pattern produced from this work.
This work utilizes ELI SE508 tube that is laser cut, shape set flat, and electropolished (Confluent; Fremont, Calif.). The dogbone gauge section has mi nimized width, thereby reducing the number of inclusions that need to be tracked to identify the site of fatigue failure. The gauge section width was typically <200 µm, and the thickness typically was 275 -300 µm. Sample dimensions and material purity keep a small number (~10) of surface-exposed inclusions in the gauge section. The samples were subjected to force-controlled, constant amplitude tension -tension testing (R=0.1) frequencies of 5 to 30 Hz in ambient air (~21°C). Cycling was paused to collect SEM -DIC images. Once crack initiation was observed, intervals were shortened to better capture the stages of crack
progression leading to fracture. Fractography and surface analysis were performed on each sample to determine the geometry of relevant inclusions or surface defects.
To date, all damage has been observed at or around teardrop PVAs below critical flaw size during high cycle fatigue. No damage has been observed around stringer or fully embedded inclusions. Of the samples tested, one broke outside the gauge section due to a failure at a pinhole, while the remainder (5) broke due to inclusions present within the gauge section. During analysis, inclusion spans (measured perpendicular to the loading direction) were recorded for incl usions where failure was initiated and where damage, but not failure, was observed. Inclusions found to be the cause of failure had an average length of 3.71 µm. When inclusions other than the cause of failure, (but still showing some signs of damage) were included in the measurement, the average increased to 4.42 µm.
Plastic deformation around PVAs caused by fatigue represented a permanent strain of at least 10 %, as shown in Figure 2. In addition to quantifying the deformation present, SEM -DIC showed future plastic deformation progression paths by displaying damage not yet visible when viewed in an unloaded state.


2
images of damage progression around a PVA at a) 0 cycles, b) 20k cycles, and c) the SEM-DIC strain map of that damage.

Nathan Rendon received a bachelor's degree in mechanical engineering from TU in 2021 and immediately began work as a master’s student for the Advanced Materials Design Group (AMDG) run by Dr. LePage. He joined Cyber Fellows in the Fall of 2022 when he began his PhD work. His work focuses on nano-scale analysis of the high cycle fatigue performance of Nitinol, a common material for cardiovascular implants.
Reuben Kabantiyok is a Research Assistant and a Cyber Fellow at The University of Tulsa working toward his PhD. He received his BSc in Metallurgical Engineering from Ahmadu Bello University, Nigeria, and his MSc in Nanoscience and Nanotechnology from the University of Glasgow, United Kingdom. His research involves the use of materials analysis tools to characterize Nitinol with the specific interest of improving its fatigue performance and then using AI/ML tools to model its behavior.
William LePage is an Assistant Professor of Mechanical Engineering at The University of Tulsa, where he also received his B.S. in Mechanical Engineering in 2013. LePage earned his Ph.D. in Mechanical Engineering from the University of Michigan in 2018 and then worked as a postdoctoral research fellow at Michigan until 2020. Subsequently, he joined the faculty at Tulsa, where he leads the Advanced Materials Design Group (https://www.amdg.science). LePage's group seeks to understand and pioneer more durable a nd sustainable materials, with a current emphasis on metals for 3D printing and cardiovascular implants. LePage's group is known for combining unique pathways from metallurgy and surface science with advanced materials characterization techniques. LePage's group has conducted research projects with NASA, the National Science Foundation, the Office of Naval Research, the U.S. Army Engineer Research and Development Center, and private foundations. LePage has received the SMST Founder's Grant, the Haythornthwaite Foundation Research Initiation Grant, and the Faculty Early Career Development Program (CAREER) award from the National Science Foundation.
[1] M. Rahim et al., “Impurity levels and fatigue lives of pseudoelastic NiTi shape memory alloys,” Acta Materialia, vol. 61, no. 10, pp. 3667 –3686, Jun. 2013, doi: 10.1016/j.actamat.2013.02.054.
[2] J. Lai, H. Huang, and W. Buising, “Effects of microstructure and surface roughness on the fatigue strength of high-strength steels,” Procedia Structural Integrity, vol. 2, pp. 1213–1220, 2016, doi: 10.1016/j.prostr.2016.06.155.
[3] T. A. Sawaguchi, G. Kausträter, A. Yawny, M. Wagner, and G. Eggeler, “Crack initiation and propagation in 50.9 at. pct Ni -Ti pseudoelastic shape-memory wires in bending-rotation fatigue,” Metall Mater Trans A , vol. 34, no. 12, pp. 2847–2860, Dec. 2003, doi: 10.1007/s11661-003-0186-x.
[4] Z. H. Li, X. Y. Wang, C. Hong, Y. H. Lu, and T. Shoji, “Effect of scratch depth on high cycle fatigue behavior of Alloy 690TT stream generator tube,” Journal of Nuclear Materials, vol. 558, p. 153400, Jan. 2022, doi: 10.1016/j.jnucmat.2021.153400
[5] S. W. Robertson and R. O. Ritchie, “A fracture ‐ mechanics‐ based approach to fracture control in biomedical devices manufactured from superelastic Nitinol tube,” J Biomed Mater Res, vol. 84B, no. 1, pp. 26–33, Jan. 2008, doi: 10.1002/jbm.b.30840.
[6] Y. Murakami, “Effect of size and geometry of small defects on the fatigue limit,” in Metal Fatigue, Elsevier, 2019, pp. 39–59. doi: 10.1016/B978-0-12-813876-2.00004-2.
[7] Z. Lin, K. Pike, A. Zipse, and M. Schlun, “Nitinol Fatigue Investigation on Stent -Finish Specimens Using Tension-Tension Method,” J. of Materi Eng and Perform, vol. 20, no. 4–5, pp. 591–596, Jul. 2011, doi: 10.1007/s11665-010-9792-0.
[8] S. W. Robertson, A. R. Pelton, and R. O. Ritchie, “Mechanical fatigue and fracture of Nitinol,” International Materials Reviews, vol. 57, no. 1, pp. 1–37, Jan. 2012, doi: 10.1179/1743280411Y.0000000009.
[9] M. Launey, S. W. Robertson, L. Vien, K. Senthilnathan, P. Chintapalli, and A. R. Pelton, “Influence of microstructural purity on the bending fatigue behavior of VAR -melted superelastic Nitinol,” Journal of the Mechanical Behavior of Biomedical Materials, vol. 34, pp. 181–186, Jun. 2014, doi: 10.1016/j.jmbbm.2014.02.008.
[10] J. Frenzel, “On the Importance of Structural and Functional Fatigue in Shape Memory Technology,” Shap. Mem. Superelasticity, vol. 6, no. 2, pp. 213–222, Jun. 2020, doi: 10.1007/s40830-020-00281-3
[11] Frens G (1973) Controlled nucleation for the regulation of the particle size in monodisperse gold suspensions. Nat Phys Sci 241:20–22
[12] A. D. Kammers and S. Daly, “Self -Assembled Nanoparticle Surface Patterning for Improved Digital Image Correlation in a Scanning Electron Microscope,” Exp Mech, vol. 53, no. 8, pp. 1333–1341, Oct. 2013, doi: 10.1007/s11340-013-9734-5.
[13] A. Githens and S. Daly, “Patterning corrosion ‐ susceptible metallic alloys for digital image correlation in a scanning electron microscope,” Strain, vol. 53, no. 1, p. e12215, Feb. 2017, doi: 10.1111/str.12215.
[14] W. S. LePage et al., “Grain size effects on NiTi shape memory alloy fatigue crack growth,” J. Mater. Res., vol. 33, no. 2, pp. 91–107, Jan. 2018, doi: 10.1557/jmr.2017.395.
Jack Tilbury LinkedIn
Jack - Tilbury@utulsa.edu
JackTilbury Google Scholar
● Security P roduct Manager
● Security,Risk & Resilient Strategy Consulting
● Security An alystOperations
● Research S cientist
Working Location Preference
Tulsa Area, Florida, Chicago, Washington, Remote
Internships / RA / TA / Work History
Year Position
2022Present Doctoral Researcher
20202022 Product Manager
Employer
University of Tulsa
Flash Mobile Vending & The Delta, South Africa
2019 Assistant Lecturer and Teaching Assistant Rhodes University
2018 Software Implementation Analyst Saratoga, Cape Town
JackTilburyisasecond-yearPh.D.studentatTheUniversityofTulsa.Heobtained hisresearch-basedMCominInformationSystemsfromRhodesUniversity,South Africa,in2019.JackwasawardedafullscholarshiptopursuehisMaster'sdegree, whichexploredthePropTechindustry–conductingrealestatetransactionsthrough blockchaintechnology. HegraduatedatthetopofhisInformationSystemshonors classasheobtainedaBusinessScienceundergraduatedegree.Sincearrivingin Tulsa,JackhasattendedandpublishedattheAnnualSecurityConferenceandhas beeninvitedtopresentattheUNESCOSafetyConference.Hisresearchincludes informationsystems,behavioralinformationsecurity,andautomateddecisionaidsin securityoperationcenters.BeforestartinghisPh.D.research,Jackworkedasa ProductManagerintheITindustryattwosoftwaredevelopmentcompanies.
JackworkedfortwoyearsasaProductManagerwithexperienceinstart-upand corporateenvironments,buildingandlaunchingmultipleproductstomarket.Jackis eagertocontributetothedevelopmentofsecurityproductseitherthroughleading productteams,engagingwithproductcustomers,orconductingproductresearch.
About Cameron
Professional Experience Preference
●
●
Working Location Preference
Internships / RA / TA / Work History

Cyber
Fellow: Mohsen Saffari
Advisor: Dr. Mahdi Khodayar
Department of Computer Science
Introduction
Spatial correlations represent a fundamental concept that plays a pivotal role in characterizing relationships and patterns within data in various fields such as graph learning [1],[2] and image understanding [3],[4]. In graph learning, spatial correlations refer to the intrinsic depen dencies and structural interconnections between nodes in a network, encapsulating the idea that nodes in close proximity are more likely to share meaningful connections. These correlations enable the identification of cohesive communities and clusters within complex network structures, facilitating tasks such as community detection and spatial analysis in a myriad of applications, including social networks, geographic information systems, and transportation networks [5]. In image understanding, spatial correlations manifest as the intricate spatial relationships and contextual information between pixels or image regions, emphasizing that adjacent elements in an image exhibit correlated visual features. Leveraging spatial correlations is indispensable for tas ks such as object recognition, image segmentation, and scene understanding, where a nuanced understanding of the spatial arrangement of visual elements is crucial for accurate interpretation and decision-making [3].
With significant progress in computational capacity and the emergence of powerful GPUs, data-driven and machine learning (ML) techniques that leverage large datasets have attracted considerable attention in different real-world applications with spatial datasets. Spatial correlations find practical utility in modeling real-world applications, and one compelling instance is their application in the disaggregation of behindthe-meter (BtM) photovoltaic (PV) systems. In this context, spatial correlations serve as a robust framework for unraveling intricate relationships within BtM PV data. The BtM PV disaggregation problem involves accurately separating and analyzing electricity consumption and on-site PV generation in localized electrical systems to optimize energy management, enhance self-consumption of solar power, and reduce reliance on the grid through precise data-driven insights and control strategies.
Image classification and segmentation is another application that benefits from spatial correlations. Spatial correlations significantly enhance image classification and segmentation by providing crucial context and structure for visual data analysis. In image classification, recognizing objects is greatly improved as models leverage the spatial arrangement of pixels, enabling them to discern characteristic spatial configurations that aid in accurate categorization. Similarly, in image segmentation, spatial correlations play a vital role in boundary detection, as they help identify object boundaries by recognizing sharp pixel value t ransitions. Moreover, understanding the spatial relationships between regions within an image allows for precisely separating objects or areas of interest. Consequently, spatial correlations are integral in both tasks, facilitating more accurate and context-aware image analysis, thereby improving object recognition and finegrained segmentation, pivotal in various applications such as medical image analysis, autonomous driving, and scene understanding.
The current spatial and spatiotemporal studies have several notable shortcomings:
1. In traffic scene understanding, PV power generation forecasting, and load monitoring, deep neural architectures predominantly use discriminative ML approaches. These models focus on mapping input directly to output, potentially overlooking complex underlying data distributions. They may
struggle with tasks requiring comprehensive data structure understanding and lack versatility compared to generative models.
2. Studies within BtM PV disaggregation, load modeling, and traffic scene understanding lack integration of sparse coding and dictionary learning mechanisms. This omission leads to increased model complexity, making them computationally intensive and prone to overfitting, ultimately reducing their ability to generalize effectively.
In our research, we aim to address and rectify the drawbacks identified in the current studies across various domains, including BtM PV disaggregation and traffic scene understanding. To overcome these shortcomings, our research will focus on integrating sparse coding and dictionary learning mechanisms into our neural architectures in BtM PV disaggregation, and traffic scene understanding. By doing so, we aim to alleviate the heightened dimensionality, training complexity, and overfitting issues, ultimat ely enhancing the generalization capacity of these models. In the se domains, our research will place a strong emphasis on robustness to noise and uncertainties. We will develop strategies and techniques to account for real-world data disturbances, measurement inaccuracies, and environmental variability, ensuring that our models are resilient and reliable in the face of these challenges. Furthermore, our research endeavors to introduce an innovative probabilistic feature learning framework designed to captur e the complete probability distribution function of latent representations. This framework will play a pivotal role in augmenting the generalization capacity of our model by effectively encoding the intricate spatial representations inherent in the input graphical and image data.
In [2], we introduce a novel spatial and temporal spectral graph convolution capsule network (ST-SGCCaps) for BtM load and PV disaggregation. As shown in Fig. 1, we mathematically model the spatiotemporal information of the net demand in residential units by a weighted indirect graph where each node contains the temporal smart meter data of one residential unit, and each edge reflects the correl ation between the corresponding units. Then, spatiotemporal patterns are extracted by a novel attention -based LSTM and spectral graph convolution encoder. An attention peephole LSTM (APL) is proposed to capture the temporal correlation between the units. The proposed APL forces the model to selectively focus on the more relevant data sequences for the underlying disaggregation task. A spectral graph convolution (SGC) operation is proposed and incorporated into the APL to present the SGCAPL encoder that computes meaningful spatial and temporal information of the input dynamic graphs in an end-to-end fashion.
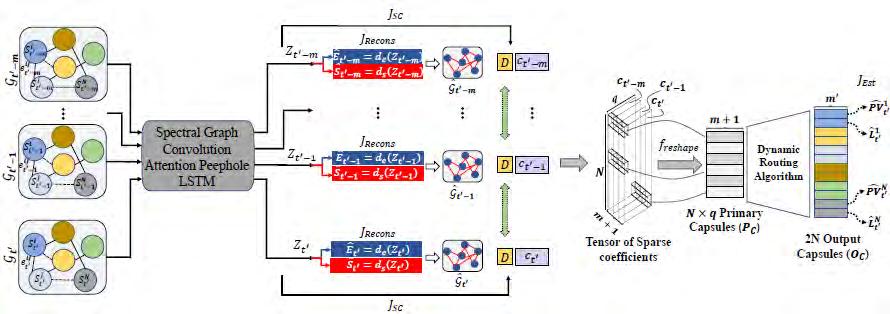
Figure 1: Our proposed ST-SGCCaps model for generative spatiotemporal BtM load and PV disaggregation [43].
Moreover, to enrich the extracted spatiotemporal features, we reconstruct the input graph using a novel generative graph decoder. Furthermore, we aim to boost the sparsity of the extracted spatiotemporal features using nonlinear sparse coding techniques. Therefore, we present a sparse coding (SC)-based objective function to encourage the model to learn a nonlinear dictionary matrix that effectively encodes the spatiotemporal patterns into a sparse representation that best describes the underlying dynamic graph. Finally, a Capsule network (CapsNet) is employed to decode the computed sparse codes and estimate the disaggregated values of the Btm load and PV generation. Experimental results of the proposed model on two real-world energy disaggregation datasets, Pecan Street and Ausgrid, demonstrate more than $9.8\%$ and $6.3\%$ RMSE improvements in BtM PV and load estimation over the state-of-the-art respectively.
In our recent research, presented in [3], we tackle the intricate problem of domain shift within the domain of traffic scene semantic segmentation. Our study introduces an unsupervised domain adaptation (UDA) model tailored to address complex domain shift challenges, notably when the dataset, we ather, and illumination significantly vary between source and target traffic scenes. Our innovative approach, termed sparse adversarial multi-target UDA, leverages domain-invariant features to semantically segment traffic scenes under diverse conditions. This process involves a series of steps, beginning with capturing a sparse representation of source traffic scenes using a state-of-the-art spectral low-rank dictionary learning technique within the latent space of a deep encoder-decoder segmentation architecture. These sparse features endow our deep feature extractor with strong generalization capacity. Subsequently, we employ a generative adversarial framework to learn the distribution of these sparse features. Finally, we align the sparse representations of both source and target scenes through a sparse domain-invariant feature extractor, fine-tuned via min-max optimization. These aligned features serve as domain-invariant scene representations, effectively enabling deep domain adaptation for traffic scene semantic segmentation. Fig 2. Shows general framework of the proposed model for traffic scene semantic segmentation.
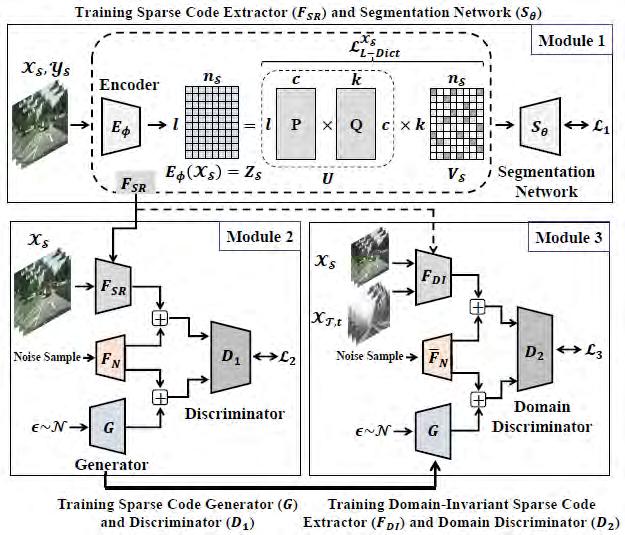
Figure 2: Overview of our proposed low-rank sparse UDA model proposed in [3]. Solid lines between modules show that the trained model is transferred to the next module while the dashed line indicates that the trained model is used to initialize the model in the next module.
Extensive experiments conducted on real-world datasets underscore the superiority of our proposed model over state-of-the-art methodologies. For instance, the proposed LSA-UDA outperforms the multi-target
knowledge transfer (MTKT) method and adversarial disentangled autoencoder (the two top benchmarks in our experiments) by $5.12\%$ and $6.66\%$ on the ACDC target dataset, respectively. Similarly, on BDD100K and AWSS, the proposed model improves the overall segmentation accuracy of MTKT by $4.79\%$ and $3.38\%$, respectively. Fig.3 shows the qualitative segmentation result of the pro posed model and MTKT for a random snowy traffic scene sampled from the ACDC dataset.
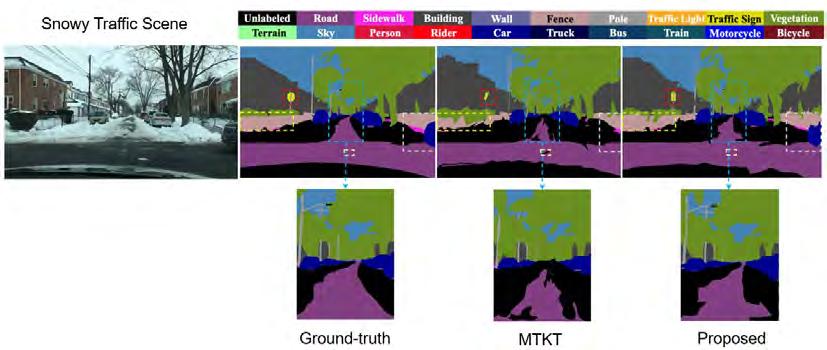
Figure 3: Qualitative segmentation comparison between the proposed model and the best baseline for a snowy sample.
References:
[1] Mohsen Saffari, Mahdi Khodayar, and Mohammad E Khodayar. Deep recurrent extreme learning machine for behind-the-meter photovoltaic disaggregation. The Electricity Journal, 35(5):107137, 2022.
[2] Mohsen Saffari, Mahdi Khodayar, Mohammad E Khodayar, and Mohammad Shahidehpour. Be hindthe-meter load and pv disaggregation via deep spatiotemporal graph generative sparse coding with capsule network. IEEE Transactions on Neural Networks and Learning Systems, 2023.
[3] Mohsen Saffari and Mahdi Khodayar. Low-rank sparse generative adversarial unsupervised domain adaptation for multi-target traffic scene semantic segmentation. IEEE Transactions on Industrial Informatics, 2023.
[4] Mohsen Saffari, Mahdi Khodayar, and Seyed Mohammad Jafar Jalali. Sparse adversarial unsupervised domain adaptation with deep dictionary learning for traffic scene classification. IEEE Transactions on Emerging Topics in Computational Intelligence, 2023.
[5] Yuxi Li, Shuxuan Xie, Zhibo Wan, Haibin Lv, Houbing Song, and Zhihan Lv. Graph powered learning methods in the internet of things: A survey. Machine Learning with Applications, 11:100441, 2023.
Biography:
Cyber Fellow: Mohsen Saffari
I am a last-year Ph.D. student at the Department of Computer Science, University of Tulsa. My academic journey encompasses both undergraduate and graduate degrees in Electrical Engineering, through which I gained a robust proficiency in mathematics and statistics, providing me with a strong background for my role as a data scientist. Complementing this, my tenure as a research assistant in machine learning at
INESCTEC, Portugal furnished me with invaluable experiences in real -world machine learning applications, including biometrics and face recognition. These collective experiences have facilitated significant collaborations with my supervisory team at TU, leading to the publication of numerous papers within the realm of machine learning during my Ph.D. program. My foc al interest lies in the application of machine learning methodologies to tackle substantial real-world problems, spanning domains such as time series prediction, intricate data disaggregation, and image classification.
Mahdi Khodayar received the B.Sc. degree in computer engineering and the M.Sc. degree in artificial intelligence from K. N. Toosi University of Technology, Tehran, Iran, in 2013 and 2015, respectively, and the Ph.D. degree in electrical engineering from Southern Methodist University, Dallas, TX, USA, in 2020. In 2017, he was a Research Assistant with the College of Computer and Information Science, Northeastern University, Boston, MA, USA. He is currently an Assistant Professor with the Department of Computer Science, The University of Tulsa, Tulsa, OK, USA. His main research interests include machine learning and statistical pattern recognition. He is focused on deep learning, sparse modeling, and spatiotemporal pattern recognition. Dr. Khodayar has served as a Reviewer for many reputable journals, including the IEEE Transactions on Neural Networks and Learning Systems, the IEEE Transactions on Industrial Informatics, the IEEE Transactions on Fuzzy Systems, the IEEE Transactions on Sustainable Energy, and the IEEE Transactions on Power Systems.
About Cameron
Professional Experience Preference
●
●
Working Location Preference
Internships / RA / TA / Work History

Extended Abstract: How AI Can Enhance Personal, Real-World Experiences With PerX
Joe Shymanski
The University of Tulsa joe-shymanski@utulsa.edu
Abstract–In order to align artificial intelligence (AI) systems with the demand for improved personalization, much interdisciplinary work still needs to be laid down between fields like psychology, machine learning, explainable AI (XAI), and human-computer interaction. The ultimate goal is to create a paradigm for personalized XAI (PerX) to enrich our daily experiences. The path for obtaining PerX is lengthy and will be examined carefully. At the end of this journey, a multitude of real-world applications using PerX are proposed and analyzed for its influence and efficacy.
Index Terms–Machine learning, personalization, XAI
Introduction
Artificial intelligence (AI) and machine learning (ML) have been studied extensively to optimize their positive impacts on society. With the booming success of many black box models, such as neural networks, transformers, and large language models, introducing transparency has been a paramount focus of research for these systems [1]. This effort has come to be known as explainable AI (XAI), and it seeks to build user trust and reduce algorithmic bias. Not all eplanations are created equal
Within the XAI literature, we have found that user studies are a common technique used to evaluate the quality of computer-generated explanations [2]. This practice seems like a logical and sufficient method; after all, these explanations are built to serve humans to increase their trust, understanding, and satisfaction with a model. However, we believe that this choice is insufficient to differentiate between explanations of high and low quality. Thus, we set out to determine if this was in fact the case.
In order to test our hypothesis, we built an experiment, as defined in [3], in which crowdsourced users would be asked to practice a task with the help of XAI, then test their skills alone on that same task,
Sandip Sen
The University of Tulsa sandip-sen@utulsa.edu
then finally complete a user survey about the experience.
We recruited about 100 individuals from Amazon Mechanical Turk (MTurk) who lived in the United States, were at least 18 years of age, were fluent in English. We incentivized them by granting bonus compensation that increased with their performance in the testing section.
The task we chose was solving chess puzzles which featured either a fork or pin as the main tactic. We chose chess for two reasons. First, we believed it would appear fun to MTurk workers, thus attracting more participants, improving their experience, and thereby improving the quality of our data. Second, we could tightly control the puzzles chosen for the study to reduce confounding variables. We ensured they were all between beginner and intermediate in difficulty (using Elo as a measure), belonged to one of the two specified tactics, contained exactly two moves each, and were evaluated by computer models to have one obvious correct choice at a time.
Upon entering the study, users were randomly and unknowingly assigned to one of three explanation groups: none, placebic, or actionable. This grouping determined the user’s experience in the practice section. The AI agent would always show the correct move to the user after their first attempt, regardless of the attempt’s correctness. The chatbot then gave users in the placebic and actionable groups an explanation. The actionable group received relevant information about the puzzle that the user may not have already known (e.g. “This move forks the queen and the king.”). The placebic group was only given useless information that did not add to the users’ understanding of the puzzles (e.g. “Your other options are not nearly as beneficial.”). Figure 1 displays the user interface for the practice section, which closely resembles that of the testing section, where the major difference is the lack of agent explanations in the latter.
After the testing section, the users rated three collections of three statements on a seven-point Likert scale. The collections focused on satisfaction with the practice section, satisfaction with the AI
agent, and perceived explanatory power of the agent’s explanations.

II. Results
We obtained two key results from this study. The first is that the users who received actionable explanations performed significantly better than those who received placebic. The second is that there were no significant differences between the groups’ responses to the final survey.
These results show that evaluating XAI solely based on subjective measures, such as user satisfaction or user-perceived explanatory power, is insufficient. If a group of researchers were to build an XAI model that, unbeknownst to them, only produced low-quality, placebic explanations, a user survey would not detect this critical flaw in the model.
III. Future work
We would like to generalize these findings by testing different domains. To do this, we analyzed the expectations a human user might have with a given domain. For example, if a user has high interest in a task and thus wants to improve their skills by learning from an AI agent, actionable explanations are ideal. This can be seen in Figure 2. Conversely, if a user has low interest in a domain, but still would like to increase their trust in the agent’s abilities, a placebic explanation would suffice.
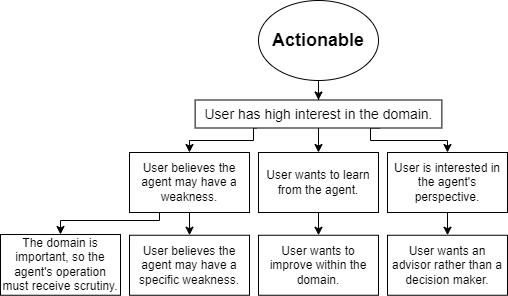
Clearly, the type of explanation that is desirable to a user is highly dependent on the user’s preferences and the problem domain. This is the first step to boosting the development and evaluation of personalized XAI (PerX). PerX will serve to enhance human interactions with the black box models that are all around us. Trust, satisfaction, understanding, and many other features can be optimized even further by curating explanations, and thus the human experience as a whole, to the individual user’s personality and desires.
Neural networks are ubiquitous in today’s world. They are one of the most common architectures found within black box models. Consequently, a significant amount of research and effort has been poured into making neural networks as transparent as possible. Nonetheless, there are still plenty of features within this construct which warrant further investigation for their contribution not only to model accuracy and efficiency, but also interpretability, which is a key contributor to augmenting PerX.
Neural network loss functions typically train models to be as confident as possible in their outputs. For example, a digit classifier is made to output a probability near one for the correct label and probabilities near zero for the rest. However, this could lead to inefficiencies in training time and cause the internal weights to begin focusing on minute details in order to achieve near-perfection.
Consider a scenario where the classifier sees an 8, but it is poorly written and instead appears to be a 3. The model predicts a 3 with a moderate degree of confidence, but it will harshly punish itself for the error to ensure its 8 predictions are perfectly tuned to the bad data This could destroy many of the valuable structures learned within the weights that work well in predicting both labels.
Thus, the loss function of classifiers with discretevalued output should account for the input similarity between the classes according to some, perhaps naïve, metric. This would work for any input feature space, not just spatially related pixels like the digit classifier example.
The nodes and layers of a neural network are often thought of as performing hierarchical pattern detection. In a network built to classify images, perhaps each node of the first hidden layer detects small edges, while each in the second layer detects shapes, and the output layer corresponds these shapes to the class labels.
However, the weights of the internal nodes often do not arrive at these preconceived, high-level patterns. In fact, they most frequently appear random and uncorrelated to one another. This may be the consequence of initializing all network weights completely randomly.
In order to fix this, we could initialize the network weights according to some humanly interpretable definition. Using the image classifier example, this could mean hard coding the weights to detect a number of edges and shapes in the appropriate layers at the start of training Then, in conjunction with a softer loss function, the final optimized solution will be a transparent model that its users can completely understand.
Acknowledgements
We would like to thank the University of Tulsa and the Cyber Fellows program for funding this work and providing us with the proper resources to conduct high-quality research.
References
[1] U. Ehsan, Q. V. Liao, M. Muller, M. O. Riedl, and J. D. Weisz, “Expanding Explainability: Towards Social Transparency in AI systems,” Proceedings of the 2021 CHI Conference on Human Factors in Computing Systems , May 2021, doi: https://doi.org/10.1145/3411764.3445188.
[2] S. Mohseni, N. Zarei, and E. D. Ragan, “A Multidisciplinary Survey and Framework for Design and Evaluation of Explainable AI Systems,” ACM Transactions on Interactive Intelligent Systems, vol. 11, no. 3–4, pp. 1–45, Dec. 2021, doi: https://doi.org/10.1145/3387166.
[3] J. Shymanski, J. Brue, and S. Sen, “Not All Explanations are Created Equal: Investigating the Pitfalls of Current XAI Evaluation.”
About the authors


Joe Shymanski is a Graduate Student at the University of Tulsa researching explainable artificial intelligence (XAI) for personalizing human experiences with AI. His work is completed thanks to the funding and support of the TU Cyber Fellowship.
Sandip Sen is a professor in the Tandy School of Computer Science with primary research interests in artificial intelligence, intelligent agents, machine learning, and evolutionary computation. He advises the MASTERS research group with focuses in Human-AI
Cooperation, Multi-Agent Systems, and Reinforcement Learning.
Jack Tilbury LinkedIn
Jack - Tilbury@utulsa.edu
JackTilbury Google Scholar
● Security P roduct Manager
● Security,Risk & Resilient Strategy Consulting
● Security An alystOperations
● Research S cientist
Working Location Preference
Tulsa Area, Florida, Chicago, Washington, Remote
Internships / RA / TA / Work History
Year Position
2022Present Doctoral Researcher
20202022 Product Manager
Employer
University of Tulsa
Flash Mobile Vending & The Delta, South Africa
2019 Assistant Lecturer and Teaching Assistant Rhodes University
2018 Software Implementation Analyst Saratoga, Cape Town
JackTilburyisasecond-yearPh.D.studentatTheUniversityofTulsa.Heobtained hisresearch-basedMCominInformationSystemsfromRhodesUniversity,South Africa,in2019.JackwasawardedafullscholarshiptopursuehisMaster'sdegree, whichexploredthePropTechindustry–conductingrealestatetransactionsthrough blockchaintechnology. HegraduatedatthetopofhisInformationSystemshonors classasheobtainedaBusinessScienceundergraduatedegree.Sincearrivingin Tulsa,JackhasattendedandpublishedattheAnnualSecurityConferenceandhas beeninvitedtopresentattheUNESCOSafetyConference.Hisresearchincludes informationsystems,behavioralinformationsecurity,andautomateddecisionaidsin securityoperationcenters.BeforestartinghisPh.D.research,Jackworkedasa ProductManagerintheITindustryattwosoftwaredevelopmentcompanies.
JackworkedfortwoyearsasaProductManagerwithexperienceinstart-upand corporateenvironments,buildingandlaunchingmultipleproductstomarket.Jackis eagertocontributetothedevelopmentofsecurityproductseitherthroughleading productteams,engagingwithproductcustomers,orconductingproductresearch.

Jim Sill
University of Tulsa
jim-sill@utulsa.edu
Dr. John Hale
University of Tulsa
john-hale@utulsa.edu
At its core, data sovereignty pertains to the principle that digital data is subject to the laws of the country in which it resides. This concept, while straightforward in theory, encounters numerous challenges in practice, given the global nature of the internet and the ease with which data crosses international borders. Data is “free flowing” and “boundless.” Data is also transactional and ephemeral. Put simply, data is leveraged and then forgotten. Given these factors, the inability to determine who or what entity truly owns the data in question is a prominent concern in this discourse.
The concept of data sovereignty has emerged as a focal point in industry and academic discussions alike surrounding the governance, privacy, and security of digital data. In today’s digital economy, data assumes the role of a critical asset. Consequently, the need to understand and navigate the complexities of data sovereignty becomes paramount. This paper delves into this evolving discourse, examining its implications for privacy, security, and global governance against the backdrop of technological advancements and shifting legal landscapes. This is necessary as the determination of data's exceptionality becomes more crystalized.
My research explores the tension between traditional notions of territorial sovereignty, as advocated by scholars such as Goldsmith (Goldsmith, 1998), and the calls for a more fluid, global governance approach, as proposed by Johnson & Post (Johnson, 1996) (Svantensson, 2016). Goldsmith’s perspective emphasizes the jurisdictional authority of nations over data existing within their borders, as well as that possessed by, or owned by their constituents. Goldsmith's perspective, rooted in the concept of territoriality, asserts that data, much like tangible assets, should be subject to the laws of the nation within which it resides or is processed. Such a viewpoint, while grounded in traditional legal paradigms, struggles to address the multifaceted realities of modern cyber architectures. As data flows seamlessly across borders, through distributed networks, and is accessed globally, the very notion of a geographically bound "home" for data becomes untenable. The territorial approach, while offering clear legal boundaries, often finds itself in a state of "legal lag," unable to accommodate the agile and borderless nature of contemporary digital interactions.
Johnson & Post argue for governance models that transcend national boundaries, reflecting the inherently international character of data. They posit a more fluid framework, suggesting that cyberspace exists as its own domain, distinct from traditional geophysical boundaries. Their viewpoint, which resonates more closely with the operational realities of global cyber architectures, posits that traditional territorial laws may be ill-suited to govern the unique challenges of the digital domain. By detaching data from strict geophysical jurisdictions, they acknowledge the inherent fluidity and dynamism of digital exchanges, paving the way for a modern leg al framework that is more in sync with current practice, and future technological advancements.
In the face of rapid digital transformation, it becomes evident that clinging to rigid territorial -based legal frameworks might lead to misalignments and injustices. The modern digital landscape, characterized by cloud platforms, decentralized systems, and ubiquitous connectivity, finds a more natural ally in the non -territorial viewpoints of scholars like Johnson and Post. Both cases provide for such a variety of control mechanisms to be required by one view, and voluntarily applied by another.
Data sovereignty is further complicated by pressing concerns over personal privacy rights and national security. Revelations of mass surveillance programs and the exploitation of personal data by state and non -state actors have propelled data sovereignty to the forefront of public and academic debate. The paper examines how these developments, particularly the Snowden revelations and the enactment of significant regulations such as the Chinese regulatory model, the GDPR and the USA Freedom Act, have influenced public awareness and regulatory
bodies. These regulatory platforms, and security events underscore the delicate balance between safeguarding privacy and ensuring national security in the digital age.
Either through litigation or regulatory findings, organizations are facing multimillion -dollar settlements. All of which reveals that many organizations are not performing at the minimum regulatory or contractual levels they proclaim. Legal and policy responses to the challenges of data sovereignty are varied and often complex. Here, we analyze landmark legal decisions, current case law, and the regulatory and legislative efforts of various jurisdictions, that seek to address the jurisdictional dilemmas posed by global data flows. Modern legal frameworks must account for the ongoing struggle to achieve a coherent and effective governance model for data sovereignty that respects privacy rights while accommodating the needs of law enforcement and national security.
These specific arguments set the stage and create the perfect groundwork for viewing data exceptionality as a Hegelian Dialectic. This dialectic will be applied to a thematic content evaluation of 776 data sources fr om academic journal & conference papers, corporate white papers, nongovernmental organizational reports, regulatory standards, and other grey literature documents, and more than 20 books. This analysis will elucidate organizational sentiments on the exceptional or nonexceptional nature of data. Such a study is a critical first step to understanding the posture of principal global actors regarding data sovereignty.
Navigating data sovereignty issues requires a nuanced understanding of the interplay between technology, legal frameworks, and the ethical imperatives of privacy and security. It calls for a balanced approach that recognizes the limitations of traditional territorial models while seeking to develop global governance structures that can protect individual rights and foster innovation in a digital world. From this a modern global framework will be developed.
The Internet and Sovereignty: The internet's inception brought about discussions on governing data sovereignty, leading to a recognition of data as a “free flowing” boundless environment across cyberspace. However, this lack of clear governance led to data being susceptible to misuse and abuse, highlighting the need for defined rules and regulations. This vacuum has created a grotesque landscape of legal issues, and variance in global governance frameworks, and accepted best practices.
Data Sovereignty: Sovereignty concerns become critical with regards to where data resides and how it is processed, which may influence or be influenced by territoriality. “Data Ownership” and “Data Stewardship” take precedence over so much in today’s evolution of a “Data Subject’s” rights and privileges, all which conflict with each other, depending upon the jurisdiction you may be creating, processing, transferring, or storing data.
Recent Developments and Wake-up Calls: The consistent exposing of governmental and corporate mass surveillance ignites debates on privacy and civil liberties. These events underscored the necessity for stringent data policies and awakened public and governmental awareness towards the importance of data sovereignty. Subsequent governmental overreach in the form of legislative actions, like the USA Freedom Act and the GDPR, aimed to restore trust, enhance transparency, and grant individuals unprecedented control over their personal data have only engendered mistrust, allowing foreign enemies strong footholds in the shaping of global policies and regulations.
GDPR's Impact and Global Data Sovereignty Trends: The GDPR, with its comprehensive framework for data protection, set a significant milestone influencing global data sovereignty discussions. It established rigorous guidelines for data management and empowered individuals with control over their data, regardless of location. This regulation, along with similar laws worldwide, signifies a shift towards recognizing data as a critical asset requiring stringent governance.
The Hegelian Framework and Territoriality: The debate around data sovereignty also involves contrasting viewpoints on territoriality. One perspective asserts data should adhere to the laws of its physical location, while another argues for cyberspace is independent of geographical boundaries. These discussions
reflect the challenges of applying traditional legal frameworks to the dynamic and borderless nature of the digital domain. Couple these ideals with legal lag, and a dysmorphic view of sovereignty from jurisdiction to jurisdiction only confounds the matter.
Technological Influences and Regulatory Challenges: The digital era has seen a shift towards more regulated data landscapes, with significant implications for privacy, surveillance, and data ownership. Technologies like facial recognition and data aggregation tools have raised ethical and legal concerns, necessitating a balanced approach to data sovereignty that considers technological advances and protects individual rights. The concerns about how technology, such as Facial Recognition Software (FRS) and IoT devices, and the “undefined” and at times “illegal” use, sharing, and distribution of Genetic (DNA) material, influences data sovereignty. Also, the continuously growing snare of “data aggregation” and the “mosaic theory – in practice” are raised about the consent for data collection and the expectation of privacy.
Zemiology: This term, which appears in the notes, refers to the study of social harms. The questions posed throughout my research suggest an interesting economic impact, using Zemiology to delve into both “actual” and “potential” harms to individuals and other organizations, depending specifically upon their treatment or mistreatment of data concerning protections for or against data sovereignty.
The “Top 10” research questions that continue to circulate, in my pursuit of defining data as either “Exceptional” or “Non-Exceptional” are as follows:
1. How do organizations navigate the implementation of data sovereignty laws across different jurisdictions, and what are the key challenges they face in ensuring compliance?
2. In the context of data sovereignty, what strategies are organizations employing to ensure alignment among their teams, particularly between legal, IT, and data management departments?
3. With the increasing complexity of IT infrastructures, how can organizations effectively track and verify data movement, and what role does technology play in maintaining this oversight?
4. What are the best practices for storing backups, particularly in ensuring they comply with data sovereignty requirements across various regions?
5. In terms of data protection during transit, what innovative measures are organizations adopting to safeguard data, and how do these measures stand up against the latest data breach tactics?
6. Considering hybrid cloud setups and the fluidity of data movement, what systems do organizations have in place to monitor compliance with data sovereignty laws?
7. What implications do data sovereignty laws have on the decision-making process when moving data out of a specific region, and how do these laws affect multinational data flow strategies?
8. From a financial perspective, how does compliance with stringent data laws influence operational costs, and what budgetary considerations are organizations making to accommodate these changes?
9. Who within organizations typically assumes responsibility for data compliance requirements, and how is this role evolving as data sovereignty becomes more central to business operations?
10. Direct-to-consumer genetic testing raises significant privacy and security concerns. What additional protections could be implemented to safeguard consumers' genetic information, and what justifies the need for these protections?
All these feed into the final question for my research: “Is data exceptional, or not?”
As the President of Insight Forensics Consulting, Incorporated, I collaborate with executive teams to enhance their leadership skills, strategic planning, and decision-making processes. I have mentored executive teams at renowned American companies, delivering transformative strategies and fostering growth. I also provide expert guidance, analysis, and support throughout legal proceedings, serving as a subject matter expert and forensic examiner. I have served as a trusted litigation advisor, providing expert counsel and forensic examination services for high-profile cases, supporting and winning and also mitigating the largest settlements in North America. I work with both Trial and Defense Attorneys, fostering a non-biased basis in my body of work.
I am passionate about exploring the ethical implications of the use of AI and ML in the global intelligence and business communities, as well as the need for data custodians to understand the ethical considerations in utilizing these tools. I am currently pursuing a PhD in Cyber Studies at the University of Tulsa, as a Cyber Fellow and a recipient of the Team8 Cyber Fellows Award. I have a Master of Science degree in Cybersecurity from the same university, a Data Analytics Certification from Columbia University, and several cybersecurity certifications such as CompTIA SEC+ Certification and (ISC)2 CISSP Certification. I am also a TEDx Speaker, sharing my insights and perspectives on cybersecurity, ethics, and leadership.
Conference Participation
TEDx University of Tulsa, Spring 2023 Artificial Intelligence’s Biases
Cyber Summit, Dallas-Fort Worth, Texas Fall 2023
Panel Discussion on Cybersecurity Issues in Cloud Based XaaS Application
Indigenous Data Sovereignty Summit, Tucson, Arizona Spring 2024 Breakout Session Presentation, Cybersecurity and AI Framework for IDSOV Independence.
ASC Annual Security Conference 2024, Las Vegas, Nevada, Spring 2024 Hegelian Dialectic for Data Exceptionality
Professional Experience Preference
My top professional skills are: Forensic Review, Cyberlaw, Governance, Data Privacy, Data Analytics, SecDevOps, USDOT Regulated Transportation, and Civil Litigation Strategies. I would prefer that future research and business endeavors would yield the opportunity to utilize these strengths.
Working Location Preference
Tulsa Area, Remote
Contact Information
Jim Sill | LinkedIn
Employer
2023 President Insight Forensics Consulting, Incorporated.
2022-2023 Graduate Research Assistant TU Cyber Fellows
2021-2022 Project Intern
Office of the Director of National Intelligence
2021-2022 Project Intern U.S. Department of State
Abraham, R., Schneider, J., & Vom Brocke, J. (2019). Data governance: A conceptual framework, structured review, and research agenda. International Journal of Information Management, 49, 424–438. https://doi.org/10.1016/j.ijinfomgt.2019.07.008
Adee, S. (2008). The Hunt For The Kill Switch. IEEE Spectrum, 45(5), 34–39. https://doi.org/10.1109/MSPEC.2008.4505310
AI measurement in ICT usage surveys: A review. (n.d.). OECD DIGITAL ECONOMY PAPERS. Akavia, A., Leibovich, M., Resheff, Y. S., Ron, R., Shahar, M., & Vald, M. (2022). Privacy-Preserving Decision Trees Training and Prediction. ACM Transactions on Privacy and Security, 25(3), 1–30. https://doi.org/10.1145/3517197
Alban, S. J. (2023). ‘Your DNA is for sale on the black market’: 23andMe data breach exposes customers Alexandert, G. S. (n.d.). PROPERTY AS A FUNDAMENTAL CONSTITUTIONAL RIGHT? THE GERMAN EXAMPLE. CORNELL LAW REVIEW, 88.
Ali, S. J., Christin, A., Smart, A., & Katila, R. (n.d.). Walking the Walk of AI Ethics in Technology Companies Almashaqbeh, G., & Solomon, R. (2022). SoK: Privacy-Preserving Computing in the Blockchain Era. 2022 IEEE 7th European Symposium on Security and Privacy (EuroS&P), 124–139. https://doi.org/10.1109/EuroSP53844.2022.00016
Alon, U. (2007). Network motifs: Theory and experimental approaches. Nature Reviews Genetics, 8(6), 450–461. https://doi.org/10.1038/nrg2102
Altendeitering, M., Pampus, J., Larrinaga, F., Legaristi, J., & Howar, F. (2022). Data sovereignty for AI pipelines: Lessons learned from an industrial project at Mondragon corporation. Proceedings of the 1st International Conference on AI Engineering: Software Engineering for AI, 193–204. https://doi.org/10.1145/3522664.3528593
Alvero, K. M. (2020). Determining Who Owns Data. 2.
Amoore, L. (2018). Cloud geographies: Computing, data, sovereignty. Progress in Human Geography, 42(1), 4–24. https://doi.org/10.1177/0309132516662147
Andrews, D. C., & Newman, J. M. (2013). Personal Jurisdiction and Choice of Law in the Cloud. SSRN Electronic Journal. https://doi.org/10.2139/ssrn.2227671
Arriens, J. (n.d.). In China, the ‘Great Firewall’ Is Changing a Generation. Artificial intelligence companies, goods and services: A trademark-based analysis (OECD Science, Technology and Industry Working Papers 2021/06; OECD Science, Technology and Industry Working Papers, Vol. 2021/06). (2021). https://doi.org/10.1787/2db2d7f4-en
Ash, J., Kitchin, R., & Leszczynski, A. (2018). Digital turn, digital geographies? Progress in Human Geography, 42(1), 25–43. https://doi.org/10.1177/0309132516664800
Aswad, E. M. (n.d.). LOSING THE FREEDOM TO BE HUMAN. COLUMBIA HUMAN RIGHTS LAW REVIEW
Banse, C. (2021a). Data Sovereignty in the Cloud Wishful Thinking or Reality? Proceedings of the 2021 on Cloud Computing Security Workshop, 153–154. https://doi.org/10.1145/3474123.3486792
Banse, C. (2021b). Data Sovereignty in the Cloud Wishful Thinking or Reality? Proceedings of the 2021 on Cloud Computing Security Workshop, 153–154. https://doi.org/10.1145/3474123.3486792
Barlow, J. P. (n.d.). A Declaration of the Independence of Cyberspace
Bathla, G., Aggarwal, H., & Rani, R. (2018). Migrating From Data Mining to Big Data Mining. International Journal of Engineering & Technology, 7(3.4), 13. https://doi.org/10.14419/ijet.v7i3.4.14667
Bauer, M. (n.d.). Transatlantic Data Sovereignty: How to Achieve Privacy-proof Data Flows between the EU and the US. PAPER SERIES. Bean, J. (2021). Democracy and data fatalism. Interactions, 28(6), 26–27. https://doi.org/10.1145/3488570
Becker, R., Thorogood, A., Bovenberg, J., Mitchell, C., & Hall, A. (2022). Applying GDPR roles and responsibilities to scientic data sharing. International Data Privacy Law, 12(3). Bélanger & Crossler. (2011). Privacy in the Digital Age: A Review of Information Privacy Research in Information Systems. MIS Quarterly, 35(4), 1017. https://doi.org/10.2307/41409971
Beltran, B., Lyon, B., & Schivone, N. (n.d.). SCORCHED BORDER LITIGATION. COLUMBIA HUMAN RIGHTS LAW REVIEW
Bender, E. M., & Koller, A. (2020). Climbing towards NLU: On Meaning, Form, and Understanding in the Age of Data. Proceedings of the 58th Annual Meeting of the Association for Computational Linguistics, 5185–5198. https://doi.org/10.18653/v1/2020.acl-main.463
Bendiek, A., & Wissenschaft, S. (n.d.). Due Diligence in Cyberspace. Guidelines for International and European Cyber Policy and Cybersecurity Policy.
Bennett, C., & Oduro-Marfo, S. (2018). GLOBAL Privacy Protection: Adequate Laws, Accountable Organizations and/or Data Localization? Proceedings of the 2018 ACM International Joint Conference and 2018 International Symposium on Pervasive and Ubiquitous Computing and Wearable Computers, 880–890. https://doi.org/10.1145/3267305.3274149
Bigo, D., Carrera, S., Hernanz, N., Jeandesboz, J., Parkin, J., Ragazzi, F., & Scherrer, A. (n.d.). Mass Surveillance of Personal Data by EU Member States and its Compatibility w ith EU Law Bill, H. (n.d.). SENATE BILL 73 By Watson. Blauth, T. F., Gstrein, O. J., & Zwitter, A. (2022). Artificial Intelligence Crime: An Overview of Malicious Use and Abuse of AI. IEEE Access, 10, 77110–77122. https://doi.org/10.1109/ACCESS.2022.3191790
Boeckl, K., Fagan, M., Fisher, W., Lefkovitz, N., Megas, K. N., Nadeau, E., O’Rourke, D. G., Piccarreta, B., & Scarfone, K. (2019). Considerations for managing Internet of Things (IoT) cybersecurity and privacy risks (NIST IR 8228; p. NIST IR 8228). National Institute of Standards and Technology. https://doi.org/10.6028/NIST.IR.8228
Bounegru, L., Gray, J., Williams, A., Rey, A., Kirk, A., Chan, A. S., Paliwal, A., Maseda, B., Simon, B., Anderson, C. W., Barr, C., Petre, C., Callison, C., D’Ignazio, C., Schilis-Gallego, C., Phillips, C., Elmer, C., Boros, C., Radcliffe, D., … Rahman, Z. (2021). The Data Journalism Handbook: Towards A Critical Data Practice. Amsterdam University Press. https://doi.org/10.5117/9789462989511
Braun, V., & Clarke, V. (2006). Using thematic analysis in psychology. Qualitative Research in Psychology, 3(2), 77–101. https://doi.org/10.1191/1478088706qp063oa
Brennen, A. (2020). What Do People Really Want When They Say They Want “Explainable AI?” We Asked 60 Stakeholders. Extended Abstracts of the 2020 CHI Conference on Human Factors in Computing Systems, 1–7. https://doi.org/10.1145/3334480.3383047
Brincat, S., & Bentham, J. (2008). FOR THE RIGHT TO SILENCE 6(1).
Broniatowski, D. A. (2021). Psychological foundations of explainability and interpretability in artificial intelligence (NIST IR 8367; p. NIST IR 8367). National Institute of Standards and Technology (U.S.). https://doi.org/10.6028/NIST.IR.8367
Browne, O. (n.d.). Man versus Machine: Technological Promise and Political Limits of Automated Regulation Enforcement. Busser, E. D. (2024). Big Data: The Conflict Between Protecting Privacy and Securing Nations. BIG DATA. Buxbaum, H. (2009). Territory, Territoriality, and the Resolution of Jurisdictional Conflict. American Journal of Comparative Law, 57(3), 631–675. https://doi.org/10.5131/ajcl.2008.0018
Calderaro, A., & Blumfelde, S. (2022). Artificial intelligence and EU security: The false promise of digital sovereignty. European Security, 31(3), 415–434. https://doi.org/10.1080/09662839.2022.2101885
Calzada, I. (2021). Data Co-Operatives through Data Sovereignty. Smart Cities, 4(3), 1158–1172. https://doi.org/10.3390/smartcities4030062
Calzati, S. (2022). ‘Data sovereignty’ or ‘Data colonialism’? Exploring the Chinese involvement in Africa’s ICTs: a document review on Kenya. Journal of Contemporary African Studies, 40(2), 270–285. https://doi.org/10.1080/02589001.2022.2027351
Carroll, S. R., Plevel, R., Jennings, L. L., Garba, I., Sterling, R., Cordova-Marks, F. M., Hiratsuka, V., Hudson, M., & Garrison, N. A. (2022). Extending the CARE Principles from tribal research policies to benefit sharing in genomic research. Frontiers in Genetics, 13, 1052620. https://doi.org/10.3389/fgene.2022.1052620
Carroll, S. R., Rodriguez-Lonebear, D., & Martinez, A. (2019). Indigenous Data Governance: Strategies from United States Native Nations. Data Science Journal, 18(1), 31. https://doi.org/10.5334/dsj-2019-031
Categorize Step Tips and Techniques for Systems. (2009).
Center for Security and Emerging Technology, Fedasiuk, R., Melot, J., & Murphy, B. (2021). Harnessed Lightning: How the Chinese Military is Adopting Artificial Intelligence . Center for Security and Emerging Technology. https://doi.org/10.51593/20200089
Center for Security and Emerging Technology, Gehlhaus, D., Koslosky, L., Goode, K., & Perkins, C. (2021). U.S. AI Workforce: Policy Recommendations. Center for Security and Emerging Technology. https://doi.org/10.51593/20200087
Chaney, C. B. (n.d.). Data Sovereignty and the Tribal Law and Order Act
Chang, V., Tang, S., Poore, J., & Lawrence, C. (n.d.). Modeling and Simulation for Operational Impact of Artificial Intelligence, Autonomy, and Augmentation Technologies.
Chen Si. (2021). Research on Data Sovereignty Rules in Cross-border Data Flow and Chinese Solution. USChina Law Review, 18(6). https://doi.org/10.17265/1548-6605/2021.06.001
Chiang, F. (n.d.). The State and Sovereignty.
Chilton, A. S. (2017). A Reply to Dworkin’s New Theory of International Law 80 China’s Submissions to the Open-ended Working Group on Developments in the Field of Information and Telecommunications in the Context of International Security. (n.d.). Chowdhury, A. M. M., & Imtiaz, M. H. (2022). Contactless Fingerprint Recognition Using Deep Learning A Systematic Review. Journal of Cybersecurity and Privacy, 2(3), 714–730. https://doi.org/10.3390/jcp2030036
Clarke, R., & Greenleaf, G. (2017). Dataveillance Regulation: A Research Framework. SSRN Electronic Journal. https://doi.org/10.2139/ssrn.3073492
COBIT® 2019 Framework: Introduction and methodology. (2012). ISACA. Cook, M. M. (2022). Bringing Down Big Data: A Call for Federal Data Privacy Legislation. OKLAHOMA LAW REVIEW, 74.
Costa, L. (2016). Virtuality and Capabilities in a World of Ambient Intelligence: New Challenges to Privacy and Data Protection (Vol. 32). Springer International Publishing. https://doi.org/10.1007/978-3-31939198-4
Covert, I. C. (n.d.). Explaining by Removing: A Unified Framework for Model Explanation
Cuno, S., Bruns, L., Tcholtchev, N., Lämmel, P., & Schieferdecker, I. (2019). Data Governance and Sovereignty in Urban Data Spaces Based on Standardized ICT Reference Architectures. Data, 4(1), 16. https://doi.org/10.3390/data4010016
Cybersecurity Policy Making at a Turning Point: Analysing a New Generation of National Cybersec urity Strategies for the Internet Economy (OECD Digital Economy Papers 211; OECD Digital Economy Papers, Vol. 211). (2012). https://doi.org/10.1787/5k8zq92vdgtl-en
Daly, A., Devitt, S. K., & Mann, M. (Eds.). (2019). Good data. Institute of Network Cultures. Dawson, J. (2020). Microtargeting as Information Warfare [Preprint]. SocArXiv. https://doi.org/10.31235/osf.io/5wzuq
De Haes, S., Van Grembergen, W., Joshi, A., & Huygh, T. (2020). COBIT as a Framework for Enterprise Governance of IT. In S. De Haes, W. Van Grembergen, A. Joshi, & T. Huygh, Enterprise Governance of Information Technology (pp. 125–162). Springer International Publishing. https://doi.org/10.1007/9783-030-25918-1_5
De Reuver, M., Ofe, H., Agahari, W., Abbas, A. E., & Zuiderwijk, A. (2022). The openness of data platforms: A research agenda. Proceedings of the 1st International Workshop on Data Economy, 34–41. https://doi.org/10.1145/3565011.3569056
Dean, B. (n.d.). ENGROSSED SUBSTITUTE HOUSE BILL 1155 as passed by the House of Representatives and the Senate on the dates hereon set forth.
Dempsey, K. L., Chawla, N. S., Johnson, L. A., Johnston, R., Jones, A. C., Orebaugh, A. D., Scholl, M. A., & Stine, K. M. (2011). Information Security Continuous Monitoring (ISCM) for federal information
systems and organizations (NIST SP 800-137; 0 ed., p. NIST SP 800-137). National Institute of Standards and Technology. https://doi.org/10.6028/NIST.SP.800-137
Digital economy report 2019: Value creation and capture : implications for developing countries. (2019). United Nations.
Distinguishing Between Legitimate and Unlawful Surveillance. (2024).
Dobson, D., & Fernandez, A. (2023). IDSov and the silent data revolution: Indigenous Peoples and the decentralized building blocks of web3. Frontiers in Research Metrics and Analytics, 8, 1160566. https://doi.org/10.3389/frma.2023.1160566
Dodson, D., Souppaya, M., & Scarfone, K. (2020). Mitigating the Risk of Software Vulnerabilities by Adopting a Secure Software Development Framework (SSDF). National Institute of Standards and Technology. https://doi.org/10.6028/NIST.CSWP.04232020
Dong, F., Zou, X., Wang, J., & Liu, X. (2023). Contrastive learning-based general Deepfake detection with multi-scale RGB frequency clues. Journal of King Saud University - Computer and Information Sciences, 35(4), 90–99. https://doi.org/10.1016/j.jksuci.2023.03.005
Dwork, C. (2008). Differential Privacy: A Survey of Results. In M. Agrawal, D. Du, Z. Duan, & A. Li (Eds.), Theory and Applications of Models of Computation (Vol. 4978, pp. 1–19). Springer Berlin Heidelberg. https://doi.org/10.1007/978-3-540-79228-4_1
Elliott, M. (n.d.). Sovereignty, Primacy and the Common Law Constitution: What has EU Membership Taught Us?
Elluri, L., Chukkapalli, S. S. L., Joshi, K. P., Finin, T., & Joshi, A. (2021). A BERT Based Approach to Measure Web Services Policies Compliance With GDPR. IEEE Access, 9, 148004–148016. https://doi.org/10.1109/ACCESS.2021.3123950
Ergüner Özkoç, E. (2022). Privacy Preserving Data Mining. In C. Thomas (Ed.), Artificial Intelligence (Vol. 8). IntechOpen. https://doi.org/10.5772/intechopen.99224
European Commission. Joint Research Centre. (2016). DigComp 2.0: The digital competence framework for citizens. Publications Office. https://data.europa.eu/doi/10.2791/11517
Fagan, M. (2020). IoT Device Cybersecurity Guidance for the Federal Government: An Approach for Establishing IoT Device Cybersecurity Requirements [Preprint]. https://doi.org/10.6028/NIST.SP.800213-draft
Fang, Z., Lu, J., Liu, F., Xuan, J., & Zhang, G. (2021). Open Set Domain Adaptation: Theoretical Bound and Algorithm. IEEE Transactions on Neural Networks and Learning Systems, 32(10), 4309–4322. https://doi.org/10.1109/TNNLS.2020.3017213
Fathima Begum, M., & Narayan, S. (2023). A pattern mixture model with long short-term memory network for acute kidney injury prediction. Journal of King Saud University - Computer and Information Sciences, 35(4), 172–182. https://doi.org/10.1016/j.jksuci.2023.03.007
Ferracane, M. (2017). Restrictions on Cross-Border Data Flows: A Taxonomy. SSRN Electronic Journal https://doi.org/10.2139/ssrn.3089956
Ferracane, M. F., & Lee-Makiyama, H. (n.d.). Digital Trade Restrictiveness Index. Ferretti, F. (n.d.). A European Perspective on Data Processing Consent through the Re-conceptualization of European Data Protection’s Looking Glass after the Lisbon Treaty: Taking Rights Seriously. Fick, N., Miscik, J., Segal, A., & Goldstein, G. M. (n.d.). Confronting Reality in Cyberspace Fine, J. E. (n.d.-a). Tech Transactions & Data Privacy 2022 Report: The Current Landscape of Data Sovereignty Laws and A Universal Compliance Strategy. Fine, J. E. (n.d.-b). Tech Transactions & Data Privacy 2022 Report: The Current Landscape of Data Sovereignty Laws and A Universal Compliance Strategy. Fine, J. E. (n.d.-c). Tech Transactions & Data Privacy 2022 Report: The Current Landscape of Data Sovereignty Laws and A Universal Compliance Strategy Finnemore, M. (n.d.). CYBERSECURITY AND THE CONCEPT OF NORMS. Foust, J. (n.d.). New policy directive implements commercial space regulatory reforms. Framework for Improving Critical Infrastructure Cybersecurity. (2014). Gao, X. (2022). An Attractive Alternative? China’s Approach to Cyber Governance and Its Implications for the Western Model. The International Spectator, 57(3), 15–30. https://doi.org/10.1080/03932729.2022.2074710
Gaon, A., & Stedman, I. (2019). A Call to Action: Moving Forward with the Governance of Artificial Intelligence in Canada. Alberta Law Review, 1137. https://doi.org/10.29173/alr2547 Garrison, N. A., Hudson, M., Ballantyne, L. L., Garba, I., Martinez, A., Taualii, M., Arbour, L., Caron, N. R., & Rainie, S. C. (2019). Genomic Research Through an Indigenous Lens: Understanding the Expectations. Annual Review of Genomics and Human Genetics, 20(1), 495–517. https://doi.org/10.1146/annurevgenom-083118-015434
Gavison, R. (1980). Privacy and the Limits of Law. The Yale Law Journal, 89(3), 421. https://doi.org/10.2307/795891
Geist, M. A. (Ed.). (2015). Law, privacy, and surveillance in Canada in the post-Snowden era. University of Ottawa Press.
Genga, L., Zannone, N., & Squicciarini, A. (2019). Discovering reliable evidence of data misuse by exploiting rule redundancy. Computers & Security, 87, 101577. https://doi.org/10.1016/j.cose.2019.101577
Ghiasy, R., & Krishnamurthy, R. (n.d.). China’s Digital Silk Road and the Global Digital Order. Gill, P. (2012). Intelligence, Threat, Risk and the Challenge of Oversight. Intelligence and National Security, 27(2), 206–222. https://doi.org/10.1080/02684527.2012.661643
Gold, J. (n.d.). Toward Norms in Cyberspace: Recent Progress and Challenges. Grance, T., Hash, J., Peck, S., Smith, J., & Korow-Diks, K. (2002). Security guide for interconnecting information technology systems (NIST SP 800-47; 0 ed., p. NIST SP 800-47). National Institute of Standards and Technology. https://doi.org/10.6028/NIST.SP.800-47
Grassi, P. A., Fenton, J. L., Newton, E. M., Perlner, R. A., Regenscheid, A. R., Burr, W. E., Richer, J. P., Lefkovitz, N. B., Danker, J. M., Choong, Y.-Y., Greene, K. K., & Theofanos, M. F. (2017). Digital identity guidelines: Authentication and lifecycle management (NIST SP 800-63b; p. NIST SP 800-63b). National Institute of Standards and Technology. https://doi.org/10.6028/NIST.SP.800-63b
Grassi, P. A., Garcia, M. E., & Fenton, J. L. (2017). Digital identity guidelines: Revision 3 (NIST SP 800-63-3; p. NIST SP 800-63-3). National Institute of Standards and Technology. https://doi.org/10.6028/NIST.SP.800-63-3
Griffith, R., Baumbach, R., Walker, R. D., Harris, R., Johnson, R. K., Lambert, R., Longhurst, R., Neal, R., Phillips, R., Romer, R., Bush, R., Townsend, S., Gay, S., & Hansen, S. (n.d.). HOUSE OF REPRESENTATIVES 152nd GENERAL ASSEMBLY
Gunning, D., & Aha, D. W. (2019). DARPA’s Explainable Artificial Intelligence Program. AI Magazine, 40(2), 44–58. https://doi.org/10.1609/aimag.v40i2.2850
Hagen, D. J., & Lysne, D. O. (2024). Protecting the digitized society The challenge of balancing surveillance and privacy. Hannah, G., O’Brien, K., & Rathmell, A. (n.d.). Intelligence and Security Legislation for Security Sector Reform.
He, J., Cai, L., Cheng, P., Pan, J., & Shi, L. (2019). Consensus-Based Data-Privacy Preserving Data Aggregation. IEEE Transactions on Automatic Control, 64(12), 5222–5229. https://doi.org/10.1109/TAC.2019.2910171
Healey, J. (n.d.). Comparing Norms for National Conduct in Cyberspace. Heikkilä, M. (n.d.). Who’s going to save us from bad AI?
Hellmeier, M. (2023). A DELIMITATION OF DATA SOVEREIGNTY FROM DIGITAL AND TECHNOLOGICAL SOVEREIGNTY.
Hellmeier, M., Pampus, J., Qarawlus, H., & Howar, F. (2023). Implementing Data Sovereignty: Requirements & Challenges from Practice. Proceedings of the 18th International Conference on Availability, Reliability and Security, 1–9. https://doi.org/10.1145/3600160.3604995
Hendria, W. F., Velda, V., Putra, B. H. H., Adzaka, F., & Jeong, C. (2023). Action knowledge for video captioning with graph neural networks. Journal of King Saud University - Computer and Information Sciences, 35(4), 50–62. https://doi.org/10.1016/j.jksuci.2023.03.006
Herian, R. (2020). Blockchain, GDPR, and fantasies of data sovereignty. Law, Innovation and Technology, 12(1), 156–174. https://doi.org/10.1080/17579961.2020.1727094
Hippenlinen, L., Nokia Bell Labs, Finland, Oliver, I., & Nokia Bell Labs, Finland. (2017). Towards Trusted Location Specific Information for Cloud Servers. Journal of ICT Standardization, 5(1), 1–38. https://doi.org/10.13052/jicts2245-800X.511
Hristova, B. (n.d.). Police in Canada look into tech that accesses your home security cameras
Hu, V. C., Ferraiolo, D. F., & Kuhn, D. R. (2006). Assessment of access control systems (NIST IR 7316; 0 ed., p. NIST IR 7316). National Institute of Standards and Technology. https://doi.org/10.6028/NIST.IR.7316
Hu, V. C., Ferraiolo, D., Kuhn, R., Schnitzer, A., Sandlin, K., Miller, R., & Scarfone, K. (2014). Guide to Attribute Based Access Control (ABAC) Definition and Considerations (NIST SP 800-162; p. NIST SP 800-162). National Institute of Standards and Technology. https://doi.org/10.6028/NIST.SP.800-162
Huang, T. (n.d.). A QUADRUPLE DOCTRINAL FRAMEWORK OF FREE SPEECH. COLUMBIA HUMAN RIGHTS LAW REVIEW.
Huddleston, J., & Salihu, G. (n.d.). The Patchwork Strikes Back: State Data Privacy Laws after the 2022–2023 Legislative Session.
Hummel, P., Braun, M., Augsberg, S., Dabrock, P., Erlangen-Nürnberg, F.-A.-U., & Gießen, J.-L.-U. (2018). Sovereignty and data sharing. 2. Hummel, P., Braun, M., & Dabrock, P. (2021). Own Data? Ethical Reflections on Data Ownership. Philosophy & Technology, 34(3), 545–572. https://doi.org/10.1007/s13347-020-00404-9
Hummel, P., Braun, M., Tretter, M., & Dabrock, P. (2021a). Data sovereignty: A review. Big Data & Society, 8(1), 205395172098201. https://doi.org/10.1177/2053951720982012
Hunecke, M., Richter, N., & Heppner, H. (2021). Autonomy Loss, Privacy Invasion and Data Misuse as Psychological Barriers to Peer-to-Peer Collaborative Car Use [Preprint]. PsyArXiv. https://doi.org/10.31234/osf.io/4q3sb
Hurel, L. M., & Lobato, L. (2018). Unpacking Cybernorms: Private Companies as Norms Entrepreneurs. SSRN Electronic Journal. https://doi.org/10.2139/ssrn.3107237
Identifying and measuring developments in artificial intelligence: Making the impossible possible (OECD Science, Technology and Industry Working Papers 2020/05; OECD Science, Technology and Industry Working Papers, Vol. 2020/05). (2020). https://doi.org/10.1787/5f65ff7e-en
In, J., Pioneer, Y., Kapor, M., & Interview, J. B. (n.d.). Is There a There in Cyberspace?
Jac, H. (n.d.). SIGN UP TO NEWSLETTERS SIGN IN Jacoby, M., Volz, F., Weißenbacher, C., Stojanovic, L., & Usländer, T. (2021). An approach for Industrie 4.0compliant and data-sovereign Digital Twins: Realization of the Industrie 4.0 Asset Administration Shell with a data-sovereignty extension. At - Automatisierungstechnik, 69(12), 1051–1061. https://doi.org/10.1515/auto-2021-0074
Jain, B., Baig, M. B., Zhang, D., Porter, D. E., & Sion, R. (2014). SoK: Introspections on Trust and the Semantic Gap. 2014 IEEE Symposium on Security and Privacy, 605–620. https://doi.org/10.1109/SP.2014.45
Jansen, W., & Grance, T. (n.d.). Guidelines on Security and Privacy in Public Cloud Computing. Jarke, M. (2020). Data Sovereignty and the Internet of Production. In S. Dustdar, E. Yu, C. Salinesi, D. Rieu, & V. Pant (Eds.), Advanced Information Systems Engineering (Vol. 12127, pp. 549–558). Springer International Publishing. https://doi.org/10.1007/978-3-030-49435-3_34
Jarke, M., Otto, B., & Ram, S. (2019). Data Sovereignty and Data Space Ecosystems. Business & Information Systems Engineering, 61(5), 549–550. https://doi.org/10.1007/s12599-019-00614-2
Johnson, D. R., & Post, D. (1996). Law and Borders: The Rise of Law in Cyberspace. Stanford Law Review, 48(5), 1367. https://doi.org/10.2307/1229390
Johnson, J., Anderson, B., Wright, B., Quiroz, J., Berg, T., Graves, R., Daley, J., Phan, K., Kunz, M., Pratt, R., Carroll, T., O’Neil, L. R., Dindlebeck, B., Maloney, P., O’Brien, J., Gotthold, D., Varriale, R., Bohn, T., & Hardy, K. (n.d.). Cybersecurity for Electric Vehicle Charging Infrastructure. Joint Task Force. (2020). Control Baselines for Information Systems and Organizations [Preprint]. https://doi.org/10.6028/NIST.SP.800-53B-draft
Joint Task Force Interagency Working Group. (2020a). Security and Privacy Controls for Information Systems and Organizations (Revision 5). National Institute of Standards and Technology. https://doi.org/10.6028/NIST.SP.800-53r5
Joint Task Force Interagency Working Group. (2020b). Security and Privacy Controls for Information Systems and Organizations (Revision 5). National Institute of Standards and Technology. https://doi.org/10.6028/NIST.SP.800-53r5
Joint Task Force Transformation Initiative. (2011). Managing information security risk: Organization, mission, and information system view (NIST SP 800-39; 0 ed., p. NIST SP 800-39). National Institute of Standards and Technology. https://doi.org/10.6028/NIST.SP.800-39
Joint Task Force Transformation Initiative. (2012). Guide for conducting risk assessments (NIST SP 800-30r1; 0 ed., p. NIST SP 800-30r1). National Institute of Standards and Technology. https://doi.org/10.6028/NIST.SP.800-30r1
Joint Task Force Transformation Initiative. (2013). Security and Privacy Controls for Federal Information Systems and Organizations (NIST SP 800-53r4; p. NIST SP 800-53r4). National Institute of Standards and Technology. https://doi.org/10.6028/NIST.SP.800-53r4
Joint Task Force Transformation Initiative. (2018a). Risk management framework for information systems and organizations: A system life cycle approach for security and privacy (NIST SP 800-37r2; p. NIST SP 800-37r2). National Institute of Standards and Technology. https://doi.org/10.6028/NIST.SP.80037r2
Joint Task Force Transformation Initiative. (2018b). Risk management framework for information systems and organizations: A system life cycle approach for security and privacy (NIST SP 800-37r2; p. NIST SP 800-37r2). National Institute of Standards and Technology. https://doi.org/10.6028/NIST.SP.80037r2
Jones, D. M. (2018). Intelligence and the management of national security: The post 9/11 evolution of an Australian National Security Community. Intelligence and National Security, 33(1), 1–20. https://doi.org/10.1080/02684527.2016.1259796
Jr, R. R. G. (2020). The Rise of Drones and the Erosion of Privacy and Trespass Laws 33(3). Kalathil, S. (2024). The Evolution of Authoritarian Digital Influence. 1.
Keane, M. T., & Kenny, E. M. (n.d.). The Twin-System Approach as One Generic Solution for XAI: An Overview of ANN-CBR Twins for Explaining Deep Learning.
Keele, B. J. (2018). Information Sovereignty: Data Privacy, Sovereign Powers and the Rule of Law. By Radim Polčák and Dan Jerker B. Svantesson. Northampton, MA: Edward Elgar, 2017. Pp. xvii, 268. ISBN: 978-178643-921-5. US$ 135.00. International Journal of Legal Information, 46(2), 123–124. https://doi.org/10.1017/jli.2018.28
Kello, L. (2021). Cyber legalism: Why it fails and what to do about it. Journal of Cybersecurity, 7(1), tyab014. https://doi.org/10.1093/cybsec/tyab014
Kerr, O. S. (n.d.-a). The Fourth Amendment Limits of Internet Content Preservation. SAINT LOUIS UNIVERSITY LAW JOURNAL, 65.
Kerr, O. S. (n.d.-b). The Fourth Amendment Limits of Internet Content Preservation. SAINT LOUIS UNIVERSITY LAW JOURNAL, 65
Khan, S., & Shaheen, M. (2022). Wisdom Mining: Future of Data Mining. Recent Patents on Engineering, 17(1), e280322202673. https://doi.org/10.2174/1872212116666220328121113
Kilovaty, I. (n.d.). An Extraterritorial Human Right to Cybersecurity
Kilovaty, I. (2018). Legally Cognizable Manipulation. SSRN Electronic Journal. https://doi.org/10.2139/ssrn.3224952
Kilovaty, I. (2019a). Privatized Cybersecurity Law. SSRN Electronic Journal. https://doi.org/10.2139/ssrn.3338155
Kilovaty, I. (2019b). The Elephant in the Room: Coercion. AJIL Unbound, 113, 87–91. https://doi.org/10.1017/aju.2019.10
Kolanovic, M., & Krishnamachari, R. T. (2017). Machine Learning and Alternative Data Approach to Investing
Krishan, N. (n.d.). Experts warn of ‘contradictions’ in Biden administration’s top AI policy documents. Kumar, A., Almeida, M. T., & Gossett, D. M. (n.d.-a). BRIEF OF NETCHOICE, THE CATO INSTITUTE, CHAMBER OF PROGRESS, AND THE COMPUTER & COMMUNICATIONS INDUSTRY ASSOCIATION AS AMICI CURIAE IN SUPPORT OF NEITHER PARTY.
Kumar, A., Almeida, M. T., & Gossett, D. M. (n.d.-b). BRIEF OF NETCHOICE, THE CATO INSTITUTE, CHAMBER OF PROGRESS, AND THE COMPUTER & COMMUNICATIONS INDUSTRY ASSOCIATION AS AMICI CURIAE IN SUPPORT OF NEITHER PARTY.
Kuner, C. (n.d.-a). Data Protection Law and International Jurisdiction on the Internet (Part 1) Kuner, C. (n.d.-b). Data Protection Law and International Jurisdiction on the Internet (Part 2). Kuppa, A., & Le-Khac, N.-A. (2021). Adversarial XAI Methods in Cybersecurity. IEEE Transactions on Information Forensics and Security, 16, 4924–4938. https://doi.org/10.1109/TIFS.2021.3117075
Lablans, M., Kadioglu, D., Muscholl, M., & Ückert, F. (2015). Exploiting Distributed, Heterogeneous and Sensitive Data Stocks while Maintaining the Owner’s Data Sovereignty. Methods of Information in Medicine, 54(04), 346–352. https://doi.org/10.3414/ME14-01-0137
Laderman, E. R. (n.d.). Overview of How Cyber Resiliency Affects the Cyber Attack Lifecycle. 15. Lauf, F., Scheider, S., Bartsch, J., Herrmann, P., Radic, M., Rebbert, M., Nemat, A. T., Langdon, C. S., Konrad, R., Sunyaev, A., & Meister, S. (n.d.). Linking Data Sovereignty and Data Economy: Arising Areas of Tension.
Law and Borders: The Rise of Law in Cyberspace. (2022). STANFORD LAW REVIEW, 48
Leese, M. (2023). Staying in control of technology: Predictive policing, democracy, and digital sovereignty. Democratization, 1–16. https://doi.org/10.1080/13510347.2023.2197217
Lewis, J. A. (n.d.). Sovereignty and the Evolution of Internet Ideology
Li, T., Hu, S., Beirami, A., & Smith, V. (2021). Ditto: Fair and Robust Federated Learning Through Personalization (arXiv:2012.04221). arXiv. http://arxiv.org/abs/2012.04221
Lin, T., & Fidler, M. (2017). Cross-Border Data Access Reform: A Primer on the Proposed U.S.-U.K. Agreement. SSRN Electronic Journal. https://doi.org/10.2139/ssrn.3035563
Lindberg, S. (n.d.). A Study of Employee Monitoring Using AI: Technology, Law, and Policy. Mac, R., Haskins, C., Sacks, B., & McDonald, L. (n.d.). Your Local Police Department Might Have Used This Facial Recognition Tool To Surveil You. Find Out Here.
Macgregor, L. (n.d.). All that’s wrong with the UK’s crusade against online harms Mack, N., & Woodsong, C. (2005). Qualitative research methods: A data collector’s field guide. FLI USAID. Madiega, T., & Chahri, S. (n.d.). EPRS | European Parliamentary Research Service.
Mannhardt, F., Koschmider, A., Baracaldo, N., Weidlich, M., & Michael, J. (2019). Privacy-Preserving Process Mining: Differential Privacy for Event Logs. Business & Information Systems Engineering, 61(5), 595–614. https://doi.org/10.1007/s12599-019-00613-3
Mannhardt, F., Petersen, S. A., & Oliveira, M. F. (2018). Privacy Challenges for Process Mining in HumanCentered Industrial Environments. 2018 14th International Conference on Intelligent Environments (IE), 64–71. https://doi.org/10.1109/IE.2018.00017
Mantelero, A. (2014). The future of consumer data protection in the E.U. Re-thinking the “notice and consent” paradigm in the new era of predictive analytics. Computer Law & Security Review, 30(6), 643–660. https://doi.org/10.1016/j.clsr.2014.09.004
Martharaharja, J. A., & Bura, R. O. (2021). SINERGI, Volume 11 Number 1 MARCH 202. 11(1). Martin, K. (2020). Breaking the Privacy Paradox: The Value of Privacy and Associated Duty of Firms. Business Ethics Quarterly, 30(1), 65–96. https://doi.org/10.1017/beq.2019.24
Matuszewska, W. K., & Lubowicka, K. (n.d.). WPdaIIh,taaa?nt id[sUpPPeIDIr,sAnoTonEnaD-l]. McCallister, E., Grance, T., & Scarfone, K. A. (2010). Guide to protecting the confidentiality of Personally Identifiable Information (PII) (NIST SP 800-122; 0 ed., p. NIST SP 800-122). National Institute of Standards and Technology. https://doi.org/10.6028/NIST.SP.800-122 McCulloch, J., & Tham, J.-C. (n.d.). Secret State, Transparent Subject: The Australian Security Intelligence Organisation in the Age of Terror. McGuire, M. R., & Renaud, K. (2023). Harm, injustice & technology: Reflections on the UK’s subpostmasters’ case. The Howard Journal of Crime and Justice, 62(4), 441–461. https://doi.org/10.1111/hojo.12533 Mehrabi, N., Morstatter, F., Saxena, N., Lerman, K., & Galstyan, A. (2022). A Survey on Bias and Fairness in Machine Learning. ACM Computing Surveys, 54(6), 1–35. https://doi.org/10.1145/3457607
Meltzer, J. P. (n.d.). CCUOnhMiMitnEeNadT’AsRSYdtiagtietaslrseesrpvoicneds?trade and data governance: How should the.
Mendes, R., & Vilela, J. P. (2017). Privacy-Preserving Data Mining: Methods, Metrics, and Applications. IEEE Access, 5, 10562–10582. https://doi.org/10.1109/ACCESS.2017.2706947
Menn, J. (n.d.). Genetic tester 23andMe’s hacked data on Jewish users offered for sale online. Meurisch, C., Bayrak, B., & Mühlhäuser, M. (2020a). Privacy-preserving AI Services Through Data Decentralization. Proceedings of The Web Conference 2020, 190–200. https://doi.org/10.1145/3366423.3380106
Meurisch, C., Bayrak, B., & Mühlhäuser, M. (2020b). Privacy-preserving AI Services Through Data Decentralization. Proceedings of The Web Conference 2020, 190–200. https://doi.org/10.1145/3366423.3380106
Miller, K. (n.d.). Supermarket surveillance: Why we dislike it and what stores should be doing Miyamoto, D. I. (2024). MASS SURVEILLANCE AND INDIVIDUAL PRIVACY. Monroe, D. (2021). Trouble at the source. Communications of the ACM, 64(12), 17–19. https://doi.org/10.1145/3490155
Montenegro, M. (2019). Subverting the universality of metadata standards: The TK labels as a tool to promote Indigenous data sovereignty. Journal of Documentation, 75(4), 731–749. https://doi.org/10.1108/JD-082018-0124
Mooradian, N. (n.d.). AI, Records, and Accountability. Mooradian, N. (2009). The importance of privacy revisited. Ethics and Information Technology, 11(3), 163–174. https://doi.org/10.1007/s10676-009-9201-2
Morgus, R. (2024). The Spread of Russia’s Digital Authoritarianism. Moser, C. (n.d.). What Humans Lose When We Let AI Decide. MIT SLOAN MANAGEMENT REVIEW
Moussallem, D., Wauer, M., & Ngomo, A.-C. N. (2019). Semantic Web for Machine Translation: Challenges and Directions (arXiv:1907.10676). arXiv. http://arxiv.org/abs/1907.10676
Müller, V. C., & Bostrom, N. (2016). Future Progress in Artificial Intelligence: A Survey of Expert Opinion. In V. C. Müller (Ed.), Fundamental Issues of Artificial Intelligence (Vol. 376, pp. 555–572). Springer International Publishing. https://doi.org/10.1007/978-3-319-26485-1_33 Murphy, M. (n.d.). Hacker claims to have stolen genetic data from millions of 23andMe users and is trying to sell the information online. Myers, C. (2020). Warren, Samuel & Louis Brandeis. The Right to Privacy , 4 HARV. L. REV. 193 (1890). Communication Law and Policy, 25(4), 519–522. https://doi.org/10.1080/10811680.2020.1805984 National Institute of Standards and Technology. (2018). Framework for Improving Critical Infrastructure Cybersecurity, Version 1.1 (NIST CSWP 04162018; p. NIST CSWP 04162018). National Institute of Standards and Technology. https://doi.org/10.6028/NIST.CSWP.04162018
National Institute of Standards and Technology. (2020). Foundational Cybersecurity Activities for IoT Device Manufacturers C [Preprint]. https://doi.org/10.6028/NIST.IR.8259C-draft
National Institute of Standards and Technology. (2004). Standards for security categorization of federal information and information systems (NIST FIPS 199; p. NIST FIPS 199). National Institute of Standards and Technology. https://doi.org/10.6028/NIST.FIPS.199
National Institute of Standards and Technology. (2006). Minimum security requirements for federal information and information systems (NIST FIPS 200; p. NIST FIPS 200). National Institute of Standards and Technology. https://doi.org/10.6028/NIST.FIPS.200
Nazar, M., Alam, M. M., Yafi, E., & Su’ud, M. M. (2021). A Systematic Review of Human–Computer Interaction and Explainable Artificial Intelligence in Healthcare With Artificial Intelligence Techniques. IEEE Access, 9, 153316–153348. https://doi.org/10.1109/ACCESS.2021.3127881
Nieles, M., Dempsey, K., & Pillitteri, V. Y. (2017). An introduction to information security (NIST SP 800-12r1; p. NIST SP 800-12r1). National Institute of Standards and Technology. https://doi.org/10.6028/NIST.SP.800-12r1
NIST Roadmap for Improving Critical Infrastructure Cybersecurity, February 12, 2014. (n.d.).
Nugraha, Y., & Martin, A. (2022). Cybersecurity service level agreements: Understanding government data confidentiality requirements. Journal of Cybersecurity, 8(1), tyac004. https://doi.org/10.1093/cybsec/tyac004
OECD. (2019). What are the OECD Principles on AI? OECD Observer. https://doi.org/10.1787/6ff2a1c4-en OECD. (2021). AI and the Future of Skills, Volume 1: Capabilities and Assessments. OECD. https://doi.org/10.1787/5ee71f34-en
Otto, B. (2019). Interview with Reinhold Achatz on “Data Sovereignty and Data Ecosystems.” Business & Information Systems Engineering, 61(5), 635–636. https://doi.org/10.1007/s12599-019-00609-z
Otto, B., & Jarke, M. (2019). Designing a multi-sided data platform: Findings from the International Data Spaces case. Electronic Markets, 29(4), 561–580. https://doi.org/10.1007/s12525-019-00362-x
Özdal Oktay, S., Heitmann, S., & Kray, C. (2024). Linking location privacy, digital sovereignty and locationbased services: A meta review. Journal of Location Based Services, 18(1), 1–52. https://doi.org/10.1080/17489725.2023.2239180
Padilla, R. (n.d.). Large groups of people are fleeing Gaza City, satellite images show. Pagnanelli, V. (2022). DATA STORAGE AND DIGITAL SOVEREIGNTY. A REINTERPRETATION OF PUBLIC (BIG) DATA GOVERNANCE IN THE LIGHT OF NEW GLOBAL CHALLENGES. Revista Direito Mackenzie, 16(1), 1–32. https://doi.org/10.5935/2317-2622/direitomackenzie.v16n115229
Papakyriakou, D., & Barbounakis, I. S. (2022). Data Mining Methods: A Review. International Journal of Computer Applications, 183(48), 5–19. https://doi.org/10.5120/ijca2022921884
Papernot, N., McDaniel, P., Sinha, A., & Wellman, M. P. (2018). SoK: Security and Privacy in Machine Learning. 2018 IEEE European Symposium on Security and Privacy (EuroS&P), 399–414. https://doi.org/10.1109/EuroSP.2018.00035
Pastor-Galindo, J., Nespoli, P., Gomez Marmol, F., & Martinez Perez, G. (2020). The Not Yet Exploited Goldmine of OSINT: Opportunities, Open Challenges and Future Trends. IEEE Access, 8, 10282–10304. https://doi.org/10.1109/ACCESS.2020.2965257
Pearce, G. (n.d.). Beware the Privacy Violations in Artificial Intelligence Applications. Pedreira, V., Barros, D., & Pinto, P. (2021). A Review of Attacks, Vulnerabilities, and Defenses in Industry 4.0 with New Challenges on Data Sovereignty Ahead. Sensors, 21(15), 5189. https://doi.org/10.3390/s21155189
Peterson, Z. N. J., Gondree, M., & Beverly, R. (n.d.). A Position Paper on Data Sovereignty: The Importance of Geolocating Data in the Cloud. Phillips, A. M. (2017). Reading the fine print when buying your genetic self online: Direct-to-consumer genetic testing terms and conditions. New Genetics and Society, 36(3), 273–295. https://doi.org/10.1080/14636778.2017.1352468
Phillips, P. J., Hahn, C. A., Fontana, P. C., Broniatowski, D. A., & Przybocki, M. A. (2020). Four Principles of Explainable Artificial Intelligence [Preprint]. https://doi.org/10.6028/NIST.IR.8312-draft
Phillips, P. J., Hahn, C. A., Fontana, P. C., Yates, A. N., Greene, K., Broniatowski, D. A., & Przybocki, M. A. (2021). Four principles of explainable artificial intelligence (NIST IR 8312; p. NIST IR 8312). National Institute of Standards and Technology (U.S.). https://doi.org/10.6028/NIST.IR.8312
Podgor, E. S. (n.d.). Cybercrime: National, Transnational, or International? 50.
Polli, F., Kassir, S., Dolphin, J., Baker, L., Gabrieli, J., & Professor, G. H. (n.d.). Cognitive Science as a New People Science for the Future of Work.
Poullet, Y. (2009). Data protection legislation: What is at stake for our society and democracy? Computer Law & Security Review, 25(3), 211–226. https://doi.org/10.1016/j.clsr.2009.03.008
Prigent, A.-L., & Observer, O. (n.d.). Science and AI: Don’t forget the human factor…. PRIVACY, SECURITY, AND GOVERNMENT SURVEILLANCE: WIKILEAKS AND THE NEW ACCOUNTABILITY. (2024). PUBLIC AFFAIRS QUARTERLY.
Privacy-Privacy Tradeoffs. (2024).
Publications of the Modern Language Association of America. (1956). Notes and Queries, 3(9), 411–412. https://doi.org/10.1093/nq/3.9.411
Rachels, J. (1975). Why Privacy is Important. Philosophy and Public Affairs, 4(4), 323–333. http://www.jstor.org/stable/2265077
Rackow, S. H. (2002). How the USA Patriot Act Will Permit Governmental Infringement upon the Privacy of Americans in the Name of “Intelligence” Investigations. University of Pennsylvania Law Review, 150(5), 1651. https://doi.org/10.2307/3312949
Rafique, B. (2021). Biometric Attendance Machine Price in Pakistan. Academia Letters. https://doi.org/10.20935/AL1921
Rainie, S. C., Schultz, J. L., Briggs, E., Riggs, P., & Palmanteer-Holder, N. L. (2017). Data as a Strategic Resource: Self-determination, Governance, and the Data Challenge for Indigenous Nations in the United States. International Indigenous Policy Journal, 8(2). https://doi.org/10.18584/iipj.2017.8.2.1
Ransbotham, S., Candelon, F., Kiron, D., LaFountain, B., & Khodabandeh, S. (n.d.). The Cultural Benefits of Artificial Intelligence in the Enterprise Rectenwald, M., & Carl, L. (2015). Academic writing, real world topics. Broadview Press. Redefining Enterprise Cloud Technology Governance. (n.d.).
Report 497: Inquiry into Commonwealth financial statements 2021-22. (2023). Joint Committee of Public Accounts and Audit.
Responsible Artificial Intelligence Strategy and Implementation Pathway. (n.d.).
Rev, A. U. L. (2022). DATA LOCALIZATION: THE UNINTENDED CONSEQUENCES..., 67 Am. U. L. Rev. 927 Rev, L. L. (2022). RILEY V. CALIFORNIA: SETTING THE STAGE FOR THE..., 60 Loy. L. Rev. 997. Roberts, J. S., & Montoya, L. N. (2022). Decolonisation, Global Data Law, and Indigenous Data Sovereignty (arXiv:2208.04700). arXiv. http://arxiv.org/abs/2208.04700
Ron, R., Kelley, D., & Victoria, P. (2018). Assessing security requirements for controlled unclassified information (NIST SP 800-171A; p. NIST SP 800-171A). National Institute of Standards and Technology. https://doi.org/10.6028/NIST.SP.800-171A
Rose, S., Borchert, O., Mitchell, S., & Connelly, S. (2020). Zero Trust Architecture. National Institute of Standards and Technology. https://doi.org/10.6028/NIST.SP.800-207
Rosenfeld, A. (2021). Better Metrics for Evaluating Explainable Artificial Intelligence. Ross, R., Pillitteri, V., Dempsey, K., Riddle, M., & Guissanie, G. (2020). Protecting controlled unclassified information in nonfederal systems and organizations (NIST SP 800-171r2; p. NIST SP 800-171r2).
National Institute of Standards and Technology. https://doi.org/10.6028/NIST.SP.800-171r2
Ross, R., Pillitteri, V., Graubart, R., Bodeau, D., & McQuaid, R. (2019). Developing cyber resilient systems: A systems security engineering approach (NIST SP 800-160v2; p. NIST SP 800-160v2). National Institute of Standards and Technology. https://doi.org/10.6028/NIST.SP.800-160v2
Ross, R. S. (2014). Assessing Security and Privacy Controls in Federal Information Systems and Organizations: Building Effective Assessment Plans (NIST SP 800-53Ar4; p. NIST SP 800-53Ar4). National Institute of Standards and Technology. https://doi.org/10.6028/NIST.SP.800-53Ar4
Rourke, M., Eccleston-Turner, M., & Switzer, S. (2022). Sovereignty, sanctions, and data sharing under international law. Science, 375(6582), 724–726. https://doi.org/10.1126/science.abn5400
Rouvroy, A., & Poullet, Y. (2009). The Right to Informational Self-Determination and the Value of SelfDevelopment: Reassessing the Importance of Privacy for Democracy. In S. Gutwirth, Y. Poullet, P. De Hert, C. De Terwangne, & S. Nouwt (Eds.), Reinventing Data Protection? (pp. 45–76). Springer Netherlands. https://doi.org/10.1007/978-1-4020-9498-9_2
Rushby, J. (n.d.). The Security Model of Enhanced HDM. Saltz, J. (n.d.). What is a Machine Learning Life Cycle?
Schank, R. (2009). THE COMPUTER’S SUBCONSCIOUS. Applied Artificial Intelligence, 23(3), 186–203. https://doi.org/10.1080/08839510802700219
Schmertz, J. R., & Meier, M. (2022). APPLYING FRENCH DATA PROTECTION LAWS, SECOND CIRCUIT REVERSES DISMISSAL ON INTERNATIONAL COMITY GROUNDS IN DISPUTE OVER FRENCH
COMMERCIAL MAILING LIST, NOTING THAT COURT MUST DETERMINE ITS JURISDICTION BEFORE IT ENGAGES IN INTERNATIONAL COMITY ANALYSIS.
Schmitt, M. N., & NATO Cooperative Cyber Defence Centre of Excellence (Eds.). (2013). Tallinn manual on the international law applicable to cyber warfare: Prepared by the international group of experts at the invitation of the NATO Cooperative Cyber Defence Centre of Excellence. Cambridge University Press. Schrems, M. (n.d.). No non-material damages for GDPR violations? Analysis of the Advocate General Opinion in C-300/2.
Schwartz, R., Down, L., Jonas, A., & Tabassi, E. (2021). A Proposal for Identifying and Managing Bias in Artificial Intelligence. National Institute of Standards and Technology. https://doi.org/10.6028/NIST.SP.1270-draft
Scoping the OECD AI principles: Deliberations of the Expert Group on Artificial Intelligence at the OECD (AIGO) (OECD Digital Economy Papers 291; OECD Digital Economy Papers, Vol. 291). (2019). https://doi.org/10.1787/d62f618a-en
Seeborg, R. (2022). ORDER DENYING GOOGLE’S MOTION FOR DE NOVO DETERMINATION OF DISPOSITIVE MATTER REFERRED TO MAGISTRATE JUDGE
Sen, G., & Bingqin, L. (2019). The Digital Silk Road and the Sustainable Development Goals. IDS Bulletin, 50(4). https://doi.org/10.19088/1968-2019.137
Sha, T., & Peng, Y. (2023). Orthogonal semi-supervised regression with adaptive label dragging for crosssession EEG emotion recognition. Journal of King Saud University - Computer and Information Sciences, 35(4), 139–151. https://doi.org/10.1016/j.jksuci.2023.03.014
Shah, A., Ali, B., Habib, M., Frnda, J., Ullah, I., & Shahid Anwar, M. (2023). An ensemble face recognition mechanism based on three-way decisions. Journal of King Saud University - Computer and Information Sciences, 35(4), 196–208. https://doi.org/10.1016/j.jksuci.2023.03.016
Sheehan, M., Blumenthal, M., & Nelson, M. R. (n.d.). Three Takeaways From China’s New Standards Strategy.
Singhal, A., Winograd, T., & Scarfone, K. A. (2007). Guide to secure web services (NIST SP 800-95; 0 ed., p. NIST SP 800-95). National Institute of Standards and Technology. https://doi.org/10.6028/NIST.SP.800-95
Singi, K., Choudhury, S. G., Kaulgud, V., Bose, R. P. J. C., Podder, S., & Burden, A. P. (2020). Data Sovereignty Governance Framework. Proceedings of the IEEE/ACM 42nd International Conference on Software Engineering Workshops, 303–306. https://doi.org/10.1145/3387940.3392212
Solove, D. J. (2008). Understanding privacy. Harvard University Press.
Souppaya, M., Scarfone, K., & Dodson, D. (2021). Secure Software Development Framework (SSDF) Version 1.1: (Draft): Recommendations for Mitigating the Risk of Software Vulnerabilities [Preprint]. https://doi.org/10.6028/NIST.SP.800-218-draft
Stahlman, G. R., Heidorn, P. B., & Steffen, J. (2018). The Astrolabe Project: Identifying and Curating Astronomical Dark Data through Development of Cyberinfrastructure Resources. EPJ Web of Conferences, 186, 03003. https://doi.org/10.1051/epjconf/201818603003
Stine, K., Kissel, R., Barker, W. C., Fahlsing, J., & Gulick, J. (n.d.). Volume I: Guide for Mapping Types of Information and Information Systems to Security Categories. Stine, K., Kissel, R., Barker, W. C., Lee, A., & Fahlsing, J. (n.d.). Volume II: appendices to guide for mapping types of information and information systems to security categories
Stine, K., Quinn, S., Witte, G., & Gardner, R. K. (2020). Integrating Cybersecurity and Enterprise Risk Management (ERM). National Institute of Standards and Technology. https://doi.org/10.6028/NIST.IR.8286
Stockton, J., & November, Q. (n.d.). Choosing Your AI Battles: Storey, V. C., Lukyanenko, R., Maass, W., & Parsons, J. (2022). Explainable AI. Communications of the ACM, 65(4), 27–29. https://doi.org/10.1145/3490699
Stuntz, W. J. (1995). The Substantive Origins of Criminal Procedure. The Yale Law Journal, 105(2), 393. https://doi.org/10.2307/797125
Su, C., & Tang, W. (2023a). Data sovereignty and platform neutrality – A comparative study on TikTok’s data policy. Global Media and China, 8(1), 57–71. https://doi.org/10.1177/20594364231154340
Su, C., & Tang, W. (2023b). Data sovereignty and platform neutrality – A comparative study on TikTok’s data policy. Global Media and China, 8(1), 57–71. https://doi.org/10.1177/20594364231154340
Svantesson, D. J. B. (2016a). Against ‘Against Data Exceptionalism.’ Masaryk University Journal of Law and Technology, 10(2), 200–211. https://doi.org/10.5817/MUJLT2016-2-4
Svantesson, D. J. B. (2016b). Against ‘Against Data Exceptionalism.’ Masaryk University Journal of Law and Technology, 10(2), 200–211. https://doi.org/10.5817/MUJLT2016-2-4
Svantesson, D. J. B. (2016c). Against ‘Against Data Exceptionalism.’ Masaryk University Journal of Law and Technology, 10(2), 200–211. https://doi.org/10.5817/MUJLT2016-2-4
Svantesson, D. J. B. (2016d). Against ‘Against Data Exceptionalism.’ Masaryk University Journal of Law and Technology, 10(2), 200–211. https://doi.org/10.5817/MUJLT2016-2-4
Taichman, E. (n.d.). Defend Forward & Sovereignty: How America’s Cyberwar Strategy Upholds International Law. 53.
Tajalizadehkhoob, S., Van Goethem, T., Korczyński, M., Noroozian, A., Böhme, R., Moore, T., Joosen, W., & Van Eeten, M. (2017). Herding Vulnerable Cats: A Statistical Approach to Disentangle Joint Responsibility for Web Security in Shared Hosting. Proceedings of the 2017 ACM SIGSAC Conference on Computer and Communications Security, 553–567. https://doi.org/10.1145/3133956.3133971
Tambiama, M. (n.d.). Digital sovereignty for Europe.
Taylor, E., & Hoffmann, S. (n.d.). EU–US Relations on Internet Governance
The Australian Privacy Principles. (2014).
The Patriot Act’s Erosion of Constitutional Rights. (2006). 32(2).
The Threat Intelligence Handbook, Second Edition. (n.d.).
Thierer, A. (n.d.). Blumenthal-Hawley AI Regulatory Framework Escalates the War on Computation. Tian, C. (n.d.). Classification of Indigenous Data Sovereignty and Data Privacy: Indigenous and Common Law Patterns.
Tippins, N., Oswald, F., & McPhail, S. M. (2021). Scientific, Legal, and Ethical Concerns About AI-Based Personnel Selection Tools: A Call to Action. Personnel Assessment and Decisions, 7(2). https://doi.org/10.25035/pad.2021.02.001
Tools for trustworthy AI: A framework to compare implementation tools for trustworthy AI systems (OECD Digital Economy Papers 312; OECD Digital Economy Papers, Vol. 312). (2021). https://doi.org/10.1787/008232ec-en
Toth, P. (2017). NIST MEP cybersecurity self-assessment handbook for assessing NIST SP 800-171 security requirements in response to DFARS cybersecurity requirements (NIST HB 162; p. NIST HB 162). National Institute of Standards and Technology. https://doi.org/10.6028/NIST.HB.162
Tschantz, M. C., Sen, S., & Datta, A. (2020). SoK: Differential Privacy as a Causal Property. 2020 IEEE Symposium on Security and Privacy (SP), 354–371. https://doi.org/10.1109/SP40000.2020.00012
Turpin, S., & Marais, M. (2004). Decision-making: Theory and practice. ORiON, 20(2). https://doi.org/10.5784/20-2-12
Uchida, H., Matsubara, M., Wakabayashi, K., & Morishima, A. (2020). Human-in-the-loop Approach towards Dual Process AI Decisions. 2020 IEEE International Conference on Big Data (Big Data), 3096–3098. https://doi.org/10.1109/BigData50022.2020.9378459
Ünver, H. A. (2024). Politics of Digital Surveillance, National Security and Privacy. Vatanparast, R. (2020). Data and the Elasticity of Sovereignty. SSRN Electronic Journal. https://doi.org/10.2139/ssrn.3609579
Volkmer, I. (2021). Digital sovereignty and approaches to governing globalized data spaces. In G. Feindt, B. Gissibl, & J. Paulmann (Eds.), Cultural Sovereignty beyond the Modern State (pp. 128–146). De Gruyter. https://doi.org/10.1515/9783110679151-007
Volokh, E. (n.d.). IN THE UNITED STATES COURT OF APPEALS FOR THE SECOND CIRCUIT. Wade, L. (n.d.). / ODNI Home (/index.php) / Newsroom (/index.php/newsroom) / News Articles (/index.php/newsroom/news-articles) / News Articles 2022 (/index.php/newsroom/newsarticles/news-articles-2022).
Walter, M., Kukutai, T., Carroll, S. R., & Rodriguez-Lonebear, D. (2020). Indigenous Data Sovereignty and Policy (1st ed.). Routledge. https://doi.org/10.4324/9780429273957
Walter, M., Lovett, R., Maher, B., Williamson, B., Prehn, J., Bodkin‐ Andrews, G., & Lee, V. (2021). Indigenous Data Sovereignty in the Era of Big Data and Open Data. Australian Journal of Social Issues, 56(2), 143–156. https://doi.org/10.1002/ajs4.141
Wang, R., Zhang, C., & Lei, Y. (2024). Justifying a Privacy Guardian in Discourse and Behaviour: The People’s Republic of China’s Strategic Framing in Data Governance. The International Spectator, 1–19. https://doi.org/10.1080/03932729.2024.2315064
Warner, R. (2010). Undermined Norms: The Corrosive Effect of Information Processing Technology on Informational Privacy. SSRN Electronic Journal. https://doi.org/10.2139/ssrn.1579094
Wessel, D., Claudy, S., Hanke, K., Herzog, C., Preiß, R., Wegner, C., & Heine, M. (2022). Prototypes for Egovernment Websites to support the Digital Sovereignty of Citizens. Mensch Und Computer 2022, 615–617. https://doi.org/10.1145/3543758.3547514
Which is more important: Online privacy or national security? (2024).
White paper Industrial Data Space. (n.d.).
Whitehead, J. W., & Winters, W. E. (n.d.). BRIEF OF THE CATO INSTITUTE AND THE RUTHERFORD INSTITUTE AS AMICI CURIAE IN SUPPORT OF DEFENDANT-APPELLANTS. Wohlfarth, M. (n.d.). Data Portability on the Internet: An Economic Analysis. Woods, A. K. (n.d.). Data Beyond Borders: Mutual Legal Assistance in the Internet Era. Woods, A. K. (2016a). Against Data Exceptionalism
Wu, E. (n.d.). Sovereignty and Data Localization.
Yang, B., Wang, C., Ji, S., Zhou, Y., & Qureshi, N. M. F. (2023). An effective revocable and traceable public auditing scheme for sensor-based urban cities. Journal of King Saud University - Computer and Information Sciences, 35(4), 152–160. https://doi.org/10.1016/j.jksuci.2023.03.012
Yayboke, B. E., & Brannen, S. (n.d.). Promote and Build: A Strategic Approach to Digital Authoritarianism
Yayboke, B. E., Ramos, C. G., & Sheppard, L. R. (n.d.). The Real National Security Concerns over Data Localization.
Yayboke, E., & Brannen, S. (n.d.). A Strategic Approach to Digital Authoritarianism
Yntema, H. E. (1953). The Historic Bases of Private International Law. The American Journal of Comparative Law, 2(3), 297. https://doi.org/10.2307/837480
Zanon, N. B., Erlingsson, H.-P., & Tohmo, J. (2022). Enabling GDPR/Schrems II Compliance. Zhang, C., & Morris, C. (2023). Borders, bordering and sovereignty in digital space. Territory, Politics, Governance, 11(6), 1051–1058. https://doi.org/10.1080/21622671.2023.2216737
Zhang, J., & Dong, C. (2023). Privacy-preserving data aggregation scheme against deletion and tampering attacks from aggregators. Journal of King Saud University - Computer and Information Sciences, 35(4), 100–111. https://doi.org/10.1016/j.jksuci.2023.03.002
Zhang, Y. (Cicilia), Frank, R., Warkentin, N., & Zakimi, N. (2022). Accessible from the open web: A qualitative analysis of the available open-source information involving cyber security and critical infrastructure. Journal of Cybersecurity, 8(1), tyac003. https://doi.org/10.1093/cybsec/tyac003
Jack Tilbury LinkedIn
Jack - Tilbury@utulsa.edu
JackTilbury Google Scholar
● Security P roduct Manager
● Security,Risk & Resilient Strategy Consulting
● Security An alystOperations
● Research S cientist
Working Location Preference
Tulsa Area, Florida, Chicago, Washington, Remote
JackTilburyisasecond-yearPh.D.studentatTheUniversityofTulsa.Heobtained hisresearch-basedMCominInformationSystemsfromRhodesUniversity,South Africa,in2019.JackwasawardedafullscholarshiptopursuehisMaster'sdegree, whichexploredthePropTechindustry–conductingrealestatetransactionsthrough blockchaintechnology. HegraduatedatthetopofhisInformationSystemshonors classasheobtainedaBusinessScienceundergraduatedegree.Sincearrivingin Tulsa,JackhasattendedandpublishedattheAnnualSecurityConferenceandhas beeninvitedtopresentattheUNESCOSafetyConference.Hisresearchincludes informationsystems,behavioralinformationsecurity,andautomateddecisionaidsin securityoperationcenters.BeforestartinghisPh.D.research,Jackworkedasa ProductManagerintheITindustryattwosoftwaredevelopmentcompanies.
JackworkedfortwoyearsasaProductManagerwithexperienceinstart-upand corporateenvironments,buildingandlaunchingmultipleproductstomarket.Jackis eagertocontributetothedevelopmentofsecurityproductseitherthroughleading productteams,engagingwithproductcustomers,orconductingproductresearch.

Cyber Fellows: Gerardo Vera 1, Julian Atuguba 2 , Connor Tucker 3
Faculty: Eduardo Pereyra 1, Peter Hawrylak 2 , Mauricio Papa 3 , Ph.D.
1 School of Cyber Studies, The University of Tulsa, Tulsa, OK 74104, United States,
2 McDougall School of Petroleum Engineering, The University of Tulsa, Tulsa, OK 74104, United States
3 The Tandy School of Computer Science, The University of Tulsa, Tulsa, OK 74104, United States
Methane is an important greenhouse gas, second only to CO2. It is eighty times more powerful than CO2 but has a much shorter shelf life (Omara et al. 2022). This means that its concentration in the atmosphere can be reduced much faster Therefore, reducing the emissions of methane into the atmosphere would have a short-term impact on global warming. Studies also show that methane in the atmosphere is responsible for an increase of 0.5 degrees Celsius in global temperature since 1750 (IPCC, 2021). And while this is a little more than half the effect of CO2, it can be remediated in the short term by controlling and reducing the emissions of methane today.
Methane (pre-treatment) is an odorless and invisible gas to the naked eye. This makes detecting it particularly hard. The oil and gas industry has been dealing with methane leaks for a while. The production of methane for its use as natural gas means that leaks are bound to happen. The oil and gas industry accounts for around 70% of the anthropogenic methane emissions in the US (Omara et al. 2022). Current methods for detecting methane leaks are expensive and hard to implement (NARUC, 2019). The most accurate systems, infrared cameras, cost about $90K and are limited to areas within the range of vision.
Portable devices cost around $10K and are limited to a point where the device is aiming at. Other alternatives like cameras mounted on planes or even satellites are more expensive and less accurate as the area of coverage increases. Studies show that there is no correlation between the amounts of oil and gas produced and the amount of methane leaking, therefore it is not necessarily the wells producing the most revenue that will demand more monitoring or remediation of leaks. Therefore, a low-cost solution is required.
Also, plane flybys and satellite sweeps are limited in time to the moment when the vessel is above the area of interest. Just like handheld devices are limited to the time when the operator is looking for leaks in an
area. Studies show that methane leaks can be intermittent and sometimes the larger leaks are the intermittent ones (Collins et. al. 2022). Also, leaks can be large, and waiting for a periodic monitoring system to detect them would allow a large amount of methane to leak into the atmosphere before even that leak is noticed. This calls for a continuous monitoring solution. Continuous monitoring requires several sensors deployed across big areas, for this to be feasible the sensors should have a low cost.
Methane emission quantification is done by extrapolating the data gathered by the sporadic monitoring approaches presented before. Therefore, having a multitude of sensors deployed across areas could also improve our estimation or measurement of total methane emitted into the atmosphere Relying on several sensors also makes this solution scalable to work on areas of varying sizes and footprints.
The concept of Wireless Sensor Networks (WSN) is already being studied in literature. Precisely for environmental monitoring. They take care of the scalability problem and even simplify the deployment by relying on wireless communication protocols. WSN also improves the versatility of these systems, by making it easy to move the nodes to better locations, replace nodes with faulty components, and even reduce the overall deployment cost by avoiding completely the need to install wiring across large areas (Klein et al., 2018).
WSNs are already being tested. However, the cost of well-performing sensors makes them prohibitive to be deployed on a large scale. Especially for low-producing wells which are the majority in the US. There are several low-cost methane sensors already commercially available. Their readings depend on external factors like temperature and humidity that are factored out in more expensive industrial solutions. Obtaining from these sensors a performance comparable to that of the well-known industrial solutions would enable the possibility of developing low-cost wireless sensor networks for methane detection and quantification.
The ultimate goal of a methane emissions continuous monitoring system is to reduce the emission of methane by remediating leaks. Therefore, once methane is detected by the sensing nodes of the WSN, a way to locate the position of the leak is required, so that it can be remediated. For quantification purposes, estimating the size of the leak in terms of mass flow rate is also required.
Atmospheric transport models are used for predicting pollutant concentrations downwind of a source. Given the source size (mass flow rate) and the meteorological conditions affecting the movement of the air carrying the pollutant, the concentration of that pollutant can be estimated at any point in space downwind of the source. The quality of the estimation depends on the accuracy of the model, and the accuracy of the
model depends on the complexity of the model. There are several variables to take into account, like the wind direction, the wind speed, the solar radiation, and others, that are not steady but are changing in time.
In order to monitor varying windspeed, we utilize low power and cost-effective wind sensors that operate using the Hot-Wire Anemometry (HWA) technique. HWA operates by observing the change in temperature of a heated wire exposed to a fluid. The rate of heat loss from the wire to the surrounding fluid is dependent on the velocity of the fluid. The change in voltage required to maintain the temperature of the hot wire is used to calculate the wind speed of the ambient fluid. Despite the introduction of new methods such as Laser-Doppler Anemometry (LDA) and Particle Image Velocimetry (PIV), HWA remains relevant due to its fast response time in capturing flow changes based on its ability to directly measure velocity through the cooling effect of ambient temperature on a heated wire, cost effectiveness, its applicability in different environments, simplicity and ease of use. These wind sensors are highly sensitive and versatile in the sense that they are able to record wind speed as well ambient temperature but need to be calibrated in order to work effectively.
The most accurate and complex models that perform the calculations in real-time with varying inputs demand high computing power. This requires expensive computer components that are out of the scope of a low-cost solution. Therefore, a simple model is proposed, the Gaussian Plume atmospheric transport model. Making some assumptions or simplifications, the Gaussian Plume model simplifies the transient 3D advection 3D diffusion problem of atmospheric transport, to a steady state 1D advection 2D diffusion problem without losing much accuracy. However this model was derived to know the concentration of a pollutant downwind of a known source, and the opposite is required in this case. The location and magnitude estimation of an unknown leak source given scarce concentration readings at random points downwind require the inversion of the Gaussian Plume model.
References
Collins, W., Orbach, R., Bailey, M., Biraud, S., Coddington, I., DiCarlo, D., Peischl, J., Radhakrishnan, A., & Schimel, D. (2022). Monitoring Methane Emissions from Oil and Gas Operations. PRX Energy, 1(1), 017001. https://doi.org/10.1103/PRXEnergy.1.017001 Klein, L., Ramachandran, M., van Kessel, T., Nair, D., Hinds, N., Hamann, H., & Sosa, N. (2018). Wireless Sensor Networks for Fugitive Methane Emissions Monitoring in Oil and Gas Industry. 2018
IEEE International Congress on Internet of Things (ICIOT), 41–48. https://doi.org/10.1109/ICIOT.2018.00013
Omara, M., Zavala-Araiza, D., Lyon, D. R., Hmiel, B., Roberts, K. A., & Hamburg, S. P. (2022). Methane emissions from US low production oil and natural gas well sites. Nature Communications, 13(1), 2085. https://doi.org/10.1038/s41467-022-29709-3
NARUC. 2019. Sampling of Methane Emissions Detection Technologies and Practices for Natural Gas Distribution Infrastructure An Educational Handbook for State Energy Regulators A Product of the DOE-NARUC Natural Gas Infrastructure Modernization Partnership. Bruun, H. H., Khan, M. A., Al-Kayiem, H. H., and Fardad, A. A. "Velocity Calibration Relationships for Hot-Wire Anemometry." Journal of Physics E: Scientific Instruments, vol. 21, no. 2, 1988, pp. 225. IOP Publishing Ltd, doi:10.1088/0022-3735/21/2/020.
Gerardo Vera, MEng.
Gerardo is a research assistant at the School of Cyber Studies of The University of Tulsa pursuing a Ph.D. degree in Cyber Studies with a focus on machine learning and data analytics . He holds a bachelor’s degree in Mechanical and Industrial Automation Engineering combining physics-based engineering with programming engineering. He has hands-on experience working with PLCs, HMIs, and microcontrollers used to automate mechanical machines and industrial processes. Gerardo received his M.Eng. degree in Petroleum Engineering from The University of Tulsa. He interned at Schlumberger working in Convolutional Neural Networks to speed up rese rvoir simulations. His research topic is Methane leak detection and quantification
Julian Atuguba, BSPE.
Julian is a research assistant at the School of Cyber Studies of The University of Tulsa pursuing a Ph.D. degree in Cyber Studies with a focus on data science. He holds a bachelor’s degree in Petroleum Engineering with a minor in Mathematics from The University of Tulsa. Julian worked as a Research assistant at the Tulsa University Horizontal Well and Artificial Lift Projects (TUHWALP) department before taking a post as a Production Engineer at the Ghana National Petroleum Corporation (GNPC). His research topic is Utilizing Low-power Wind Sensors to Locate and Infer the Emission Rate of Natural Gas to the Atmosphere.
Connor Tucker
Eduardo Pereyra, Ph.D.
Eduardo Pereyra, PhD. is an associate professor at the McDougall School of Petroleum Engineering and associate director at the Fluid Flow Project (TUFFP.org) and Horizontal Wells Artificial Lift Projects of The University of Tulsa (TUHWALP.org). Eduardo holds two B.E. degrees, one in mechanical engineering and one in system engineering, from the University of Los A ndes, Merida, Venezuela. He received his M.Sc. and Ph.D. in Petroleum Engineering from The University of Tulsa. He started his career at the R&D center of the Venezuelan oil company PDVSA -Intevep. He also worked for Multiphase System Integration (MSI) and at Chevron’s Advanced Production Technology Unit as a Research Scientist Intern.
His research interests are multiphase flow and its application to transportation, flow assurance, artificial lift, multiphase measurements, and separation technologies.
Peter Hawrylak, Ph.D.
Peter J. Hawrylak, Ph.D., received his B.S. degree in computer engineering, M.S. degree in electrical engineering, and Ph.D. in electrical engineering from the University of Pittsburgh. Peter is an associate professor in the department of electrical and computer engineering, with a joint appointment in the Tandy School of Computer Science and the School of Cyber Studies, at The University of Tulsa. Hawrylak has published more than 65 publications and holds 15 patents in the radio frequency identification (RFID), energy harvesting, and cyber-security areas. Hawrylak’s research interests include RFID (radio frequency identification), security for low -power wireless devices, Internet of Things (IoT) applications, and digital design.
Mauricio Papa, Ph.D.
Mauricio Papa is the Brock Associate Professor at The Tandy School of Computer Science. His primary research area is critical infrastructure protection and operational technology (OT) security, areas in which he has helped design process control testbeds to support cybersecurity efforts. He has participated in funded research efforts (DARPA, DoD, DoJ, NSF, DoE and private industry) to develop cybersecurity solutions for the electric power sector, transportation sector, nuclear reactors and oil & gas sectors. Dr. Papa has also conducted research in the Internet of Things (IoT) domain. In this area he has worked on solutions to help secure firmware updates in wireless IoT devices (ESP8266-based) to mitigate supply-chain risks. He is currently leading a team as PI to create a gas pipeline security pilot study. This project seeks to build a transformative testbed that supports operational and security research in the OT domain.
About Cameron

Jack Tilbury LinkedIn
Jack - Tilbury@utulsa.edu
JackTilbury Google Scholar
● Security P roduct Manager
● Security,Risk & Resilient Strategy Consulting
● Security An alystOperations
● Research S cientist
Working Location Preference
Tulsa Area, Florida, Chicago, Washington, Remote
Internships / RA / TA / Work History
Year Position
2022Present Doctoral Researcher University of Tulsa
20202022 Product Manager Flash Mobile Vending & The Delta, South Africa
2019 Assistant Lecturer and Teaching Assistant Rhodes University
2018 Software Implementation Analyst Saratoga, Cape Town
JackTilburyisasecond-yearPh.D.studentatTheUniversityofTulsa.Heobtained hisresearch-basedMCominInformationSystemsfromRhodesUniversity,South Africa,in2019.JackwasawardedafullscholarshiptopursuehisMaster'sdegree, whichexploredthePropTechindustry–conductingrealestatetransactionsthrough blockchaintechnology. HegraduatedatthetopofhisInformationSystemshonors classasheobtainedaBusinessScienceundergraduatedegree.Sincearrivingin Tulsa,JackhasattendedandpublishedattheAnnualSecurityConferenceandhas beeninvitedtopresentattheUNESCOSafetyConference.Hisresearchincludes informationsystems,behavioralinformationsecurity,andautomateddecisionaidsin securityoperationcenters.BeforestartinghisPh.D.research,Jackworkedasa ProductManagerintheITindustryattwosoftwaredevelopmentcompanies.
JackworkedfortwoyearsasaProductManagerwithexperienceinstart-upand corporateenvironments,buildingandlaunchingmultipleproductstomarket.Jackis eagertocontributetothedevelopmentofsecurityproductseitherthroughleading productteams,engagingwithproductcustomers,orconductingproductresearch.

About Cameron
Professional Experience Preference
●
●
Working Location Preference
Internships / RA / TA / Work History

Mukesh Yadav, Peter Hawrylak
March 2024
Effective reduction of state in an attack graph is crucial for predicting threats in the system. This ablation study explores different state reduction algorithms including node ranking algorithms based on graph structure; state indexing, Naive Bayes, and modified Naive Bayes algorithms based on evidence. State indexing lacks prior knowledge; Naive Bayes utilizes prior knowledge; modified Naive Bayes algorithm includes prior, evidence, and graph structure information for the analysis. A comparison of these state reduction algorithms is made based on the quality of a reduced set of states. The reduced set of states contains a highly probable set of states that capture intrinsic details about the attack graph. This study utilizes attack graphs in which nodes represent system states and edges represent exploits. The experiment used in our study reveals that the algorithms that use evidence perform better than algorithms that utilize graph structures. Consequently, the modified Naive Bayes algorithm is selected for the state reduction task for the analysis of attack graphs. Security professionals use attack graphs to analyze threats in various systems. As networks grow in size, the number of vulnerabilities increases, which also leads to an increase in the number of possible attack scenarios (exploits). The number of exploits correlates positively with the size of the attack graph. Larger attack graphs pose challenges when analyzing every relevant node. By reducing the number of nodes for analysis, the security professional can better focus on critical states, leading to better predictions of upcoming threats. Nodes in the attack graph contain detailed facts about the states of the system. The various analyses include node ranking algorithms based on graph structure and evidence-based Bayesian attack graphs. In this study, we consider both the graph structure and observation to reduce the number of nodes. Observations are readings made by sensors, intruder detection systems (IDS), and humans that match with features of the node. Attack graphs are used to model the hypothetical system scenarios where an attacker violates the security of a system [1]. Attack graphs have been used for the analysis of vulnerability in computer networks [2]. There are various research papers that utilize different representations of attack graphs [1]. Various representations of attack graphs are present because nodes and edges can be used to represent different scenarios in the system. In some cases, nodes denote the system state and edges indicate action[3]. Additionally, nodes can refer to conditional states and edges indicate causal relationship[4]. Nodes can also indicate network state and
edges depict exploits[5]. In certain cases, nodes indicate conditions, and edges represent exploits [6]. In some studies, nodes depict the host and edges depict exploits [7]. In our study, attack graphs where nodes represent network states, and edges represent exploits are generated and evaluated. Each of the representations has its unique probabilistic ways of analyzing risk and attack path [8]. Probabilistic methods have been used to improve the analysis of uncertainty and risk in attack graphs [9]. Probabilistic methods were used for the analysis of interdependence between vulnerability [10, 11]. There are various studies for node ranking algorithms, PageRank-like algorithm [12], and graph neural network (GNN) based method [13]. In the graph neural network method, pseudo attack graphs were used to train the model and then it was used to calculate the node ranking of attack graphs. This algorithm finds critical states based on graph structure. Node ranking algorithms are better for analyzing the effect of patching vulnerabilities and changes in firewall rules. However, the activities of an intruder that can change the importance of system states are not considered. Intruder activities produce observations that can be observed by the sensor, IDS, or human. Bayesian attack graph includes observations as evidence however the size of the conditional probability table grows exponentially as the number of parents for nodes increases [14]. As the amount of evidence increases, there is a polynomial increase in the size of conditional probability table [15]. Moreover, Bayesian attack graph analysis assumes that the compromise of the system will be detected in routine monitoring of the system [16]. As the size of the attack graph increases, the assumption becomes more unrealistic. The Bayesian Attack graph has been used for the analysis of attack path [17, 18]. Our proposed method utilizes both graph structure and multiple observations to reduce the number of nodes to be analyzed.
I received a B.S in computer Engineering from Tribhuvan University, and an M.S in computer science from the University of Tulsa. I am currently a PhD student at the University of Tulsa, where I work as a Research Assistant. My research revolves around using graph neural networks to solve real world problems, particularly in the context of analyzing attack graphs. I am stu dying and analyzing complex networks of information related to cyberattacks.
Peter J. Hawrylak, Ph.D., received his B.S. degree in computer engineering, M.S. degree in electrical engineering, and Ph.D. in electrical engineering from the University of Pittsburgh. Peter is an associate professor in the department of electrical and computer engineering, with a joint appointment in the Tandy School of Computer Science and the School of Cyber Studies, at The University of Tulsa. Hawrylak has published more than 65 publications and holds 15 patents in radio frequency identification (RFID), energy harvesting, and cyber-
security areas. Hawrylak’s research interests include RFID (radio frequency identification), security for low-power wireless devices, Internet of Things (IoT) applications, and digital design.
References
[1] M. A. Alhomidi and M. J. Reed, “Attack graphs representations,” in 2012 4th Computer Science and Electronic Engineering Conference (CEEC) , Sep. 2012, pp. 83–88.
[2] O. Sheyner, J. Haines, S. Jha, R. Lippmann, and J. Wing, “Automated generation and analysis of attack graphs,” in Proceedings 2002 IEEE Symposium on Security and Privacy, May 2002, pp. 273–284, iSSN: 1081-6011.
[3] S. Braynov and M. Jadliwala, “Representation and analysis of coordinated attacks,” in Proceedings of the 2003 ACM workshop on Formal methods in security engineering, ser. FMSE ’03. New York, NY, USA: Association for Computing Machinery, Oct. 2003, pp. 43–51.
[4] P. Ammann, D. Wijesekera, and S. Kaushik, “Scalable, graph-based network vulnerability analysis,” in Proceedings of the 9th ACM conference on Computer and communications security, ser. CCS ’02. New York, NY, USA: Association for Computing Machinery, Nov. 2002, pp. 217–224.
[5] P. Ammann, J. Pamula, R. Ritchey, and J. Street, “A host-based approach to network attack chaining analysis,” in 21st Annual Computer Security Applications Conference (ACSAC’05), Dec. 2005, pp. 10 pp.–84, iSSN: 1063-9527.
[6] S. Jajodia, S. Noel, and B. O’Berry, “Topological Analysis of Network Attack Vulnerability,” in Managing Cyber Threats: Issues, Approaches, and Challenges, ser. Massive Computing, V. Kumar, J. Srivastava, and A. Lazarevic, Eds. Boston, MA: Springer US, 2005, pp. 247–266.
[7] S. Zhong, D. Yan, and C. Liu, “Automatic Generation of Host-Based Network Attack Graph,” 2009 WRI World Congress on Computer Science and Information Engineering, pp. 93–98, 2009, conference Name: 2009 WRI World Congress on Computer Science and Information Engineering ISBN: 9780769535074 Place: Los Angeles, California USA Publisher: IEEE.
[8] L. Wang, T. Islam, T. Long, A. Singhal, and S. Jajodia, “An Attack GraphBased Probabilistic Security Metric,” in Data and Applications Security XXII, V. Atluri, Ed. Berlin, Heidelberg: Springer Berlin
Heidelberg, 2008, vol. 5094, pp. 283–296, series Title: Lecture Notes in Computer Science.
[9] Y. Yun, X. Xi-shan, and Q. Zhi-chang, “A Probabilistic Computing Approach of Attack Graph-Based Nodes in Large-Scale Network,” Procedia Environmental Sciences, vol. 10, pp. 3–8, Jan. 2011.
[10] M. Frigault and L. Wang, “Measuring Network Security Using Bayesian Network-Based Attack Graphs,” in 2008 32nd Annual IEEE International Computer Software and Applications Conference, Jul. 2008, pp. 698–703, iSSN: 0730-3157.
[11] L. Wang, A. Singhal, and S. Jajodia, “Toward measuring network security using attack graphs,” in Proceedings of the 2007 ACM workshop on Quality of protection, ser. QoP ’07. New York, NY, USA: Association for Computing Machinery, Oct. 2007, pp. 49–54.
[12] V. Mehta, C. Bartzis, H. Zhu, E. Clarke, and J. Wing, “Ranking Attack Graphs,” in Recent Advances in Intrusion Detection, ser. Lecture Notes in Computer Science, D. Zamboni and C. Kruegel, Eds. Berlin, Heidelberg: Springer, 2006, pp. 127–144.
[13] L. Lu, R. Safavi-Naini, M. Hagenbuchner, W. Susilo, J. Horton, S. L. Yong, and A. C. Tsoi, “Ranking Attack Graphs with Graph Neural Networks,” in Information Security Practice and Experience, ser. Lecture Notes in Computer Science, F. Bao, H. Li, and G. Wang, Eds. Berlin, Heidelberg: Springer, 2009, pp. 345–359.
[14] P. Laitila and K. Virtanen, “Advancing construction of conditional probability tables of Bayesian networks with ranked nodes method, ” International Journal of General Systems, vol. 51, no. 8, pp. 758–790, Nov. 2022, publisher: Taylor & Francis eprint: https://doi.org/10.1080/03081079.2022.2086541.
[15] S. Chockalingam, W. Pieters, A. M. H. Teixeira, and P. van Gelder, “Probability elicitation for Bayesian networks to distinguish between intentional attacks and accidental technical failures,” Journal of Information Security and Applications, vol. 75, p. 103497, Jun. 2023. [Online]. Available: https://www.sciencedirect.com/science/article/pii/S2214212623000819
[16] A. Kazeminajafabadi and M. Imani, “Optimal monitoring and attack detection of networks modeled by Bayesian attack graphs,” Cybersecurity, vol. 6, no. 1, p. 22, Sep. 2023.
[17] R. L. Minz, S. P. Nagarmat, R. Rakesh, and Y. Isobe, “Cyber Security Using Bayesian Attack Path Analysis,” in third International Conference on Cyber-Technologies and Cyber-Systems, 2018.
[18] Y. Liu and H. Man, “Network vulnerability assessment using Bayesian networks,” in Data Mining, Intrusion Detection, Information Assurance, and Data Networks Security 2005, vol. 5812. SPIE, Mar. 2005, pp. 61–71.
About Cameron
Professional Experience Preference
●
●
Working Location Preference
Internships / RA / TA / Work History

Student Author
Emil Eminov Advisor
Dr. Flowerday Stephen
Abstract
This study investigates the expanding problem of money laundering using online in-game asset trading platforms, which conceal illegal activities with decentralized frameworks and anonymity. By evaluating anonymized transaction data, it identifies suspicious behavior to help efficient anti-money laundering (AML) strategies. Key findings demonstrate several sophisticated tactics, including the use of the Interquartile Range approach for outlier identification and network analysis to find high-volume transactions and U-turn transactions. The research significantly contributes by identifying new, concerning trends, and unraveling complex networks by utilizing a broad range of analysis tools on in-game asset transaction data. These findings demonstrate how important the study is to broaden the field of money laundering research and educate stakeholders about the increasing issue of criminality in the online gaming industry. It also helps inform experts and lawmakers concerning cyber laundering tactics.
About Emil Eminov
Emil is a Cyber Fellow and is pursuing a PhD in Cyber at the University of Tulsa. His fascination with chess brought him into the field of Information Technology where everything you see is one big riddle. He graduated Summa Cum Laude with an applied associate degree in information security and Networking at Oklahoma State University. During his tenure, he also served as a Vice President at the Phi Theta Kappa fraternity, which only accepted students with stellar GPA. Following graduation, he came to evaluate his next move which brought him to study Computer Engineering at the University of Duisburg-Essen where he made his undergraduate.
Dr. Stephen Flowerday is a Professor of Information Systems at the School of Cyber Studies. He did his undergraduate work in Business Administration at Century University. He did his graduate work at the Oxford Brookes University where he obtained MBA in Business Administration. He obtained his Ph.D. in Information Technology at Nelson Mandela University. He directs the Graduate Program in Cyber Studies, with over thirty full-time doctoral students researching cybersecurity-related topics.
Anwar, M. (2023). The urgency of reforming regulations for money laundering in the digital era. East Asian Journal of Multidisciplinary Research 2.7, pp. 2895-2906.
Cheong, T. M., & Si, Y. (2010). Event-based approach to money laundering data analysis and visualization. In Proceedings of the 3rd International Symposium on Visual Information Communication, pp. 1-11.
Chua, Y. T. (2023). Sale of private, confidential, and personal data. Handbook on Crime and Technology Edward Elgar Publishing, pp. 138-155.
Cloward, J. G., & Abarbanel, B. (2020). In-game currencies, skin gambling, and the persistent threat of money laundering in video games. UNLV Gaming LJ 10, p. 105.
Cooke, D., & Marshall, A. (n.d.). Money Laundering Through Video Games, a Criminal's Playground. Available at SSRN 4750614.
De Streel, A., Defreyne, E., Jacquemin, H., Ledger, M., & Michel, A. (2020). Online Platforms' Moderation of Illegal Content Online. Law, Practices and Options for Reform.
Dumchikov, M., Reznik, O., & Bondarenko, O. (2023). Peculiarities of countering legalization of criminal income with the help of virtual assets: legislative regulation and practical implementation. Journal of Money Laundering Control 26.1, pp. 50-59.
Dupuis, D., Smith, & Gleason. (2023). Old frauds with a new sauce: digital assets and space transition. Journal of Financial Crime 30.1, 205-220.
Hagberg, A., Swart, P., & S Chult, D. (2008). Exploring network structure, dynamics, and function using NetworkX. Proceedings of the 7th Python in Science Conference, pp. 11–15.
Levi, M. (2002). Money laundering and its regulation. The Annals of the American Academy of Political and Social Science, 582(1), pp.181-194.
Mahmood, S. (2022, May 5). Outlier Detection (Part 1) IQR, Standard Deviation, Z-score and Modified Z-score. Retrieved from Towards Data Science: https://towardsdatascience.com/outlierdetection-part1-821d714524c
Reider-Gordon, M. (2023). Not a Game: The Need to Harmonize a Global Regulatory Approach to Combat Money Laundering via Virtual Assets in Massively Multiplayer Online Games.
CYBER LAUNDERING: International Policies and Practices, pp. 105-143.
Roomberg, M. (2023). The video game industry's money laundering problem: when do game publishers become money transmitters? Russ. J. Econ. & L. 17, p. 630.
Simser, J. (2012). Money laundering: emerging threats and trends. Journal of Money Laundering Control, 16(1), pp.41-54.
Singh, K., & Best, P. (2019). Anti-money laundering: Using data visualization to identify suspicious activity. International Journal of Accounting Information Systems, 34, p. 100418.
Sinno, R. M., Baldock, G., & Gleason, K. (2023). The evolution of trade-based money laundering schemes: a regulatory dialectic perspective. Journal of Financial Crime Sun, X., Feng, W., Liu, S., Xie, Y., Bhatia, S., & Hooi, B. (2022). MonLAD: Money laundering agents detection in transaction streams. In Proceedings of the Fifteenth ACM International Conference on Web Search and Data Mining, pp. 976-986.
Tiwari, M., Gepp, A., & Kumar, K. (2020). A review of money laundering literature: the state of research in key areas. Pacific Accounting Review 32.2, pp.271-303.
Villányi, B. (2021). Money Laundering: History, Regulations, and Techniques. Oxford Research Encyclopedia of Criminology and Criminal Justice
Wronka, C. (2022). “Cyber-laundering”: the change of money laundering in the digital age. Journal of Money Laundering Control 25.2, pp. 330-344.
Xiangfeng Li. (2020). Flowscope: Spotting money laundering based on graphs. Proceedings of the AAAI conference on artificial intelligence. Vol. 34, No. 04.
Yang, J., Rahardja, S., & Fränti, P. (2019). Outlier detection: how to threshold outlier scores? In Proceedings of the international conference on artificial intelligence, information processing and cloud computing, pp. 1-6.
About Cameron
Professional Experience Preference ●
●
Working Location Preference
Internships / RA / TA / Work History
Ethan Flowerday, Neil Gandal, Eric Olson
Studies, University of Tulsa
Since the launch of Bitcoin in 2009, cryptocurrencies have captured the attention of technology enthusiasts and investors, leading to the emergence of a dynamic and expansive market. This newly emerging financial landscape is characterized by unique challenges and opportunities, such as high volatility, regulatory uncertainties, and the potential for innovative applications in various sectors. For example, there is a growing interest from both retail and institutional investors in the domains of distributive ledger technology (DLT) and asset tokenization, with major financial institutions like Goldman Sachs, J.P. Morgan, and Vanguard integrating blockchain-based systems for financial processes. This integration claims to have led to significant cost savings and operational efficiency improvements. These factors create a fertile ground for econometric research, offering the opportunity to explore diverse aspects like market behavior analysis, risk management, security implications, and the impact of technological and regulatory changes on these digital assets. The field presents a unique testbed for ideas, filled with rich data yet to be investigated by empirical analysis, making it an ideal subject for study in economics and finance with outcomes that are not only academically significant but also highly relevant for informing practical and policy-related aspects of cryptocurrency markets, particularly in developing a risk assessment framework. Cryptocurrencies run on blockchain technology, which was invented to create a decentralized and secure system for digital transactions, eliminating the need for a central authority. The primary purpose is to facilitate peer-to-peer transactions in a transparent, tamper-proof, and secure manner, ensuring trust and integrity in a digital space without reliance on traditional financial intermediaries. Blockchain technology is essentially a decentralized digital ledger that records transactions. This ledger comprises a series of blocks, each containing transaction data, linked and secured using cryptography. In a blockchain network, various computers, known as nodes, are interconnected. Validators, a specific type of node, are responsible for confirming the validity of transactions and adding them to the blockchain. These nodes play a crucial role in maintaining the blockchain and ensuring the overall integrity of the ledger. The process by which these nodes reach an agreement on transaction validity, thereby ensuring the security and integrity of the network, is known as the consensus mechanism. Two common types of these mechanisms are Proof of Work (PoW) and Proof of Stake (PoS). PoW requires computational efforts to validate transactions, while PoS relies on the validators' stake in the network. Additionally, blockchain technology enables the use of smart contracts, which are self-executing contracts with the terms of the agreement between parties being directly written into lines of code. Blockchain security and consensus mechanisms are fundamental to the operation and integrity of blockchain networks. Governance types in blockchains can vary from decentralized models, like those in Bitcoin and Ethereum, to more centralized ones in private or consortium blockchains. The number of validators responsible for verifying transactions and creating new blocks can also differ, impacting network security and efficiency. Validator hierarchy
may exist, assigning different roles or levels of authority to different actors. Validator punishment mechanisms, such as slashing in PoS systems, deter malicious activities by penalizing bad actors. Blockchain domains refer to the use case categories like finance, smart-contracts, supply chain, healthcare, and more, each presenting unique security considerations and requirements. Though blockchain has invited attention from academics who wish to test a variety of theories while studying the new and evolving asset class, there is little literature exploring the impact of these chain characteristics or on-chain metrics (such as transaction fees, average transaction speed, and number of transactions, etc.) on blockchain security.
This field of academic research encompasses a diverse variety of topics, including consensus mechanisms, cryptographic protocols, smart contract security, network attacks, and the study of economic and financial theories in the space Through this the efficacy of blockchain technology is investigated as a whole, as well as inefficiencies and security threats unique to specific chains and subgroups. Some examples of threats specific to blockchain include double-spending , 51%, selfish mining, and sybil attacks. Ongoing research investigates these threats to propose novel solutions to mitigate the associated risks. Along with these specific threats, technical problems are being studied to help the technology evolve ensuring security, scalability, efficiency, and privacy. Through simulation studies, empirical analysis, and formal verification researchers have contributed to the development of robust security frameworks for blockchain ecosystems.
Aside from engineering related risks, there are finance-related risks associated with the cryptocurrency space due to the lack of regulatory oversite and uncertainty, counterparty risk, and high market volatility due to the speculative nature of the asset class Thes conditions results in the regular occurrence of scams, fraud, and theft Due to poor regulatory oversite, many dubious and illegal activities from traditional finance are now being deployed in the cryptocurrency space, including pump-and-dump schemes, Ponzi schemes, inside trading, wash trading , spoofing, money laundering, and other market manipulation. Moreover, the absence of central authorities or intermediaries in cryptocurrency transactions raises concerns about the recourse available to correct this illicit activity. As the adoption of cryptocurrencies continues to expand, understanding and mitigating these financerelated risks are crucial for fostering investor confidence, promoting market stability, and facilitating the mainstream adoption of blockchain-based financial innovations.
While exploring current academic literature and preliminary data from various sources, a gap presented itself in connection with understanding the presence of financial arbitrage opportunities in Bitcoin markets. Arbitrage has existed in markets for centuries and is the phenomenon of buying an asset at a low price in one market and selling it for a higher price in another market to net a profit. Though arbitrage is conducted by investors looking for lowrisk profits, it adds value to the market by increasing market efficiency and adding market liquidity. Analysis of collected centralized exchange (CEX) orderbook data from 2017-2021 suggests that there are indeed arbitrage opportunities present in Bitcoin markets. Simple ordinary least square regression (OLS) analysis indicates that price volatility is a key predictor of the presence and magnitude of arbitrage opportunities. Furthermore, it was determined that the number and magnitude of arbitrage opportunities are decreasing over time. These findings
agree with the current literature, which also suggests that the greatest arbitrage opportunities are dependent on the geographical location of exchanges, rather than other aspects such as fiat currencies pairs, cryptocurrencies pairs for triangle arbitrage, or future vs spot pairs. In addition, the literature indicated that events, such as the addition of new exchanges, cryptocurrency hacks, and market crashes, were predictive of arbitrage opportunities, likely due to the resulting increase in market volatility. Though some papers posit theories, current literature still has no proven explanation for this phenomenon of arbitrage dependency on volatility, time, and exchange geographic location, leaving a gap of knowledge yet to be elucidated.
Though current data analyzed consists of arbitrage between CEXs, an obvious extension would be to conduct similar analysis on decentralized exchanges (DEXs) which function somewhat differently. Unlike CEXs wh ich use an orderbook to facilitate trades between customers, DEXs implement algorithmic automated market makers (AMMs) in conjunction with liquidity pools to allow the trading of assets. Traders interact directly with these pools to exchange assets, with prices determined by a mathematical formula based on the supply of each token in the pool, eliminating the need for traditional buyers and sellers to make a trade. Such a situation leaves an opportunity to arbitrage between different liquidity pools; however, this new mechanism of exchange may be open to exploitation in a variety of ways. For example, cryptocurrency transactions require "gas fees", charges chosen and paid by users to compensate validators for the computing energy required to process transactions on the blockchain. These fees vary based on network demand and transaction complexity, but these fees incentivize validators to prioritize transactions on a congested network. Since cryptocurrency transactions are transparent, because all transaction details are recorded on the blockchain, a savvy trader may front run viewed transaction by paying a premium, thereby ensuring a better price when interacting with a specific liquidity pool, then reversing his order after the viewed transaction executes to net a profit. These sorts of ‘sandwich attacks’, as they’re called in the cryptocurrency domain, present a security problem to be studied and addressed. Furthermore, it is unclear how chain characteristics play a role in securing the blockchain.
The proposed research aims to focus on Bitcoin's financial arbitrage opportunities and blockchain security. It seeks to understand how arbitrage has evolved in Bitcoin markets, influenced by factors like market volatility and geographical location of CEXs. The study will extend its analysis to DEXs, exploring potential arbitrage opportunities and security challenges like 'sandwich attacks.' Furthermore, investigation will be conducted to consider how chain characteristics impact the security of the top cryptocurrencies. The research objective is to elucidate the interplay between market dynamics, security risks, and the evolving landscape of cryptocurrency trading, contributing valuable insights to the field of economics and finance.
Ethan Flowerday is a first year TU Cyber Fellow completing his PhD in the Cyber Studies department with interest in Cryptocurrencies, Security Economics, and Quantitative Finance. He holds a Master of Science degree from King’s College London in Mathematics and Physics and a Master of Science degree in Biomedical Engineering from Northwestern University. He has conducted quantitative research and published across many interdisciplinary domains by implementing his mathematical, statistical, and machine learning skill set Professor Neil Gandal is the “Henry Kaufman Professor in International Capital Markets” in the Berglas School of Economics at Tel Aviv University and the Applied Distinguished Professor of Cyber Studies, School of Cyber Studies, University of Tulsa. He received his B.A. and B.S. degrees from Miami University (Ohio) in 1979, his M.S. degree from the University of Wisconsin in 1981, and his Ph.D. from the University of California-Berkeley in 1989. He is a research fellow at the Centre for Economic Policy Research (CEPR).
Professor Gandal has published numerous empirical papers in industrial organization, digital economics, the economics of network effects, and the economics of the software & Internet industries. His papers have received more than 8,700 citations at Google Scholar. Professor Gandal was a managing editor at the International Journal of Industrial Organization (IJIO) from 2005-2012. In this capacity, he edited many empirical papers using a wide range of econometric techniques. Following his editorship at the IJIO, he was named “Honorary Editor” of the journal. He is the only honorary editor in the history of the IJIO.
Professor Eric Olson is the Mervin Bovaird Foundation Endowed Professor in Business, Chapman Associate Professor of Finance, Director of the Center for Energy Studies, and Associate Professor in the School of Cyber Studies at the University of Tulsa. He received his Ph.D. in Economics from the University of Alabama in 2010. He has published many articles in academic journals, contributed to book publications, and his work has been cited by the New York Times. Dr Olson previously held academic positions at UCLA, Pepperdine University, and West Virginia University. His research interests include finance, monetary policy, energy, and time series economics.
About Cameron
Professional Experience Preference
●
●
Working Location Preference
Internships / RA / TA / Work History
STUDENT: Wellington Tatenda Gwavava
ADVISOR: Prof Andrew Morin
Department of Cyber Studies, The University of Tulsa
Abstract
This research aims to explore how congruence, the alignment between CISO priorities and analyst values, impacts the performance of SOC analysts. A SOC that is operating at optimal performance is one in which the CISO set priorities are being met by all the components. However, current methods for measuring analyst performance may not adequately capture how well the analysts are aligned with these priorities. For example, a popular Key Performance Indicator (KPI) is "escalation rate," which measures how often an analyst escalates a security issue to a more senior team member. A high escalation rate could be interpreted as a sign of inexperience, but it could also indicate that the analyst is skilled at recognizing sophisticated attacks. This can lead to a situation where an analyst is praised for their ability to identify complex threats but penalized for high escalation rates. This misalignment between KPIs and overall security goals can demotivate analysts and hinder the overall performance of the SOC. More importantly, it can lead to a weakened security posture, potentially leaving the organization vulnerable to undetected threats and security breaches. Achieving an alignment of goals between CISOs and analysts is essential. However, several factors can crea te misalignment, such as:
1. Miscommunication and unclear expectations: CISOs and analysts might have different priorities, leading to misaligned efforts and sub-optimal performance.
2. KPI Metrics mismatch: Performance metrics used for analysts may not capture the true value they contribute to achieving CISO priorities.
3. Motivation and engagement: Analysts might be disengaged or lack a clear understanding of how their work contributes to the bigger picture, hindering their performance.
A Security Operation Centre (SOC) can be defined as a command center for maintaining cybersecurity. [1]. SOCs are an essential part of any organization’s cybersecurity strategy. They monitor, detect, and respond to security threats, helping organizations protect themselves from cyberattacks and minimize the impact of any successful attacks. The SOC comprises several individuals with diverse skills, processes that govern operations (usually created and instilled by the Chief Information Security Officer (CISO)), and the technology used for security. These elements function as vital factors in the performance of an SOC, whether from a technical or economic perspective. Research describing operations within a SOC often follows the People, Processes, and Technologies (PPT) framework. [2]
The General Systems Theory (GST) [3] also provides a foundational framework for understanding complex systems like Security Operations Centers (SOCs). GST can be applied to analyze the SOC ecosystem, which includes analysts, security tools, processes, and leadership. Each element interacts to achieve the security goals set by the CISO. Further exploration reveals that Analyst Performance plays a critical role in identifying, analyzing, and responding to security incidents. Their performance is influenced by several factors within the SOC system.
The CISO sets the strategic direction for the SOC, prioritizing security objectives based on risk tolerance and organizational needs. Effective SOCs ensure that analyst activities align with CISO priorities. The CISO uses various performance measurement metrics to assess analyst effectiveness, and these should reflect CISO priorities [4]. These metrics could include time to
identify threats, accuracy of incident classification, or effectiveness of response actions, all within the context of CISO-defined priorities.
The value of congruence lies in an organization communicating its values and the behaviors it expects from its employees. When employees feel that there is alignment (congruence) between their values and those of the organization, they experience job satisfaction [5]. The consequence of a feeling of congruence is job satisfaction. Jung and Avolio [6] state that there is a positive relationship between a positive value of congruence and positive performance at various layers of the company. This can translate to showing that congruence exists in an organization/SOC, which can reflect on the performance of the SOC and/or highlight potential weaknesses.
Wellington is a first-year PhD student at The University of Tulsa (TU) studying Cyber Studies with a focus on Security Operations Centers (SOCs), holds an MTech in Computer Science from the College of Engineering, JNTU Hyderabad, India and a BTech Hons in Computer Science from Harare Institute of Technology (HIT), Harare, Zimbabwe. He has extensive experience in academia and consultancy, with a proven ability to design, develop, and implement innovative solutions to complex computing problems. His research interests include Digital Transformation, Operations Research and Optimization, Security Operations Centers, and Augmented and Virtual Technologies.
Andrew Morin, Ph.D., is a research assistant professor in the School of Cyber Studies. He received his Ph.D. in computer science from The University of Tulsa. His research focuses on the economics of information security, cryptocurrency market manipulations, and costinformed cyber security of critical infrastructure.
[1] E. Agyepong, Y. Cherdantseva, P. Reinecke, and P. Burnap, “Towards a Framework for Measuring the Performance of a Security Operations Center Analyst,” in 2020 International Conference on Cyber Security and Protection of Digital Services (Cyber Security), Dublin, Ireland: IEEE, Jun. 2020, pp. 1–8. doi: 10.1109/CyberSecurity49315.2020.9138872.
[2] G. D. Bhatt, “Knowledge management in organizations: examining the interaction between technologies, techniques, and people,” Journal of Knowledge Management, vol. 5, no. 1, pp. 68–75, Jan. 2001, doi: 10.1108/13673270110384419.
[3] W. Hofkirchner and M. Schafranek, “General System Theory,” in Philosophy of Complex Systems, vol. 10, C. Hooker, Ed., in Handbook of the Philosophy of Science, vol. 10., Amsterdam: North-Holland, 2011, pp. 177–194. doi: 10.1016/B978-0-444-52076-0.50006-7.
[4] E. Agyepong, Y. Cherdantseva, P. Reinecke, and P. Burnap, “A systematic method for measuring the performance of a cyber security operations analyst,” Computers & Security, vol. 124, p. 102959, Jan. 2023, doi: 10.1016/j.cose.2022.102959.
[5] B. Rich, J. Lepine, and E. Crawford, “Job Engagement: Antecedents and Effects on Job Performance,” Academy of Management Journal, vol. 53, pp. 617–635, Jun. 2010, doi: 10.5465/AMJ.2010.51468988.
[6] D. I. Jung and B. J. Avolio, “Opening the black box: an experimental investigation of the mediating effects of trust and value congruence on transformational and transactional leadership,” Journal of Organizational Behavior, vol. 21, no. 8, pp. 949–964, 2000, doi: 10.1002/10991379(200012)21:8<949: AID-JOB64>3.0.CO;2-F.
Jack Tilbury LinkedIn
Jack - Tilbury@utulsa.edu
JackTilbury Google Scholar
● Security P roduct Manager
● Security,Risk & Resilient Strategy Consulting
● Security An alystOperations
● Research S cientist
Working Location Preference
Area, Florida, Chicago, Washington, Remote
JackTilburyisasecond-yearPh.D.studentatTheUniversityofTulsa.Heobtained hisresearch-basedMCominInformationSystemsfromRhodesUniversity,South Africa,in2019.JackwasawardedafullscholarshiptopursuehisMaster'sdegree, whichexploredthePropTechindustry–conductingrealestatetransactionsthrough blockchaintechnology. HegraduatedatthetopofhisInformationSystemshonors classasheobtainedaBusinessScienceundergraduatedegree.Sincearrivingin Tulsa,JackhasattendedandpublishedattheAnnualSecurityConferenceandhas beeninvitedtopresentattheUNESCOSafetyConference.Hisresearchincludes informationsystems,behavioralinformationsecurity,andautomateddecisionaidsin securityoperationcenters.BeforestartinghisPh.D.research,Jackworkedasa ProductManagerintheITindustryattwosoftwaredevelopmentcompanies.
JackworkedfortwoyearsasaProductManagerwithexperienceinstart-upand corporateenvironments,buildingandlaunchingmultipleproductstomarket.Jackis eagertocontributetothedevelopmentofsecurityproductseitherthroughleading productteams,engagingwithproductcustomers,orconductingproductresearch.


Author Student: Hamideh Khaleghpour
Advisor:
Prof. Brett McKinney
Abstract
Department of Computer Science, The University of Tulsa, Tulsa, OK 74104
This PhD research project, titled "Cryptocurrency and Stock Market Transaction Networks and Anomaly Detection," embarks on a detailed exploration into the nuanced interplay between the rapidly evolving cryptocurrency markets and the traditional stock market. Through a meticulous examination of transaction networks within these financial ecosystems, the study aims to decode the complex relationships and identify anomalous patterns indicative of pivotal market events or manipulative behaviors.
Our approach is founded on an extensive data collection effort, focusing on high-fidelity time-series data for leading cryptocurrencies such as Bitcoin and Ethereum, alongside major stock market entities like Amazon and Apple. The collected data serves as the cornerstone for constructing intricate transaction networks, where nodes represent distinct market participants, and edges denote transactions or correlation relationships over time.
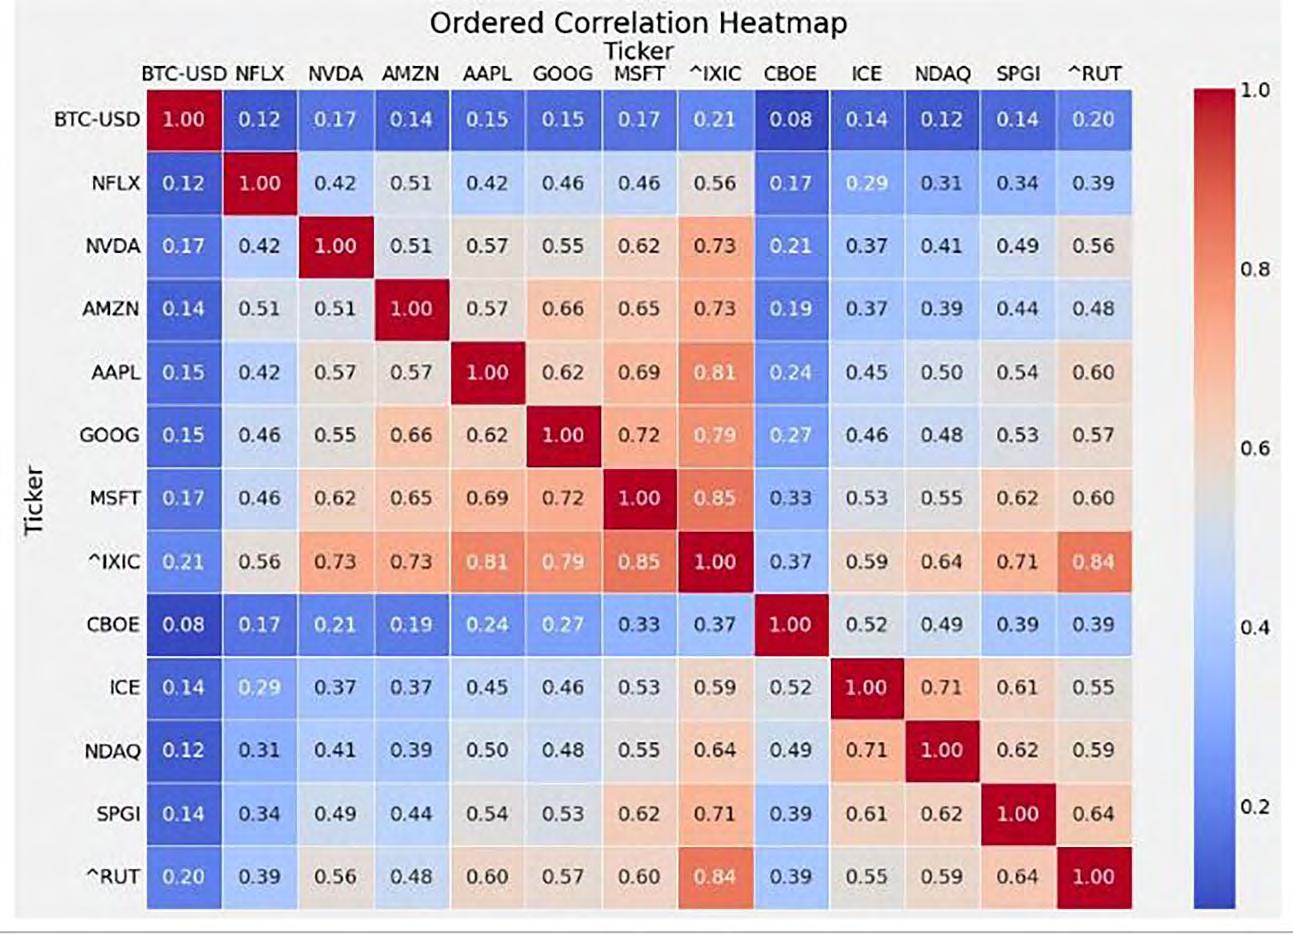
To dissect these networks, we employ Dynamic Time Warping (DTW) among other correlation measures, facilitating a deep dive into the dynamic nature of financial market relationships. This dynamic network analysis reveals the evolution of correlations over time, providing valuable insights into the shifting landscapes of market interdependencies.
A critical component of our study is the identification of anomalies within these networks. Utilizing advanced machine learning algorithms, including Isolation Forests, our research endeavors to spotlight unusual patterns that may signal instances of market manipulation or herald significant market shifts.
In parallel, we develop and refine predictive models leveraging a suite of sophisticated machine learning techniques such as Random Forests and Graph Neural Networks. These models, designed to forecast future market behaviors, are informed by historical data, from which features are engineered to predict future values of cryptocurrencies and stock prices.
Preliminary findings from our research underline notable correlations between certain stock market activities and cryptocurrency prices, shedding light on the intricate interplay between these financial sectors. Our dynamic network analysis further accentuates the mutable nature of these correlations, emphasizing the importance of real-time analysis in grasping the full spectrum of market behavior.
The application of anomaly detection techniques has uncovered patterns that potentially point to market manipulation, thereby underscoring the effectiveness of our methodologies in detecting irregular market activities. Moreover, our predictive models exhibit promising capabilities, showcasing potential in forecasting short-term market movements and offering novel insights into future market trends.
Looking ahead, our research will continue to refine these predictive models and expand the dataset to encompass a wider variety of financial instruments. This expansion aims to enhance the precision of our forecasts and deepen our understanding of the complex dynamics between cryptocurrencies and the stock market. Furthermore, we are keen on exploring the practical applications of our findings, particularly in the development of sophisticated trading strategies and informing regulatory policies aimed at enhancing market transparency and integrity.
In summary, this research project takes significant strides toward unraveling the complexities of financial transaction networks and their anomalies. By combining rigorous data analysis with cutting-edge machine learning techniques, we provide a fresh perspective on the interconnectedness of cryptocurrency and stock markets, contributing valuable tools and insights for detecting and predicting anomalous behaviors within these vital financial sectors. As the project advances, we anticipate our work will further illuminate the mechanisms of financial markets, offering contributions that extend beyond academic circles into practical applications in financial analysis, market prediction, and economic security.
About Hamideh Khaleghpour
Hamideh's passion for integrating artificial intelligence into cybersecurity and driving innovation is unmistakable. She completed her undergraduate and master's degrees in Information Technology at Shiraz University, demonstrating early on her commitment to her field. Currently, she distinguishes herself as one of the select 37 Cyber Fellows, and notably, one of only four women, awarded a full-tuition scholarship and stipend to advance her studies in Computer Science with a PhD at the University of Tulsa (TU). Her dissertation delves into the sophisticated realm of machine learning (ML) algorithms, focusing on their application in analyzing transaction networks within the Cryptocurrency and Stock Markets and the detection of anomalies therein. Hamideh is diligently working towards her goal, with her sights set on completing her PhD by May 2027.
Brett McKinney, Ph.D., is a theoretical physicist and professor of computer science who specializes in the development of machine learning (ML) and AI algorithms for problems in the biomedical and physical sciences. He has made important contributions to methods that detect networks of interacting variables for accurate and interpretable ML models. He applies these explainable ML methods in close collaboration with researchers in neuroscience, immunology, geochemistry and astrobiology. He has also developed theoretical approaches to understand the foundations of quantum mechanics, such as the role of the dimensionality of space on many-body systems like Bose-Einstein condensates.
Dr. McKinney is a professor in the Tandy School of Computer Science with a joint appointment in the Department of Mathematics. He is a native Tulsan who did his undergraduate work summa cum laude in mathematics and physics at The University of Tulsa where he was a member of Phi Beta Kappa and the honors program. He did his graduate work at the University of Oklahoma, obtaining a Ph.D. in theoretical physics, followed by a postdoctoral fellowship in biomathematics and computational biology at the Vanderbilt University Medical Center. Before joining TU, he was an assistant professor of genetics at the University of Alabama Birmingham School of Medicine.
Jack Tilbury LinkedIn
Jack - Tilbury@utulsa.edu
● Security P roduct Manager
● Security,Risk & Resilient Strategy Consulting
● Security An alystOperations
● Research S cientist
Working Location Preference
Area, Florida, Chicago, Washington, Remote
JackTilburyisasecond-yearPh.D.studentatTheUniversityofTulsa.Heobtained hisresearch-basedMCominInformationSystemsfromRhodesUniversity,South Africa,in2019.JackwasawardedafullscholarshiptopursuehisMaster'sdegree, whichexploredthePropTechindustry–conductingrealestatetransactionsthrough blockchaintechnology. HegraduatedatthetopofhisInformationSystemshonors classasheobtainedaBusinessScienceundergraduatedegree.Sincearrivingin Tulsa,JackhasattendedandpublishedattheAnnualSecurityConferenceandhas beeninvitedtopresentattheUNESCOSafetyConference.Hisresearchincludes informationsystems,behavioralinformationsecurity,andautomateddecisionaidsin securityoperationcenters.BeforestartinghisPh.D.research,Jackworkedasa ProductManagerintheITindustryattwosoftwaredevelopmentcompanies.
JackworkedfortwoyearsasaProductManagerwithexperienceinstart-upand corporateenvironments,buildingandlaunchingmultipleproductstomarket.Jackis eagertocontributetothedevelopmentofsecurityproductseitherthroughleading productteams,engagingwithproductcustomers,orconductingproductresearch.
Yijie (Jamie) Li (PhD student of Computer Science)
Brett A. McKinney
Elizabeth Kresock, Rayus Kuplicki, Jonathan Savitz, Brett A. McKinney
University of Tulsa
Laureate Institute for Brain Research
Abstract
The identification of gene expression-based biomarkers for major depressive disorder (MDD) continues to be an important challenge. In order to identify candidate biomarkers and mechanisms, we apply statistical and machine learning feature selection to an RNASeq gene expression dataset of 78 unmedicated individuals with MDD and 79 healthy controls. We identify 49 genes by LASSO penalized logistic regression and 45 genes at the false discovery rate threshold 0.188. The gene with the lowest P-value is MDGA1 (MAM domain–containing glycosylphosphatidylinositol anchor 1), which is expressed in the developing brain, involved in axon guidance, and is associated with related mood disorders in previous studies of bipolar and schizophrenia. The expre ssion of MDGA1 is associated with age and sex, but its association with MDD remains significant when adjusted for covariates. MDGA1 is in a co-expression cluster with another top gene, ATXN7L2 (ataxin 7 like 2), which was associated with MDD in a recent GW AS. The LASSO classification model of MDD includes MDGA1, and the model has a crossvalidation accuracy of 79%. Future exploration of MDGA1 and its gene interactions may provide insights into mechanisms of MDD.
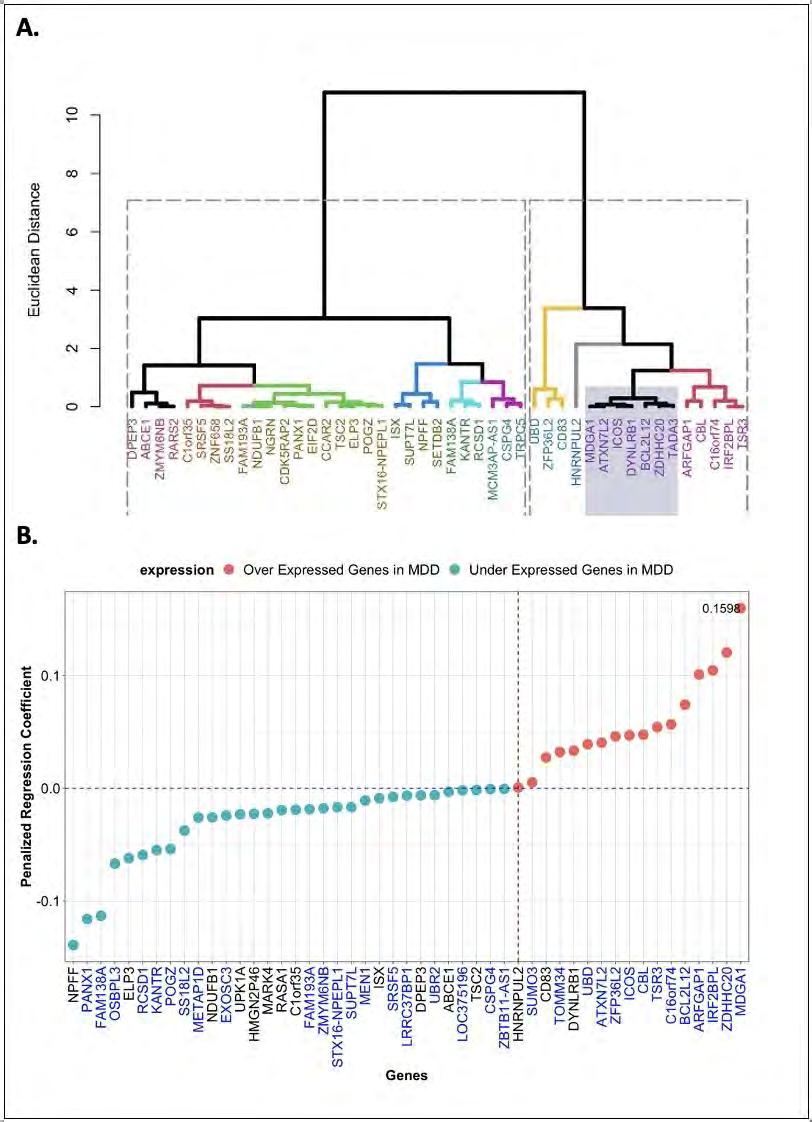
Figure 1. Top MDD related genes selected by Statistic Learning methods: The 49 genes with non-zero LASSO regression coefficients ( A). The vertical axis is the penalized regression
coefficient and horizontal axis is the gene name. The top gene is MDGA1 with 0.1598 coefficient value. Hierarchical clustering (Euclidean) of the 45 MDD -associated genes selected by univariate logistic regression ( B and Table 1). The cluster containing the top gene, MDGA1, is shaded. Genes in the left (right) cluster, as separated by the dashed lines, are under (over) expressed in MDD. The 35 overlapping genes in A and B are colored blue in the A horizontal axis.
Supplementary Figure 1. Forest plot for glm(MDD ~ gene expression) regression coefficients of the top 45 genes. The right plot shows the mean and (2.5%, 97.5%) confidence interval of each coefficient. Genes ordered by P-value.
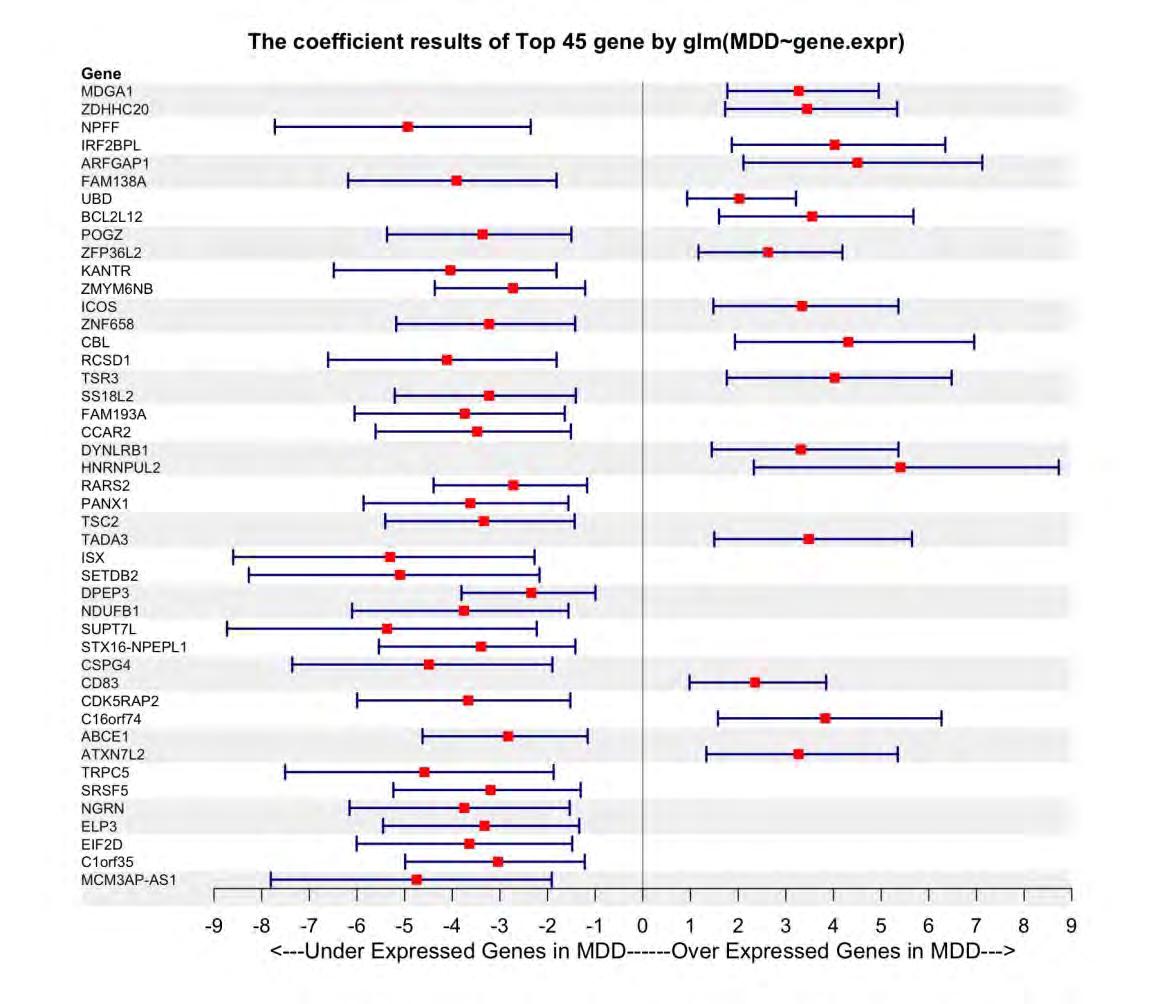
Supplementary Figure 2. Association (-log10(P)) of age (red) and sex (teal) with expression of top 45 MDD genes. The age and sex P values of top 45 genes come from the model glm(gene expression ~ age + sex). The top MDD gene, MDGA1, has both age and sex P value lower than 0.05; however, it remains significantly associated with MDD after adjustment. On the left axis, genes are colored black (31) that remained significant after covariate adjustments, and other genes are colored “blue.”
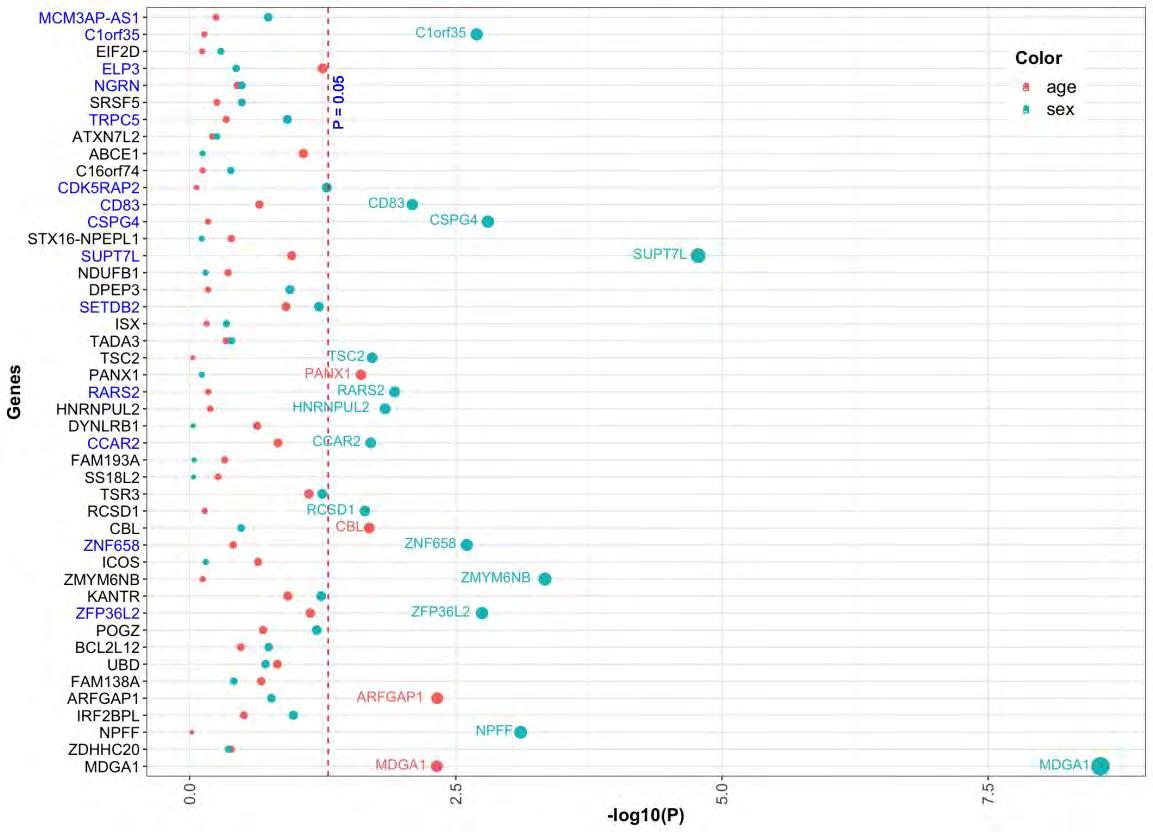
About Yijie (Jamie) Li
Jamie is a dedicated and enthusiastic individual currently in her third year of the Computer Science PhD program. Jamie holds a master’s degree in applied economics and finance from University of California, Santa Cruz, and she also holds a master’s degree in accounting from The University of Tulsa. Her current research encompasses Bioinformatics, Machine Learning, Artificial Intelligence and Time series Econometrics.
Jamie has 5.5 years of data analysis experience in the bioinformatics, economics and erosion/corrosion prediction. Her work in the fields of bioinformatics and machin e learning has made significant contributions to the understanding of complex diseases such as major depressive disorder (MDD) and the development of advanced predictive models. Her past work identified MDGA1 as a key gene that is differentially expressed in individuals with MDD, highlighting its potential as a therapeutic target. In addition, Jamie has been working with the Erosion/Corrosion Research Center at University of Tulsa and has several conference paper published on AMPP and ASME within past 2 years. Her research on predicting Erosion Rate utilizing Statistical Learning and Machine Learning Algorithms improved the R square to 0.993.
Brett McKinney, Ph.D., is a theoretical physicist and professor of computer science who specializes in the development of machine learning (ML) and AI algorithms for problems in the biomedical and physical sciences. He has made important contributions to methods that detect networks of interacting variables for accurate and interpretable ML mode ls. He applies these explainable ML methods in close collaboration with researchers in neuroscience, immunology, geochemistry and astrobiology. He has also developed
theoretical approaches to understand the foundations of quantum mechanics, such as the role of the dimensionality of space on many-body systems like Bose-Einstein condensates.
Dr. McKinney is a professor in the Tandy School of Computer Science with a joint appointment in the Department of Mathematics. He is a native Tulsan who did his undergraduate work summa cum laude in mathematics and physics at The University of Tulsa where he was a member of Phi Beta Kappa and the honors program. He did his graduate work at the University of Oklahoma, obtaining a Ph.D. in theoretical physics, followed by a postdoctoral fellowship in biomathematics and computational biology at the Vanderbilt University Medical Center. Before joining TU, he was an assistant professor of genetics at the University of Alabama Birmingham School of Medicine.
1. Mostafavi S, Battle A, Zhu X, Potash JB, Weissman MM, Shi J, Beckman K, Haudenschild C, McCormick C, Mei R et al: Type I interferon signaling genes in recurrent major depression: increased expression detected by whole-blood RNA sequencing. Mol Psychiatry 2014, 19(12):1267-1274.
2. Cole JJ, McColl A, Shaw R, Lynall ME, Cowen PJ, de Boer P, Drevets WC, Harrison N, Pariante C, Pointon L et al: No evidence for differential gene expression in major depressive disorder PBMCs, but robust evidence of elevated biological ageing. Transl Psychiatry 2021, 11(1):404.
3. Wanowska E, Kubiak MR, Rosikiewicz W, Makalowska I, Szczesniak MW: Natural antisense transcripts in diseases: From modes of action to targeted therapies Wiley Interdiscip Rev RNA 2018, 9(2).
4. Lei NY, Jabaji Z, Wang J, Joshi VS, Brinkley GJ, Khalil H, Wang F, Jaroszewicz A, Pellegrini M, Li L et al: Intestinal subepithelial myofibroblasts support the growth of intestinal epithelial stem cells PloS one 2014, 9(1):e84651.
5. Le TT, Dawkins BA, McKinney BA: Nearest-neighbor Projected-Distance Regression (NPDR) for detecting network interactions with adjustments for multiple tests and confounding Bioinformatics 2020, 36(9):2770-2777.
6. Le TT, Savitz J, Suzuki H, Misaki M, Teague TK, White BC, Marino JH, Wiley G, Gaffney PM, Drevets WC et al: Identification and replication of RNA-Seq gene network modules associated with depression severity. Transl Psychiatry 2018, 8(1):180.
7. Kahler AK, Djurovic S, Kulle B, Jonsson EG, Agartz I, Hall H, Opjordsmoen S, Jakobsen KD, Hansen T, Melle I et al: Association analysis of schizophrenia on 18 genes involved in neuronal migration: MDGA1 as a new susceptibility gene. Am J Med Genet B Neuropsychiatr Genet 2008, 147B(7):1089-1100.
8. Li J, Liu J, Feng G, Li T, Zhao Q, Li Y, Hu Z, Zheng L, Zeng Z, He L et al: The MDGA1 gene confers risk to schizophrenia and bipolar disorder. Schizophr Res 2011, 125(2-3):194-200.
9. Shi J, Potash JB, Knowles JA, Weissman MM, Coryell W, Scheftner WA, Lawson WB, DePaulo JR, Jr., Gejman PV, Sanders AR et al: Genome-wide association study of recurrent early-onset major depressive disorder. Mol Psychiatry 2011, 16(2):193-201.
10. Cross-Disorder Group of the Psychiatric Genomics Consortium. Electronic address pmhe, Cross-Disorder Group of the Psychiatric Genomics C: Genomic Relationships, Novel Loci, and Pleiotropic Mechanisms across Eight Psychiatric Disorders. Cell 2019, 179(7):1469-1482 e1411.
11. Takeuchi A, Hamasaki T, Litwack ED, O'Leary DD: Novel IgCAM, MDGA1, expressed in unique cortical area- and layer-specific patterns and transiently by distinct forebrain populations of Cajal-Retzius neurons. Cereb Cortex 2007, 17(7):1531-1541.
12. Vawter MP: Dysregulation of the neural cell adhesion molecule and neuropsychiatric disorders. Eur J Pharmacol 2000, 405(1-3):385-395.
13. Marcogliese PC, Shashi V, Spillmann RC, Stong N, Rosenfeld JA, Koenig MK, Martinez-Agosto JA, Herzog M, Chen AH, Dickson PI et al: IRF2BPL Is Associated with Neurological Phenotypes Am J Hum Genet 2018, 103(3):456.
Jack Tilbury LinkedIn
Jack - Tilbury@utulsa.edu
● Security P roduct Manager
● Security,Risk & Resilient Strategy Consulting
● Security An alystOperations
● Research S cientist
Working Location Preference
Tulsa Area, Florida, Chicago, Washington, Remote
JackTilburyisasecond-yearPh.D.studentatTheUniversityofTulsa.Heobtained hisresearch-basedMCominInformationSystemsfromRhodesUniversity,South Africa,in2019.JackwasawardedafullscholarshiptopursuehisMaster'sdegree, whichexploredthePropTechindustry–conductingrealestatetransactionsthrough blockchaintechnology. HegraduatedatthetopofhisInformationSystemshonors classasheobtainedaBusinessScienceundergraduatedegree.Sincearrivingin Tulsa,JackhasattendedandpublishedattheAnnualSecurityConferenceandhas beeninvitedtopresentattheUNESCOSafetyConference.Hisresearchincludes informationsystems,behavioralinformationsecurity,andautomateddecisionaidsin securityoperationcenters.BeforestartinghisPh.D.research,Jackworkedasa ProductManagerintheITindustryattwosoftwaredevelopmentcompanies.
JackworkedfortwoyearsasaProductManagerwithexperienceinstart-upand corporateenvironments,buildingandlaunchingmultipleproductstomarket.Jackis eagertocontributetothedevelopmentofsecurityproductseitherthroughleading productteams,engagingwithproductcustomers,orconductingproductresearch.

Abstract:
Adriaan Lombard, Stephen Flowerday
Adriaan-lombard@utulsa.edu
Stephen-flowerday@utulsa.edu
Department of Cyber Studies
This research examines the intersection of generative AI and cybersecurity, focusing on the influence of AI platforms powered by large language models (LLMs) on individual self-worth. By integrating Maslow's hierarchy of needs with the Big Five personality traits, we propose a novel model to analyze AI's dual capacity to enhance human life and pose cybersecurity threats. Our findings highlight the importance of robust cybersecurity measures in ethical AI integration, emphasizing a development pathway that respects human dignity and worth.
Introduction:
With AI deeply integrated into daily life, this paper explores how generative AI impacts human interactions and self-worth. Amidst significant privacy and security risks, we investigate AI's potential to meet human needs and its implications for individual worth. Our research question asks how generative AI influences individuals' perceptions of their worth, considering cybersecurity risks and personal benefits.
Generative AI:
Generative AI has surged, with tools like ChatGPT, Dall-E, and Midjourney leveraging LLMs for content that rivals human creation. This advancement empowers users to generate texts, images, and audio, enriching creativity and productivity. Despite these benefits, it presents risks such as cognitive atrophy, psychological manipulation, and privacy breaches. Our focus is the individual level, where AI's potential for harm must be carefully balanced against its capacity to augment human skills and opportunities.
The Big Five Personality Traits:
The Big Five Personality Traits Openness, Conscientiousness, Extraversion, Agreeableness, and Neuroticism frame our analysis of AI interaction. These traits predict how individuals might use AI for creative enhancement, social engagement, career advancement, and their susceptibility to cybersecurity risks. Personality influences the perception and integration of AI, necessitating technology that caters to diverse user profiles to optimize engagement and effectiveness.
Human Worth:
Human worth is a core value transcending utility, challenged by AI integration in societal and labor structures. As AI meets various human needs, ethical deployment is crucial to preserve dignity and equitable benefit distribution. This requires a paradigm shift towards AI development that respects human values, ensuring technology enhances life without compromising individual dignity or worth.
Our research probes the impact of generative AI on society, weighing its capacity for human-like creation against cybersecurity concerns. Platforms like ChatGPT and Dall-E illustrate AI's utility and darker potential for privacy invasion and psychological influence. We explore this dichotomy within the context of human value, guided by Maslow's hierarchy and the Big Five personality traits. Our findings underscore the importance of individual uniqueness and self-worth, suggesting that generative AI's integration into daily routines could potentially erode cognitive engagement and creativity. This could impact roles requiring human ingenuity and empathy, once usurped by AI, leaving people feeling redundant and their self-esteem diminished. The study highlights the indispensable role of cybersecurity in preserving individual dignity amidst AI's expansion, particularly for those with traits like neuroticism, who are more vulnerable to AI's privacy threats. This underscores the importance of our model advocating for AI that fulfills human needs while protecting personal and collective worth. In synthesizing AI's implications for human value, we champion a development trajectory that harmonizes technological progress with preserving human dignity. Marrying Maslow's framework with the Big Five traits provides a roadmap for ethically integrating AI, highlighting robust cybersecurity as crucial to safeguarding personal integrity. Conclusively, our paper adds to the dialogue on AI by proposing a comprehensive model that ensures AI's life-enhancing potential does not overshadow the need for cybersecurity. This approach respects personality diversity and the intrinsic value of life, marking an essential consideration for AI's future direction.
Our adapted model theorizes the relationship between generative AI and Maslow's hierarchy, hypothesizing AI's role across different human needs. Figure 1 illustrates this relationship, and Table 2 details the interplay between generative AI, cybersecurity implications, and the impact on human worth across the layers of Maslow's hierarchy and the Big Five personality traits.
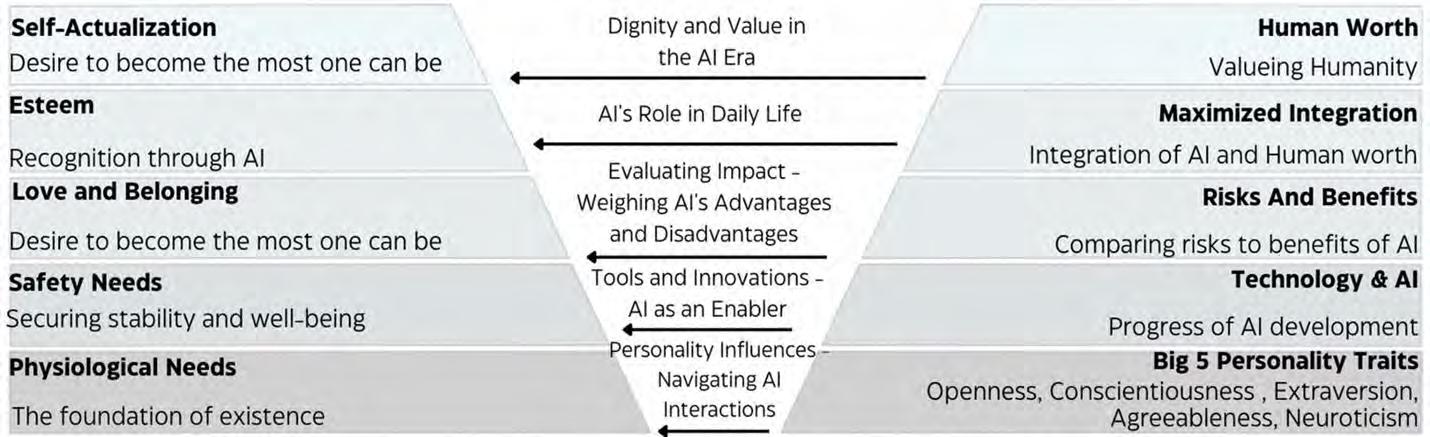
Future research should expand the scope of inquiry into AI's psychological impacts by embracing the SelfPerception model to gauge how individuals perceive their worth in AI-influenced environments. This model, coupled with the Big Five personality framework, will facilitate a broader, empirical investigation into the nuanced ways generative AI shapes self-concept across diverse global populations. Furthermore, direct user engagement studies will provide concrete data on how cybersecurity risks affect users, deepening our understanding of the personal ramifications of AI advancements. Ongoing model refinements will be crucial to keep pace with rapid technological changes, ensuring that our approach remains relevant and accurately captures the evolving relationship between AI, cybersecurity, and human psychology.
Conclusion:
Our research presents a crucial contribution to understanding and interacting with generative AI, advocating for a human-centric approach to its development. The study underscores the necessity of robust cybersecurity strategies that prioritize safeguarding personal data and individual vulnerabilities. We articulate AI's potential to enhance and compromise human self-worth, analyzed through the lenses of Maslow's hierarchy and the Big Five personality traits.
The core of our contribution is a model that promotes the creation of transparent AI systems, giving users control and ensuring privacy. This model is critical to preserving human dignity and maintaining trust in technology. It supports the notion that AI should comply with and augment our human values, thus fostering a future where technological growth is aligned with enhancing our collective humanity. Our findings emphasize the imperative for future research to continue this trajectory, ensuring AI's advancement fortifies, rather than degrades, the essence of human dignity.
References
Adriaan Lombard
With a diverse educational and entrepreneurial background, this graduate holds a bachelor’s in human resource management and an Honors in Communications Management from the University of Pretoria, South Africa. Furthering their education at Lund University in Sweden, they earned a Master's degree in Entrepreneurship and Innovation. Currently pursuing a Ph.D. in Cybersecurity at the University of Tulsa, their research focuses on optimizing the balance between AI integration and workforce dynamics for enhanced human value and security.
As a co-founder of Marama, a start-up revolutionizing sustainable nutrition and cosmetics through underutilized crops, they have demonstrated a keen ability to innovate and address societal needs. Their global perspective, honed through academic and professional experiences across continents, enriches their understanding of diverse business landscapes. With a skill set that spans start-ups, HR, and communications, this ambitious individual is poised to contribute significantly to any organization's innovation and success.
Stephen Flowerday
Stephen is a seasoned professor in the School of Cyber Studies at the University of Tulsa. His rich background includes roles as departmental chair at Rhodes University and the University of Fort Hare in South Africa and deputy dean for research and internationalization. Honored with the university vicechancellor's senior researcher award in 2014, contributions to cybersecurity management, enterprise cybersecurity, behavioral cybersecurity, and privacy distinguish his academic journey. Before his two decades in academia, he was a management consultant.
Stephen's work has been supported by prestigious grants from organizations like IBM, THRIP, NRF, and Erasmus. He has played significant roles as a reviewer and editor for academic publications. He has served on panels for the South African NRF, the Israeli NSF, and the Bahrain Department of Higher Education. Stephen's international recognition is a testament to his global impact in the field of cybersecurity. His achievements include an invitation as a distinguished visiting professor by the Scottish Informatics and Computer Science Alliance in 2019. A fellow of the British Computer Society and a member of SAICSIT and AIS, Stephen's contributions have enriched the academic community and inspired future generations of cybersecurity professionals.
Jack Tilbury LinkedIn
Jack - Tilbury@utulsa.edu
JackTilbury Google Scholar
● Security P roduct Manager
● Security,Risk & Resilient Strategy Consulting
● Security An alystOperations
● Research S cientist
Working Location Preference
Tulsa Area, Florida, Chicago, Washington, Remote
Internships / RA / TA / Work History
Year Position
2022Present Doctoral Researcher
20202022 Product Manager
Employer
University of Tulsa
Flash Mobile Vending & The Delta, South Africa
2019 Assistant Lecturer and Teaching Assistant Rhodes University
2018 Software Implementation Analyst Saratoga, Cape Town
JackTilburyisasecond-yearPh.D.studentatTheUniversityofTulsa.Heobtained hisresearch-basedMCominInformationSystemsfromRhodesUniversity,South Africa,in2019.JackwasawardedafullscholarshiptopursuehisMaster'sdegree, whichexploredthePropTechindustry–conductingrealestatetransactionsthrough blockchaintechnology. HegraduatedatthetopofhisInformationSystemshonors classasheobtainedaBusinessScienceundergraduatedegree.Sincearrivingin Tulsa,JackhasattendedandpublishedattheAnnualSecurityConferenceandhas beeninvitedtopresentattheUNESCOSafetyConference.Hisresearchincludes informationsystems,behavioralinformationsecurity,andautomateddecisionaidsin securityoperationcenters.BeforestartinghisPh.D.research,Jackworkedasa ProductManagerintheITindustryattwosoftwaredevelopmentcompanies.
JackworkedfortwoyearsasaProductManagerwithexperienceinstart-upand corporateenvironments,buildingandlaunchingmultipleproductstomarket.Jackis eagertocontributetothedevelopmentofsecurityproductseitherthroughleading productteams,engagingwithproductcustomers,orconductingproductresearch.
Proposal Abstract
CyberFellows 2024
Jake Mead
Organizations and their employees face a barrage of cyberattacks on a near daily basis. Ensuring the protection of personal data has long been a priority for businesses but , as businesses accelerate their digital transformation efforts, they expose their infrastructure to attacks in the cyberspace (Ruighaver et al., 2007). The individuals within these transforming companies, however, often remain the same, transferring their industry skills to new technical domains . Individuals have always been a primary target for attackers, homing in on subpar security behaviors to exploit vulnerabilities within information networks (Tolah et al., 2019). In this new transforming workspace, this threat and the vulnerabilities presented by individuals working within these networks is higher than ever.
Businesses have attempted to smooth learning curves and ensure their employees are at pace with new infrastructures through rigorous training initiatives and change management activities (Da Veiga, 2016). However, cybersecurity training and education has long been questioned for its effectiveness, often resulting in short term, diminishing returns (Cain et al., 2018).“Providing users with knowledge is the first step, but we need to determine how to improve users’ cyber hygiene attitudes and behaviors” (Cain et al., 2018). The embeddedness of technology in every facet of business operations has pointed towards the need to understand the underlying beliefs, values and assumptions associated with cybersecurity. The term cybersecurity culture emerged from research into how companies might instill secure behaviors within the fabric of an organization (da Veiga et al., 2020). By shifting the beliefs, attitudes, and values of individuals to align with organizational security goals, the risk of individuals making poor choices and mistakes reduces (Alshaikh, 2020)
This study aims to take one step further in understanding the individual contributing to the measured culture. The study will analyze different personality types against constructs used to evaluate and individuals’ willingness to comply with cybersecurity culture. The gathered data will be analyzed for causal relationships between personality types and security complianc e and awareness. Once established, a focus group representative of all personality types will be subject to initiatives that attempt to elevate observed disinclinations toward the measured cybersecurity constructs to prove whether or not a knowledge of an individual’s personality type can be used to influence, positively, cybersecurity culture.
Statement of the Problem
To influence a cybersecurity culture, we need to better understand individuals within an organization and how their unique traits influence their engagement with cybersecurity programs.
Research Questions
Main Research Question;
Are personality traits a significant predictor of an individual’s behavior within the context of cybersecurity?
Sub-Questions;
Which personality traits have a significant influence on an individual ’s intentions to comply with cybersecurity culture?
Which personality traits act as an indicator for an individual’s engagement with cybersecurity training material?
Cybersecurity cultures are growing in popularity to combat cybercrime targeted at individuals within organizations (Hogail, 2015). By creating a cybersecurity culture that influences, positively, the behaviors and beliefs of individuals, the organization can combat a wide variety of threats in a means that will be sustainable and transferable across domains, departments, and problem types (Tolah et al., 2019). Employees are an increasing source of vulnerabilities within the organizational network. As technological security solutions continue to advance, the focus of attackers on individuals has only increased. Traditional responses to addressing these vulnerabilities through education and training initiatives have had mixed results (Cain et al., 2018). Often the problems associated with training, such as diminishing knowledge retention and attention to the content remain key challenges to instilling meaningful change in an individual’s behavior (Cain et al., 2018). A culture of sound cybersecurity practices champions embedded behaviors and initiatives within the fabric of the organization. Behavior becomes part of the way things are done (da Veiga et al., 2020), as though it were second nature. Sound behaviors within the cyberspace are a result of applying a critical mind to every situation, underpinned by organizational awareness, shared values and beliefs and a collective buy in (Martins & Eloff, 2006).
By placing focus on levers within cybersecurity frameworks, such as compliance and awareness, we hope to understand the drivers behind decision making within the cybersecurity context. Through a developed understanding, employers might equip their employees with training material and support that has a greater impact on the security behaviors of the individual and in turn the organization as a whole.
Cybersecurity culture, information security culture and security culture are terms that have been used to describe a similar set of constructs that define organizational cultures within the cybersecurity context. Dhillon defined information security culture as “the totality of human attributes such as behaviors, attitudes and values that contribute to the protection of all kinds of information in a given organization” (Dhillon, 1997). Martins and Eloff (2002) follows Dhillon in describing information security culture as an “assumption about perceptions and attitudes that are accepted in order to incorporate information security characteristics as the way in which things are done in an organization, with the aim of protecting information assets”.
The definitions used to describe cybersecurity culture and the constructs identified to measure and cultivate it all share the importance of the human factor (Uchendu et al., 2021). Culture is inherently human centric, and the conceptualization of a cybersecurity culture finds its roots in an understanding of the individual within a cybersecurity context (Hogail, 2015) While most of the research in this area has focused on creating an organizational view of cybersecurity through frameworks and metrics, there are gaps in understanding the influence of individual traits on cybersecurity culture. Specifically, how those individual traits may impact efforts to change a cybersecurity culture (Uchendu et al., 2021).
Security compliance refers to an individual’s willingness to comply with information security policies (ISP), regulations and advised cyber practices (Nasir et al., 2019). Compliance includes knowledge of the existing policies and procedures. Companies exhibiting high levels of compliance with security policies would be deemed to have a more secure cybersecurity culture (Alshaikh, 2020).
Security awareness reflects an individual’s knowledge of the potential threats they may face interacting with the cyberspace and the countermeasures used to mitigate threats, in this study, constitutes awareness (McCormac et al., 2017) Knowledge of threats and existing countermeasures enables the employee to make decisions within the context of their job that protect the com pany from potential harm (da Veiga et al., 2020).
The role of the human factor in representing and understanding cybersecurity culture has been long discussed in research. Da Veiga and Martins (2015a), Alhogail (2015) and Tolah et al. (2019) point toward a need for further research on the impact of individual perceptions and traits that influence a cybersecurity culture and programs geared toward improving cybersecurity culture. Personality types
have continued to emerge as a leading factor in understanding individuals behavior within cyber spaces (Amichai-Hamburger, 2002). The big 5 personality traits were established in D. W. Fiske ’s theory in 1949 and developed further by a host of researchers between 1967 and 1987 (Komarraju et al., 2011). The big five personality traits are extroversion, agreeableness, openness, conscientiousness, and neuroticism (Church, 2016).
Conclusion
The proposed study introduces personality types as a construct within cybersecurity culture in a manner that, to date, has not been evaluated. If the core goal of understanding and measuring cybersecurity cultures is to effect change toward more sound cybersecurity practices, then promoting the action that will most resonate with every employee should be of critical importance. Further research into understanding the individuals comprising an organization and subject to it ’s security programs will provide a basis for more targeted and penetrative initiatives.
Alshaikh, M. (2020). Developing cybersecurity culture to influence employee behavior: A practice perspective. Computers and Security, 98. https://doi.org/10.1016/j.cose.2020.102003
Blaikie, N. (2010). Designing Social Research (2nd edition). In Designing social research
Cain, A. A., Edwards, M. E., & Still, J. D. (2018). An exploratory study of cyber hygiene behaviors and knowledge. Journal of Information Security and Applications, 42. https://doi.org/10.1016/j.jisa.2018.08.002
Church, A. T. (2016). Personality traits across cultures. In Current Opinion in Psychology (Vol. 8). https://doi.org/10.1016/j.copsyc.2015.09.014
Creswell, J. w. ;, & Clark, V. L. P. (2009). Designing and Conducting Mixed Methods Research. Organizational Research Methods, 12(4).
Da Veiga, A. (2015). The influence of information security policies on information security culture: Illustrated through a case study. Proceedings of the 9th International Symposium on Human Aspects of Information Security and Assurance, HAISA 2015.
Da Veiga, A. (2016). A cybersecurity culture research philosophy and approach to develop a valid and reliable measuring instrument. Proceedings of 2016 SAI Computing Conference, SAI 2016. https://doi.org/10.1109/SAI.2016.7556102
da Veiga, A., Astakhova, L. V., Botha, A., & Herselman, M. (2020). Defining organisational information security culture—Perspectives from academia and industry. Computers and Security, 92. https://doi.org/10.1016/j.cose.2020.101713
Da Veiga, A., & Martins, N. (2015). Improving the information security culture through monitoring and implementation actions illustrated through a case study. Computers and Security, 49. https://doi.org/10.1016/j.cose.2014.12.006
da Veiga, A., & Martins, N. (2017). Defining and identifying dominant information security cultures and subcultures. Computers and Security, 70. https://doi.org/10.1016/j.cose.2017.05.002
Dash, G., & Paul, J. (2021). CB-SEM vs PLS-SEM methods for research in social sciences and technology forecasting. Technological Forecasting and Social Change, 173. https://doi.org/10.1016/j.techfore.2021.121092
Dhillon, G. (1997). Managing Information System Security. In Managing Information System Security. https://doi.org/10.1007/978-1-349-14454-9
Frauenstein, E. D., & Flowerday, S. (2020). Susceptibility to phishing on social network sites: A personality information processing model. Computers and Security, 94. https://doi.org/10.1016/j.cose.2020.101862
Gcaza, N., Von Solms, R., & Van Vuuren, J. (2015). An ontology for a national cyber-security culture environment. Proceedings of the 9th International Symposium on Human Aspects of Information Security and Assurance, HAISA 2015.
Hogail, A. Al. (2015). Cultivating and assessing an organizational information security culture; an empirical study. International Journal of Security and Its Applications, 9(7). https://doi.org/10.14257/ijsia.2015.9.7.15
Kelemen, M., & Rumens, N. (2008). An Introduction to Critical Management Research: 8 Critical Perspectives on Qualitative Research. An Introduction to Critical Management Research. Komarraju, M., Karau, S. J., Schmeck, R. R., & Avdic, A. (2011). The Big Five personality traits, learning styles, and academic achievement. Personality and Individual Differences, 51(4).
https://doi.org/10.1016/j.paid.2011.04.019
Martins, A., & Eloff, J. H. P. (2006). Assessing Information Security Culture. Information Security South Africa (ISSA2006).
McCormac, A., Zwaans, T., Parsons, K., Calic, D., Butavicius, M., & Pattinson, M. (2017). Individual differences and Information Security Awareness. Computers in Human Behavior, 69 https://doi.org/10.1016/j.chb.2016.11.065
Nasir, A., Abdullah Arshah, R., & Ab Hamid, M. R. (2019). A dimension-based information security culture model and its relationship with employees’ security behavior: A case study in Malaysian higher educational institutions. Information Security Journal, 28(3).
https://doi.org/10.1080/19393555.2019.1643956
Roopa, S., & Rani, M. (2012). Questionnaire Designing for a Survey. The Journal of Indian Orthodontic Society, 46. https://doi.org/10.5005/jp-journals-10021-1104
Ruighaver, A. B., Maynard, S. B., & Chang, S. (2007). Organisational security culture: Extending the end-user perspective. Computers and Security, 26(1).
https://doi.org/10.1016/j.cose.2006.10.008
Schein, E. H. (n.d.). Organizational Culture and Leadership Third Edition
Shaikh, F. A., & Siponen, M. (2023). Information security risk assessments following cybersecurity breaches: The mediating role of top management attention to cybersecurity. Computers and Security, 124. https://doi.org/10.1016/j.cose.2022.102974
Terracciano, A., & McCrae, R. R. (2006). Cross-cultural studies of personality traits and their relevance to psychiatry. In Epidemiologia e Psichiatria Sociale (Vol. 15, Issue 3). https://doi.org/10.1017/S1121189X00004425
Tolah, A., Furnell, S. M., & Papadaki, M. (2019). A Comprehensive Framework for Understanding Security Culture in Organizations. IFIP Advances in Information and Communication Technology, 557. https://doi.org/10.1007/978-3-030-23451-5_11
Uchendu, B., Nurse, J. R. C., Bada, M., & Furnell, S. (2021). Developing a cyber security culture: Current practices and future needs. Computers and Security, 109. https://doi.org/10.1016/j.cose.2021.102387
Bios
CyberFellow: Jake Mead
Jake is a passionate and committed individual currently in his first year of the Cyber Studies PhD program at the University of Tulsa. Jake holds a Bachelors degree in Information Systems and Economics from Rhodes University, South Africa. His current research focus includes human factors impacting security culture and awareness within large organizations.
Jake has 5 years of consulting experience within South Africa’s largest banks and insurance companies. During his professional experience, Jake worked on numerous digital transformation, system implementation and IT strategy projects. He effectively led nume rous cross functional teams and was successful in the delivery of large systems and platforms across numerous industries.
Jake’s research places a focus on the human factors influencing cybersecurity practices. The goal of his research is to provide a more complete perspective on the elements that shape an individual’s intention to behave securely as well as their actual behaviours within the workplace. The ultimate direction of this research is an artefact that provides individuals with security behaviour advice and direction that is tailored to their bias’s, traits and objectives.
Advisor: Dr. Stephen Flowerday
Stephen Flowerday is a professor in the School of Cyber Studies at The University of Tulsa. His research interests lie in behavioral cybersecurity, information security management, and the human aspects of cybersecurity. Stephen has received funding for his work from IBM, THRIP, NRF, SASUF, Erasmus, GMRDC, and others.
Jack Tilbury LinkedIn
Jack - Tilbury@utulsa.edu
JackTilbury Google Scholar
● Security P roduct Manager
● Security,Risk & Resilient Strategy Consulting
● Security An alystOperations
● Research S cientist
Working Location Preference
Tulsa Area, Florida, Chicago, Washington, Remote
Internships / RA / TA / Work History
Year Position
2022Present Doctoral Researcher
20202022 Product Manager
Employer
University of Tulsa
Flash Mobile Vending & The Delta, South Africa
2019 Assistant Lecturer and Teaching Assistant Rhodes University
2018 Software Implementation Analyst Saratoga, Cape Town
JackTilburyisasecond-yearPh.D.studentatTheUniversityofTulsa.Heobtained hisresearch-basedMCominInformationSystemsfromRhodesUniversity,South Africa,in2019.JackwasawardedafullscholarshiptopursuehisMaster'sdegree, whichexploredthePropTechindustry–conductingrealestatetransactionsthrough blockchaintechnology. HegraduatedatthetopofhisInformationSystemshonors classasheobtainedaBusinessScienceundergraduatedegree.Sincearrivingin Tulsa,JackhasattendedandpublishedattheAnnualSecurityConferenceandhas beeninvitedtopresentattheUNESCOSafetyConference.Hisresearchincludes informationsystems,behavioralinformationsecurity,andautomateddecisionaidsin securityoperationcenters.BeforestartinghisPh.D.research,Jackworkedasa ProductManagerintheITindustryattwosoftwaredevelopmentcompanies.
JackworkedfortwoyearsasaProductManagerwithexperienceinstart-upand corporateenvironments,buildingandlaunchingmultipleproductstomarket.Jackis eagertocontributetothedevelopmentofsecurityproductseitherthroughleading productteams,engagingwithproductcustomers,orconductingproductresearch.

Title: Naturalistic observations of login attempts: Do security implementations and demands effect employee job behaviors and perceptions?
Philip Shumway
University of Tulsa pas8697@utulsa.edu
Extended Abstract
Purpose:
Throughout the working world, data breaches and data integrity compromises have increased greatly, and naturally, this has led to an increase in cybersecurity control implementations across organizations (e.g., LastPass databreach; Toubba, 2022). Data theft and loss exceeded the trillion-dollar cost mark as early as 2020 (Riley, 2020). Given that employees will be at the forefront of experiencing the heightened security implementations, our proposal is designed to investigate the implications of increased security demands. The implications of increased security demands will be explored through the human experiences during failed login attempts, and information will be extracted with an event-contingent diary protocol. Diaries specialize in capturing naturalistic experiences of human emotion, cognition, and behavior, while observing less bias than what is associated with memory recall or researcher presence (Bradburn et al., 1987; Fahrenberg et al., 2007; Gorin & Stone, 2001; Himmelstein et al., 2019; Schwarz, 2007; Shiffman et al., 2008; Stone & Broderick, 2007; Tourangeau, 2000). It is predicted that login failures will impact short term levels of frustration and negative appraisals of security-related technology, and that these experiences will drive engagement in counterproductive workplace behavior (CWBs), emotional labor, lower levels of organizational commitment, reduced perceptions of organizational justice, lower levels of perceived organizational support, as well as loss of productive time during the work day (Barkatsas et al., 2009; Fox & Spector, 1999; Fox et al., 2001; Hülsheger & Schewe, 2011; Li et al., 2019; Paul & Dykstra, 2022; Pham et al., 2019; Wing & Lam, 2012).
Design/methodology/approach:
This study will employ a three-phase design with a sample of 60 university employees, at a university in which heightened authentication protocols exist. In the first phase of the study design, participants will complete preobservational surveys. The pre-observational surveys are measures of general self-efficacy, security-related selfefficacy, security complexity, security overload, security uncertainty, computer self-efficacy, and the Human Aspects of Information Security Questionnaire. Additionally, trait affect will be measured through the short Positive Affect Negative Affect Scale, and will be used as a control for emotional reactivity (Darcy et al., 2014; Chen et al., 2001; Compeau & Higgins, 1995; Colquitt, 2001; Eisenberger et al., 1986; Glomb & Tews, 2004; Howard,
2014; Meyer et al., 1993; Parsons et al., 2017; Peters et al., 1980; Watson & Tellegen, 1988). Lastly, we will collect a short self-report list of password management techniques used by the participant.
The second phase will be the naturalistic observations of our study participants, using a diary protocol. Each time a participant experiences a failed login attempt (accessing university resources for work), they will complete an event within the diary (event-contingent). The diary consists of a momentary measure of frustration, a momentary measure of cognitive appraisal of the failed login, an estimate of time lost due to the failed login, and a final checkmark to indicate no failed logins for a given day. The diary will be completed at least once per day, for 30 days, or until the maximum number of login failures has occurred (15).
The third phase will consist of the participants completing a final series of survey measures, and returning their diaries. The protocol will re-assess general self-efficacy, computer self-efficacy, as well as the security constructs (self-efficacy, complexity, overload, and uncertainty). Finally, outcome measures of CWBs, emotional labor, organizational justice perceptions, organizational support, job engagement, and organizational commitment will be completed.
Findings:
We expect to begin data collection in September 2023, and to finish data collection by September 2024. Data analysis is expected to begin following data collection completion, and will be finalized by December 2024.
Limitations of this research design apply directly to its data collection methodology. In diary paradigms, there are no experimental manipulations, which affect the ability to determine true causality in outcome variables (though there is still the important element of time). Additionally, diary studies rely heavily upon the accuracy and engagement of the participant, and given the long period of the diary collection, diary engagement and data accuracy may suffer.
Consistent experiences of frustration and negative thoughts surrounding the technological space at work have the potential to relate with, or lead to workers perceiving their organization as less supportive and just (Jacobs et al., 2014). Along with less perceived support and justice, workers may be more likely to engage in counterproductive workplace behaviors that lessen productivity, performance, and engagement both within the job and the broader organizational environment (Cochran, 2014; Colquitt et al., 2013). Additionally, workers are less likely to be committed to an organization that is seen as less fair and supportive (important turnover implications), and lastly workers experiencing momentary levels of moderate or high frustration and negative thoughts surrounding their
work environment are more likely to engage in unhelpful patterns of emotional labor (burnout implications) (Hülsheger & Schewe, 2011; Jacobs et al., 2014; Lam & Chen, 2012).
Originality/value:
This project will contribute to literature in cybersecurity and organizational psychology in multiple ways. First, the ability to use daily login failures as a source of predicting important workplace outcomes is a novel approach, and this study aims to explore the nature of authentication failures’ relationship with human experience and employee outcomes To the knowledge of the author, little work has been done to understand the direct link between daily authentication failures (an event characterized by cybersecurity implementation, methodology, and demand) and the subsequent impact on human behavior, cognition, and emotions which potentially lead to outcomes of importance to organizations (Lahcen et al., 2020). Second, we aim to explore the economic impact of increased security demands placed upon employees, and ultimately, if the way in which security protocols are adopted influences the economic bottom line of worker productivity. Third, we aim to explore patterns of cybersecurity performance across individuals and develop categories of users depending on their cybersecurity behaviors (ability to login successfully). Our goal is to determine whether certain individual characteristics predispose employees to poor cybersecurity performance, and ultimately, consequential organizational and employee outcomes.
Barkatsas, A. (T., Kasimatis, K., & Gialamas, V. (2009). Learning secondary mathematics with technology: Exploring the complex interrelationship between students’ attitudes, engagement, gender and achievement. Computers & Education, 52(3), 562–570. https://doi.org/10.1016/j.compedu.2008.11.001
Bradburn, N. M., Rips, L. J., & Shevell, S. K. (1987, April 10). Answering autobiographical questions: The impact of memory and inference on surveys. Science, 236, 157–161. http://dx.doi.org/10.1126/science .3563494
Chen, G., Gully, S. M., Eden, D. (2001). Validation of a new general self-efficacy scale. Organizational Research Methods, 4, 62-83. https://doi.org/10.1177/109442810141004
Cochran, Megan, "Counterproductive Work Behaviors, Justice, and Affect: A Meta-Analysis" (2014). Electronic Theses and Dissertations, 2004-2019. 4517. https://stars.library.ucf.edu/etd/4517
Compeau, D. R., & Higgins, C. A. (1995). Computer self-efficacy: Development of a measure and initial test. MIS Quarterly, 19(2), 189. https://doi.org/10.2307/249688
Colquitt, J. A. (2001). On the dimensionality of organizational justice: A construct validation of a measure. Journal of Applied Psychology, 86, 386-400.
Colquitt, J. A., Scott, B. A., Rodell, J. B., Long, D. M., Zapata, C. P., Conlon, D. E., & Wesson, M. J. (2013). Justice at the millennium, a decade later: A meta-analytic test of social exchange and affect-based perspectives. Journal of Applied Psychology, 98(2), 199–236. https://doi.org/10.1037/a0031757
D'Arcy, J., Herath, T., & Shoss, M. K. (2014). Understanding employee responses to stressful information security requirements: A coping perspective. Journal of Management Information Systems, 31, 285-318. doi: 10.2753/MIS0742-1222310210
Eisenberger, R., Huntington, R., Hutchison, S., & Sowa, D. (1986). Perceived organizational support. Journal of Applied Psychology, 71(3), 500-507.
Fahrenberg, J., Myrtek, M., Pawlik, K., & Perrez, M. (2007). Ambulatory assessment Monitoring behavior in daily life settings: A behavioralscientific challenge for psychology. European Journal of Psychological Assessment, 23, 206 –213. http://dx.doi.org/10.1027/1015-5759.23.4.206
Fox, S., & Spector, P. E. (1999). A model of work frustration-aggression. Journal of Organizational Behavior, 20(6), 915–931. https://doi.org/10.1002/(sici)1099-1379(199911)20:6<915::aid-job918>3.0.co;2-6
Fox, S., Spector, P. E., & Miles, D. (2001). Counterproductive work behavior (CWB) in response to job stressors and organizational justice: Some mediator and moderator tests for autonomy and emotions. Journal of Vocational Behavior, 59(3), 291–309.https://doi.org/10.1006/jvbe.2001.1803
Glomb, T. M., & Tews, M. J. (2004). Emotional labor: A conceptualization and scale development. Journal of Vocational Behavior, 64(1), 1–23. https://doi.org/10.1016/s0001-8791(03)00038-1
Gorin, A., & Stone, A. (2001). Recall biases and cognitive errors in retrospective self-reports: A call for momentary assessments. In A. Baum, T. Revenson, & J. Singer (Eds.), Handbook of health psychology (pp. 405–413). Mahwah, NJ: Erlbaum.
Himmelstein, P. H., Woods, W. C., & Wright, A. G. C. (2019). A comparison of signal- and event-contingent ambulatory assessment of interpersonal behavior and affect in social situations. Psychological Assessment, 31(7), 952–960. https://doi.org/10.1037/pas0000718
Howard, M. C. (2014). Creation of a computer self-efficacy measure: Analysis of internal consistency, psychometric properties, and validity. Cyberpsychology, Behavior, and Social Networking, 17(10), 677–681. https://doi.org/10.1089/cyber.2014.0255
Hülsheger, U. R., & Schewe, A. F. (2011). On the costs and benefits of emotional labor: A meta-analysis of three decades of research. Journal of Occupational Health Psychology, 16(3), 361–389. https://doi.org/10.1037/a0022876
Lam, W., & Chen, Z. (2012). When I put on my service mask: Determinants and outcomes of emotional labor among hotel service providers according to Affective Event Theory. International Journal of Hospitality Management, 31(1), 3–11. https://doi.org/10.1016/j.ijhm.2011.04.009https://doi.org/10.1016/j.ijhm.2011.04.009
Li, Y., Pan, T. and Zhang, N.(A). (2020), "From hindrance to challenge: How employees understand and respond to information security policies", Journal of Enterprise Information Management, Vol. 33 No. 1, pp. 191213. https://doi.org/10.1108/JEIM-01-2019-0018
Maalem Lahcen, R.A., Caulkins, B., Mohapatra, R. et al. Review and insight on the behavioral aspects of cybersecurity. Cybersecur 3, 10 (2020). https://doi.org/10.1186/s42400-020-00050-w
Meyer, J.P., Allen, N.J., Smith, C.A. (1993). Commitment to Organizations and Occupations: Extension and test of a three-component conceptualization. Journal of Applied Psychology, 78(4), 538-551.
Parsons, K., Calic, D., Pattinson, M., Butavicius, M., McCormac, A., & Zwaans, T. (2017). The Human Aspects of Information Security Questionnaire (HAIS-Q): Two further validation studies. Computers & Security, 66, 40–51. https://doi.org/10.1016/j.cose.2017.01.004
Paul, C. L., & Dykstra, J. (n.d.). Understanding Operator Fatigue, Frustration, and Cognitive Workload in Tactical Cybersecurity Operations. Journal of Information Warfare, 16(2) (2022), 1–11.
Pham, H. C., Brennan, L., & Furnell, S. (2019). Information security burnout: Identification of sources and mitigating factors from security demands and resources. Journal of Information Security and Applications, 46, 96–107. https://doi.org/10.1016/j.jisa.2019.03.012https://doi.org/10.1016/j.jisa.2019.03.012
Peters, L. H., O'Connor, E. J., & Rudolf, C. J. (1980). The behavioral and affective consequences of performancerelevant situational variables. Organizational Behavior and Human Performance, 25(1), 79–96. https://doi.org/10.1016/0030-5073(80)90026-4
Pham, Hiep & Brennan, Linda & Richardson, Joan. (2017). Review Of Behavioural Theories In Security Compliance And Research Challenges. 10.28945/3722.
Riley, T. (2020, December 7). The Cybersecurity 202: Global losses from cybercrime skyrocketed to nearly $1 trillion in 2020, new report finds. The Washington Post. Retrieved April 20, 2022, from https://www.washingtonpost.com/politics/2020/12/07/cybersecurity-202-global-losses-cybercrimeskyrocketed-nearly-1-trillion-2020/.
Schwarz, N. (2007). Retrospective and concurrent self-reports: The rationale for real-time data capture. In A. A. Stone, S. Shiffman, A. A. Atienza, & L. Nebeling (Eds.), The science of real-time data capture: Self-reports in health research (pp. 11–26). New York, NY: Oxford University Press.
Shiffman, S., Stone, A. A., & Hufford, M. R. (2008). Ecological momentary assessment. Annual Review of Clinical Psychology, 4, 1–32. http:// dx.doi.org/10.1146/annurev.clinpsy.3.022806.091415
Tourangeau, R. (2000). Remembering what happened: Memory errors and survey reports. In A. A. Stone,... (Eds.), The science of self-report: Implications for research and practice (pp. 29 – 47). Mahwah, NJ: Erlbaum
Toubba, K. (2022, December 22). Notice of recent security incident. The LastPass Blog. Retrieved February 28, 2023, from https://blog.lastpass.com/2022/12/notice-of-recent-security-incident/
Watson, D., Clark. L. A., & Tellegen,A. (1988). Development and validation of brief measures of positive and negative affect: The PANAS scales. Journal of Personality & Social Psychology, 54(6), 1063-1070.


philip - shumway@utulsa.edu
https://www.linkedin.com/in/philip - shumway - 6a0344290/
Philip Shumway is a PhD student in the school of Cyber Studies at the University of Tulsa and is currently pursuing reseach into the specific emotional, cognitive, and behavioral consequences of increased cyber security demands within workplace environments. Broadly, he aims to understand the interactions between human behavior and cyber security hardware, software, and policy implementations. He graduated with an MA in Industrial Organizational Psychology from the University of Tulsa in 2023.
● Worked as a research coordinator for a clinical neuroscience laboratory handling da ta collection, data analysis, participant consent and follow - up, and meeting organization for over 3 years. Data collection involved fMRI scans of brain regions, clinical interviewing (psychiatric interviews), and psychological/sleep survey data.
● Worked closely with the Cyber Studies program as an intern working in an or ganizational development capacity, generating a stakeholder analysis presentation and contributing to the re - vamping of program details (student/faculty handbook and new student guides).
Tulsa Area, Remote
James Higgs (Cyber Fellow) and Stephen Flowerday (Advisor)
This research study challenges the perspective that virtual worlds are solely suited to small-scale criminality. Previous literature has overlooked the substantial monetary value associated with online gaming accounts and virtual assets, particularly given the rapid growth of the microtransaction business model. One critical factor challenging the ‘small-scale’ perspective is the changing structure of the online video gaming industry. Today, the in -game sale of virtual items (i.e., microtransactions) is a primary means of revenue generation for online video game companies. In-game consumer spending is forecasted to reach $75 billion by 2025. The online video game industry boasted revenues of $26.14 billion for 2023, with an estimated 1.1 billion online gamers worldwide (Clement 2023). Questions surrounding the scale of cybercrime operations possible should be informed by the changes present in the online video gaming ecosystem. The surge in demand for virtual items and currency has created diverse channels for cybercriminals to launder illicit proceeds from account and virtual theft (Lykousas et al. 2023). This research study is dedicated towards proposing and devising novel security controls that are targeted towards reducing cybercrime incidence rates in the online video gaming ecosystem. State of the art fraud analytic approaches are brought to bear on the problem domain.
References
Clement, J. 2023. “Online Gaming - Statistics and Fact.” (https://www.statista.com/topics/1551/online-gaming, accessed January 12, 2024). Lykousas, N., Koutsokostas, V., Casino, F., and Patsakis, C. 2023. “The Cynicism of Modern Cybercrime: Automating the Analysis of Surface Web Marketplaces,” in IEEE International Conference on Service-Oriented System Engineering (SOSE), pp. 161–171. (https://doi.org/10.1109/SOSE58276.2023.00027).
Bios
James Higgs is a PhD student in the School of Cyber Studies at The University of Tulsa. He holds a Master of Commerce degree from Rhodes University, specializing in Information Systems. James' research interests center around money laundering, digital identity manageme nt, and economic and financial crime.
Stephen Flowerday is a professor in the School of Cyber Studies at The University of Tulsa. His research interests lie in behavioral cybersecurity, information security management, and the human aspects of cybersecurity. Stephen has received funding for his work from IBM, THRIP, NRF, SASUF, Erasmus, GMRDC, and others.
Jack Tilbury LinkedIn
Jack - Tilbury@utulsa.edu
JackTilbury Google Scholar
● Security P roduct Manager
● Security,Risk & Resilient Strategy Consulting
● Security An alystOperations
● Research S cientist
Working Location Preference
Tulsa Area, Florida, Chicago, Washington, Remote
Internships / RA / TA / Work History
2022Present Doctoral Researcher
20202022 Product Manager Flash Mobile Vending & The Delta, South Africa
2019 Assistant Lecturer and Teaching Assistant Rhodes University
2018 Software Implementation Analyst Saratoga, Cape Town
JackTilburyisasecond-yearPh.D.studentatTheUniversityofTulsa.Heobtained hisresearch-basedMCominInformationSystemsfromRhodesUniversity,South Africa,in2019.JackwasawardedafullscholarshiptopursuehisMaster'sdegree, whichexploredthePropTechindustry–conductingrealestatetransactionsthrough blockchaintechnology. HegraduatedatthetopofhisInformationSystemshonors classasheobtainedaBusinessScienceundergraduatedegree.Sincearrivingin Tulsa,JackhasattendedandpublishedattheAnnualSecurityConferenceandhas beeninvitedtopresentattheUNESCOSafetyConference.Hisresearchincludes informationsystems,behavioralinformationsecurity,andautomateddecisionaidsin securityoperationcenters.BeforestartinghisPh.D.research,Jackworkedasa ProductManagerintheITindustryattwosoftwaredevelopmentcompanies.
JackworkedfortwoyearsasaProductManagerwithexperienceinstart-upand corporateenvironments,buildingandlaunchingmultipleproductstomarket.Jackis eagertocontributetothedevelopmentofsecurityproductseitherthroughleading productteams,engagingwithproductcustomers,orconductingproductresearch.

Authors: Jack Tilbury (Cyber Fellow) and Dr. Stephen Flowerday (Advisor)
Department: School of Cyber Studies
Abstract
Increased dependence on automation has the potential to impact SOC analysts in terms of automation bias and complacency, whereby security analysts unwaveringly trust automated decisions. This leads to the misuse and disuse of automation. Despite their benefits, automated security tools are not infallible and should only be relied upon partially, where applicable. Rather, automation should serve as an intelligence assistant to security analysts, helping to triage, correlate, and interpret security alert threat intelligence information. This study intends to garner insights regarding the trust SOC analysts put in automated security tools and the extent to which automation bias and complacency occur. A mixed-methods approach to data collection will be followed. A qualitative scoping review has been performed and a quantit ative survey will be administered to collect additional data. This will be done using the prolific survey platform. Following this, and to triangulate the research findings, qualitative forms of data collection such as observations and expert interviews will be conducted.
This research is centered on the use of automation within Security Operation Centers (SOCs) and the impact this has on the human factor component, the SOC analysts. SOC teams must consist of cognitively skilled security analysts who are able to safeguard their respective organizations against cyber-attacks. Specifically, security analysts are tasked with monitoring and triaging incoming alerts, identifying critical threats, and implementing effective mitigation and response strategies. As part of this doctoral research, I aim to investigate how automation is utilized in SOCs, to what degree levels of automation are implemented, and what implications increased automation has on SOC analysts. With the increase in AI/ML solutions in security monitoring, it is important that these tools are built with the human factor in mind. Moreover, human-machine trust must be calibrated, identifying each entities strengths and weaknesses in a complementary manner. Specific aspects that this research project will focus on are:
1. Automation Bias: The increased adoption of automation in SOCs may have adverse effects on SOC analysts. This occurs through automation bias whereby SOC analysts become over-reliant on automated decisions, despite the presence of contradictory information. Higher levels of automation (LOA) lead to human-out-of-the-loop, resulting in the loss of situation awareness, cognitive skill degradation, and task complacency. The concept of automation bias has been tested and proved in other domains with high levels of automation (i.e., air traffic control rooms). Given SOCs necessity to leverage automated solutions to deal with the volume of alerts, it is applicable to understand potential bias and complacency.
2. Information Processing: Individuals can either process information in a systematic (methodical and timely) or heuristic (intuitive and efficient) manner. In a SOC, accuracy, and efficiency are of paramount concern when remediating cyber threats, yet these two constructs each represent different information processing techniques. SOC analysts do not have the cognitive processing ability to deal with the volume and complexity of threats and hence the uptake of novel automated solutions. However, to better understand the SOC analyst and their tool interaction, this research aims to learn how these analysts tackle their alert triage and problem-solving techniques.
SOCs face the challenge of alert overload, with increased automation being the proposed solution. However, few studies have examined the effects of increased automation on SOC analysts, who must remain cognitively aware and competent to take over and act upon automation's proficiency to defend against threats successfully. In an environment where alert volumes are predicted to increase, automation must
too, improve, flagging only critical threats. Increased levels of automation can lead to human out -of-theloop, a loss of situation awareness, and cognitive skill degradation amongst SOC analysts. Thus, research evaluating how SOC analysts and automation operate in tandem is essential.
References
Agyepong, E., Cherdantseva, Y., Reinecke, P., & Burnap, P. (2023). A systematic method for measuring the performance of a cyber security operations centre analyst. Computers & Security, 124, 102959. https://doi.org/10.1016/j.cose.2022.102959
Akinrolabu, O., Agrafiotis, I., & Erola, A. (2018). The challenge of detecting sophisticated attacks: Insights from SOC Analysts. Proceedings of the 13th International Conference on Availability, Reliability and Security, 1–9. https://doi.org/10.1145/3230833.3233280
Alahmadi, B. A., Axon, L., & Martinovic, I. (2022). 99% False Positives: A Qualitative Study of SOC Analysts’ Perspectives on Security Alarms. 31st Usenix Security Symposium. Usenix - The Advanced Computing Systems Association.
Ban, T., Samuel, N., Takahashi, T., & Inoue, D. (2021). Combat Security Alert Fatigue with AI-Assisted Techniques. CSET ’21, 9–16. https://doi.org/10.1145/3474718.3474723
Kokulu, F. B., Soneji, A., Bao, T., Shoshitaishvili, Y., Zhao, Z., Doupé, A., & Ahn, G.-J. (2019). Matched and Mismatched SOCs: A Qualitative Study on Security Operations Center Issues. CCS ’19, 1955– 1970. https://doi.org/10.1145/3319535.3354239
Author & Advisor Bios
Jack Tilbury is a cybersecurity Ph.D. student at The University of Tulsa. He obtained a Master of Commerce in Information Systems after completing a Business Science undergraduate degree. His research interests center around behavioral information security, security operations centers (SOCs), and automated decision aids in security event triaging and mitigation processes.
Stephen Flowerday is currently a professor at the School of Cyber Studies at the University of Tulsa. His research interests lie in enterprise security and the human aspects of cybersecurity. He has received funding for his work from IBM, THRIP, NRF, SASUF, Erasmus, GMRDC, and others.
Jack Tilbury LinkedIn
Jack - Tilbury@utulsa.edu

JackTilburyisasecond-yearPh.D.studentatTheUniversityofTulsa.Heobtained hisresearch-basedMCominInformationSystemsfromRhodesUniversity,South Africa,in2019.JackwasawardedafullscholarshiptopursuehisMaster'sdegree, whichexploredthePropTechindustry–conductingrealestatetransactionsthrough blockchaintechnology. HegraduatedatthetopofhisInformationSystemshonors classasheobtainedaBusinessScienceundergraduatedegree.Sincearrivingin Tulsa,JackhasattendedandpublishedattheAnnualSecurityConferenceandhas beeninvitedtopresentattheUNESCOSafetyConference.Hisresearchincludes informationsystems,behavioralinformationsecurity,andautomateddecisionaidsin securityoperationcenters.BeforestartinghisPh.D.research,Jackworkedasa ProductManagerintheITindustryattwosoftwaredevelopmentcompanies.
● Security P roduct Manager
● Security,Risk & Resilient Strategy Consulting
● Security An alystOperations
● Research S cientist
Working Location Preference
Tulsa Area, Florida, Chicago, Washington, Remote
JackworkedfortwoyearsasaProductManagerwithexperienceinstart-upand corporateenvironments,buildingandlaunchingmultipleproductstomarket.Jackis eagertocontributetothedevelopmentofsecurityproductseitherthroughleading productteams,engagingwithproductcustomers,orconductingproductresearch.


The University of Tulsa (TU) Cyber Fellows seeks talented students interested in pursuing world-class PhD in cyber research while supported by a full-tuition scholarship and competitive living stipend.
TU is a private university located in Tulsa, Oklahoma and has been a leader in cybersecurity research and education for more than 20 years.
Cyber Corps Program in the United States
Cyber Program Nationally (U.S. News & World Report)
The TU Cyber Fellows initiative enables PhD students to pursue research with high commercialization potential involving cyber sciences. Sponsored by Tulsa Innovation Labs, the Cyber Fellows work with their faculty research advisors and commercial partners.
Full tuition remission
Competitive annual living stipend
Benefits provided to university graduate student employees
Private Research University Doctoral University in the Nation (U.S. News & World Report)
Any PhD program o ered by TU’s College of Engineering and Computer Science is eligible for the initiative with some additional course requirements. This initiative o ers research pursuits expanding to interdisciplinary studies, such as finance, law, and economics.
World-class cyber education and faculty
Unique testing assets
Weekly engagement with cyber/entrepreneurship leaders
Assigned commercial mentors
Access to TIL’s Cyber Entrepreneur in Residence
Research guidance from our commercial partners
Access to numerous local venture groups
Internship opportunities
Social/professional engagement with Tulsa community
If you want to identify real-world industry challenges, work with category-leading companies, and develop forward-looking enterprise solutions, consider joining one of our information sessions to learn more about who we are, what we do, and how you can fit in!
Don’t miss your chance to join our team! If you check the box that you are interested in Cyber Fellows within the TU graduate school application on our website at graduate.utulsa.edu/admission/applying and complete your application for review, we pay your application fee.
Gain access to some of the brightest minds in cyber and engineering, creating long-term, collaborative relationships at the intersection of academia and entrepreneurship.

Randy Roberts
Cyber Innovation Strategy Manager
The University of Tulsa randy-roberts@utulsa.edu | 918-631-6523

If you want to identify real-world industry challenges, work with category-leading companies, and develop forward-looking enterprise solutions, consider joining one of our information sessions to learn more about who we are, what we do, and how you can fit in!
Don’t miss your chance to join
the box that you are interested in
the TU graduate school application
and
your application for review, we pay your application fee.