UNESCO Chair on Hydrometeorological Risks, Universidad de las Américas Puebla
Nations
CHAIR MEMBERS
Director
Polioptro F. Martínez Austria udlap
CONTENTS
MEMBERS
Víctor Hugo Alcocer Yamanaka Consultant
Erick R. Bandala González Desert Research Institute, EE. UU.
Benito Corona Vázquez udlap
Johanness Cullmann World Meteorological Organization Geneva
Carlos Díaz Delgado Instituto Interamericano de Ciencias del Agua, México
Carlos Escalante Facultad de Ingeniería, unam
Matthew Larsen
Smithsonian Tropical Research Institute, EE. UU.
Alison Lee udlap
Benito Corona Vázquez udlap
Humberto Marengo Mogollón Instituto de Ingeniería, unam
Gabriela Moeller Chávez Universidad Politécnica de Morelos
Einar Moreno Quezada udlap
Carlos Patiño Gómez udlap
Sofía Ramos
President Luminario Education Strategies, EE.UU.
José Ángel Raynal Villaseñor Consultant
José D. Salas
Colorado State University, EE. UU.
Jim Thomas Desert Research Institute, EE. UU.
Juan Valdes University of Arizona, EE. UU.
http://www.udlap.mx/catedraunesco/
Advances in the Formulation of Phase IX of the International Hydrological Program 5
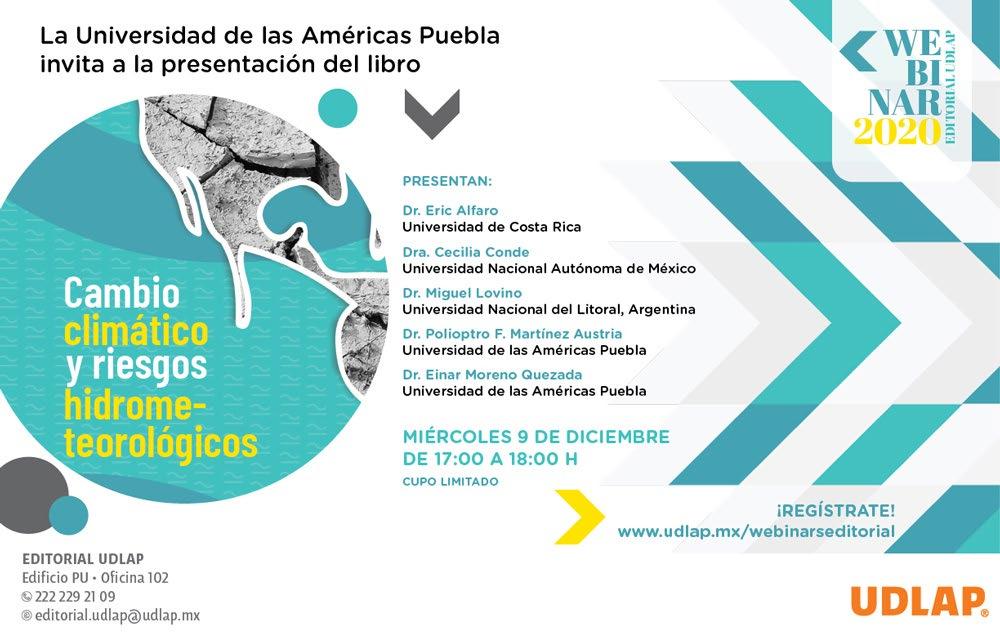
Presentation of the Book: «Climate Change and Hydrometeorological Risks»
Extreme Rainfall and Flooding in North America Caused by High Tides
Pedro Andrés Sánchez Gutiérrez
ADVANCES IN THE FORMULATION OF PHASE IX OF THE INTERNATIONAL HYDROLOGICAL PROGRAM
TEl Niño and its Rainfall Effects in Mexico
David Eduardo Guevara Polo
Droughts and Climate Change. Participation in the Seminar« Thematic Network on Water Management and Research»
Coming Event: «Water in your City» Seminar
Invitation to the Doctorate Program in Water Sciences
he unesco Chair in Hydrometerological Risks has continued to cooperate in the development of the 9th phase of the International Hydrological Program (ihp), valid from 2022 to 2029. The Chair corresponds to Polioptro F. Martínez Austria, who was selected as an expert by UNESCO member states. Right now, the second program draft is being reviewed and, considering comments made by ihp National Committees, UNESCO centers, chairs, and focal points connected to water, the third draft is being drawn up. It is expected that it will be the version delivered to the Intergovernmental Council for its approval.
The second draft is available at https://en.unesco.org/themes/water-security/ hydrology/about-us/council-documents. It analyzes water challenges at a global level along with foreseeable opportunities. ihp “forecasts a world with water security where individuals and institutions have appropriate skills and knowledge based on science to make informed decisions on water management and control, achieve sustainable development, and build resilient societies.”
The ihp, in its 9th phase, includes two strategic objectives, three outcomes (one enabling outcome), and five priority areas. Their definition corresponded to the main challenges and opportunities that were specified by member states. In its 9th phase, ihp’s strategic objectives are:
Strategic objective 1 (SO1): to improve water management and control, always based on evidence.
Strategic objective 2 (SO2): to enhance the resilience in societies concerning global change.
Anticipated outcomes are the following:
Outcome 1: Augmented capacity development and awareness raised on a sustainable water culture and administration.
Outcome 2: Overcoming gaps of water-related data and knowledge, and the improvement of scientific research and collaboration.
Outcome 3: Improved evidence-based decisions making on water for resilient societies brought about by reinforcing interfaces of science and policy.
Enabling result: Strengthening of collaboration capabilities and partnerships with associates of the unesco Water Family and, specifically, national committees and focal persons of ihp
Prioritized work areas are the ones below:
1. Scientific innovation and research;
2. Water education as part of the 4th industrial revolution;
3. Reduction of gaps related to data and knowledge;
4. Encompassing water management in conditions of world changes;
5. Water control based on science for mitigation, adaptation, and resilience.
By the end of February, the document of the 9th phase will be ready to be sent for approval by the member states.
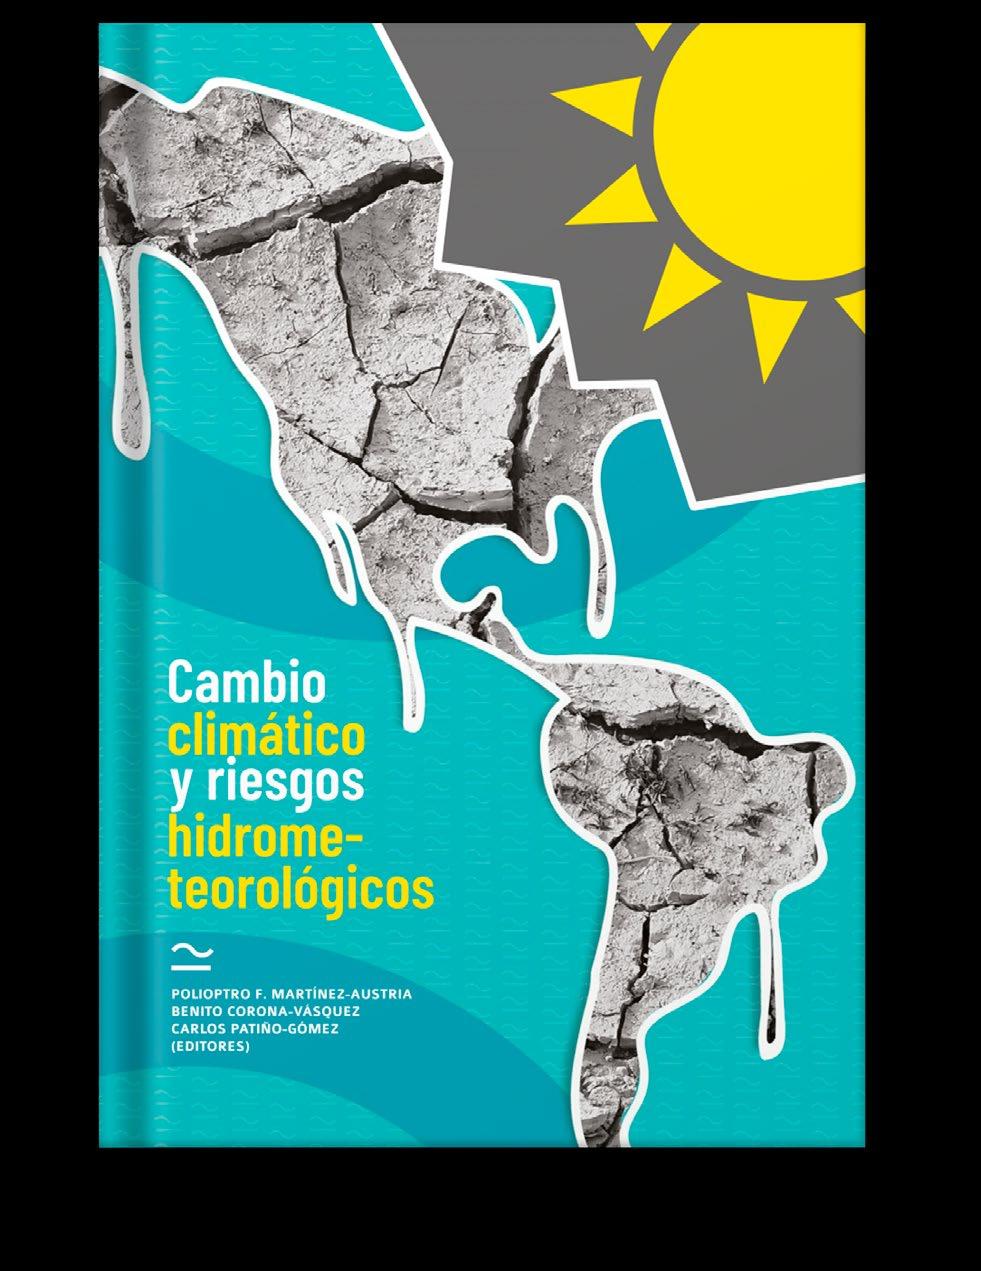
PRESENTATION OF THE BOOK: CLIMATE CHANGE AND HYDROMETEOROLOGICAL
RISKS
n Mexico, we do not have uniform policies to control rates of drinking water,” Dr. Einar Moreno stated. He is a professor of Universidad de las Américas in Puebla. He stated this when the book “Climate Change and Hydrometeorological Risks” was introduced. This book was part of the research of said work that, depending on the area, proved that the cost of 50 m3 of drinking water in Mexico varies between 32 and 1,800 pesos.
tion of bodies that utilizes this resource to achieve the expected levels related to production and performance, and it is part of this book drawn up as part of the International Seminar on Climate Change and Hydrometeorological Risk. This seminar was organized by the Chair of unesco-udlap and, in 2019, it was held at the campus of udlap, with different views on such issues and advances.
“Along with the decision of the Chicago Derivatives Market, which, in recent days, began the futures market water sale,” this comment by Dr. Moreno on the exaggerated costs of water pushes Mexico to work more seriously on this issue. It is an administrative issue related to the sale of drinking water services, because “it will depend on whether we can continue to keep competitiveness levels internationally,” he stated. This research work, whose title is “Water and Inflation in Mexico” emphasized, from an economic perspective, the significance of realizing that water has a weight as part of the cost structure, specifically as part of the transforma-
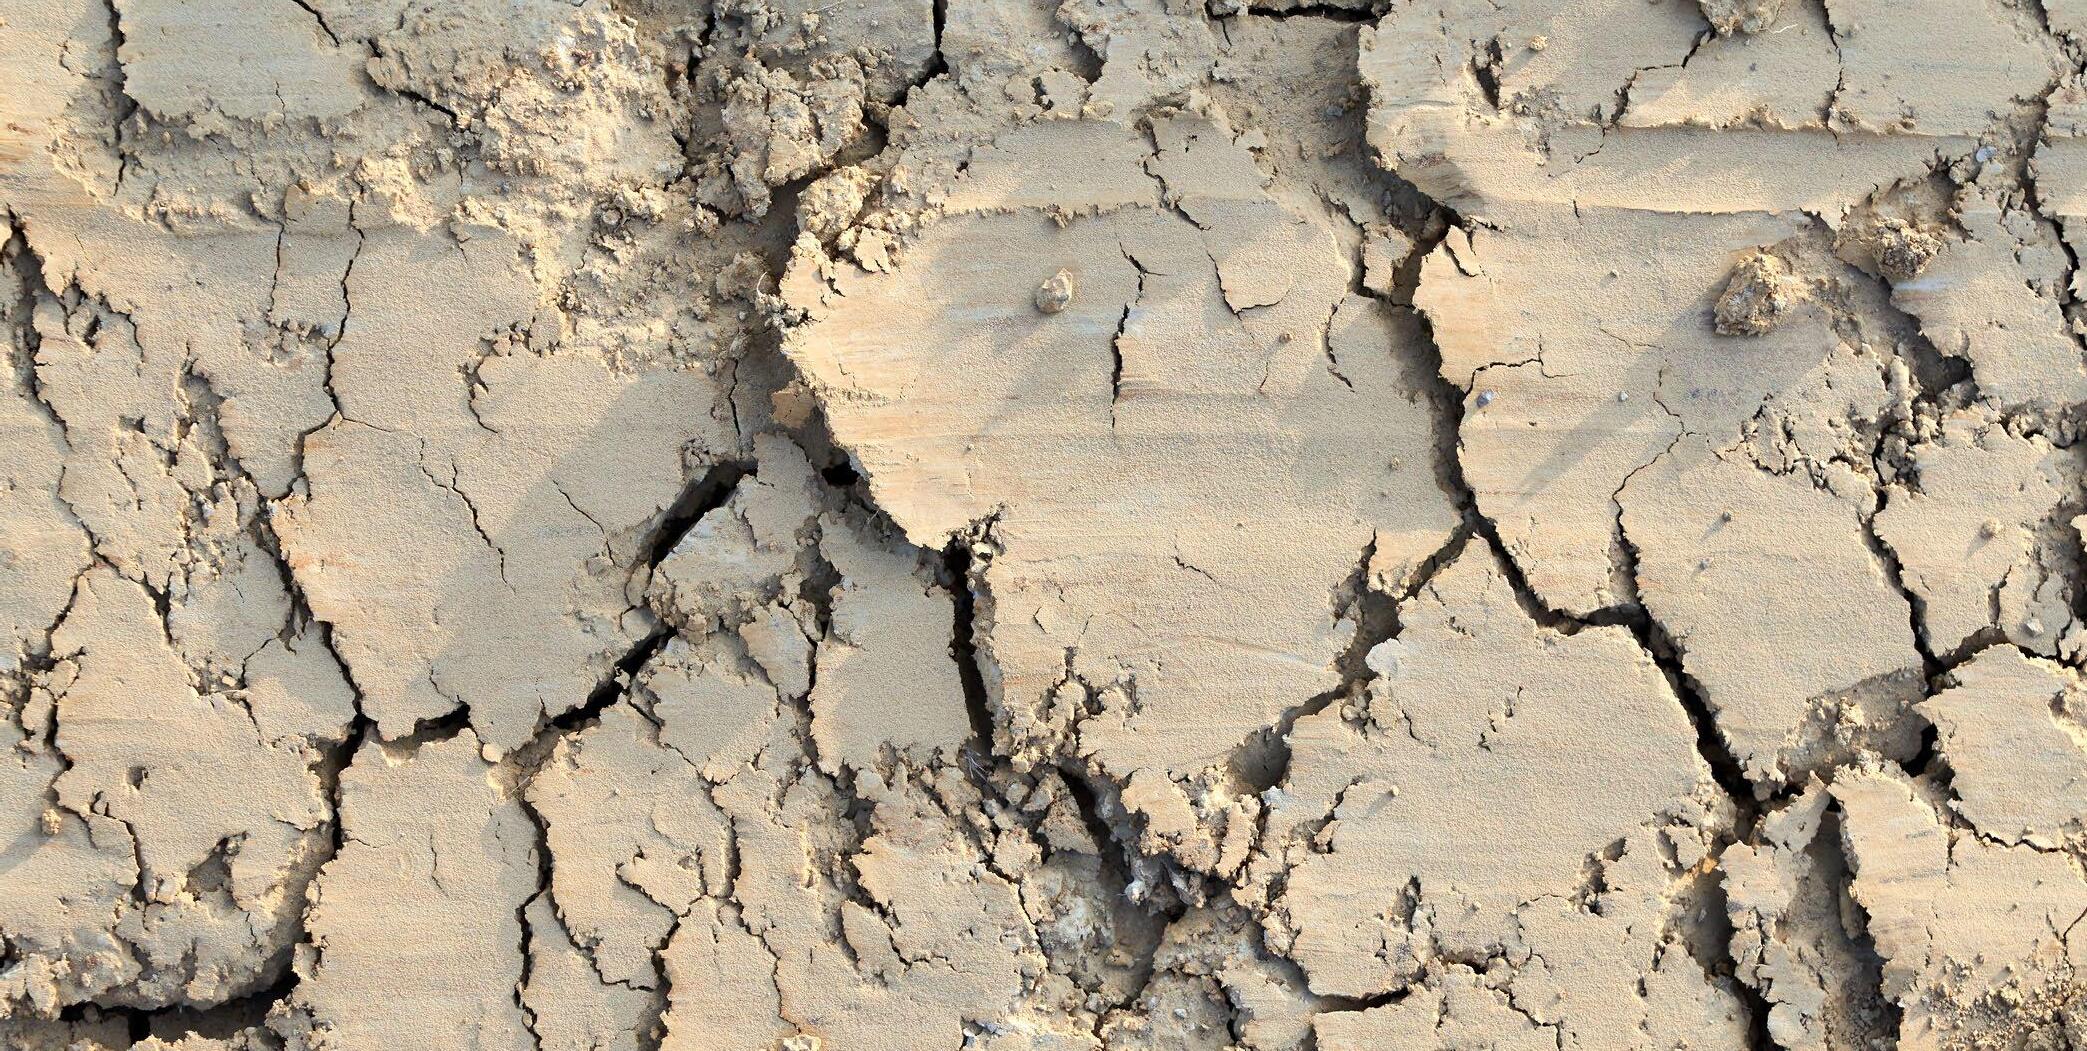
Additionally, Dr. Polioptro F. Martínez Austria, the editor of this publication, shared some disturbing data that are the background to suggest the importance of research in this subject matter. As an example, he stated that, only in Mexico, the drought monitor shows that over 70% of the territory is in a period of drought, especially in the northeast, where it is extremely severe. “Based on this background, it is quite apparent that there is a need to continue researching and discussing these phenomena, specifically in our territory, because in Latin America no large investments in science are made. This is why it is so important to establish these groups at diverse universities,” Dr. Martínez explained.
Other authors of the book participated in this Webinar. Dr. Miguel Lovino, author of “Vulnerability of Latin America to Climate Change and Variability,” in his participation emphasized that “a dweller of a developed country emits 38 times more CO2 than a person from a developing country.” Along with this, he stressed that the great majority of the Latin American population will be affected by the climate change with a greater impact, because of their fragile economic situation. Thus, in the chapter he wrote, he referred to the significance of transforming the inevitable into the sustainable. “Latin America has the opportunity to apply efficient adaptation processes that produce benefits, because their costs are going to be lower than the expected impact and adaptation works invigorate economies,” he stated. “In Mexico, drinking water has exaggerated costs,” the udlap academic stated.
At this seminar, Dr. Eric Alfaro also participated. He is author of the first chapter and presented some information on the hydrometeorological risks of the Central American Dry Cor-
ridor as part of research conducted by the advanced studies of advanced studies space the University of Costa Rica. Additionally, Dr. Cecilia Conde, of the National Autonomous University of Mexico, described her work in chapter 3. It is called “Climate Change and Hydrometeorological Extremes: Examples for Mexico.” She summarized that global warming is an ethical and political issue and not just related to environmental or atmospheric physics. “If we are going to face the issue of climate change, we need to have a clearer and closer idea of the relationship between science and politics,” she stated.
“Climate Change and Hydrometeorological Risks” has 11 chapters with studies of the most renowned researchers on regional hydrometeorological risks and describe scientific and technical terms. It presents several tools and associated issues. Currently, it is available online on the website of the unesco Chair in Hydrometeorological Risks udlap.
Participation in the Seminar “Thematic Network on Water Management and Research”
The Chair members periodically offer talks and participate in seminars on the central topic of the Chair. This activity is now developed remotely on a periodical basis.
The Thematic Network on Water Management and Research, backed by conacyt, held a seminar on several relevant issues on the water agenda in Mexico, and as part of this event, Polioptro F. Martínez Austria was a lecturer on “Droughts and Climate Change.” As stated by the title, the paper focused on the noticed and expected relationships between climate change and the increasingly recurring droughts in the world and, obviously, in Mexico.
With information from the United Nations Office for Disaster Prevention, the presentation emphasized the significance of droughts as one of the natural disasters that affect billions of
individuals globally. The projections of average rainfall deficit in Mexico, according to climate change scenarios, are not very encouraging, because a decrease of ~18% of precipitation is expected, with increased effects in arid and semi-arid zones, which is equal to ~70% of the continental surface of Mexico. It is expected that droughts will become increasingly frequent and intense as climate change increases. As a matter of fact, as analyzed in the presentation, this trend is already perceptible in diverse Mexican regions, such as the Conchos river basin and the Mixteca area. Such areas were used as examples in the presentation.
The unesco Chair will continue to research the relationship between droughts and climate change to help build a more resilient society through science-based decision making.
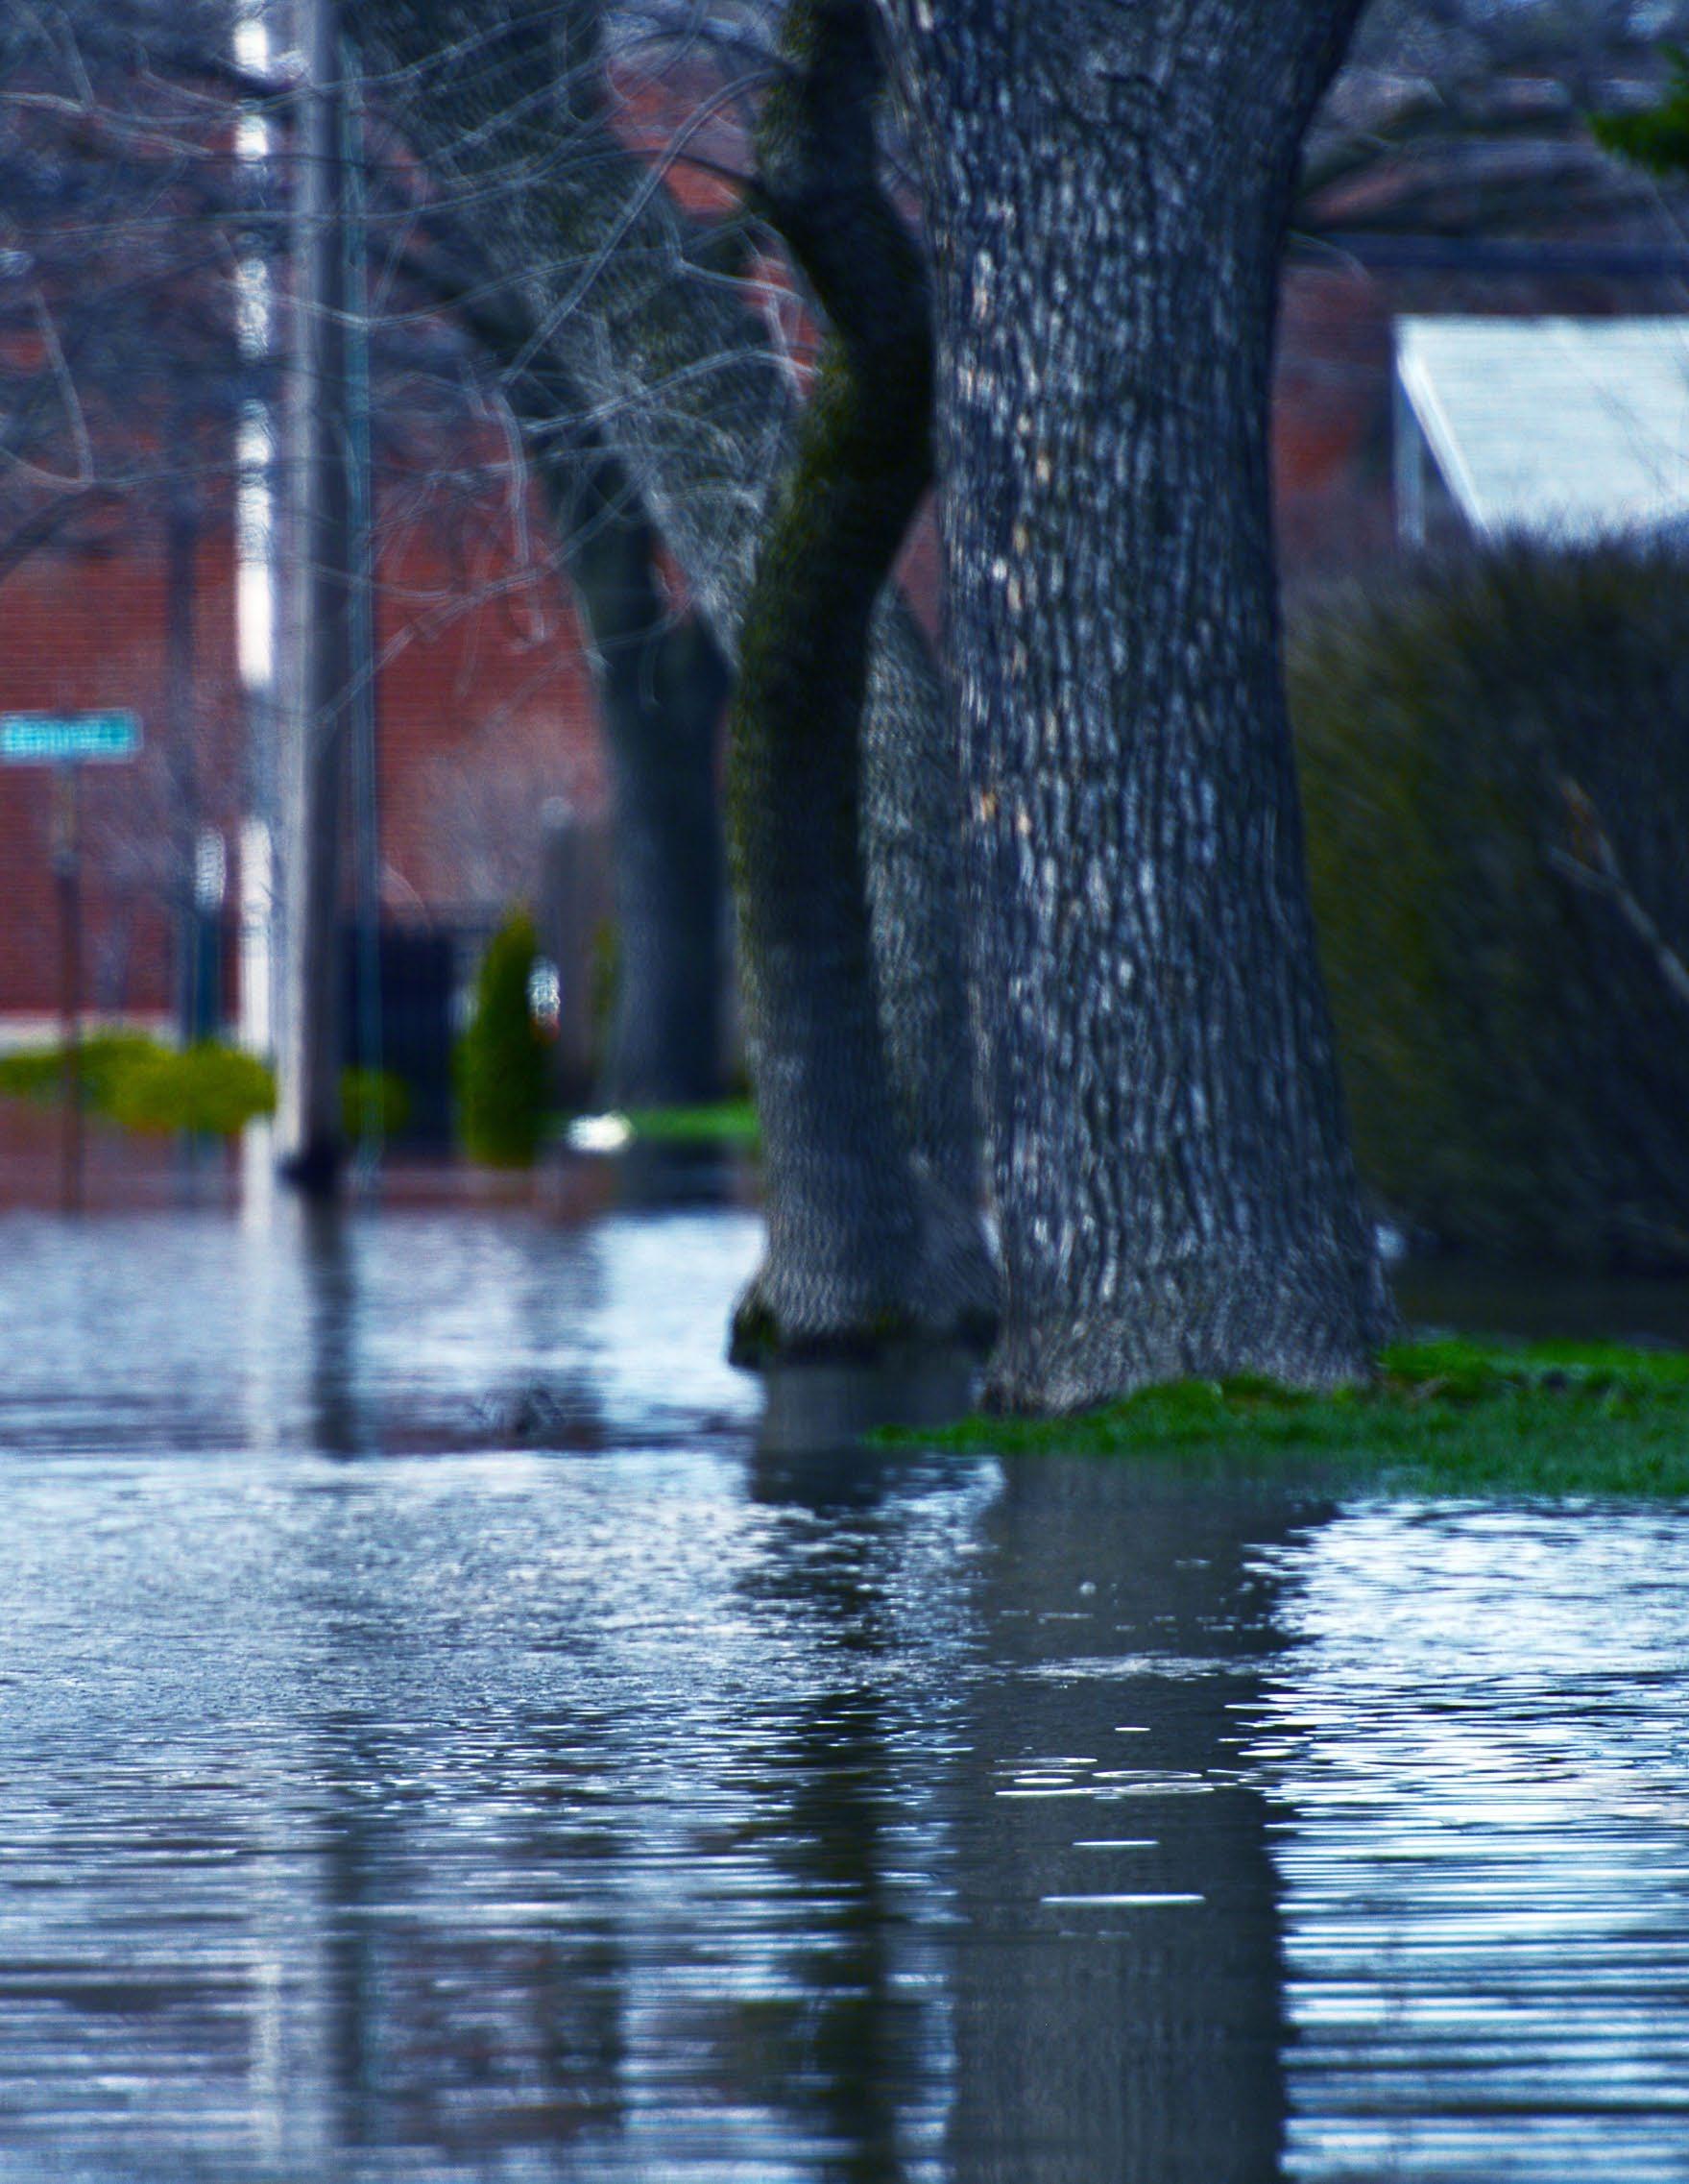
EXTREME RAINFALL AND FLOODING IN NORTH AMERICA CAUSED BY HIGH TIDES
PEDRO ANDRÉS SÁNCHEZ GUTIÉRREZ
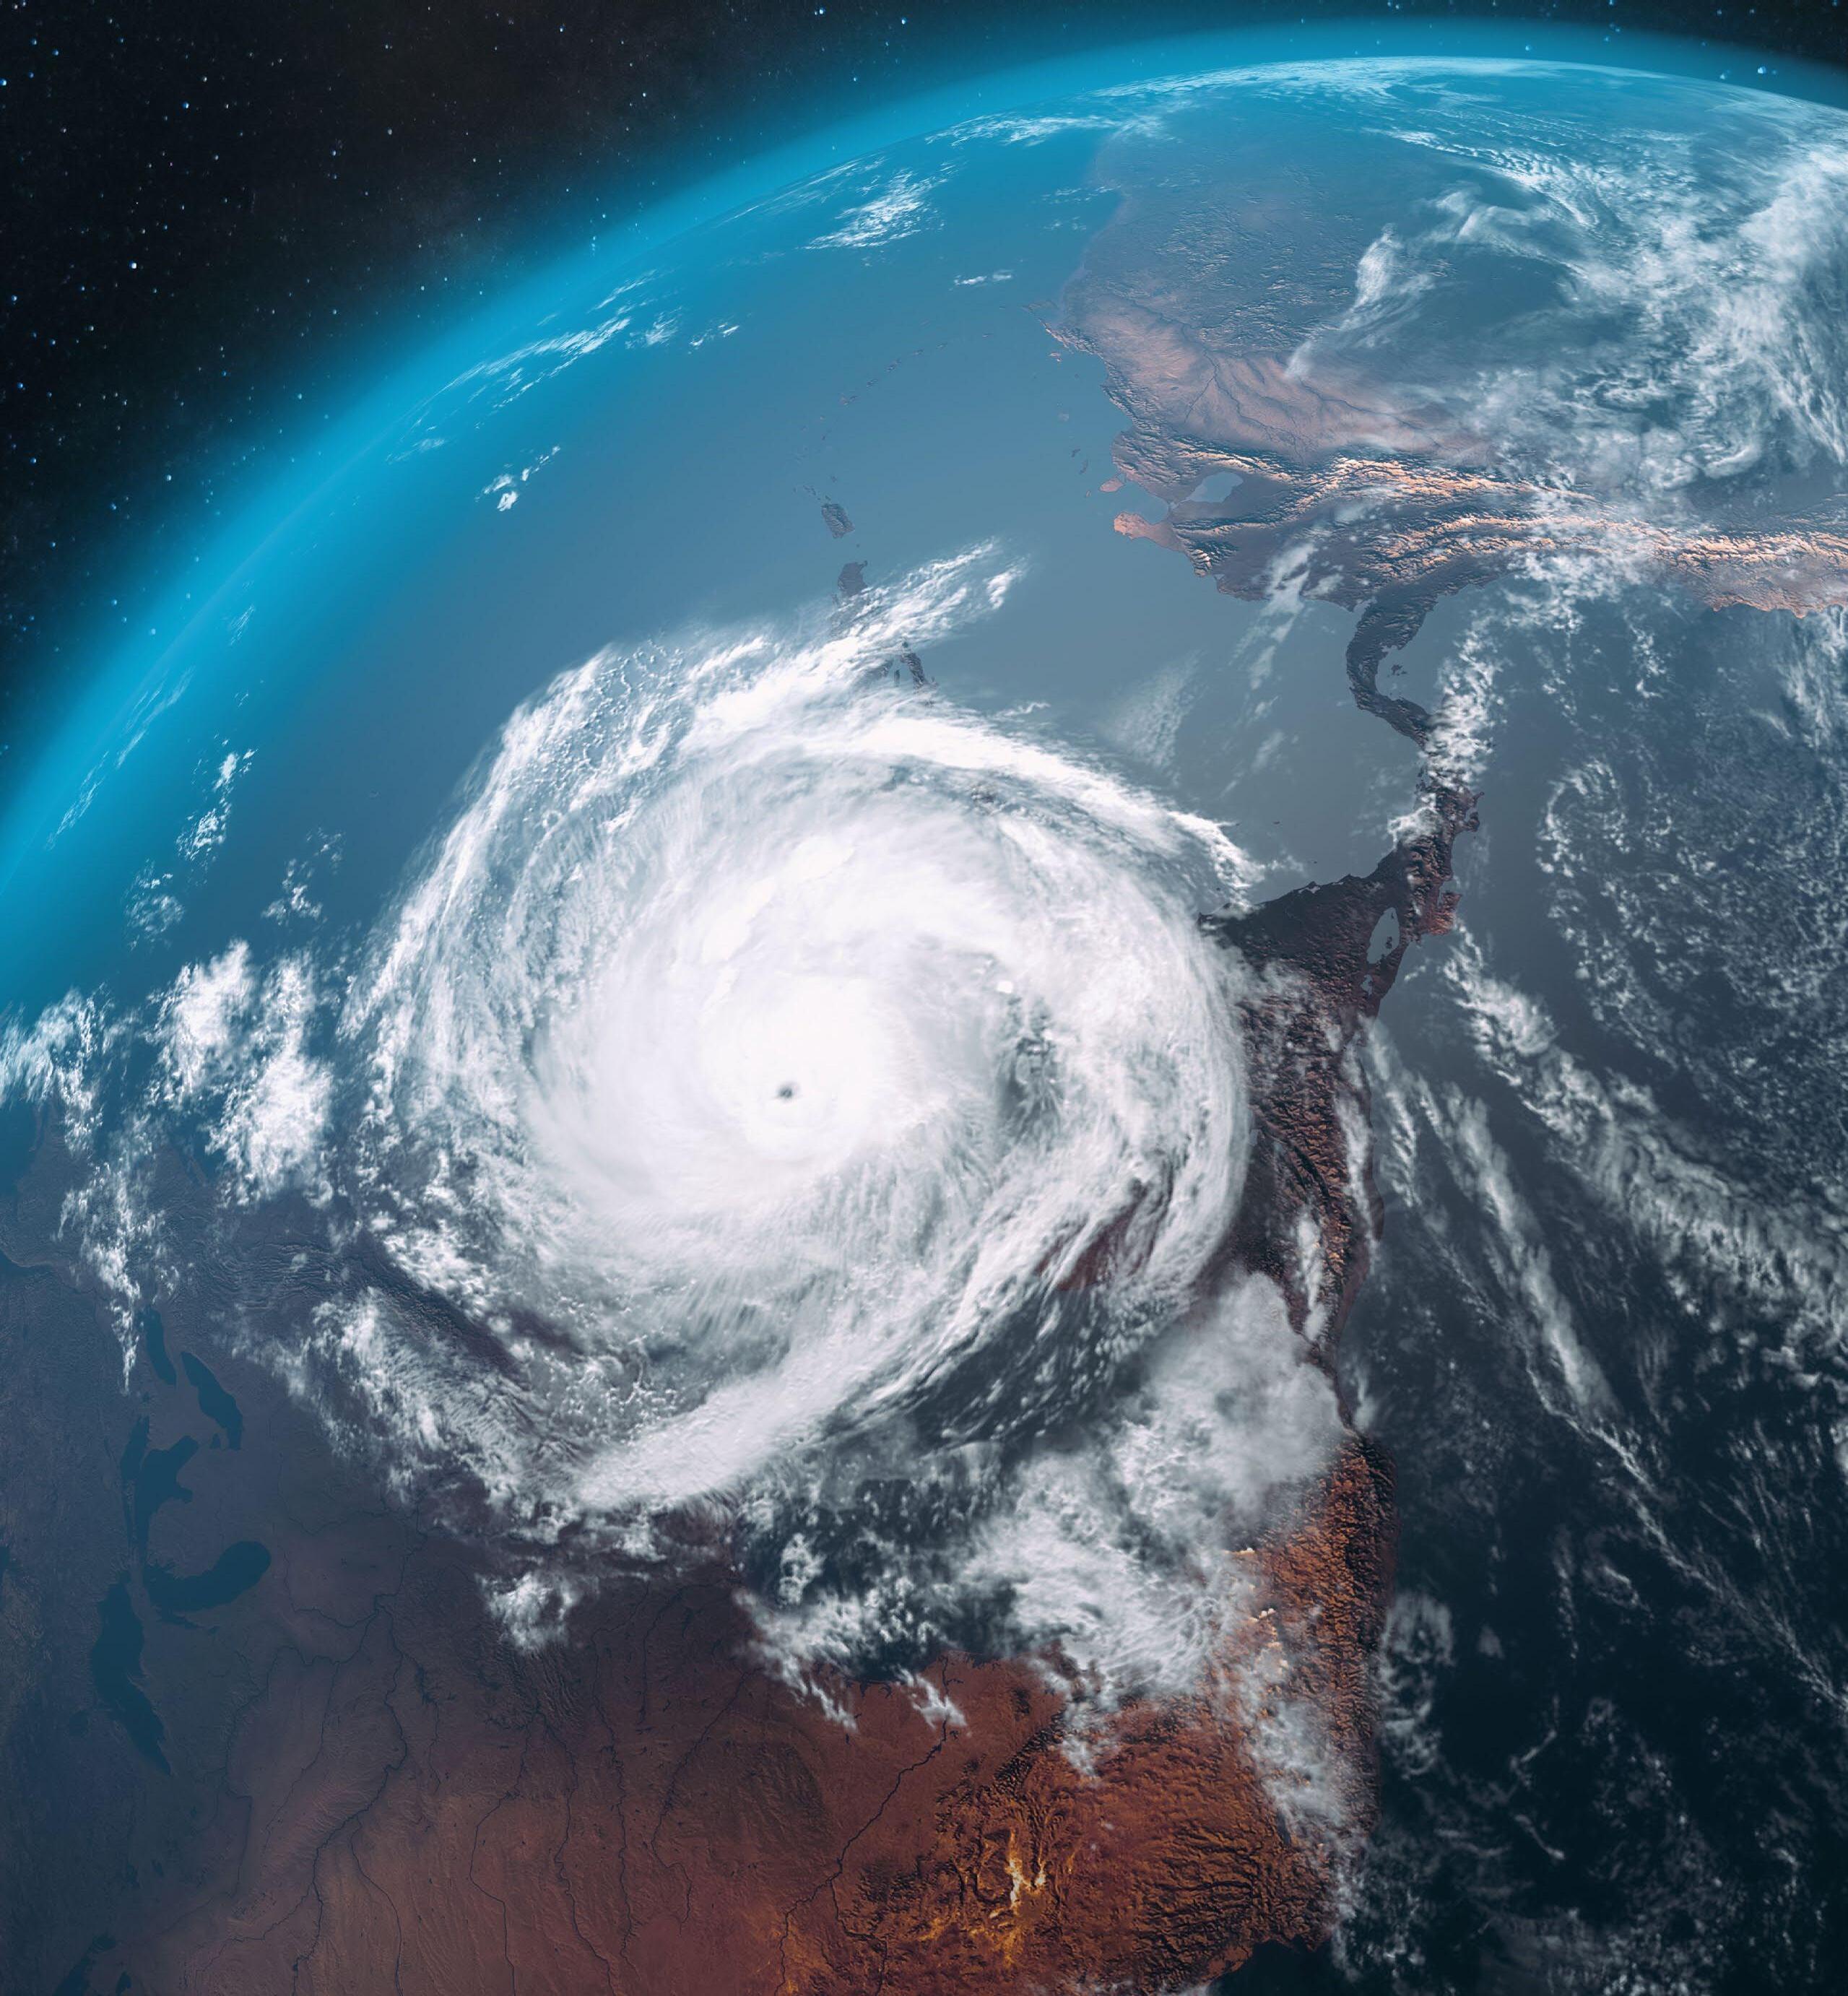
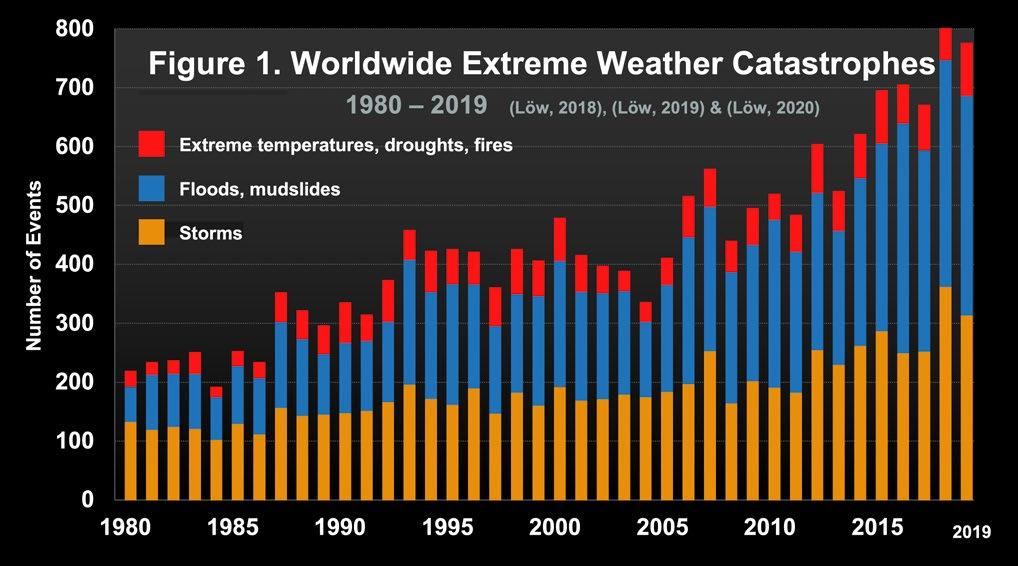
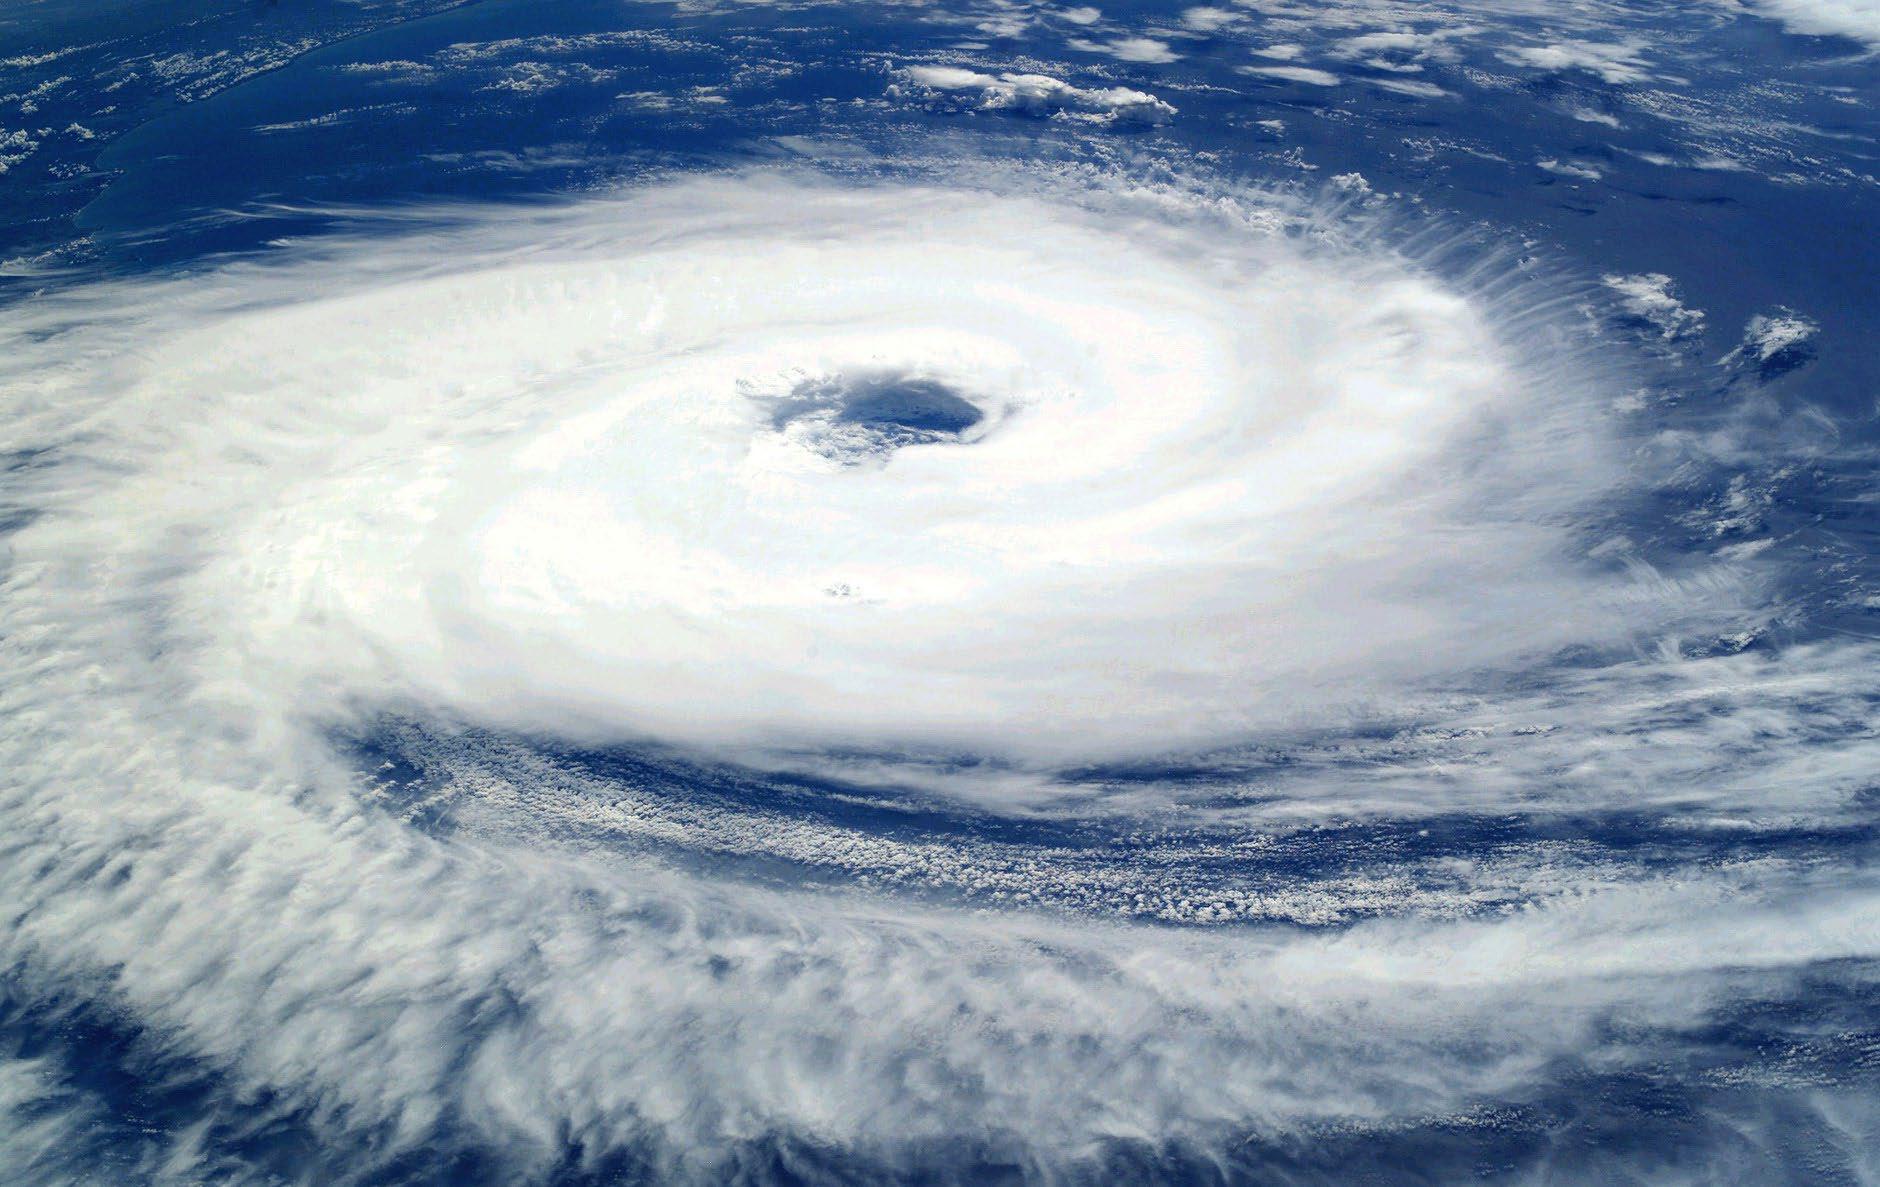
Disasters provoked by storms have duplicated, in the past 30 years, at the global level and those caused by floods have trebled (Löw, 2018, 2019, 2020). The expansion of this second disaster group has been higher because floods, in coastal cities, are not only produced by rainfall but also by the rise in sea level (National Oceanic and Atmospheric Administration, 2018) (Figure 1).
DISASTERS PROVOKED BY STORMS HAVE DUPLICATED, IN THE PAST 30 YEARS, AT THE GLOBAL LEVEL AND THOSE CAUSED BY FLOODS HAVE TREBLED (LÖW, 2018, 2019, 2020).
In fact, extreme rainfall has consequences in many aspects of human and natural systems. Specifically, observations have shown growing trends in severe rainfall, in North America, and models and theories strongly suggest sustained warming increases in the future. Similarly, if greenhouse gas emissions keep increasing, North America will gradually notice more of these extreme hydrometeorological events (Kirchmeier-Young and Zhang, 2020).
This occurs because, as the atmosphere warms up, the additional heat increases evaporation and escalates the hydrological cycle, intensifying the likelihood and fierceness of heavy rains. Additionally, the evaporated water amount retained by the air is impacted by its temperature (NASA, 2010).
Thus, for each Celsius degree of warming, the retention capacity of water vapor of air increases by ~7%. If there is more water vapor in the air, more water is available to precipitate as heavy rains (Center for Climate and Energy Solutions, no date).
Intense and severe precipitations are situations in which the quantity of rain or snow surpasses normal levels. It fluctuates based on location and season. The likelihood of these events increases based on climate change (United States Environmental Protection Agency, 2016). In the United States, heavy rainfall now occurs 30% more frequently than in 1948. (They happen every 9 months instead of every 12 months). Additionally, on average they are 10% more severe in the US (Environment America, Research & Policy Center, 2012). Forecasts show that such rainfall will become more frequent and severe as temperatures continue to rise (Witze, 2018).
Extreme events are frequently defined as one-in-100-year, one-in-1,000-year, and one-in-10,000-year rainfall events. Such terms might be confusing when many one-in-100-year events occur in a single year (United States Geological Survey, no
date). The reason for this is that such terms pertain to the likelihood that such events may happen in a specific year, founded on historical averages. This means that a one-in-100-year event has 1% likelihood of taking place each year (United States Geological Survey, no date).
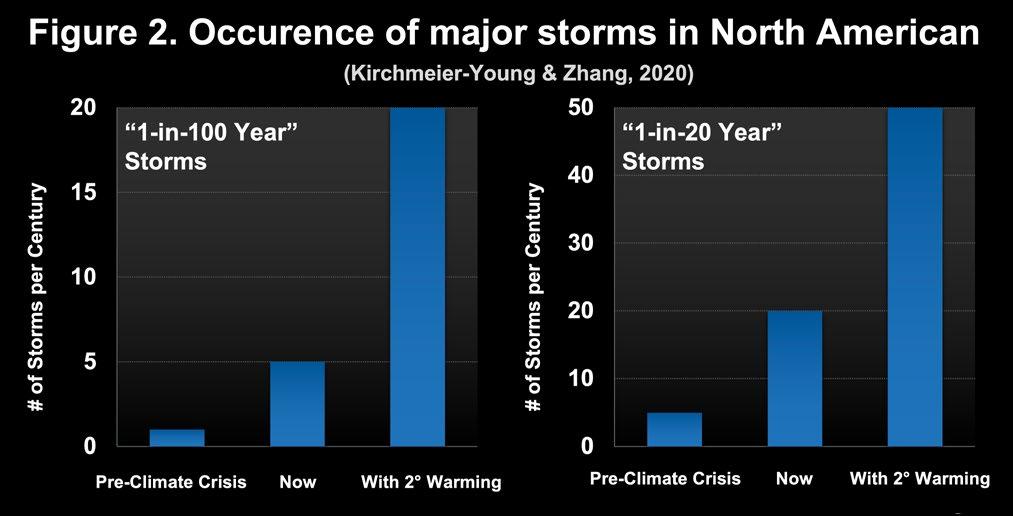
“At the regional level, in North America, the average severe rainfall is predicted to dramatically reduce in return periods” por “Regionally, in North America average extreme precipitation is projected to show dramatic reductions in return periods”. Indeed, one-in-20-year events have now been turned into one-in-5 year events. This is happening with a warming of ~+1°C (compared to the climate of the pre-industrial era). Meanwhile one-in-50 year events have been transformed into one-in-10 year events, and one-in-100 year events are now basically onein-20-year events (Kirchmeier-Young and Zhang, 2020).
Nevertheless, if we do not prevent the average temperature of the Earth from rising +2°C, a one-in-100-year event will become a one-in-5-year event, and one-in-2.5 year event with an increase of +3°C. Similarly, with an increase of +2°C, a onein-20 year event will be transformed into one-in-2-year event, and one-in-1.5 year event with +3°C of temperature increase (Kirchmeier-Young and Zhang, 2020) (Figure 2).
Furthermore, floods caused by high tide today principally impact lowland areas and exposed assets (property) or infrastructure, such as highways, ports, beaches, public areas rainfall, sewage and drinking water systems, as well as private and commercial property. Because of relative sea level rise (RSL), more cities are increasingly exposed and vulnerable to flooding caused by high tides. This is quickly increasing in frequency, depth, and extent in many coasts in the United States. Currently, flooding caused by high tides is likely to increasing disruptively and not actually damaging. Nevertheless, its effects are
INTENSE AND SEVERE PRECIPITATIONS ARE SITUATIONS IN WHICH THE QUANTITY OF RAIN OR SNOW SURPASSES NORMAL LEVELS. IT FLUCTUATES BASED ON LOCATION AND SEASON. THE LIKELIHOOD OF THESE EVENTS INCREASES BASED ON CLIMATE CHANGE (UNITED STATES ENVIRONMENTAL PROTECTION AGENCY, 2016).
cumulative and turning into a serious problem at several locations, including many that are of strategical importance to United States national security. We can mention Norfolk (VA), San Diego (CA), and Kwajalein Island located in the Marshall Islands (National Oceanic and Atmospheric Administration, 2018).
In the past decades, annual frequencies of floods caused by high tides have linearly increased in 31 places, mainly in the coasts of the US Atlantic and in the US section of the Gulf of Mexico, and to a lesser extent, along the Pacific coast in the US. Annual frequencies are escalating (with a non-linear increase) at 30 places, mainly along the Atlantic coasts. In relation to the latter case, on southern state coasts, the increase in days, per year, of flooding caused by high tides increased 150% in the 2000–2018 period (National Oceanic and Atmospheric Administration, United States Department of Commerce, 2018).
With the RSL behaving in a steady manner, flood frequencies caused by high tides will continuously increase, and it is expected that this will occur quickly, caused by tidal force that is currently still only infrequent. The Center for Oceanographic Operational Products and Services of the United States National Oceanic and Atmospheric Administration (NOAA) of the United States assessed domestically forecast future changes for a subset of scenarios related to global sea level rise, particularly the scenarios of low intermediate (a global rise of 0.5 m by 2100) and intermediate (1.0-m rise) situations. By 2050, in the scenarios of low intermediate and intermediate situations, the annual frequencies of flooding caused by high tides along the western Gulf (80 and 185 days/year, respectively) and the northeast Atlantic (45 and 130 days/year, respectively) are projected to be higher due to the fact that RSL
is projected to be increased; along the coasts of the southeast Atlantic (25 and 85 days/year), the eastern Gulf (25 and 80 days/ year, respectively), the southwest Pacific (15 and 35 days/year, respectively), the northwest Pacific (15 and 30 days/year, respectively), the Pacific (5 and 45 days/year, respectively), and Caribbean islands (0 and 5 days/year, respectively), flooding caused by high tides will happen less frequently, since RSL forecasts are lower or because weather conditions will be typically calmer; nevertheless, the increase in the frequency of annual floods will eventually rise at very elevated rates. Across all regions, by 2050, flooding caused by high tides will occur from 35% to 60% of the time merely from tidal forcing, for the scenarios of low intermediate and intermediate (National Oceanic and Atmospheric Administration, 2018).
By 2100, flooding caused by high tides will happen every other day (182 days/year) or at an increased frequency on the United States coast, in the scenario of low intermediate, in the Atlantic, the Gulf of Mexico, and the Pacific islands. Tidal forcing will cause 100% of flooding, except in the eastern Gulf (80%). In the intermediate scenario, however, high tide floods would become daily floods (365 days/year) and tidal forcing would cause 100% of flooding in almost every region (National Oceanic and Atmospheric Administration, 2018).
These results show how nearby US coastal cities are to a point of no return regarding flooding frequency. This means that a reinterpretation of adaptive engineering methods is needed, along with an intended level of protection dependent on flood types, both currently and in the future. In turn, this realization can allow for a more systematic implementation of public policies at the national level, both in North American countries and in other regions, to adapt to climate change.
References
- Center for Climate and Energy Solutions. (no date) Extreme Precipitation and Climate Change. Climate Basics . Retrieved from https://www.c2es.org/content/ extreme-precipitation-and-climate-change/ - Environment America. Research & Policy Center. (2012). When It Rains, It Pours. In E. America, (ed.). Global Warming and the Increase in Extreme Precipitation from 1948 to 2011. Retrieved from https://environmentamerica.org/sites/environment/files/reports/ When%20It%20Rains,%20It%20Pours%20vUS.pdf
- Kirchmeier-Young, MC and Zhang, X. (June 16, 2020). Human Influence has Intensified Extreme Precipitation in North America. In S. Solomon (ed.), Proceedings of the National Academy of Sciences of the United States of America, 17, 13308-13313. Recovered from https:// doi.org/10.1073/pnas.1921628117
- Löw, P. (January 4, 2018). Natural Disasters. Hurricanes Cause Record Losses in 2017. The Year in Figures. Munich Re. Retrieved from https://www.munichre.com/ topics-online/en/climate-change-and-natural-disasters/natural-disasters/2017-year-in-figures.html
- Löw, P. (Tuesday, January 8, 2019). Natural Disasters. The Natural Disasters of 2018 in Figures. Losses in 2018 Dominated by Wildfires and Tropical Storms. Munich Re . Retrieved from https://www.munichre.com/topics-online/en/climate-change-and-natural-disasters/ natural-disasters/the-natural-disasters-of-2018-in-figures.html
- Löw, P. (Thursday, January 9, 2020). Natural Disasters. Tropical Cyclones Cause Highest Losses. Natu -
ral Disasters of 2019 in Figures. Munich Re . Retrieved from https://www.munichre.com/topics-online/en/ climate-change-and-natural-disasters/natural-disasters/natural-disasters-of-2019-in-figures-tropical-cyclones-cause- highest-losses.html
- NASA. (October 1, 2010) The Water Cycle and Climate Change. Earth Observatory . Retrieved from https:// earthobservatory.nasa.gov/Features/Water/page3.php
- National Oceanic and Atmospheric Administration. (2018). Patterns and Projections of High Tide Flooding along the US Coastline Using a Common Impact Threshold. NOAA Technical Report NOS CO-OPS 086. Silver Spring, MD: US Department of Commerce. National Ocean Service. Center for Operational Oceanographic Products and Services.
- National Oceanic and Atmospheric Administration. (2018). Coastal communities saw record number of high tide flooding days last year. Home/News & Features. Retrieved from https://www.noaa.gov/news/coastal-communities-saw-record-number-of-high-tide-floodingdays-last-year
- United States Environmental Protection Agency. (2016). Climate Change Indicators: Heavy Precipitation. Retrieved from https://www.epa.gov/climate-indicators/ climate-change-indicators-heavy-precipitation
- United States Geological Survey. (no date) The 100-Year Flood. Water Science School. Retrieved from http://water. usgs.gov/edu/100yearflood.html
- Witze, A. (2018). Why Extreme Rains are Gaining Strength as the Climate Warms. Recovered from https:// www.nature.com/articles/d41586-018-07447-1
EL NIÑO AND ITS RAINFALL EFFECTS IN MEXICO
David Eduardo Guevara Polo
CEL NIÑO HAS BEEN ONE OF THE MOST EXAMINED METEOROLOGICAL PHENOMENA. NOWADAYS, IT IS KNOWN THAT THE OCEAN CURRENT KNOWN AS EL NIÑO COUPLES WITH THE SOUTHERN OSCILLATION, AN ATMOSPHERIC CURRENT.
amino N. Carrillo, naval captain and Vice President of the Geographical Society, informed his fellow societal members on an ocean current that was produced quite close to Chilean and Peruvian coasts. He said that sailors from Paita, a city in Peru, had identified such current, and that they had said that it became more visible and tangible after Christmas. Because of this, it was baptized by them as El Niño (Carrillo, 1892). In 1892, the Boletín de la Sociedad Geográfica of Lima published this news. It is the first recorded information of “El Niño” phenomenon. From then on, because of its impacts on global climate, El Niño has been one of the most examined meteorological phenomena. Nowadays, it is known that the ocean current known as El Niño couples with the Southern Oscillation, an atmospheric current. This associated system is “El Niño Southern Oscillation” and its acronym is ENSO.
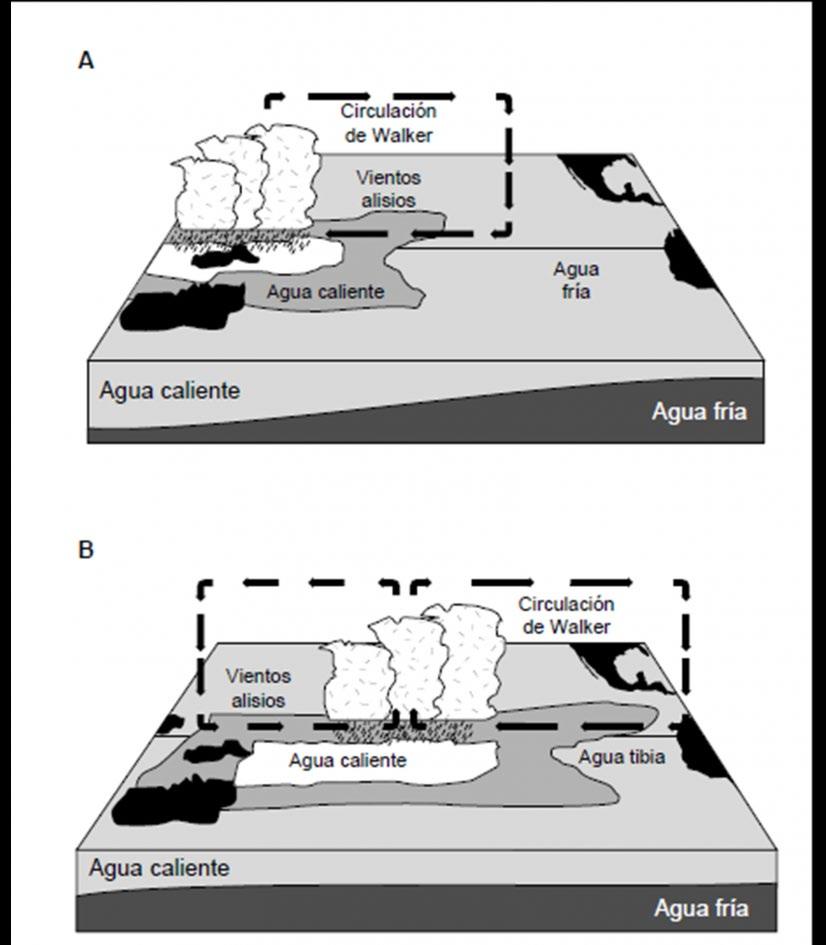
For a moment, lets imagine that the Pacific Ocean is a pool and that at one extreme there is the Peruvian coast and, at the opposing end, Australia’s East Coast. In normal conditions, part of the surface water close to Australia is warmer than the rest of the Pacific Ocean (it is similar to what would happen if someone had poured hot water into one section of the pool). The section of warm water is kept in place by trade winds. They blow off the coast of South America. Due to the fact that the hot water section is kept away from the South American coast, the upwelling of deep, cooler, nutrient-rich water starts moving close to that continent. Ultimately, hot water produces a higher amount of humidity in the atmosphere. As a result, rain is produced, at that point, and this triggers atmospheric circulation into a process called Walker’s circulation. This additionally scenario reinforces the trade winds. At this time, the pool is in equilibrium. Trade winds blow, deep water rises on the South American coast, warm water remains close to Australia, the rainfall falls, and Walker’s circulation reinforces the trade winds, repeating the cycle. This is shown in Figure 1a.
In an El Niño phenomenon, shown in Figure 1b, this balance is disturbed; trade winds weaken. This makes the hot water section spread and move closer to South America producing rain. An increase in the surface temperature of the Pacific Ocean is then observed. Based on this, El Niño is known as ENSO’s warm phase. Inversely, in a La Niña phenomenon, trade winds become stronger and force an even greater portion of warm water towards Australia’s East Coast. Meanwhile, surface temperatures of sections of the Pacific Ocean decrease. Based on this, La Niña is known as ENSO’s cold phase. Nevertheless, the strength of such phenomena can fluctuate, which depends on existing conditions. Consequently, intense, moderate, and mild El Niño/La Niña phenomena exist. The duration of El Niño is normally from 9 to 12 months, and La Niña phenomena might last from 1 to 3 years (Conagua, 2018). Depending on the region where they are analyzed, these phenomena fluctuate. However, as previously mentioned, ENSO has impacts on virtually the whole world due to what is known as “teleconnections.” They are statistical relationships among meteorological variables of spatially separated zones (IPCC, 2013).
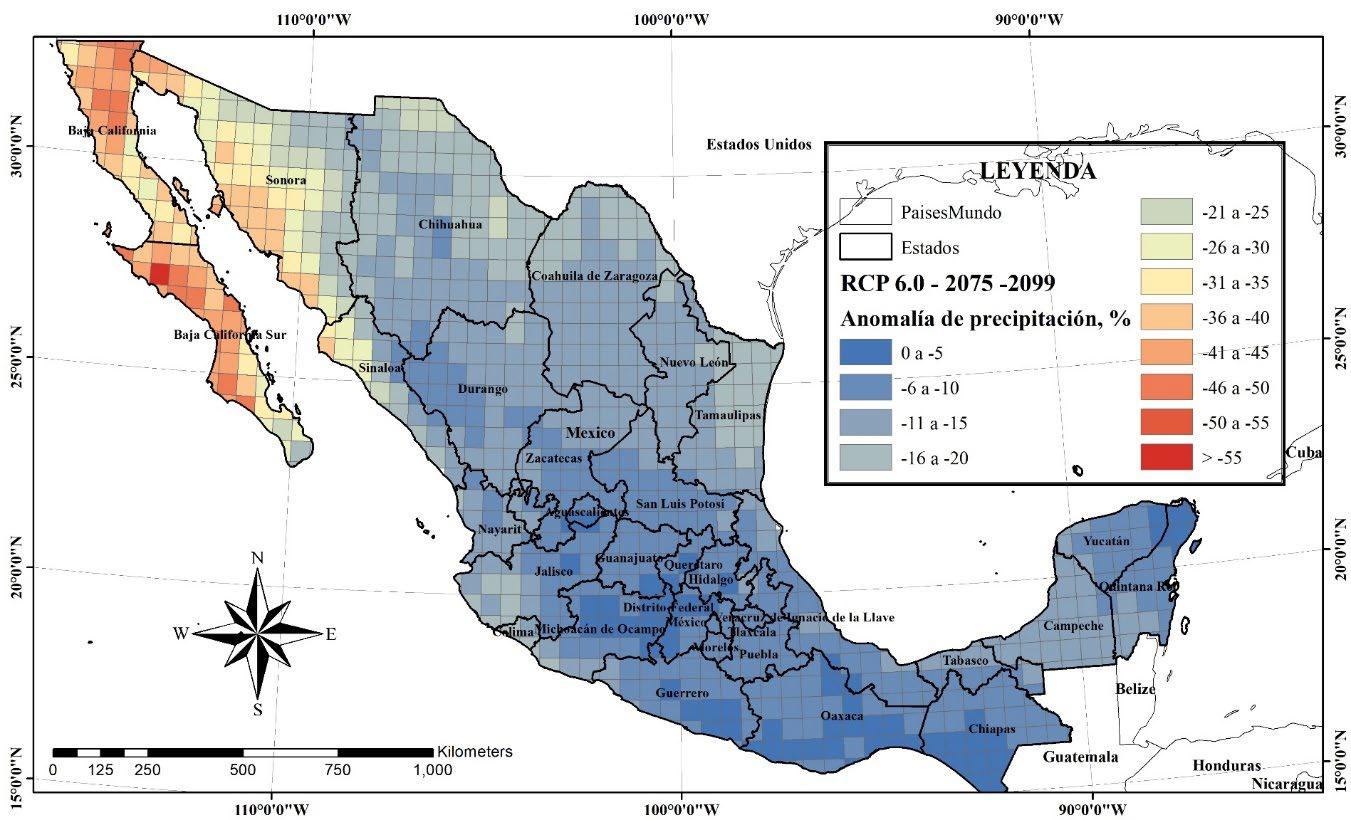
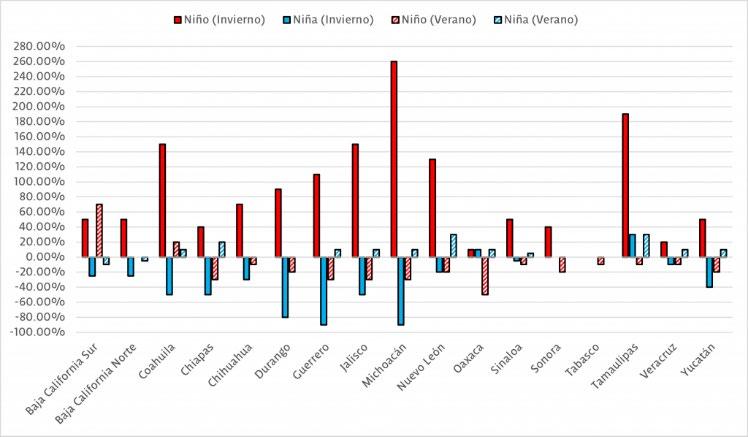
In Figure 2, the effects of El Niño and La Niña in the Mexico’s rainfall are shown, in the summer and winter. On the horizontal axis, some states of Mexico are listed and the vertical axis displays rainfall anomalies. The latter are deviations from average rainfall for a location. In this case, they correspond to a specific state. In this manner, if the average rainfall at a site is 400 mm (400 L/m2), a 50% positive anomaly would mean that the rainfall would correspond to 600 mm. If there were a 25% negative anomaly, the rainfall would be equal to 300 mm. Having said that, Figure 2 can be described. In general, it is shown that the effects of the greatest magnitude take place in winter and, specifically, in an El Niño phenomenon. In the summer, the
effects are less noticeable. However, it should be noted that, in contrast to winter, El Niño causes a rainfall decrease in most states. The opposite happens with a La Niña event. In the summer, there are rainfall increases and decreases in winter.
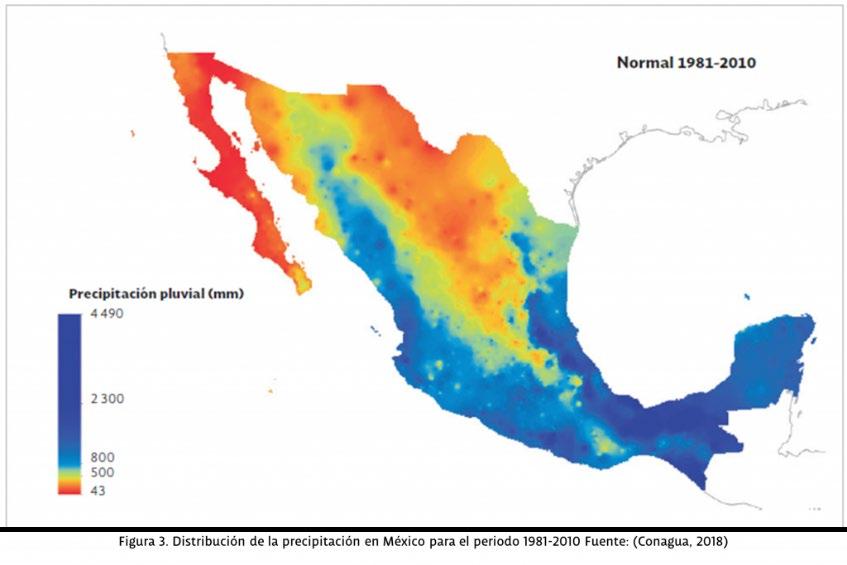
However, it is essential to remember that there are rainfall fluctuations in Mexico. These data are shown in Figure 3. As can be noticed, in the Northern and Northwestern regions of Mexico, the precipitation is much lower compared to the coasts of the Pacific Ocean, the Gulf of Mexico, and the Caribbean Sea. Additionally, it is essential to note that, in Mexico, 68% of rainfall corresponds from June to September, which are summer months (Conagua, 2018). This is meaningful because if this is connected to what was previously mentioned on rainfall anomalies, an improved understanding of ENSO effects in this coun-
Figure 2. Effects of ENSO on precipitation in states of Mexico Source: Own elaboration with data from Magaña-Rueda, Pérez and Conde, 1998.
Figure 1. Illustration of the ENSO phenomenon. Source: Magaña-Rueda, Pérez and Conde, 1998.
try will be obtained. To that effect, it is worthwhile to notice the extreme consequences in Mexico.
In Baja California, for example, the average annual rainfall is ~43 mm. During La Niña, the precipitation rainfall can reach −50% in winter, as observed. This means that if normally very little rain falls in this state (equal to two water jars per square meter of surface area), during a La Niña event, half of the precipitation takes place. In Baja California Sur, Coahuila, and Chihuahua, comparable effects are noticed and rainfall is low. During El Niño events, in contrast, in Michoacán or Jalisco in winter, rainfall increases by 260% in Michoacán and by 150% in Jalisco. This means that there will be a greater amount of rainfall in those states, along with the relatively abundant rainfall that already occurs. In the Tehuantepec Isthmus region, there are states with the highest rainfall of Mexico. It is noticed that, with regards to rainfall anomalies, in Veracruz and Tabasco, the effects are not so substantial when they are compared to the effects in Chiapas. To conclude, a generalization of the effects of El Niño in Mexico is feasible. It can be said that, in winter, El Niño will produce higher rainfall, while La Niña will cause lower rainfall, and in summer, El Niño will produce lower rainfall. Nevertheless, it is essential to emphasize that strictly due to spatiotemporal rainfall fluctuations, and to be more accurate, it is necessary to determine local effects.
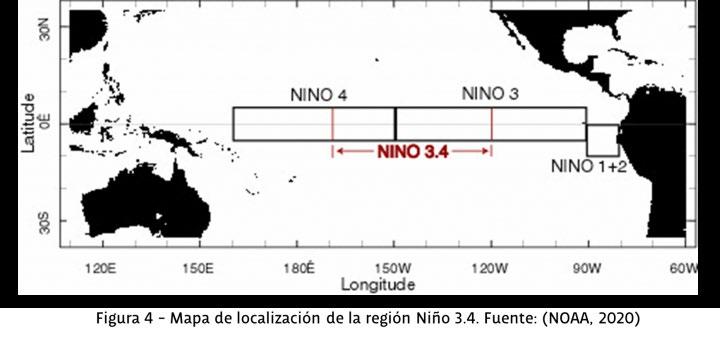
However, how is El Niño measured? This is an interesting question. The National Oceanic and Atmospheric Administration compiles information from a buoy network installed in the Pacific Ocean (visit https://www.ndbc.noaa.gov/ to obtain these data). Basically, measured data are the following: ocean temperature, air temperature, humidity, and wind speed (National Geographic, 2015). However, the data that interest us to analyze the El Niño phenomenon based on the Oceanic El Niño Index (ONI) are ocean temperature anomalies. They are ob -
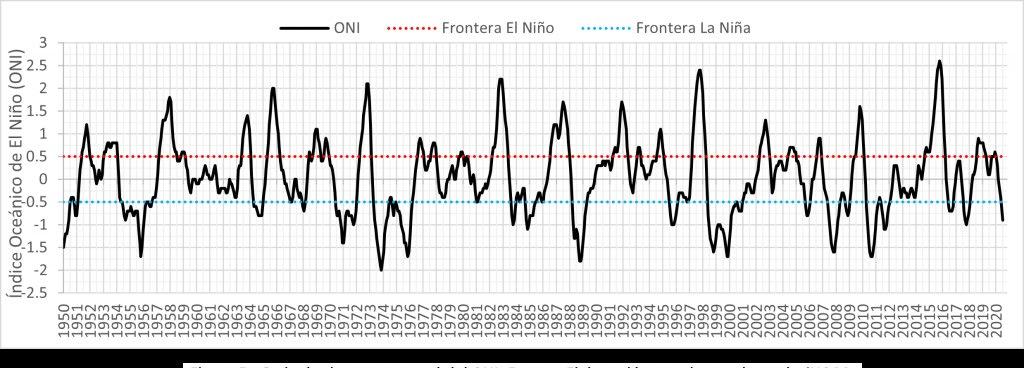
tained in the region called Niño 3.4, and they are located from longitudes −170 to −120 and at latitude 0 (the equator) (NOAA, 2020). This is shown in Figure 4. If the average temperature anomaly for three months is greater than or equal to 0.5°C, in such regions, an El Niño event has occurred. And likewise, if, for the same period, the temperature anomaly is less than or equal to −0.5°C, a La Niña event has occurred (NOAA, 2020). In Figure 5, the behavior of ONI is shown for the past 70 years. If the anomaly is greater, this means that the phenomenon was more intense. In 1966, 1972, 1982–1983, 1997–1998, and 2015–2016, the most severe El Niño events were recorded. Meanwhile, in 1956, 1974, 1988–1989, 1999–2000, 2008, and 2010–2011, the most intense events of La Niña were recorded. Actually, in 2010–2011, in the Northern and central Mexican states, the worst drought was recorded since 1950 (Domínguez, 2016). This is not the only event of this type. There is plenty of evidence that might suggest a relationship between an ENSO phenomenon and droughts. This is a very active area of research. As shown in Figure 5, currently, we are experiencing a mild intensity of La Niña phenomenon. Information on ENSO statuses can be accessed at https://smn.conagua.gob. mx/es/climatologia/diagnostico-climatico/estatus-del-nino.
Lastly, it has been suggested that due to increases in greenhouse gas emissions and subsequent climate change, general features of climatic fluctuations and, specifically, of El Niño phenomena could be modified (Hu, Teng, Zhang and Zhu, 2018). Although some progress has been made regarding the understanding of these modifications, there is no certainty about what could happen. Therefore, to the erratic behavior shown in Figure 5, we must also add the erratic effects of climate change. We must be quite vigilant to these effects, since they might have an important effect on rainfall in this country. We must not forget that the water in rivers, lakes, and aquifers in our country derives basically from such a source.
References
- Carrillo, CN (1892). Dissertation on Ocean Currents and Studies of the Peruvian or Humboldt Current. Bulletin of the Geographic Society of Lima (II). Retrieved from https:// www.biodiversitylibrary.org/item/183558#page/80/ mode/1up
- Conagua. (2018). Statistics on Water in Mexico, edition of 2018. National Water Commission.
- Domínguez, J. (2016). Historical Review of Droughts in Mexico: from Divine Explanation to the Incorporation of Science. Water Technology and Sciences 77-93.
- Hu, B., Teng, Y., Zhang, Y., and Zhu, C. (2018). Review: The Projected Hydrologic Cycle under the Scenario of 936 ppm of CO2 in 2100. Hydrogeology Journal - IPCC. (2013). Annex III: Glossary. In T. F. Stocker, D. Qin, G. -K. Plattner, M. Tignor, S. K. Allen, J. Boschung, . ..M Midgley (eds.), Climate Change 2013: The Physical Science Basis Contribution of Working Group I to the Fifth As -
sessment Report of the Intergovernmental Panel on Climate Change. Cambridge and New York: Cambridge University Press.
- Magaña-Rueda, V., Pérez, J. and Conde, C. (July-September 1998). The El Niño Phenomenon and the Southern Oscillation. Its impacts in Mexico. Sciences (51), 14-18.
- National Geographic. (2015). El Niño. National Geographic Society. Retrieved on November 18, 2020, from https://www.nationalgeographic.org/encyclopedia/ el-nino/
- NOAA. (2020). Climate Prediction Center-ONI. Retrieved on November 18, 2020, from https://origin.cpc.ncep.noaa. gov/products/analysis_monitoring/ensostuff/ONI_v5.php - NOAA. (2020). El Niño Southern Oscillation (ENSO) Technical Discussion. Retrieved on November 18, 2020, from https://www.ncdc.noaa.gov/teleconnections/enso/enso-tech.php
Figure 3. Distribution of the presipitation in Mexico for the period 1981-2010. Funte: Conagua, 2018.
Figure 4. Location map of the Niño region 3.4. Funte: NOAA, 2020.
Figure 5. ONI monthly time series. Source: Own elaboration with data from NOAA, 2020.
doctorados
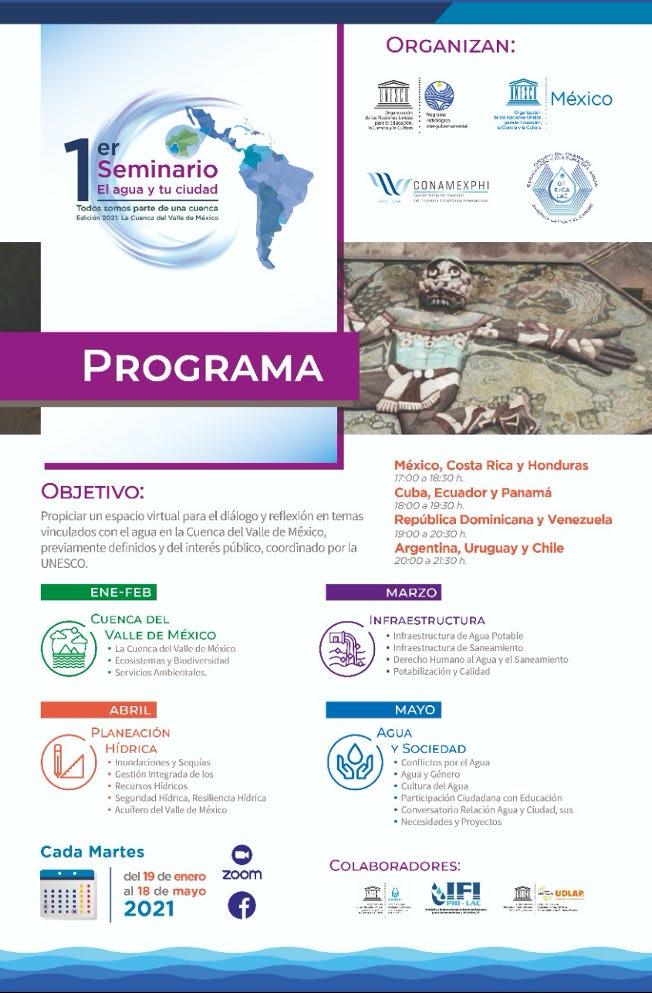
Coming Event: «WATER IN YOUR CITY» SEMINAR
he International Hydrological Program and other members of the UNESCO Water Family in Latin America and the Caribbean named the first seminar “Water in Your City,” which will be held from January 19 to May 18, 2021, in several sessions. Water and society, infrastructure, the Valley of Mexico basin, and water planning are the general topics to be discussed. The UNESCO Chair in Hydrometeorological Risks contributed to this seminar. It will be broadcasted via Facebook and Zoom.
La U n i v e rs id ad d e l as A m é ri cas P ue b l a co nv oc a
A los egresados de Instituciones de educación superior nacionales y extranjeras interesados en ingresar, en agosto 2021, en los siguientes programas académicos pertenecientes al Programa Nacional de Posgrados de Calidad:
Doctorado en Ciencia de Alimentos
Doctorado en Ciencias del Agua
Doctorado en Creación y Teorías de la Cultura
Doctorado en Sistemas Inteligentes
Doctorado en Biomedicina Molecular
requisitos generales:
*Además de los que cada programa solicite
A presentar junto con la Solicitud de Admisión al proceso de selección, en copias simples: 1
Certificado oficial de estudios o documento oficial en el que se dé constancia de haber obtenido un promedio mínimo de 8.5 en la licenciatura.
Copia simple de Título y Cédula Profesional de Licenciatura (En caso de no contar con estos documentos, tendrá que acercarse al área de Servicios Escolares para revisar la situación académica y poder continuar con el proceso).
Currículo en extenso, con fotografía reciente.
Carta de intención, en la que se argumenten las razones por las que ha elegido la institución, el programa de doctorado y el área de estudios.
Tres cartas de recomendación emitidas por profesores o autoridades vinculadas con el desempeño académico y/o profesional del aspirante, escritas en hojas membretadas y entregadas en sobre sellado. (máximo un año de antigüedad).
Comprobante de resultados del examen GRE https://www.ets.org/gre/ con puntaje mínimo de 150 en razonamiento verbal, 130 en razonamiento cuantitativo y 3.5 en redacción analítica. (La vigencia del comprobante no debe ser mayor a 5 años).
Comprobante del examen TOEFL Institucional (puntaje mínimo 550). Para dudas consultar al correo o al teléfono abajo indicado). Comprobante del examen DELE para estudiantes cuya lengua materna no sea el español con nivel mínimo de B2. https://examenes.cervantes.es/es La vigencia de los comprobantes no debe ser mayor a 2 años.
Los interesados que hagan su solicitud por vía remota, deberán enviar en un solo correo la documentación completa en formato digital (PDF). Todos los interesados que hayan aprobado las evaluaciones deberán realizar los trámites de ingreso y los trámites relativos a su beca requeridos por la Universidad ante las instancias correspondientes. Una vez que los interesados hayan completado satisfactoriamente todos los trámites, su status será de admitido al Doctorado correspondiente y deberán dedicar tiempo completo a sus estudios y actividades de investigación previstas en su plan de estudios.
requisitos adicionales
Los siguientes requisitos son necesarios para aquellos interesados en ingresar al Doctorado en Creación y Teorías de la Cultura:
1 Certificado oficial de estudios de maestría o su equivalente con un promedio mínimo de 8.5 y constancia de título de grado que muestre el promedio.
2. Copia simple de Título y Cédula profesional de Maestría (En caso de no contar con estos documentos, tendrá que acercarse al área de Servic os Escolares para revisar la situación académ ca y poder cont nuar con el proceso)
3. Tesis de maestría o en su defecto un trabajo extenso escrito (35 págs).
4. Presentación del protocolo del proyecto de Investigación a desarrollar durante el doctorado.
procedimiento (consta de 3 etapas)
Etapa Inicial
Presentar su Solicitud de Admisión y documentación mencionada en Requisitos
Generales y Requisitos Adicionales, de acuerdo al doctorado de interés, en la:
Dirección de Investigación y Posgrado
Oficina NE 201
Universidad de las Américas Puebla
Ex Hacienda Santa Catarina Mártir
Cholula Puebla · C.P. 72810
El formato de Solicitud de Admisión se puede obtener en esta liga o también se puede solicitar directamente al correo electrónico antes señalado.
1. Una vez analizada la solicitud y los documentos que la acompañan, la Dirección de Investigación y Posgrado procederá a informar al Coordinador del Doctorado correspondiente, quien agendará una cita directamente con el solicitante.
Etapa Académica
1. El solicitante acudirá el día y la hora fijada con el Coordinador del Doctorado, quien le informará las líneas de investigación y tutores disponibles, así como el procedimiento a seguir.
2. Al finalizar la etapa académica los aprobados, serán notificados por la Dirección de Investigación y Posgrado para continuar con la etapa administrativa.
Etapa Administrativa
1. Los candidatos presentarán ante la Dirección Escolar la documentación complementaria que esta área les indique.
2. Una vez que esta Dirección apruebe toda la documentación, el candidato cambiará su status a admitido y será notificado por Dirección Escolar.
becas
Todos los candidatos admitidos contarán con una Beca Académica UDLAP Investigación que cubre la co egiatura y manutención mensual durante todo el programa, esta ú tima en caso de no contar con otra beca que la cubra No existe la posibilidad de ingresar o permanecer en el doctorado sin contar con a Beca Académica UDLAP Invest gación En el caso de estudiantes extranjeros que hayan sido aceptados a alguno de los doctorados, deberán contar con visa de estudiante tramitada en su país de origen En el caso de los so ic tantes a Becas de Excelencia del Gobierno de Méx co para Extranjeros, estos deberán apegarse a los ineamientos de la convocatoria vigente de la Secretaría de Relac ones Exteriores, así como a los t empos y formas del proceso de admisión descrito en la presente convocatoria
fechas
Inicio de clases
Fecha indicada en el Calendario Escolar Semestral UDLAP
BOLETÍN DE LA CÁTEDRA UNESCO EN RIESGOS HIDROMETEOROLÓGICOS
NEWSLETTER OF THE UNESCO CHAIR ON HYDROMETEOROLOGICAL RISKS
EDITORIAL COORDINATIONS
Editor Polioptro F. Martínez Austria
Style correction
Aldo Chiquini Zamora Andrea Garza Carbajal
Editorial design
Andrea Monserrat Flores Santaella
United Nations Educational, Scientific and Cultural Organization
UNESCO Chair on Hydrometeorological Risks, Universidad de las Américas Puebla
The unesco Chair on Hydrometerological Risks Newsletter is a quarterly publication which reports on the activities of the Chair and its members, unesco news related to it, as well as general information on disasters and hydrometeorological risks. It is elaborated by the Universidad de las Américas Puebla. Ex hacienda Sta. Catarina Martir s/n. C. P. 72810, San Andres Cholula, Mexico.
The authors are responsible for the choice and presentation of the opinions contained in this newsletter. Likewise, of the opinions expressed therein, which are not necessarily those of UNESCO and do not commit the Organization.