Urban IQ Economic and Residential Market Update

• GDP grew 0.33% in Q3, with annual growth of 1.11%.
• Household spending stagnated with essential spending falling 0.1%, discretionary spending rising slightly.
• Fragile consumer confidence is weighed down by concerns around inflation, unemployment, and falling house prices.
• First cash rate reduction since November 2020
Australia's economy saw mixed performance in Q3 2024. With a quarterly GDP rise of 0.33%, the annual increase over the year to September 2024 reached 1.11%. While positive, this is one of the smallest annual GDP gains in over three decades (excluding the pandemic) and underscores the nation’s ongoing economic challenges. Notably, GDP per capita declined for the sixth consecutive quarter, a trend exacerbated by strong population growth.
Household consumption remained flat this quarter. Essential spending fell slightly by 0.1%, driven by a notable reduction in electricity, gas, and other fuels. Meanwhile, discretionary spending edged up, bolstered by higher education related costs.
While Inflationary pressures remain, they are easing as indicated by the latest figures showing just a 0.22% increase in Q4 2024. This gain was in line with the previous quarter and came in under expectation to result in an annual inflation rate of 2.42% - the lowest since 2021. More importantly, it sits within the mid point the RBA was striving for. As a result, after 13 cash rate rises, the RBA cut the cash rate by 25 basis point for the first time since November 2020 to 4.10%
This easing in inflationary pressures coupled with an improvement in real income has allowed households to begin to rebuild their depleted savings.
Despite these improvements, consumer confidence remains fragile. Concerns around inflation, unemployment, falling house prices continue to weigh heavily on sentiment.
This hesitancy is not only curbing dwelling investment but also impeding broader business confidence, which remains slow to recover.
This edition offers valuable insights into the current state of the economy, and we hope it provides clarity and confidence as you navigate your development goals. For more information, please visit RPM Group, UDIA Victoria’s Platinum Partner via contactus@rpmgrp.com.au


Annual GDP growth was subdued at 1.11% in the year to September 2024, well below the 3.31% long term average. Q3 2024 GDP rose just 0.8% year-on-year, the slowest growth since the early 1990s (outside the pandemic). Public sector spending drove Q3 growth, supported by expanded energy relief schemes.
Household gross disposable income improved with a 1.3% rise in employee compensation and 3.6% increase in interest received, though a 3.4% rise in interest paid on dwellings offset gains. Restrictive financial conditions and past income declines weighed on consumption, while persistent inflation kept consumer and business sentiment cautious.
GDP Growth 12 months to September 2024 0.33%
Source: Australian Bureau of Statistics
While half of the lon-term average, household savings have increased to its highest level since Q4 2022, driven by wage growth and stage 3 tax cuts.
Source: Australian Bureau of Statistics
Household consumption was unchanged from the previous quarter. Essential spending fell 0.1% driven by a notable drop in electricity, gas, and fuel costs due to milder winter conditions and energy bill relief schemes. In contrast, discretionary spending rose slightly, led by higher education-related costs.


Source: Australian Bureau of Statistics
By mid-2024, a rate cut was expected in Q4. This was later delayed to February 2025, but by early January, sentiment had shifted again, pointing to a post-Easter cut in May. Then, in early February, softer-than-expected CPI data revived expectations of a February cut. The RBA cut interest rates by 25 basis points 18 February.
The focus now shifts to the pace of cuts through 2025 and 2026. The RBA is likely to approach any easing with extreme caution to avoid triggering inflationary pressures, a concern highlighted by similar trends in other global economies.
The key debate now centres on the pace of reductions through 2025 and 2026. The RBA is likely to approach any easing with extreme caution to avoid triggering inflationary pressures, a concern highlighted by similar trends in other global economies.
Inflation showed modest growth in Q4 2024, with the CPI increasing just 0.22% for the quarter. This brought the annual inflation rate back to 2.42% - the lowest since March 2021 and most importantly within the RBA 2-3% band.
Housing continues to be a significant driver of inflationary pressures. Supply-side constraints on residential construction, coupled with record population growth fuelling demand, are driving up both building costs and rents. These factors continue to push housing-related costs higher, adding to overall inflationary pressures.
Source: Australian Bureau of Statistics
The number of employed persons fell by 1,816 in January 2025, with part-time jobs contributing 6.593 jobs. However, this gain was offset by a loss of 8,409 full-time jobs.
Throughout the second half of 2024, the state’s unemployment rate generally hovered between 4.2% and 4.6%, before peaking at 4.7% in January 2025 - the highest since November 2021. Looking ahead, we anticipate the unemployment rate to edge higher, driven by a lagging economy and continued strong population growth
Source: Australian Bureau of Statistics
The hourly rate of pay index rose by 0.79% over Q3, significantly outpacing the 0.22% CPI growth. This shift marks a reversal of previous declines, with a notable improvement in real incomes. As a result, the annual growth in the Wage Price Index reached 3.53%, surpassing the 2.81% annual CPI.
Source: Australian Bureau of Statistics
Sentiment largely improved over 2024 but started 2025 on a cautious note, reflecting renewed economic concerns. November peaked at 94.6 index points, the highest since April 2022, but December saw a fall of 1.8 points, followed by a further 0.7 point reduction in January to start the year of at 92.1, signaling fragile confidence.
The downturn stemmed from disappointing Q3 GDP results, inflationary uncertainty, interest rate speculation, and global instability. Housing market confidence also weakened, particularly in Victoria and New South Wales, where expectations for price growth dropped sharply.
The most significant decline was in the economic outlook. Expectations for the economy over the year and five years fell by 9.6% and 7.9% respectively, reversing earlier gains. Persistent concerns about GDP, inflation, and mixed views on potential interest rate cuts contributed to the pullback, highlighting challenges ahead for sustained consumer confidence.
Consumer Sentiment Index (Index-100)
Source: Westpac-Melbourne Institute Consumer Sentiment Index
After an unexpected rise in December - breaking three consecutive declines in the sentiment index - 2025 began with a mild 0.1-point drop.
All three subcomponents of business conditions are now at or below average levels. The survey indicates ongoing soft growth in Q4, although capacity utilisation remains above average. This suggests price pressures may take longer to full normalise.
Source: National Australia Bank Business Survey
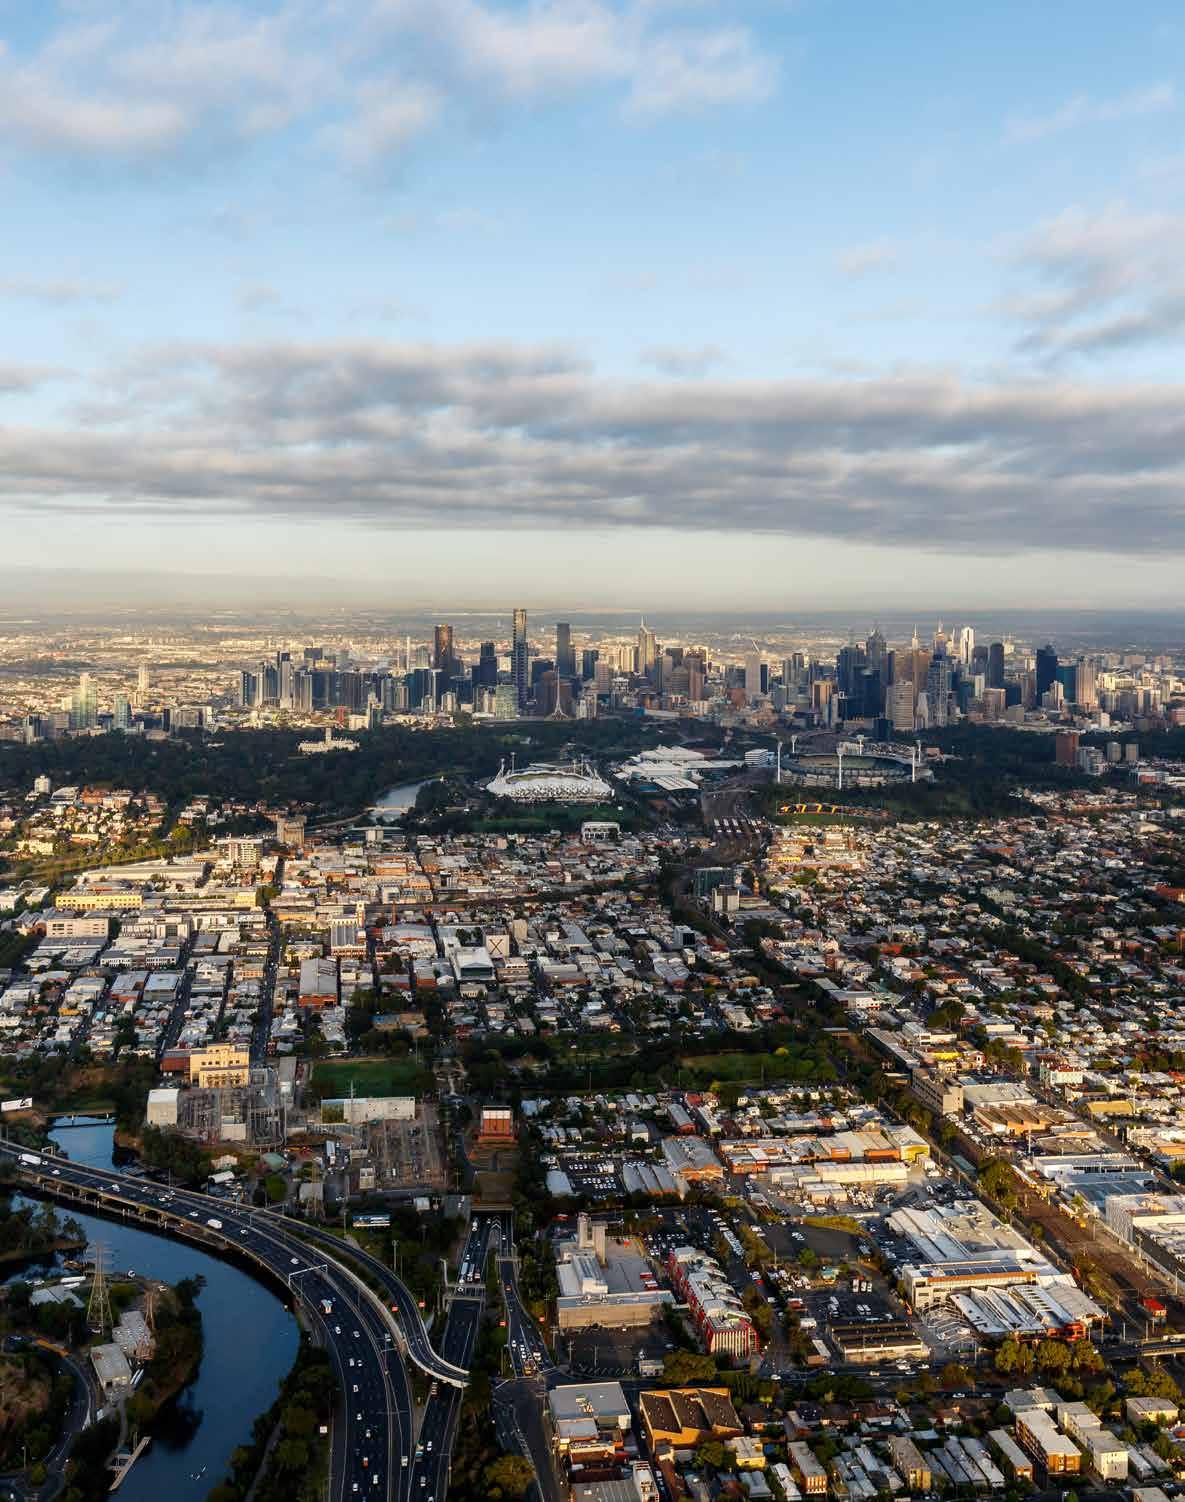
Victoria’s population growth slowed significantly in Q3 2024, following a sharp spike in Q1 driven by robust gains across all components. Despite the slowdown, overseas migration remains the key driver of continued population growth in the state.
Components
Source: Australian Bureau of Statistics
Projections
Natural increase picked up significantly in Q1 2024 to a record high, so the Q2 2024 retracement is unsurprising. Over FY24, natural increase totalled 31,588 persons, 13% higher than FY23.
Net overseas migration slowed significantly in Q2 2024 and is back to Q4 2021 levels, the first quarter after the borders reopened. This most recent outcome is driven by the Federal Government’s migration and student visa policy adjustments. Over FY24, overseas migration increased by 132,859 persons, 17% lower than FY23.
Net interstate migration continues to remain negligible with a net 24 people leaving Victoria in Q2 2024, reflecting a stemming in losses witnessed during lockdowns. However, this remains well below the 2,900 persons who moved into Victoria each quarter pre-lockdown.
Source: Australian Bureau of Statistics
Melbourne’s residential property market hit a peak of $1.125 million in Q4 2021, following a 36% increase over two years. At the same time, many anticipated a cooling period, expecting prices to stablise.
However, this optimism was short lived. Rising interest rates aimed at curbing inflation pushed the cash rate to peak at 4.35%, leading to a 19.1% decline in residential prices over the next two years ending in Q4 2023.
Despite the high cash rate, signs of stability emerged as 2024 began. Confidence grew that rate had peaked, while strong immigration into Victoria supported demand. This led to a modest price rise of 1.6% in early 2024. Yet, persistent cost of living pressures and lingering inflation concerns kept many buyers on the sidelines.
As consumer sentiment waned, prices dropped throughout the rest of 2024, hitting $894,5000 in Q4 – levels not seen since Q3 2020. Detached houses and apartments both saw declines:
• Median house price sits at $894,500 (-2.1% quarterly change, -1.8% year-on-year)
• Median unit price sits at $622,500 (-0.6% quarterly change, -1.6% year-on-year)
New home demand also weakened, impacted by rising construction costs, driven by higher labour costs. Developers, cautious of oversupply, limited land releases, further constraining the market.
Incentives like the 5-10% rebates on neartitled and titled lots remain common to stimulate demand. Yet, the Q4 2024 median lot price rose 2.4% to $401,000 – a record high. This figure does not reflect rebates or discounts, making land increasingly less attractive to established properties.
House Price
Unit Price
Source: REIV and RPM Research, Data and Insights
Owner occupier loan applications fell 5.5% over the quarter to 26,316 but rose 8% year on year. Loans for new dwellings dropped 3.8% and established dwellings fell 2.9% from the previous quarter.
Financing for new construction and residential land saw sharper declines of 12.3% and 25.1%. This disproportionately affected first home buyers whole loans fell 5.4% quarterly but rose 10.5% annually, maintaining a 36% share of loans. Non first home buyer activity also declined 5% as easing property prices deterred upgraders and downsizers.
The average loan size for first home buyers reached a record $518,907 in Q3 2024, up 1.2%. This growth reflects strong demand in the sub-$600.000 segment, driven by full stamp duty concession offering a key incentive.
Non first home buyers also saw loan sizes rise by 2.9% to $620,530, just 0.8% below the Q1 2022 peak, despite higher borrowing costs. Buyers are adapting to financial conditions while maintaining standard LVR levels.
Average FHB Loan Size Q3 2024 (vs. last quarter)
$518k (+1.2%)
Source: Australian Bureau of Statistics
Source: Australian Bureau of Statistics
Dwelling approvals reached 14,497, continuing the improvement seen in Q2 following the steep Q1 decline. Despite consecutive positive quarters, approvals remain below the past decade’s range. Year on year, approvals grew 4.0%, rebounding modestly from 2022, when high construction costs dampened demand and viability for medium and high density developments.
Detached house approvals totalled 8,893, rising 2.8% quarterly and 7.9% annually. Townhome approvals, however, fell sharply, declining 18% quarterly and 19.2% annually to 2,407. Apartment approvals rebound significantly, surging to 3,197 in Q3 after a record low of 1,023 in Q2. Although this aligns with 2022 averages, further growth is needed to address undersupply caused by elevated construction costs.
Total commencements fell 4.2% in FY24, with detached house starts down 8.1%. Multi-unit starts increased by 2.9% but remain 20% below the average wage. The downturn reflects reduced borrowing capacity, cost of living pressures, and rising building and financing costs.
In FY25, commencements are projected to rise 3.3% to 54,424 dwellings, nearing the decade average. Detached house starts may dip 0.7% to 32,509 due to affordability constraints limiting lot sales. Over the next three years, detached house starts are forecast to average 33,424 annually, a 2.1% increase from FY24.
In contrast, multi-unit starts are expected to grow 9.8% in FY25, driven by affordability pressures shifting demand to townhomes and apartments. This upward trend is projected to continue through FY27, with an average of 25,173 multiunit dwellings annually – a significant improvement from FY24 levels.
Detached Home Approvals
8,893
Townhome Approvals
2,407
Apartment Approvals
3,197
16,760
Growth areas included in this land market analysis
• South East LGAs of Casey and Cardinia
• Northern LGAs of Hume and Whittlesea, and Beveridge-Wallan area
• Western LGAs of Melton and Wyndham, and Bacchus Marsh area
• Geelong LGA
• Ballarat LGA
• Bendigo LGA
• Regional North (Macedon Ranges and Mitchell (part)
• Drouin and Warragul
The total number of estates in Victoria’s greenfield market saw a slight decline in the three months to December 2024, totaling 313 estates – three fewer than the previous quarter. However, this is also an increase of 13 estates compared to the same period in 2023.
Source: RPM Research, Data & Inisights
New lot supply in the three months to December 2024 decreased by a slight 2% from the previous quarter, a typical trend given the slower activity in December. Positively, lot releases were up 19% year-on-year, suggesting growing optimism from developers.
Source: RPM Research, Data & Inisights
Gross lot sales in the three months to December 2024 were 5% lower than the previous quarter but surged by an impressive 25% year-on-year.
All regions experienced annual growth, with regional areas showing the largest percentage gains. The western growth corridor maintained the highest market share at 30%, though this marked a notable decline from 37% a year earlier, with the south east picking up the difference.
Source: RPM Research, Data & Inisights
Sales activity in the three months to December 2024 remained heavily concentrated in Melbourne’s growth areas. However, both the western and northern growth areas lost market share on both a quarterly and annual basis. Meanwhile, Geelong’s share of total sales rebounded from long-term lows, climbing back into double digits.
Source: RPM Research, Data & Inisights
The regions saw mixed results over the quarter and year. The south east and western regions of Melbourne, along with the Macedon Ranges, recorded gains in both periods. In contrast, Ballarat and the Northern region saw declines across both.
Overall, Metro Melbourne recorded a 3.5% annual increase, and a 2.4% rise compared to the year before, intensifying affordability pressures and limiting housing accessibility.
Source: RPM Research, Data &
To address affordability pressures, most regional areas saw reductions to lot size following the substantial price growth seen during the pandemic. Conversely, metro regions largely held steady – except the south east, which recorded gains over the quarter and year.
Source: RPM Research, Data & Insights
Despite efforts by the RBA, inflation has proven stubborn, with only minimal interest rate reductions expected over the next two years.
The economy has slowed significantly, with growth declining over the past year and limited prospects for near term acceleration. This marks the nation’s most prolonged period of economic weakness since the recession in the early 1990s.
Weak household consumption remains the primary drag, exacerbated by persistently high inflation. Despite efforts by the RBA, inflation has proven stubborn, with only minimal interest rate reductions expected over the next two years. A single rate cut is anticipated in the first half of 2025, but this will likely provide limited relief, as inflation continues to impact real incomes, suppress household spending, and weaken consumer confidence – especially for large purchases.
Business and housing investment are also forecast to weaken further in the coming year, compounding the economic slowdown. Diminished consumer confidence is expected to maintain
pressure on business output, particularly in discretionary industries such as retail, accommodation, tourism, and food services.
Although business confidence has deteriorated, low record unemployment rates have so far prevented a significant rise in joblessness. However, these low unemployment levels present their own challenges for businesses, including higher wages, labour shortages, and stagnant productivity levels, which continue to place pressure on profits.
The property market reflects similar strains, with the weakening economy adding downward pressure on the established housing market. Affordability constraints and high land prices are deterring interest in new housing, though there is some optimism: forecast commencement numbers suggest an improvement in housing supply, addressing a critical market need.

RPM Group is a true industry leader, pioneering new benchmarks in market intelligence, know-how and innovation. With a proven track record since 1994, our unsurpassed market knowledge and data-driven insights have ensured our partners achieve excellent outcomes, and our clients, exceptional returns.
A full-service property business, we pride ourselves on customer service through every step of the process, from site diligence, acquisition and master-planning, through to launch, marketing and sales strategies. Our continued expansion and re-investment into our research services mean we offer unsurpassed market intelligence and datadriven insights to our clients, to help drive the continued growth of their projects and asset portfolio.