

5 YEAR STRATEGY BRIEF

FIGHT POVERTY. UNLEASH POSSIBILITY.
“We’re not all in the same boat but we’re all navigating the same water. We have to choose how we’ll make it to the other side. Some will work together to do so and others will go it alone as they try to push the rest out of the way. I’m on the team working with others to get across. Join us.”
CASTING OUR VISION DEFINING THE PROBLEM EXPLAINING OUR SOLUTION IMPACT, GOALS & ADVANTAGES CONTENTS 4 6 8 14 COUNTING THE COST 1
THE NEIGHBORHOOD VISION
MISSION Neighborhood exists to abolish economic, relational, and spiritual poverty through an integrated community of training and support.
VISION
We want all those living in areas of concentrated poverty throughout Hampton Roads to have the opportunity to build a living in a meaningful career and a life in a flourishing community. We provide a pathway to financial stability by combating the structural barriers faced by those
4 SECTION 1
FIVE YEAR
GOAL
500+ PEOPLE OUT
OF POVERTY
By the time our 5 year plan is complete, we will be enrolling three classes every year, resulting in over 200 total graduates, bringing over 500 men, women, and children out of poverty, encompassing a Neighborhood family of over 3,000 people.
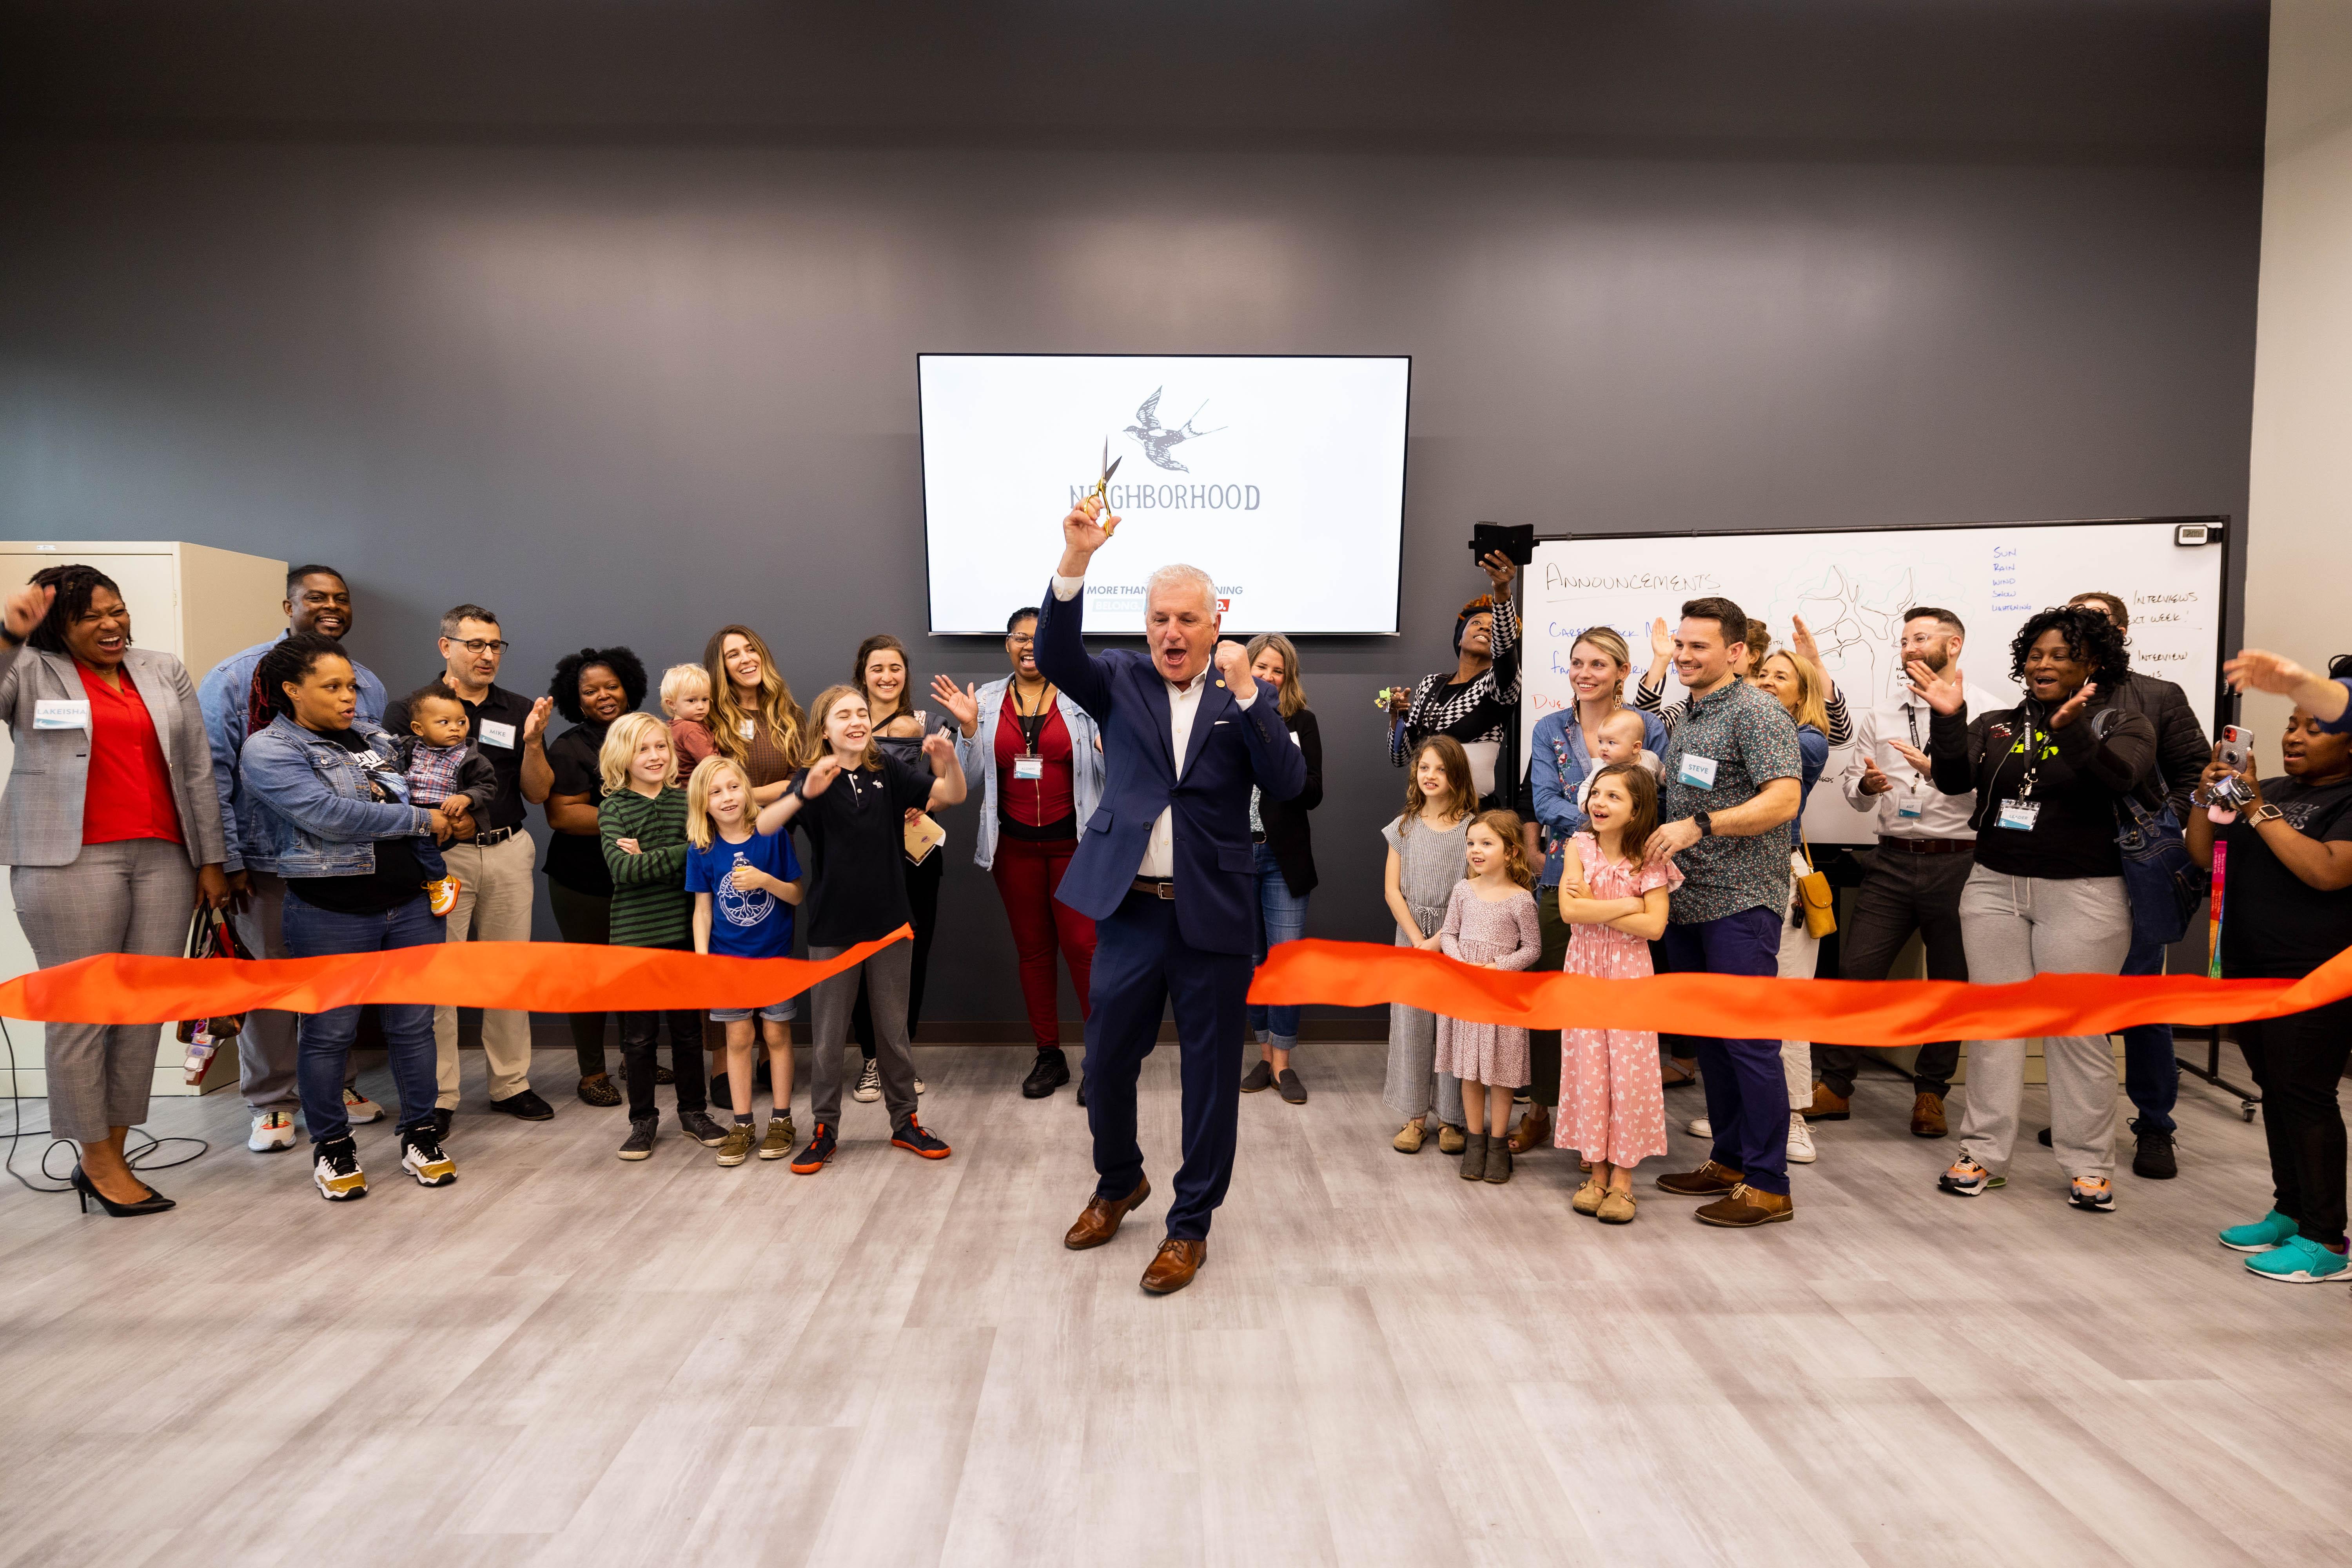
Our new training & community center opened in Jan 2022
1 2 3
SCALING UP
By year 3, we will be enrolling 3 classes per year, with 25 individuals each.
RAISING THE STANDARD
Staff & program growth to “best in class” will increase our graduation rate by 25%.
LARGER FAMILY
A family of 3,000 includes graduates & their dependents, staff, Allies, donors, and volunteers.
5 CASTING
VISION
OUR

POVERTY IN OUR COMMUNITIES
$26,500
POVERTY LINE
3x the minimum food budget in 1963
$57,283
LIVING WAGE
Can afford food, shelter, utilities, transport, healthcare, and childcare.
ROADS SOUTH NORFOLK
6 SECTION 2
0% 10% 20% 30% 40% 50% 60% Unemployment Poverty Less Than Living A Wage Housing Insecure
HAMPTON
DEFINING THE PROBLEM
150,000 people across Hampton Roads live below the poverty line. Most live in communities with high concentrations of poverty.
Children who grow up in South Norfolk also earn significantly less than their peers in surrounding neighborhoods by the time they are in their mid-thirties, even controlling for other factors such as education level or their parent’s income. This does not hold true in the region as a whole,
Zip Code Destiny: Median Income for Children Raised in Low Income Ar-
Parents Household Income Low Income Areas The Rest of Hampton Roads Low (25th Percentile) $20,000 $30,000
(50th Percentile)
Percentile)
The difficulties South Norfolk faces are not unique, but actually representative of dozens of small communities across the region where poverty has concentrated in ways that make it difficult for individuals to escape.
In addition to those living in poverty, 425,000 people across Hampton Roads cannot afford the basic necessities of housing, child care, food, transportation, health care, a smartphone plan, and taxes.
7
Middle
$26,000
$31,000
$39,000 High (75th
$48,000
THE NEIGHBORHOOD DIFFERENCE
By redistributing resources and eliminating barriers, we help individuals reach livingwage careers, providing the money they
THE GOAL: A LIVING WAGE
We assist people in gaining employment that pays them livingwages, in careers where they can grow and remain.
STABILITY REQUIRED
We work within communities to find those ready for the journey.
INTERDEPENDENT SUPPORT
Our partners are a handful of niche-based nonprofit organizations that can provide targeted support like transportation or childcare
6 MONTHS TO LAUNCH
We target career options that provide short, quality pathways from training to employment.
A LIFETIME OF INVESTMENT
To truly abolish poverty, we provide a network of resources and support even beyond graduation. 1 2 3 4 5
8 SECTION 3
EXPLAINING OUR SOLUTION
EXISTING ALTERNATIVES
Most existing poverty assistance does not address the barriers faced by individuals and communities, and does not attempt to measure significant change in outcomes.
Neighborhood
Other Models
Approach Community based Individually Focused
Time Investment
Program Design
Barriers Addressed
Success Measure
Retention
Outcome
Significant (over 200 hours)
Resident driven
Holistic and ongoing
Economic Improvement
Tracked for 3 years
Low and varied (8-40 hours)
Top down
Specific and time bound
Overall activity or inputs
Untracked
New community leaders Circumstantial assistance
WHO WE SERVE
Our participants are called “Leaders”, because they are the change agents in their own lives.
Degree 14% Some College 30% Certification 12% Diploma/GED 44% Other 14% White 9% Black 74% Latinx 2% $11.13 Average Starting Wage 32 Average Leader Age 56% Single Parents 70% Female 9
OUR PROGRAM MODEL
During the course of our 6 month program and beyond, we invest significant Economic, Relational, and Spiritual resources in our
We believe that an infusion of resources in these 3 key categories is imperative for any individual to belong, thrive and lead within their commu-
ECONOMIC

RELATIONAL
SPIRITUAL
Personal Development Skill Development Career Launch
Leader
Friendships Build Family
Ally Relationships
Loving Environment Mental & Emotional Care Mutual Aid
10 SECTION
3
NEIGHBORHOOD COLLECTIVE
EXPLAINING OUR SOLUTION
PROGRAM TIMELINE
RECRUITMENT
2 Months
ALLY GROUPING
Week 2
Allies are volunteers committed to walk alongside Leaders on their journey out of poverty.
SKILL DEVELOPMENT
1-4 Months

PERSONAL DEVELOPMENT
CAREER LAUNCH
Within 6
FAMILY GATHERING
Every Wednesday
Hosted by Neighborhood, the Leaders and Allies share a meal, play games, and cultivate significant relationships.
NEIGHBORHOOD COLLECTIVE Ongoing
Even after the program ends, our graduates continue their community development work in our formal alumni program.
11
PROGRAM DETAIL
Pre-Program Phase: Recruiting Admissions
Phase 1: Personal Development
The program begins with 6 weeks of classroom courses designed to review general career readiness, discover and build upon internal strengths, and prepare Leaders for the job search process.


8 One-on-One Coaching Sessions
100+ Hours of Course Curriculum
8 Hours of Free Counseling Ofered
35 Unique Skill Topics Covered
12 SECTION
3
100+ INTEREST FORMS 30+ APPLICATIONS 20+ INTERVIEWS 15 ORIENTATION 12 ON DAY 1 Current Average Class Funnel Referrals 30% Recruiting Events 21% Community Partners 33% Online Ads 17%
EXPLAINING OUR SOLUTION
Phase 2: Skill Development
To compete for living wage jobs ($15/hour or more) that will help them exit poverty, Leaders need a marketable hard skill. We assess Leaders’ strengths, weaknesses, and talents and create pathways for education and middle skills training based on those assessments.
MIDDLE SKILL CREDENTIALING
We partner with accredited local and online career training programs like Penn Foster and Virginia Community College’s Fast Forward to enroll students in 2-4 month courses that end in a certification exam.
DIRECT HIRE/EMPLOYER PROVIDED TRAINING
Whenever possible we connect Leaders to local employers for them to begin apprenticeships or other on-the-job training opportunities, and tailor this process to best meet the employers’ needs.
Phase 3: Career Launch
Job seeking requires time, connections, and an understanding of how to navigate the system. We connect Leaders to sustainable careers in high demand roles within the labor market
NEIGHBORHOOD EMPLOYER NETWORK
We maintain ongoing relationships with a network of companies that have either hired past Leaders, volunteer regularly to support Leaders with interviewing and job readiness skills, or connect Leaders to opportunities in the labor market.
CAREER COACHING JOB LEADS
Our Career Coaches curate real-time job leads that are passed on to our Leaders.
13
MEASURING OUR IMPACT
Current Success Matrix
Graduate Income & Retention
We track graduate retention at 3, 6, 12, 24, and 36 months.
14
Current Rate Goal Completed Personal Development 92% 90% Gained a Career Skill 75% 75% Secured a Living Wage Job 42% 67%
SECTION 4 Current Rate Average Starting Wage at Enrollment $11.13 Average Graduate Wage at Graduation $15.89 Average Starting Annual Income at Enrollment $17,941 Average Graduate Annual Income at Graduation $34,703
Currently Maintaining Employment 85% Average Current Graduate Hourly Wage $17.19 Average Current Post-Graduation Wage Increase $3.30 Average Total Wage Increase $6.05
Graduates
THE GOAL: 200 GRADUATES BY 2026
People
Strategy
Program
ADVANTAGES AND OPPORTUNITIES
Talented and committed staff & leadership, with competitive pay to attract and maintain a top tier team.
We have a driving vision that addresses real barriers, provides a value-add to employers, and aligns with regional workforce initiatives.
Large numbers of people are looking for living-wage careers. Our recruiting funnel is large enough to increase our class volume.
Workforce development is a rising concern in grant funding, and donors see a real social return on their investment.
15 IMPACT, GOALS, & ADVANTAGES 0 100 200 300 400 2022 2023 CUMULATIVE GRADUATES (ANNUAL GRADUATES) CUMULATIVE PEOPLE OUT OF POVERTY (ANNUAL PEOPLE OUT OF POVERTY) 2024 2025 2026
67 (27) 168 (68) 101 (34) 253 (85) 152 (50) 378 (125) 202 (50) 504 (126)
Financials
500 40 (23) 100 (58)
THE NUMBERS AT A GLANCE
The Budget: 3 Year Financial Plan
*Our Per-Person numbers in 2022 are afected by new building construction costs & Covid impacts on prior year enrollment.
16 SECTION 5 2022 2023 2024 2025 2026 Admin $39,663 $42,685 $60,539 $73,017 $74,267 Fundraising $146,262 $106,745 $115,146 $200,957 $204,082 Program $344,265 $470,625 $595,745 $622,243 $630,368 Total $530,190 $620,055 $771,430 $896,217 $908,717
Total Per Graduate $52,755 $23,136 $16,216 $14,539 $14,742 Program Per Graduate $34,255 $17,560 $12,523 $10,094 $10,226 Per Person Out of Poverty $21,207 $9,186 $6,428 $7,169 $7,270
1M 17 COUNTING THE COST 1.1 1.2 1.3 0 STABLE REVENUE GROWTH CAPITAL NEEDED 2022 2023 2026 350K 607K $2.8M NEEDED IN GROWTH CAPITAL 180K 350K 350K 764K The total cost of our plan is 4.7 MILLION 77K 144K 420K 914K to achieve our 3 year goals. CASH RESERVE INCREASE *Our goal at the end of year 3 is to have six months of cash reserves, and 12 months at the end of year 5. 100 2024 350K 546K 1.04M 2025 350K 558K 1.05M 144K 200 300 400 500 600 700 800 900 270k 144K 144K
OUR FINANCIAL PLAN
Previous 3 year Financials
We pursue new investors from three main channels:
MAJOR DONOR GIFTS
Private investors seeking a mutual relationship of shared vision, mission, and meaning, with real Return on Investment.
RECURRING & ANNUAL GIFTS
Our peer-to-peer fundraising, social media presence and other digital marketing helps secure automatically recurring gifts.
GRANT FUNDING
We pursue specific sources of grant funding with our contracted grant writer, and build relationships with local funders. 1 2 3
18 SECTION 5
2019 2020 2021 Revenue $178,743 $239,003 $368,384 Expenses $194,589 $248,297 $310,579 Net -$15,846 -$9,294 $57,805
IMPACT INVESTMENT
Stacy Potts
Hampton Roads Group, LLC
“We made it a component of our business that with every sale, we make a donation to Neighborhood because they are changing lives and changing a community from the inside out.”
Historic Revenue Channel Breakdown
Current Year-toYear Rates & Values
19
COUNTING THE COST
Grants 16% Events 13% One-Time 23% Recurring 48% Grants 11% One-Time 30% Recurring 59% Grants 24% Events 4% One-Time 33% Recurring 38%
2019 2020 2021
Rate or Value Annual Growth Rate 35.12% Average Gift Amount Increase 15.09% Lifetime Donor Value (Average 10 Year Total) $17,022 Average Total Gift Amount $2,840
NEIGHBORHOOD 2020. ALL RIGHTS RESERVED.