

Chapter 1
Functions and Their Graphs
Section 1.1 1. 1,3 2.
3. We must not allow the denominator to be 0. 404xx ; Domain: 4 xx .
4. 325 22 1 x x x
5. 52
6. radicals
7. independent; dependent
8. a 9. c
10. False; g 0
11. False; every function is a relation, but not every relation is a function. For example, the relation 22 1 xy is not a function.
12. verbally, numerically, graphically, algebraically
13. False; if the domain is not specified, we assume it is the largest set of real numbers for which the value of f is a real number.
14. False; if x is in the domain of a function f, we say that f is defined at x, or f(x) exists.
15. difference quotient
16. explicitly
17. a. Domain: {0,22,40,70,100}
Range: {1.031, 1.121, 1.229, 1.305, 1.411} b.
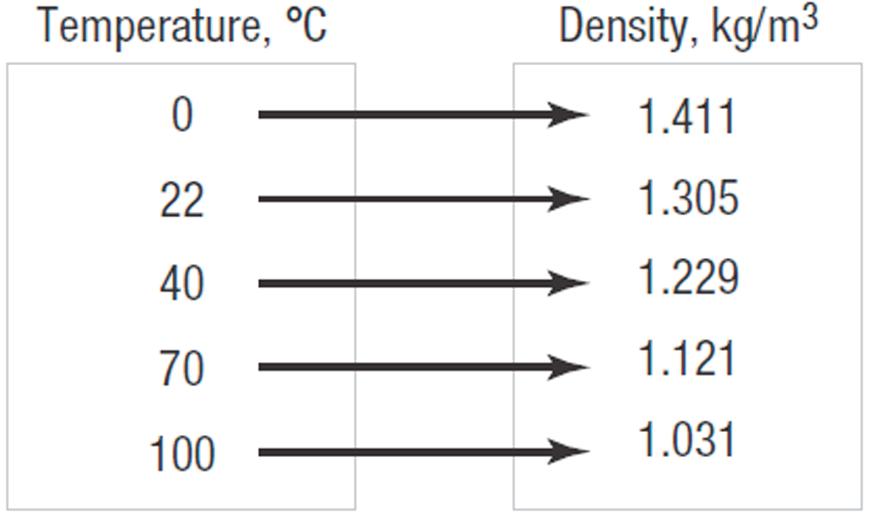
c. {(0, 1.411), (22, 1.305), (40, 1.229), (70, 1.121), (100, 1.031)}
18. a. Domain: {1.80, 1.78, 1.77}
b.
Range: {87.1, 86.9, 92.0, 84.1, 86.4}
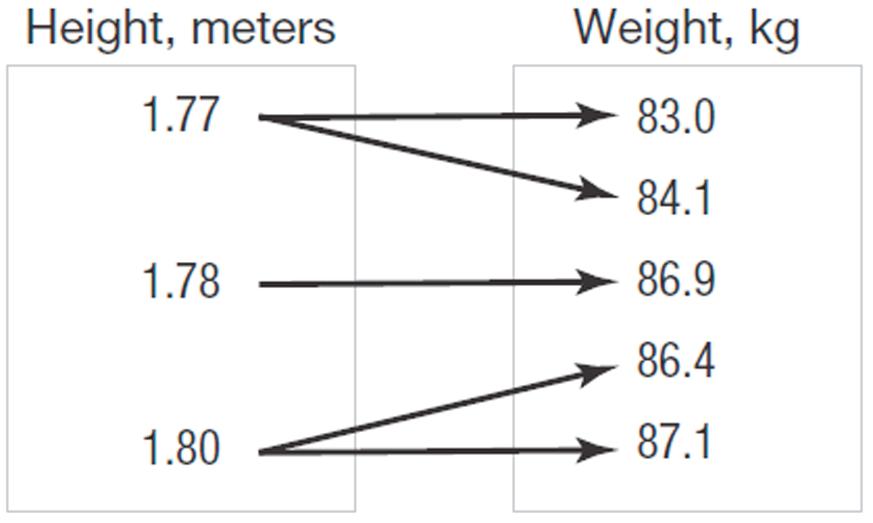
c. {(1.80, 87.1), (1.78, 86.9), (1.77, 83.0), (1.77, 84.1), (1.80, 86.4)}
19. Domain: {Elvis, Colleen, Kaleigh, Marissa}
Range: {Jan. 8, Mar. 15, Sept. 17} Function
20. Domain: {Bob, Darius, Chuck}
Range: {Beth, Diane, Imani, Marcia} Not a function
21. Domain: {20, 30, 40}
Range: {200, 300, 350, 425} Not a function
22. Domain: {Less than High school, High school graduate, Some college, Bachelor’s degree, Master’s degree, Professional degree, Doctoral degree}
Range: {$619,$781,$877, $1305, $1545, $1893,$1885} Function
23. Domain: {-3, 2, 4}
Range: {6, 9, 10} Not a function
24. Domain: {–2, –1, 3, 4} Range: {3, 5, 7, 12} Function
25. Domain: {1, 2, 3, 4} Range: {3} Function
26. Domain: {0, 1, 2, 3} Range: {–2, 3, 7} Function
27. Domain: {-4, 0, 3} Range: {1, 3, 5, 6} Not a function
28. Domain: {-4, -3, -2, -1} Range: {0, 1, 2, 3, 4} Not a function
29. Domain: {–1, 0, 2, 4} Range: {-1, 3, 8} Function
30. Domain: {–2, –1, 0, 1} Range: {3, 4, 16} Function
31. Graph 2 234yxx . The graph passes the vertical line test. Thus, the equation represents a function.
32. Graph 3 y x . The graph passes the vertical line test. Thus, the equation represents a function.
33. Graph 1 y x . The graph passes the vertical line test. Thus, the equation represents a function.
34. Graph y x . The graph passes the vertical line test. Thus, the equation represents a function.
35. 22 8 x y
Solve for 2 :8 yyx
For 0,22xy . Thus, 0,22 and 0,22 are on the graph. This is not a function, since a distinct x-value corresponds to two different y-values.
36. 12 y x
For 0,1xy . Thus, (0, 1) and (0, –1) are on the graph. This is not a function, since a distinct xvalue corresponds to two different y-values.
37. 2 x y
Solve for : y yx
For 1,1xy . Thus, (1, 1) and (1, –1) are on the graph. This is not a function, since a distinct x-value corresponds to two different y-values.
38. 2 1 xy
Solve for :1 y yx
For 0,1xy . Thus, (0, 1) and (0, –1) are on the graph. This is not a function, since a distinct xvalue corresponds to two different y-values.
39. Graph 3 y x . The graph passes the vertical line test. Thus, the equation represents a function.
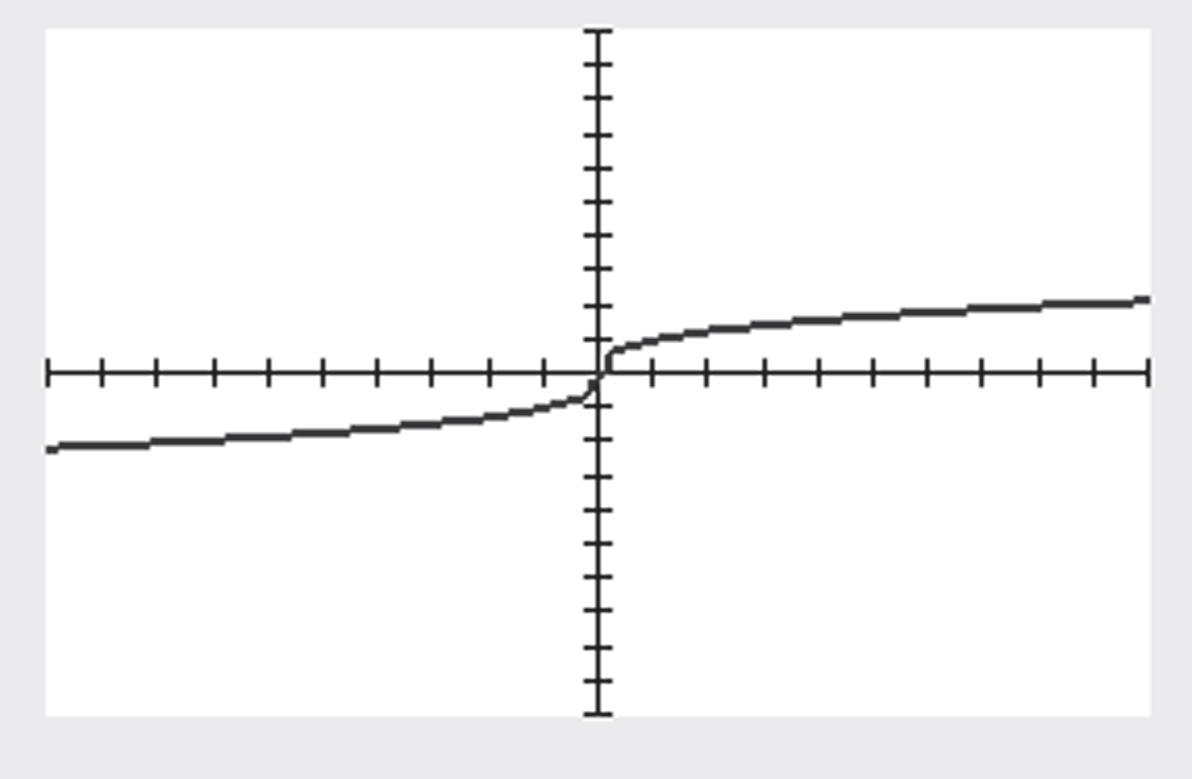
40. Graph 31 2 x y x . The graph passes the vertical line test. Thus, the equation represents a function.
41. 23 y x
Solve for y: 23 or (23) yxyx
For 1,5 or 5xyy . Thus, 1,5 and 1,5 are on the graph. This is not a function, since a distinct x-value corresponds to two different y-values.
42. 2241xy
Solve for y: 22 22 2 2 2 41 41 1 4 1 2 xy yx x y x y
For 1 2, 2 xy . Thus, 1 2, 2 and 1 2, 2 are on the graph. This is not a function, since a distinct x-value corresponds to two different y-values.
43. 2 324fxxx
a. 2 0302044 f
b. 2 1312143241 f
c. 2 1312143243 f
d. 2 2 324324fxxxxx
e. 22 324324fxxxxx
f. 2 2 2 2 131214 321224 363224 381 fxxx xxx xxx xx
g. 2 2 2322241244 fxxxxx h.
2 22 22 324 32224 363224 fxhxhxh xxhhxh xxhhxh
44. 2 21 f xxx
a. 2 020011 f
b. 2 121112 f
c. 2 121114 f
d. 2 2 2121 f xxxxx
e. 22 2121 f xxxxx
f. 2 2 2 2 12111 22111 242 232 fxxx xxx xxx xx
g. 2 2 22221821 f xxxxx h. 2 22 22 2()1 221 2421 fxhxhxh x xhhxh xxhhxh
45. 2 1 x fx x a. 2 00 00 1 01 f
b. 2 11 1 2 11 f
c.
2 111 1 112 11
d.
22 1 1 x x fx x x
e. 2211 x x fx xx
f.
47.
g.
2 2 21 41 2 2424 x x fx
h.
4 fxx
a. 004044 f
b.
c. 114145 f
d. 44fxxx
e. 44fxxx
f. 114fxx
g. 22424fxxx
h. 4 fxhxh
48. 2 f xxx
a. 2 00000 f
b. 2 1112 f
c. 2 1111100 f
d. 2 2 f xxxxx
e. 22 f xxxxx
f. 2 2 2 111 211 32 fxxx x xx xx
g. 2 2 22242 f xxxxx
h. 2 22 2 fxhxhxh x xhhxh 49. 21 35 x fx x a. 201 011 0 305055 f
b.
211 2133 1 3153522
211 2111 1 3153588 f
21 2121 353535 x xx fx xxx
2121 3535 x x fx xx
11 11 22
2 1 1 2 fxh xh
51. ()54fxx
Domain: is any real number xx
52. 2 ()2fxx
Domain: is any real number xx
53. 2 1 () 28 x fx x
Domain: is any real number xx
54. 2 2 () 1 x fx x
Domain: is any real number xx
55. 2 () 16 x gx x 2 2 160 164 x x x
Domain: 4,4xxx
56. 2 2 () 4 x hx x 2 2 40 42 x x x
Domain: 2,2xxx
57. 3 2 () x Fx x x 3 2 2 0 (1)0 0,1 xx xx xx
Domain: 0 xx
58. 3 4 () 4 x Gx x x 3 2 2 40 (4)0 0,4 0,2 xx xx xx xx
Domain: 2,0,2xxxx
59. ()312hxx 3120 312 4 x x x
Domain: 4 xx
60. ()1 Gxx 10 1 1 x x x
Domain: 1 xx
61. () 231 x px x 2310 231 231 or 231 24 22 2 1
x x xx xx xx
62. 1 () 314 x px x 3140 314 314 or 314 33 35 5 1 3
xxx
x x xx xx xx Domain: 5 1, 3
63. () 4 x fx x 40 4 x x
Domain: 4 xx
64. 2 () x x qx 20 2 2 x x x
Domain:
2 xx
65. 4 () 321 t Pt t
40 4 t t Also 3210 t 3210 321 7 t t t
Domain: 4,7ttt
66. 3 () 2 z hz z 30 3 z z Also 20 2 z z
Domain: 3,2zzz
67. 3 ()54 fxx
Domain: is any real number xx
68. 3 22 ()7 g tttt
Domain: is any real number tt .
69. 5 2 1 () 514 t Mt tt 2 5140 (2)(7)0 20 or 70 2 7 tt tt tt tt
Domain: 2,7ttx
70. 5 2 () 298 p Np p 2 2 2980 2(49)0 2(7)(7)0 70 or 70 7 7 p p pp pp pp
Domain: 7,7ppx
71. ()34()23 f xxgxx a. ()()342351 f gxxxx
Domain: is any real number xx .
Chapter 1: Functions and Their Graphs
b. ()()(34)(23) 3423 7 fgxxx xx x
Domain: is any real number xx .
c. 2 2 ()()(34)(23) 69812 612 fgxxx xxx xx
Domain: is any real number xx .
d. 34 () 23 fx x gx
3 23023 2 xxx
Domain: 3 2 xx
e. ()(3)5(3)115116 fg
f. ()(4)4711 fg
g. 2 ()(2)6(2)2122421210 fg
h. 3(1)4 347 (1)7 2(1)3231
g
72. ()21()32 fxxgxx
a. ()()213251 f gxxxx
Domain: is any real number xx
b. ()()(21)(32) 2132 3 fgxxx xx x
Domain: is any real number xx
c. 2 2 ()()(21)(32) 6432 62 fgxxx xxx xx
Domain: is any real number xx .
d. 21 () 32 fx x gx
320 2 32 3 x xx
Domain: 2 3 xx
e. ()(3)5(3)115114 fg
f. ()(4)431 fg
g. 2 ()(2)6(2)22 6(4)22 242220 fg
h. 2(1)1 213 (1)3 3(1)2321 f g
73. 2 ()1()2 f xxgxx
a. 22 ()()1221 f gxxxxx
Domain: is any real number xx
b. 2 2 2 ()()(1)(2) 12 21 f gxxx xx xx
Domain: is any real number xx
c. ()()(1)(2)22232 f gxxxxx
Domain: is any real number xx
d. 2 1 () 2 f x x g x
Domain: 0 xx
e. 2 ()(3)2(3)31 2(9)31 183120 fg
f. 2 ()(4)2(4)41 2(16)41 324129 fg
g. ()(2)2(2)2(2)32 2(8)2(4) 1688 fg
h. 2 1100 (1)0 2(1)2 2(1) f g
74. 23 ()23()41 fxxgxx
a. 23 32 ()()2341 424 fgxxx xx
Domain: is any real number xx .
b. 23 23 32 ()()2341 2341 422 fgxxx xx xx
Domain: is any real number xx
c. 23 532 ()()2341 81223 fgxxx xxx
Domain: is any real number xx .
d.
e. 32 ()(3)4(3)2(3)4 4(27)2(9)4 108184130
f. 32 ()(4)4(4)2(4)2 4(64)2(16)2 256322222
g. 532 ()(2)8(2)12(2)2(2)3 8(32)12(8)2(4)3 2569683363
h. 2 3 2(1)32(1)3 235 (1)1 4(1)1415 4(1)1
g
75. ()()35 fxxgxx
a. ()()35 f gxxx
Domain: 0 xx
b. ()()(35)35 fgxxxxx
Domain: 0 xx
c. ()()(35)35 f gxxxxxx
Domain: 0 xx
d. () 35 f x x gx 0 and 350 5 35 3 xx xx
Domain: 5 0 and 3 xxx
e. ()(3)33(3)5 39534 fg
f. ()(4)43(4)5 21255 fg
g. ()(2)3(2)252 62522 fg
h. 1111 (1) 3(1)53522 f g
76. ()() f xxgxx
a. ()() f gxxx
Domain: is any real number xx
b. ()() f gxxx
Domain: is any real number xx .
c. ()() f gxxxxx
Domain: is any real number xx
d. () x f x g x
Domain: 0 xx
e. ()(3)33336 fg
f. ()(4)44440 fg
g. ()(2)22224 fg
h. 1 1 (1)1 11
77. 11 ()1() fxgx x x
a. 112 ()()11 fgx x xx
Domain: 0 xx
b. 11 ()()11 fgx xx
Domain: 0 xx .
c. 2 1111 ()()1 fgx xxx x
Domain: 0 xx
d. 11 1 1 ()1 11 1 x fxx xx x x gx xx
Domain: 0 xx .
e. 25 ()(3)1 33 fg
f. ()(4)1 fg
g. 2 11113 ()(2) 2244 (2) fg
h. (1)112 f g
()1()4 f xxgxx
a. ()()14 f gxxx 10 and 40 1 and 4 4 xx xx x
Domain: 14xx
b. ()()14 f gxxx 10 and 40 1 and 4 4 xx xx x
Domain: 14xx .
c. 2 ()()14 54 fgxxx xx 10 and 40 1 and 4 4 xx xx x
Domain: 14xx
d. 11 () 4 4 fxx x g x x 10 and 40 1 and 4 4 xx xx x
Domain: 14xx
e. ()(3)3143 2121 fg
f. ()(4)4144 30303 fg
g. 2 ()(2)(2)5(2)4 41042 fg h. 110 (1)00 413 f g
79. 234 ()()3232 x x fxgx xx
a. 234 ()() 3232 23463 3232 xx fgx xx xxx xx 2 3 320 32 x xx
Domain: 2 3 xx .
b. 234 ()() 3232 23423 3232 xx fgx xx xxx xx
320 2 32 3 x xx
c. 2 2 234812 ()() 3232 (32) x xxx fgx xx
320 2 32 3 x xx
d.
Domain: 2 and 0 3 xxx
e. 6(3)3 18321 ()(3)3 3(3)2927 fg
f. 2(4)3835 1 ()(4) 3(4)2122102 fg
g.
2 2 22 8(2)12(2) ()(2) 3(2)2 8(4)243224567 162 624 fg
h. 2(1)3 235 (1) 4(1)44
g
80. 2 ()1() fxxgx x
a. 2 ()()1 fgxx x 10 and 0 1 xx x
Domain: 1,and 0 xxx
b. 2 ()()1 fgxx x
10 and 0 1 xx x
Domain: 1,and 0 xxx
c. 221 ()()1 x fgxx xx
10 and 0 1 xx x
Domain: 1,and 0 xxx
d. 11 () 2 2 fxxx x g x
10 and 0 1 xx x
Domain: 1,and 0 xxx .
e. ()(3)31422228 3333 fg
f. 21 ()(4)41542 fg
g. 22123 ()(2)3 22 fg
h. 1112 (1) 22 f g
81. 1 ()31()()6 2 fxxfgxx 1 631() 2 7 5() 2 7 ()5 2 x xgx xgx gxx
Chapter 1: Functions and Their Graphs
82. 2 11 ()() fxxfx xg x x
2 2 2 1 1 () 1 1 () 1 1 1(1)1 11 x x gx xx x x x gx x xx xx xxx xxx
83. ()43fxx ()()4()3(43) 44343 4 4 fxhfxxhx hh xhx h h h
84. ()31 f xx ()()3()1(31) 33131 3 3 fxhfxxhx hh xhx h h h
85. 2 ()4fxx
22 222 2 ()() ()4(4) 244 2 2 fxhfx h xhx h xxhhx h xhh h x h
86. 2 ()32fxx 22 222 2 ()() 3()2(32) 363232 63 63 fxhfx h xhx h xxhhx h xhh h x h
87. 2 ()4fxxx 22 222 2 ()() ()()4(4) 244 2 21 fxhfx h xhxhxx h xxhhxhxx h xhhh h xh
2 326fxxx
2 2 222 2222 326326 32226326 36323632 632 fxhfx h xhxhxx h xxhhxhxx h x xhhhxxhhh hh xh
89.
93. 2 fxx
94. ()1 f xx
hxhxhxhx xhx
97.
fxhfx h xhx h x hxxhx h x hx xhx hxhx xxhhx hxhx xhh hxhx xh xhx xh xhx
22 2222 22 22 22 222 2 22 22 4()4 4()44()4 4()4 4()(4) 4()4 4(2)(4) 11 2 11 2 4()4 (2) 4()4
98. 1 2 fx x ()() 11 22 22 22 2222 2222 2(2) (2)2(2)2 22 (2)2(2)2 (2)2(2)2 1 (2)2(2)2
fxhfx h xhx h xxh hxxh xxhxxh hxxhxxh xxh hxxhxhx xxh hxxhxhx h hxxhxhx xxhxhx
99. 2 2 1123 028 0(4)(2) 40 or 20 4 or 2 xx xx xx xx xx
The solution set is: 2,4
100. 753 1664 735 1646 5712 61616 55 616 563 1658 x x x x x
The solution set is: 3 8
101. 32 ()245 and (2)5 fxxAxxf 32 (2)2(2)(2)4(2)5 516485 5419 144 147 42 fA A A A A
102. 2 ()34 and (1)12 fxxBxf : 2 (1)3(1)(1)4 1234 5 fB B B
103. 38 () and (0)2 2 x fxf xA 3(0)8 (0) 2(0) 8 2 28 4 f A A A A
104. 21 () and (2) 342 xB fxf x 2(2) (2) 3(2)4 14 210 54 1 B f B B B
105. Let x represent the length of the rectangle. Then, 2 x represents the width of the rectangle since the length is twice the width. The function for the area is: 2 2 1 () 222 xx A xxx
106. Let x represent the length of one of the two equal sides. The function for the area is: 2 11 () 22 A xxxx
107. Let x represent the number of hours worked. The function for the gross salary is: ()16 Gxx
108. Let x represent the number of items sold. The function for the gross salary is: ()10100Gxx 109. a.
2 2 2 10: 10204.9 104.9 2.0408 1.43 seconds Hx x x x x
2 2 2 5: 5204.9 154.9 3.0612 1.75 seconds Hx x x x x
c. 0 Hx 2 2 2 0204.9 204.9 4.0816 2.02 seconds x x x x
110. a. 2 12013120137 meters H
2 2 1.120131.120131.21 2015.734.27 meters 1.220131.220131.44 2018.721.28 meters
205.92914.071 meters 1.2204.91.2
204.91.44
meters
45036,000 450100 10450 1004580
116.
117. a.
232 232 32 ()()() 1.22200.05265500 1.22200.05265500 0.050.8155500 PxRxCx xxxxx xxxxx xxx
b. 32 (15)0.05(15)0.8(15)155(15)500 168.751802325500 $1836.25
c. When 15 hundred smartphones are sold, the profit is $1836.25.
118. a. P is the dependent variable; a is the independent variable
b. 2 (20)0.027(20)6.530(20)363.804 10.8130.6363.804 244.004
In 2015 there are 244.004 million people who are 20 years of age or older.
c. 2 (0)0.027(0)6.530(0)363.804 363.804
In 2015 there are 363.804 million people.
119. a. 2 2 2 ()0.05 2.20.050.4v15 0.05 ()2.2;0.4v15 ()()() 2.615 Bvv vv v Rvv DvRvBv v
b. 2 (60)0.05(60)2.6(60)15 18015615
Chapter 1: Functions and Their Graphs
c. The car will need 321 feet to stop once the impediment is observed.
120. a. 2 hxx
222 hababab hahb
2 hxx has the property.
b. 2 g xx 2 22 2 g ababaabb Since
2222 2 aabbabgagb
2 () g xx does not have the property.
,
c. 52Fxx
52552Fababab Since 5525252 ababFaFb ,
52Fxx does not have the property.
d. 1 Gx x
111 GabGaGb abab
1 Gx x does not have the property.
124. No. The domain of f is is any real number xx , but the domain of g is 1 xx
Section 1.2
1. 22416xy x-intercepts:
-intercepts:
2 2 2 2 0416 416 4 20,2,0,2 y y y y
2. False; 22 222 02 0 xy y y y
The point 2,0 is on the graph.
3. vertical 4. 53 f
5. 2 4 fxax
6. False. The graph must pass the vertical line test in order to be the graph of a function.
7. False; e.g. 1 y x
8. True
9. c
10. a
11. a. (0)3 since (0,3) is on the graph. f (6)3 since (6,3) is on the graph. f
Section 1.2: The Graph of a Function
125. 3 3 ( ) x x yourage 126. Answers will vary.
b. (6)0 since (6,0) is on the graph. f (11)1 since (11,1) is on the graph. f
c. (3) is positive since (3)3.7. ff
d. (4) is negative since (4)1. ff
e. ()0 when 3,6, and 10. fxxxx
f. ()0 when 36, and 1011.fxxx
g. The domain of f is 611xx or 6,11 .
h. The range of f is 34yy or 3,4
i. The x-intercepts are 3 , 6, and 10.
j. The y-intercept is 3.
k. The line 1 2 y intersects the graph 3 times.
l. The line 5 x intersects the graph 1 time.
m. ()3 when 0 and 4. fxxx
n. ()2 when 5 and 8. fxxx
12.
a. (0)0 since (0,0) is on the graph. f (6)0 since (6,0) is on the graph. f
b. (2)2 since (2,2) is on the graph. f (2)1 since (2,1) is on the graph. f
c. (3) is negative since (3)1. ff
d. (1) is positive since (1)1.0. ff
e. ()0 when 0,4, and 6. fxxxx
f. ()0 when 04.fxx
g. The domain of f is 46xx or 4,6 .
h. The range of f is 23yy or 2,3 .
i. The x-intercepts are 0, 4, and 6.
j. The y-intercept is 0.
Chapter 1: Functions and Their Graphs
k. The line 1 y intersects the graph 2 times.
l. The line 1 x intersects the graph 1 time.
m. ()3 when 5. fxx
n. ()2 when 2. fxx
13. Not a function since vertical lines will intersect the graph in more than one point.
a. Domain: 1 or 1 xxx ; Range: is any real number yy
b. Intercepts: (1,0),(1,0)
c. Symmetry about the x-axis, y-axis and the origin
14. Function
a. Domain: is any real number xx ; Range: 0 yy
b. Intercepts: (0,1)
c. None
15. Function
a. Domain: xx ; Range: 11yy
b. Intercepts: ,0, ,0, (0,1) 22
c. Symmetry about y-axis.
16. Function
a. Domain: xx ; Range: 11yy
b. Intercepts: ,0, ,0, (0,0)
c. Symmetry about the origin.
17. Not a function since vertical lines will intersect the graph in more than one point.
a. Domain: 0 xx ;
Range: is any real number yy
b. Intercepts: (0,0)
c. Symmetry about the x-axis
18. Not a function since vertical lines will intersect the graph in more than one point.
a. Domain: 22xx ;
Range: 22yy
b. Intercepts: (2,0)(2,0)(0,2)(0,2)
c. Symmetry about the x-axis, y-axis and the origin
19. Function
a. Domain: 03xx ;
Range: <2 yy
b. Intercepts: (1, 0)
c. None
20. Function
a. Domain: 04xx ;
Range: 03yy
b. Intercepts: (0, 0)
c. None
21. Function
a. Domain: is any real number xx ;
Range: 2 yy
b. Intercepts: (–3, 0), (3, 0), (0,2)
c. Symmetry about y-axis.
22. Function
a. Domain: 3 xx ;
Range: 0 yy
b. Intercepts: (–3, 0), (2,0), (0,2)
c. None
23. Function
a. Domain: is any real number xx ;
Range: 3 yy
b. Intercepts: (1, 0), (3,0), (0,9)
c. None
24. Function
a. Domain: is any real number xx ; Range: 5 yy
b. Intercepts: (–1, 0), (2,0), (0,4)
c. None
25. 2 ()32 fxxx
a. 2 (1)31122 f
The point 1,2 is on the graph of f
b. 2 (2)32228 f
The point 2,8 is on the graph of f.
c. Solve for x : 2 2 1 3 232 03 0310, xx xx xxxx (0, –2) and 1 3 ,2 are on the graph of f
d. The domain of f is is any real number xx .
e. x-intercepts:
2 =0320 2 3210,1 3 fxxx xxxx
f. y-intercept: 2 0=30022 f
g 2 320 (32)(1)0 320 or 10 2 ,1 3 xx xx xx xx
26. 2 ()35 f xxx
a. 2 (1)315182 f
The point 1,2 is not on the graph of f.
b. 2 (2)3252=22 f
The point 2,22 is on the graph of f
c. Solve for x : 22 1 3 2353520 3120,2 xxxx xxxx
(2, –2) and 1 3 ,2 on the graph of f
Section 1.2: The Graph of a Function
d. The domain of f is is any real number xx
e. x-intercepts: 2 5 3 =0350 3500, fxxx xxxx
f y-intercept: 2 030500 f
g 2 350 (35)0 0 or 350 5 0, 3 xx xx xx xx
27. 2 () 6 x fx x
a. 325 (3)14 363 f
The point 3,14 is not on the graph of f
b. 426 (4)3 462 f
The point 4,3 is on the graph of f.
c. Solve for x : 2 2 6 2122 14 x x xx x (14, 2) is a point on the graph of f
d. The domain of f is 6 xx
e. x-intercepts: 2 =00 6 202 x fx x x x
f. y-intercept: 021 0 063 f
g. 2 0 only if 6 20 2 x x x x
28. 2 2 () 4 x fx x
Chapter 1: Functions and Their Graphs
a. 2 123 (1) 145 f
The point 3 1, 5
is on the graph of f.
b. 2 0221 (0) 0442 f
The point 1 0, 2
c. Solve for x :
is on the graph of f
are on the graph of f
d. The domain of f is 4 xx
e. x-intercepts:
This is impossible, so there are no xintercepts.
f. y-intercept:
2 0221 0 0442
g. 2 2 2 2 0 only if 4 20 2 x x x x
No solution. 29. 4 2 12 () 1
x fx x a. 4 2 12(1)12 (1)6 2 (1)1
f The point (–1,1) is on the graph of f.
b. 4 2 12(3)972486 (3) 105 (3)1 f The point 486 3, 5 is on the graph of f.
c. Solve for x :
(31)(41)0
x x x x xx xx 2 13 310 3 3
xx 33 ,1,,1 33
are on the graph of f
d. The domain of f is is any real number xx
e. x-intercept:
x fx x xx
f. y-intercept: 4 2 120 0 00 01 01 f g 4 2 4 12 0 only if 1 120 0 x x x x
30. 2 () 2 x fx x a. 1 2 112 2 13 23 2 22 f
The point 12 , 23 is on the graph of f
b. 2(4)8 (4)4 422 f
The point 4,4 is on the graph of f
c. Solve for x : 2 2 122 2 x x x x x (–2,1) is a point on the graph of f .
d. The domain of f is 2 xx
31.
e. x-intercept:
x fxx x x
2 =0020 2 0
f. y-intercept: 0 00 02
g. 2 0 only if 2 20 0 x x x x
a. ()(2)(2)(2)213 fgfg
b. ()(4)(4)(4)1(3)2 fgfg
c. ()(6)(6)(6)011 fgfg
d. ()(6)(6)(6)101 gfgf
e. ()(2)(2)(2)2(1)2 fgfg
f. (4) 11 (4) (4)33 ff gg
32. 2 2 136 2.73.5 x hxx v
a. We want
The ball needs to be thrown with an initial velocity of 30 feet per second.
b. 2 2 126 2.73.5 30
c. Using the velocity from part (b),
The ball will be 15.56 feet above the floor when it has traveled 9 feet in front of the foul line.
Section 1.2: The Graph of a Function
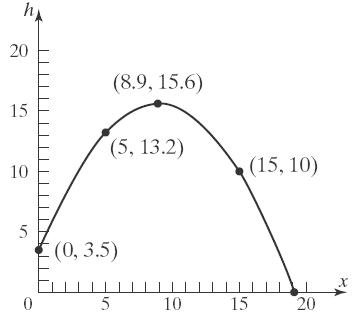
d. Select several values for x and use these to find the corresponding values for h. Use the results to form ordered pairs ,x h . Plot the points and connect with a smooth curve.
Thus, some points on the graph are 0,3.5 , 5,13.2 , and 15,10 . The complete graph is given below.
2 2 448 886 28 2816 14 784 10.4 feet
2 2 4412 12126 28 6336 18 784 9.9 feet
c. From part (a) we know the point 8,10.4 is on the graph and from part (b) we know the point 12,9.9 is on the graph. We could evaluate the function at several more values of x (e.g. 0 x , 15 x , and 20 x ) to obtain additional points.
Chapter 1: Functions and Their Graphs
Some additional points are 0,6 , 15,8.4 and 20,3.6 . The complete graph is given below.

No; when the ball is 15 feet in front of the foul line, it will be below the hoop. Therefore it cannot go through the hoop.
In order for the ball to pass through the hoop, we need to have 1510 h
The ball must be shot with an initial velocity of 30 feet per second in order to go through the hoop.
2 ()41A xxx
a. Domain of 2 ()41A xxx ; we know that x must be greater than or equal to zero, since x represents a length. We also need 2 10 x , since this expression occurs under a square root. In fact, to avoid
Area = 0, we require 2 0 and 10xx
2 Solve: 10 110
Case1: 10 and 10 1 and 1 (i.e. 11)
Case2: 10 and 10 x xx xx xx x xx
1 and 1 (which is impossible) xx
Therefore the domain of A is 01xx
b. Graphing 2 ()41A xxx

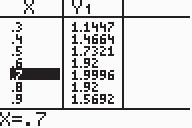
c. When 0.7 x feet, the cross-sectional area is maximized at approximately 1.9996 square feet. Therefore, the length of the base of the beam should be 1.4 feet in order to maximize the cross-sectional area.
35. 2 2 32 () 130 x hxx a. 2 2 32(100) (100)100 130 320,000 10081.07 feet 16,900 h b. 2 2 32(300) (300)300 130 2,880,000 300129.59 feet 16,900 h
c.
The ball is about 26.63 feet high after it has traveled 500 feet.
d.
e.
Therefore, the golf ball travels 528.13 feet.


Section 1.2: The Graph of a Function
The ball reaches a height of 90 feet twice. The first time is when the ball has traveled approximately 115.07 feet, and the second time is when the ball has traveled about 413.05 feet.
g. The ball travels approximately 275 feet before it reaches its maximum height of approximately 131.8 feet.
h. The ball travels approximately 264 feet before it reaches its maximum height of approximately 132.03 feet.
a. 14110 feet 2.67 miles h ; 2 4000 (2.67)120119.84 40002.67
On Pike's Peak, Amy will weigh about 119.84 pounds.
b. Graphing:
c. Create a TABLE:
The weight W will vary from 120 pounds to about 119.7 pounds.
d. By refining the table, Amy will weigh 119.95 lbs at a height of about 0.83 miles (4382 feet).
e. Yes, 4382 feet is reasonable.
37. 36000 ()100 10 x Cx x
a. 48036000 (480)100 10480 $223 60036000 (600)100 10600
b. |0xx
c. Graphing:
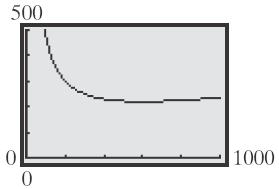
d. TblStart0; Tbl50
e. The cost per passenger is minimized to about $220 when the ground speed is roughly 600 miles per hour.
38. a. 05000 C
This represents the fixed overhead costs. That is, the company will incur costs of $5000 per day even if no computers are manufactured.
b. 1019,000 C
It costs the company $19,000 to produce 10 computers in a day.
c. 5051,000 C
It costs the company $51,000 to produce 50 computers in a day.
d. The domain is |080 qq . This indicates that production capacity is limited to 80 computers in a day.
e. The graph is curved down and rises slowly at first. As production increases, the graph rises more quickly and changes to being curved up.
f. The inflection point is where the graph changes from being curved down to being curved up.
39. a. 0$50 C
It costs $50 if you use 0 gigabytes.
b. 5$50 C
It costs $50 if you use 5 gigabytes.
c. 15$150 C
It costs $90 if you use 15 gigabytes.
d. The domain is g|030 g . This indicates that there are at most 30 gigabytes in a month.
e. The graph is flat at first and then rises in a straight line.
40. (2)5(2)4 gf
Since 2 (2)(2)4(2) 12 f c c we have
42. Answers will vary. From a graph, the domain can be found by visually locating the x-values for which the graph is defined. The range can be found in a similar fashion by visually locating the y-values for which the function is defined. If an equation is given, the domain can be found by locating any restricted values and removing them from the set of real numbers. The range can be found by using known properties of the graph of the equation, or estimated by means of a table of values.
43. The graph of a function can have any number of x-intercepts. The graph of a function can have at most one y-intercept (otherwise the graph would fail the vertical line test).
44. Yes, the graph of a single point is the graph of a function since it would pass the vertical line test. The equation of such a function would be something like the following: 2 fx , where 7 x
45. (a) III; (b) IV; (c) I; (d)
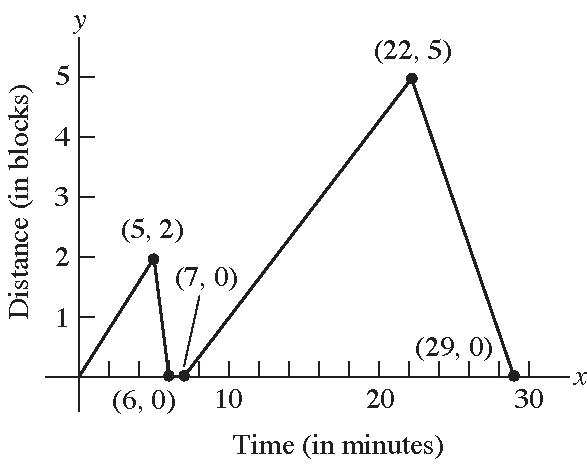
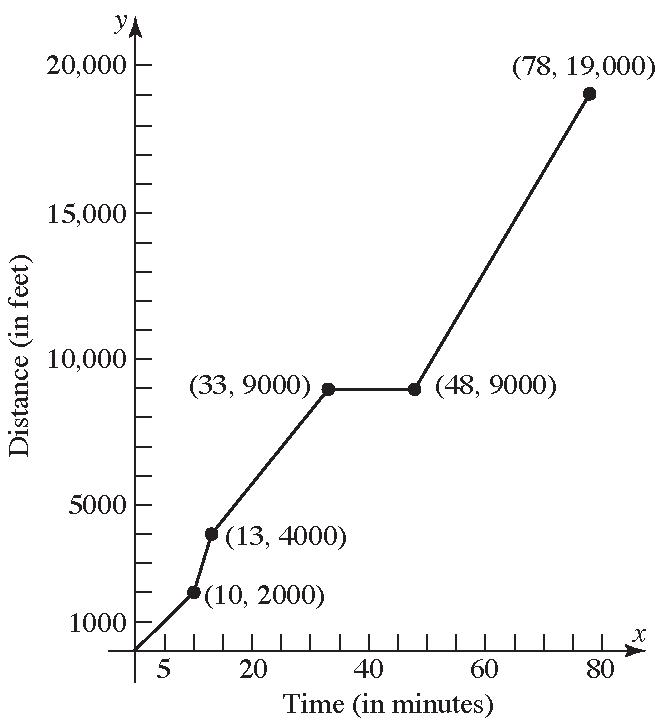
49. a. 2 hours elapsed; Kevin was between 0 and 3 miles from home.
b. 0.5 hours elapsed; Kevin was 3 miles from home.
c. 0.3 hours elapsed; Kevin was between 0 and 3 miles from home.
d. 0.2 hours elapsed; Kevin was at home.
e. 0.9 hours elapsed; Kevin was between 0 and 2.8 miles from home.
f. 0.3 hours elapsed; Kevin was 2.8 miles from home.
g. 1.1 hours elapsed; Kevin was between 0 and 2.8 miles from home.
h. The farthest distance Kevin is from home is 3 miles.
i. Kevin returned home 2 times.
50. a. Michael travels fastest between 7 and 7.4 minutes. That is, 7,7.4
b. Michael's speed is zero between 4.2 and 6 minutes. That is, 4.2,6
V; (e) II
46. (a) II; (b) V; (c) IV; (d) III; (e) I
Chapter 1: Functions and Their Graphs
c. Between 0 and 2 minutes, Michael's speed increased from 0 to 30 miles/hour.
d. Between 4.2 and 6 minutes, Michael was stopped (i.e, his speed was 0 miles/hour).
e. Between 7 and 7.4 minutes, Michael was traveling at a steady rate of 50 miles/hour.
f. Michael's speed is constant between 2 and 4 minutes, between 4.2 and 6 minutes, between 7 and 7.4 minutes, and between 7.6 and 8 minutes. That is, on the intervals (2, 4), (4.2, 6), (7, 7.4), and (7.6, 8).
51.Answers (graphs) will vary. Points of the form (5, y) and of the form (x, 0) cannot be on the graph of the function.
52. The only such function is 0 fx because it is the only function for which f xfx . Any other such graph would fail the vertical line test.
53. Answers may vary.
Section 1.3 1. 25 x
3. x-axis: yy
2 2 2 51 51 51 different yx yx yx
y-axis: x x
2 2 51 51 same yx yx
origin: x x and yy
2 2 2 51 51 51 different yx yx yx
The equation has symmetry with respect to the y-axis only. 4.
11 253 253 y ymxx yx yx
5. 2 9 yx x-intercepts: 2 2 09 93 x xx y-intercept: 2 099 y
The intercepts are 3,0 , 3,0 , and
0,9 .
6. increasing
7. even; odd
8. True
9. True
10. False; odd functions are symmetric with respect to the origin. Even functions are symmetric with respect to the y-axis.
11. c
12. d
13. Yes
14. No, it is increasing.
15. No
16. Yes
17. f is increasing on the intervals
8,2,0,2,5,7
18. f is decreasing on the intervals:
10,8,2,0,2,5
19. Yes. The local maximum at 2 is 10. x
20. No. There is a local minimum at 5 x ; the local minimum is 0.
21. f has local maxima at 2 and 2 xx . The local maxima are 6 and 10, respectively.
22. f has local minima at 8,0 and 5 xxx
The local minima are –4, 0, and 0, respectively.
23. f has absolute minimum of 4 at x = –8.
24. f has absolute maximum of 10 at x = 2.
25. a. Intercepts: (–2, 0), (2, 0), and (0, 3).
b. Domain: 44xx or 4,4 ;
Range: 03yy or 0,3
c. Increasing: [–2, 0] and [2, 4]; Decreasing: [–4, –2] and [0, 2].
d. Since the graph is symmetric with respect to the y-axis, the function is even.
26. a. Intercepts: (–1, 0), (1, 0), and (0, 2).
b. Domain: 33xx or 3,3 ; Range: 03yy or 0,3 .
c. Increasing: [–1, 0] and [1, 3]; Decreasing: [–3, –1] and [0, 1].
d. Since the graph is symmetric with respect to the y-axis, the function is even.
27. a. Intercepts: (0, 1).
b. Domain: is any real number xx ; Range: 0 yy or 0,
c. Increasing: (,) ; Decreasing: never.
d. Since the graph is not symmetric with respect to the y-axis or the origin, the function is neither even nor odd.
28. a. Intercepts: (1, 0).
b. Domain: 0 xx or 0, ; Range: is any real number yy
c. Increasing: [0,) ; Decreasing: never.
d. Since the graph is not symmetric with respect to the y-axis or the origin, the function is neither even nor odd.
29. a. Intercepts: (,0),(,0), and (0,0) .
b. Domain: xx or , ; Range: 11yy or 1,1
c. Increasing: , 22
; Decreasing: , and , 22
d. Since the graph is symmetric with respect to the origin, the function is odd.
30. a. Intercepts: ,0,,0, and (0,1) 22
.
b. Domain: xx or , ; Range: 11yy or 1,1
c. Increasing: ,0 ; Decreasing:
0, .
d. Since the graph is symmetric with respect to the y-axis, the function is even.
31. a. Intercepts: 151 ,0,,0, and 0, 322
.
b. Domain: 33xx or 3,3 ; Range: 12yy or 1,2
c. Increasing: 2,3 ; Decreasing: 1,1 ; Constant: 3,1 and 1,2
d. Since the graph is not symmetric with respect to the y-axis or the origin, the function is neither even nor odd.
32. a. Intercepts: 2.3,0,3,0, and 0,1
b. Domain: 33xx or 3,3 ; Range: 22yy or 2,2
c. Increasing: 3,2 and 0,2 ; Decreasing: 2,3 ; Constant: 2,0
d. Since the graph is not symmetric with respect to the y-axis or the origin, the function is neither even nor odd.
33. a. f has a local maximum value of 3 at 0. x
b. f has a local minimum value of 0 at both 2 and 2. xx
34. a. f has a local maximum value of 2 at 0. x
Chapter 1: Functions and Their Graphs
b. f has a local minimum value of 0 at both 1 and 1. xx
35. a. f has a local maximum value of 1 at 2 x
b. f has a local minimum value of –1 at 2 x
36. a. f has a local maximum value of 1 at 0. x
b. f has a local minimum value of –1 both at x and x .
37. 3 ()4 f xx
()4()433 f xxxfx
Therefore, f is odd.
38. 42 ()2 f xxx
()2()()24242 f xxxxxfx
Therefore, f is even.
39. 2 ()10 g xx
()10()1022 g xxxgx
Therefore, g is even.
40. 3 ()35hxx 33 ()3()535 hxxx h is neither even nor odd.
41. 3 ()4 F xx
33 ()44 F xxxFx Therefore, F is odd.
42. () Gxx () Gxx G is neither even nor odd.
43. () f xxx () f xxxxx f is neither even nor odd.
44. 3 2 ()21fxx 3 22 3 ()2()121 fxxxfx Therefore, f is even.
45. 2 1 () 8 gx x
22 11 () ()88 g xgx xx Therefore, g is even.
46. 2 () 1 x hx x 22 () ()11 xx hxhx xx
Therefore, h is odd.
47. 3 2 () 39 x hx x
3 3 22 () () 3()939 x x hxhx xx
Therefore, h is odd.
48. 2 () x Fx x 2 2() () x x F xFx xx
Therefore, F is odd.
49. f has an absolute maximum of 4 at 1. x
f has an absolute minimum of 1 at 5. x
f has an local maximum value of 3 at 3. x
f has an local minimum value of 2 at 2. x
50. f has an absolute maximum of 4 at 4. x
f has an absolute minimum of 0 at 5. x
f has an local maximum value of 4 at 4. x
f has an local minimum value of 1 at 1. x
51. f has an absolute minimum of 1 at 1. x
f has an absolute maximum of 4 at x = 3.
f has an local minimum value of 1 at 1. x
f has an local maximum value of 4 at x = 3.
52. f has an absolute minimum of 1 at 0. x
f has no absolute maximum.
f has no local minimum.
f has no local maximum.
53. f has an absolute minimum of 0 at 0. x
f has no absolute maximum.
f has an local minimum value of 0 at 0. x
f has an local minimum value of 2 at 3. x
f has an local maximum value of 3 at 2. x
54. f has an absolute maximum of 4 at 2. x
f has no absolute minimum.
f has an local maximum value of 4 at 2. x
f has an local minimum value of 2 at 0. x
55. f has no absolute maximum or minimum.
f has no local maximum or minimum.
56. f has no absolute maximum or minimum.
f has no local maximum or minimum.
57. 3 32fxxx on the interval 2,2
Use MAXIMUM and MINIMUM on the graph of 3 1 32yxx
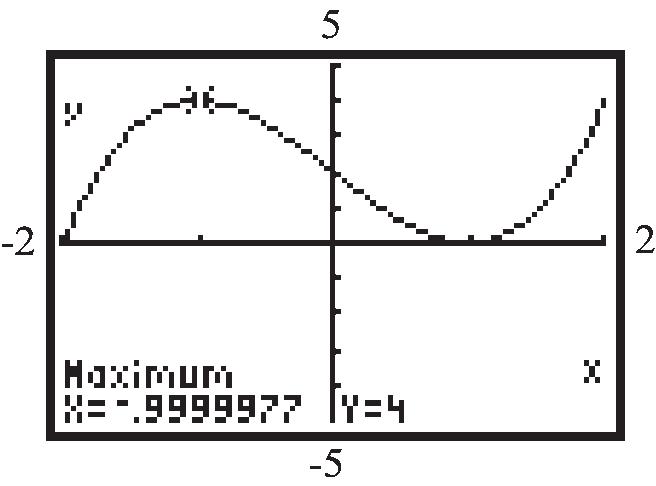

local maximum: (1)4 f
local minimum: (1)0 f
f is increasing on: 2,1 and 1,2 ;
f is decreasing on: 1,1
58. 3235fxxx on the interval 1,3
Use MAXIMUM and MINIMUM on the graph of 32 1 35yxx

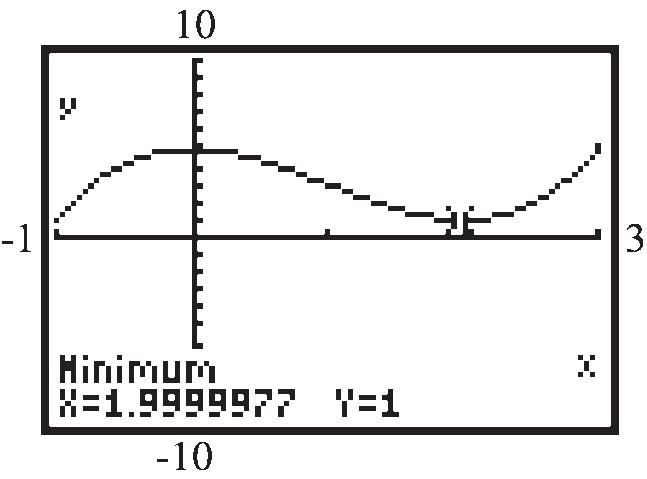
local maximum: (0)5 f
local minimum: (2)1 f
f is increasing on: 1,0 and 2,3 ;
f is decreasing on: 0,2
59. 53fxxx on the interval 2,2
Use MAXIMUM and MINIMUM on the graph of 53 1y xx


local maximum: (0.77)0.19 f
local minimum: (0.77)0.19 f
f is increasing on: 2,0.77 and 0.77,2 ; f is decreasing on: 0.77,0.77
60. 42fxxx on the interval 2,2
Use MAXIMUM and MINIMUM on the graph of 42 1y xx
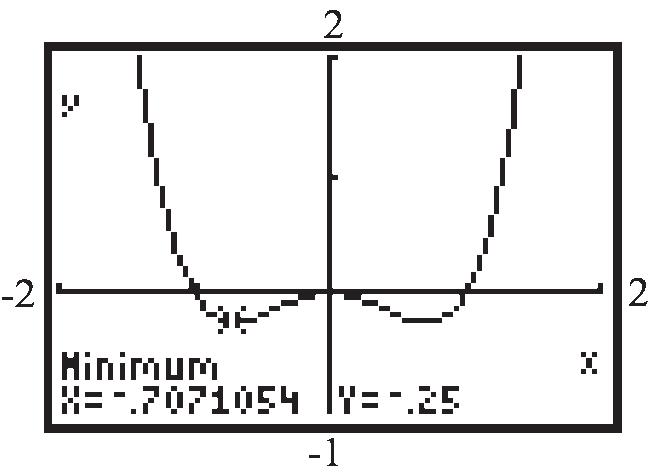
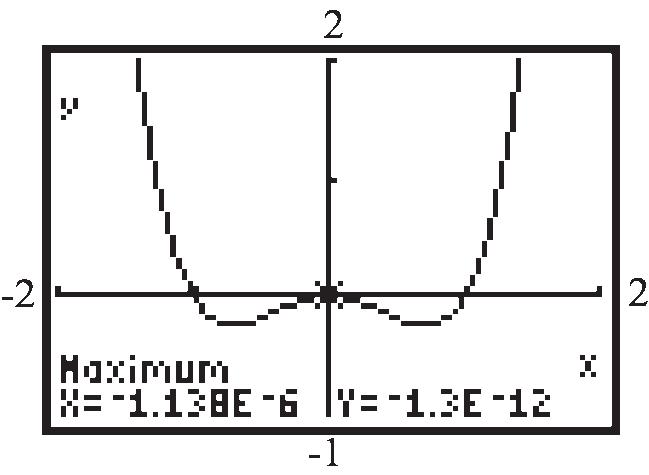

local maximum: (0)0 f
local minimum: (0.71)0.25 f ; (0.71)0.25 f
f is increasing on: 0.71,0 and 0.71,2 ;
f is decreasing on:
2,0.71 and 0,0.71
61. 32 0.20.646fxxxx on the interval 6,4
Use MAXIMUM and MINIMUM on the graph of 32 1 0.20.646yxxx .

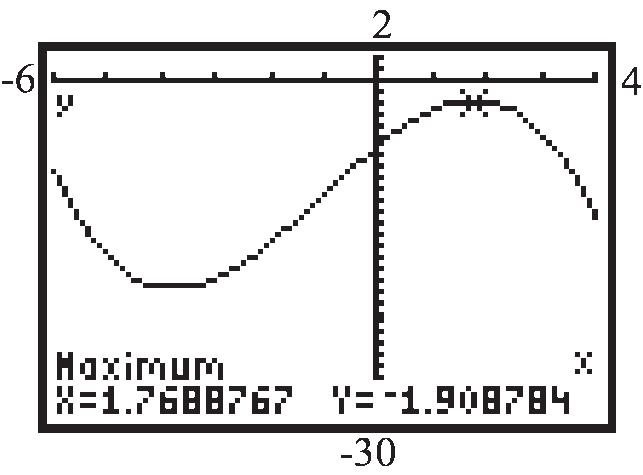
local maximum: (1.77)1.91 f
local minimum: (3.77)18.89 f
f is increasing on: 3.77,1.77 ; f is decreasing on: 6,3.77 and 1.77,4
62. 32 0.40.632fxxxx on the interval 4,5
Use MAXIMUM and MINIMUM on the graph of 32 1 0.40.632yxxx
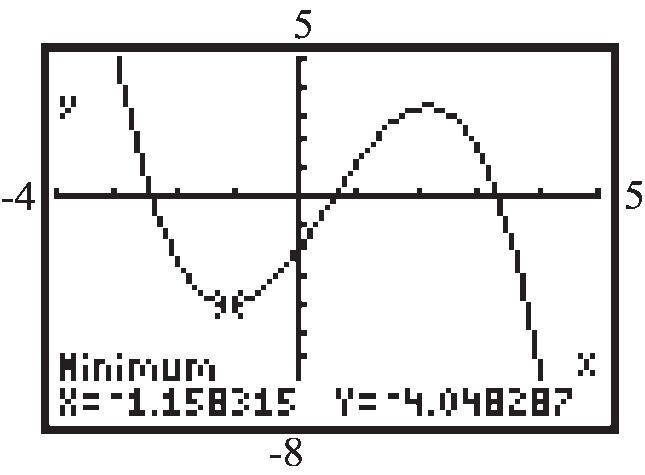
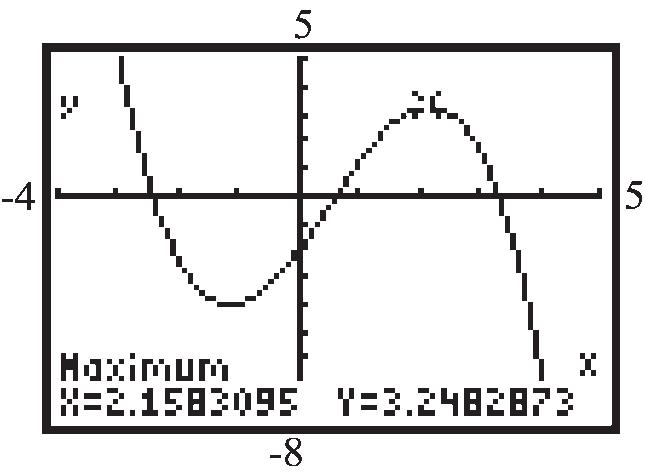
local maximum: (2.16)3.25 f local minimum: (1.16)4.05 f f is increasing on: 1.16,2.16 ; f is decreasing on: 4,1.16 and 2.16,5
63. 432 0.250.30.93fxxxx on the interval 3,2
Use MAXIMUM and MINIMUM on the graph of 432 1 0.250.30.93yxxx .
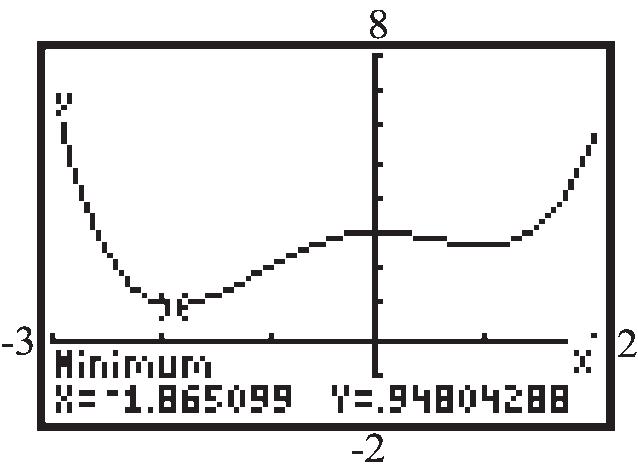
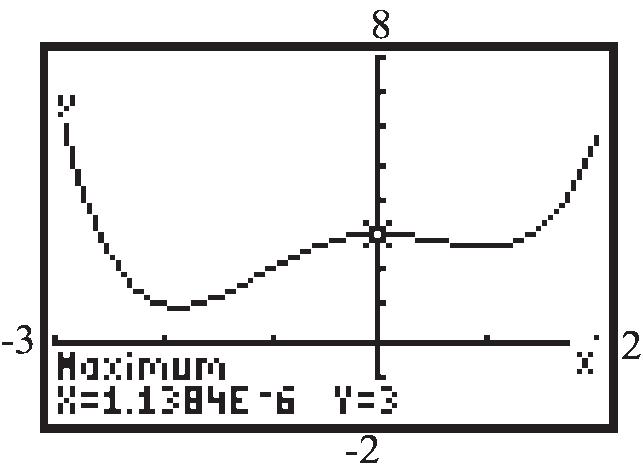
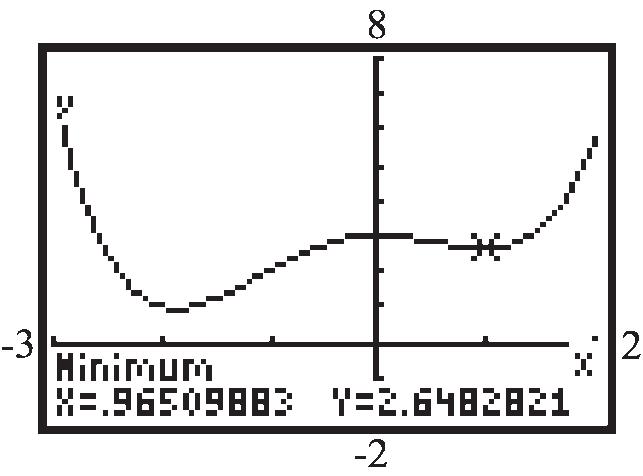
local maximum: (0)3 f local minimum: (1.87)0.95 f , (0.97)2.65 f f is increasing on: 1.87,0 and 0.97,2 ; f is decreasing on: 3,1.87 and 0,0.97
64. 432 0.40.50.82fxxxx on the interval 3,2
Use MAXIMUM and MINIMUM on the graph of 432 1 0.40.50.82yxxx
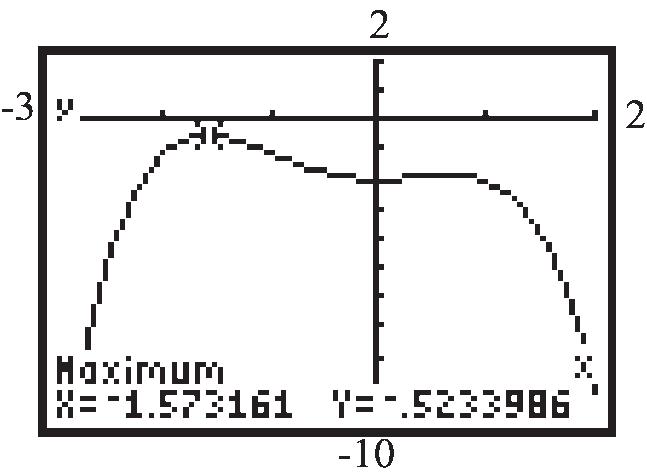
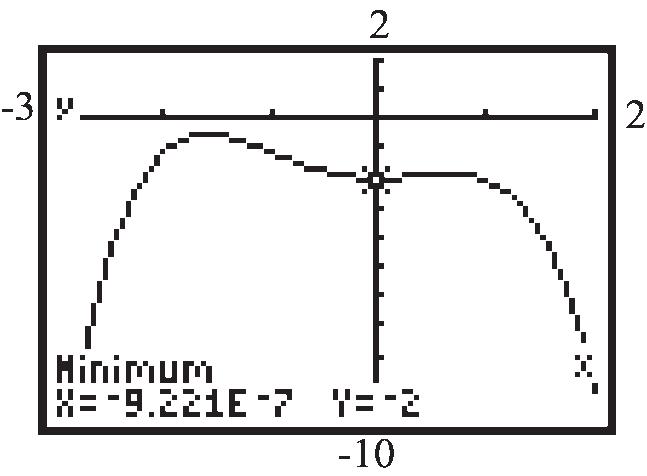
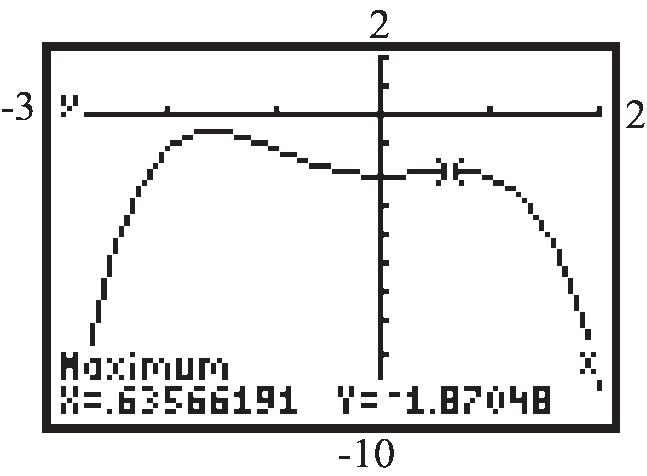
local maxima: (1.57)0.52 f , (0.64)1.87 f
local minimum: 0,2 (0)2 f
f is increasing on:
3,1.57 and 0,0.64 ; f is decreasing on:
1.57,0 and 0.64,2
65. 2 ()24fxx
a. Average rate of change of f from 0 x to 2 x
b. Average rate of change of f from x = 1 to x = 3:
c.
Section 1.3: Properties of Functions
a. Average rate of change of f from x = 0 to x = 2:
b. Average rate of change of f from x = 1 to x = 3:
c. Average rate of change of f from x = –1 to x = 1:
a. Average rate of change of g from 3 x to 2 x
Chapter 1: Functions and Their Graphs
c.
b.
c. Average rate of change of h from 2 x to
a. Average rate of change of f from 1 to 3:
Thus, the average rate of change of f from 1 to 3 is 5.
b. From (a), the slope of the secant line joining
1,1 f and
3,3 f is 5. We use the
point-slope form to find the equation of the secant line:
1sec1 351
70.
41 f xx
a. Average rate of change of f from 2 to 5:
52197 5252 12 4 3 ff
Therefore, the average rate of change of f from 2 to 5 is 4
b. From (a), the slope of the secant line joining 2,2 f and 5,5 f is 4 . We use the point-slope form to find the equation of the secant line:
1sec1 742 748 41 yymxx yx yx yx
71. 2 2 gxx
a. Average rate of change of g from 2 to 1:
12 123 1 3 1212 gg y x
Therefore, the average rate of change of g from 2 to 1 is 1 .
b. From (a), the slope of the secant line joining 2,2 g and 1,1 g is 1 .We use the point-slope form to find the equation of the secant line:
1sec1 212 22 yymxx yx yx yx
72. 2 1 gxx
a. Average rate of change of g from 1 to 2:
21 523 1 3 2121 gg y x
Therefore, the average rate of change of g from 1 to 2 is 1.
b. From (a), the slope of the secant line joining 1,1 g and 2,2 g is 1. We use the point-slope form to find the equation of the secant line:
1sec1 211 21 3 yymxx yx yx yx
73. 2 2 hxxx
a. Average rate of change of h from 2 to 4:
42 808 4 42422 hh y x
Therefore, the average rate of change of h from 2 to 4 is 4.
b. From (a), the slope of the secant line joining
2,2 h and 4,4 h is 4. We use the point-slope form to find the equation of the secant line:
1sec1 042 48 yymxx yx yx
74.
2 2 hxxx
a. Average rate of change from 0 to 3:
75. a. 3 27 g xxx
3 3 3 27 27 27 g xxx xx xx gx
Since g xgx , the function is odd.
b. Since g x is odd then it is symmetric about the origin so there exist a local maximum at 3 x .
3 3(3)27(3)278154 g
So there is a local maximum of 54 at 3 x .
76. 3 12 f xxx
a.
Therefore, the average rate of change of h from 0 to 3 is 5
b. From (a), the slope of the secant line joining 0,(0) h and 3,(3) h is 5 . We use the point-slope form to find the equation of the secant line:
1sec1 050 5 yymxx yx yx
Since f xfx , the function is odd.
b. Since f x is odd then it is symmetric about the origin so there exist a local maximum at 3 x .
3 2(2)12(2)82416 f
So there is a local minimum value of 16 at 2 x .
77. a. Positive
b. Increasing
c. Positive
d. Negative
e. Decreasing
f. Negative
g. 0
78. a. 4 b. 9
79. 4289Fxxx a.
42 4 89 89
Since F xFx , the function is even.
b. Since the function is even, its graph has y-axis symmetry. The second local maximum value is 25 and occurs at 2 x
c. Because the graph has y-axis symmetry, the area under the graph between 0 x and 3 x bounded below by the x-axis is the same as the area under the graph between 3 x and 0 x bounded below the x-axis. Thus, the area is 50.4 square units.
80. 4232144Gxxx
a.
Since
GxGx , the function is even.
b. Since the function is even, its graph has y-axis symmetry. The second local maximum is in quadrant II and is 400 and occurs at 4 x .
c. Because the graph has y-axis symmetry, the area under the graph between 0 x and 6 x bounded below by the x-axis is the same as the area under the graph between 6 x and 0 x bounded below the x-axis. Thus, the area is 1612.8 square units.
81. 2 2500 0.321251Cxxx x
a. 2 1 2500 0.321251

b. Use MINIMUM. Rounding to the nearest whole number, the average cost is
minimized when approximately 10 lawnmowers are produced per hour.

c. The minimum average cost is approximately $239 per mower.
Graph the function on a graphing utility and use the Maximum option from the CALC menu.

The concentration will be highest after about 2.16 hours.
b. Enter the function in Y1 and 0.5 in Y2. Graph the two equations in the same window and use the Intersect option from the CALC menu.


After taking the medication, the woman can feed her child within the first 0.71 hours (about 42 minutes) or after 4.47 hours (about 4hours 28 minutes) have elapsed.
83. a.
On average, the population is increasing at a rate of 0.036 gram per hour from 0 to 2.5 hours.
b.
On average, the population is increasing at a rate of 0.1 gram per hour from 4.5 to 6 hours.
c. The average rate of change is increasing as time passes. This indicates that the population is increasing at an increasing rate.
84. a.
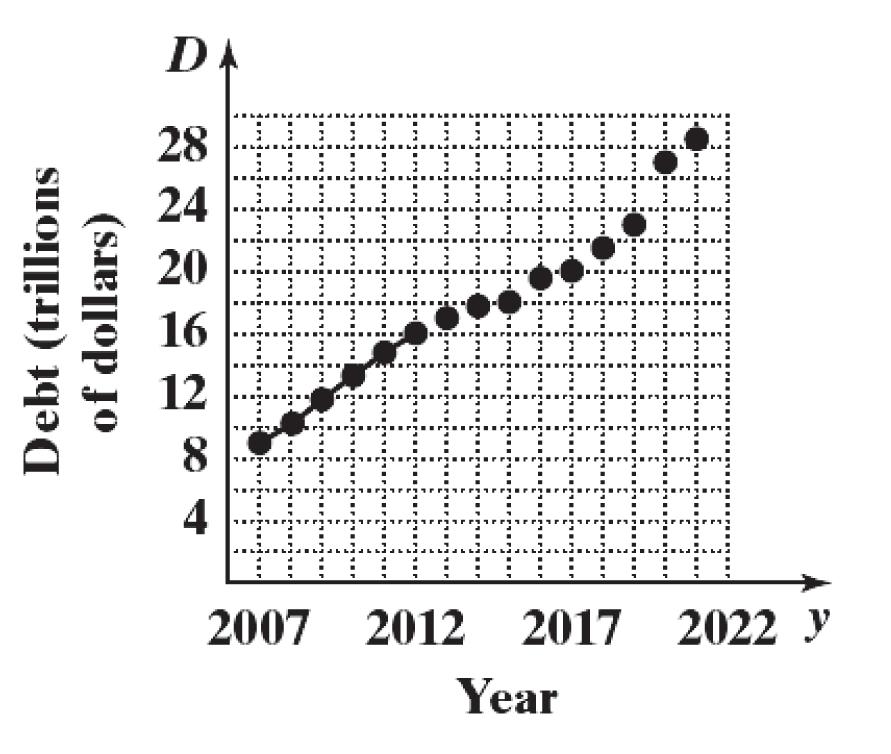
b. The slope represents the average rate of change of the debt from 2007 to 2012.
c.
f. The average rate of change is decreasing as but then exploded after 2019. 85. 2 () f xx
a. Average rate of change of f from 0 x to 1
b. Average rate of change of f from 0 x to 0.5
c.
Chapter 1: Functions and Their Graphs
f. Graphing the secant lines:
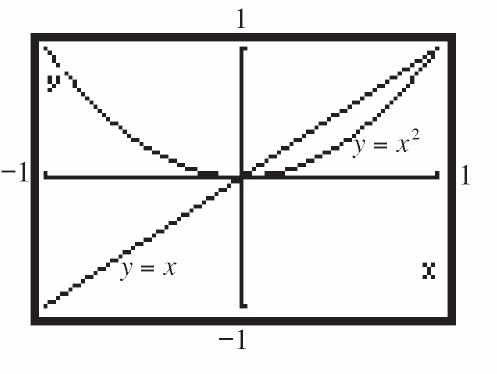
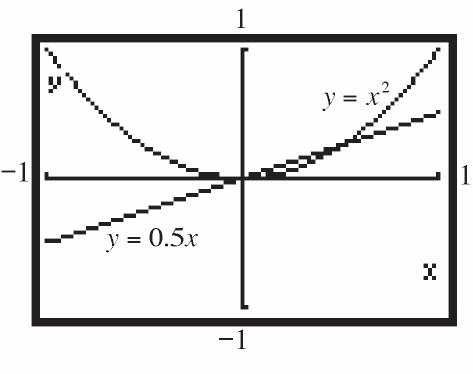
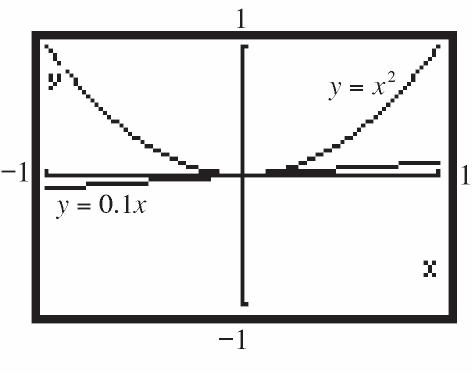

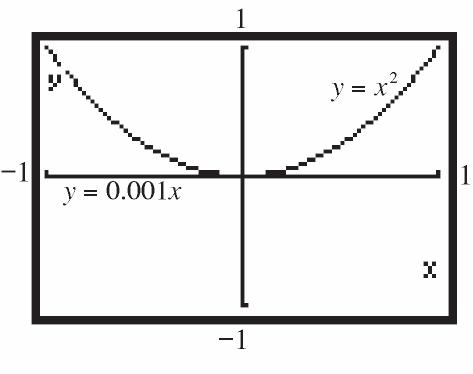
g. The secant lines are beginning to look more and more like the tangent line to the graph of f at the point where 0 x
h. The slopes of the secant lines are getting smaller and smaller. They seem to be approaching the number zero.
86. 2 () f xx
a. Average rate of change of f from 1 x to 2 x : 22 21 213 3 2111 ff
b. Average rate of change of f from 1 x to 1.5 x : 2 1.511.512 1.25 2.5 1.510.50.5 ff
c. Average rate of change of f from 1 x to 1.1 x :
d. Average rate of change of f from 1 x to 1.01 x : 2 1.0111.0112 0.0201 2.01 1.0110.010.01 ff
e. Average rate of change of f from 1 x to 1.001 x :
2 1.00111.00112 1.00110.001 0.002001 2.001 0.001 ff
f. Graphing the secant lines:

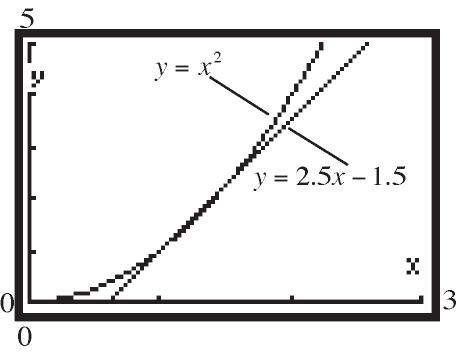
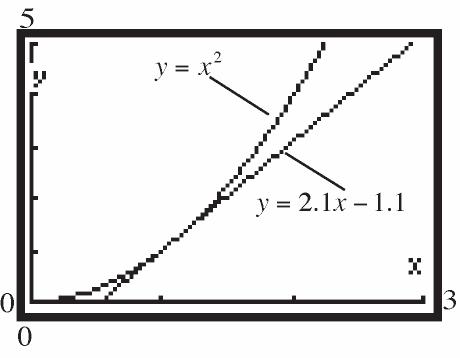
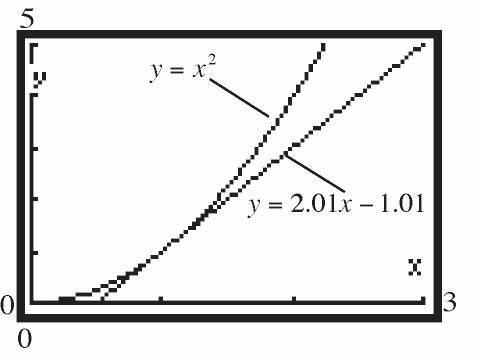
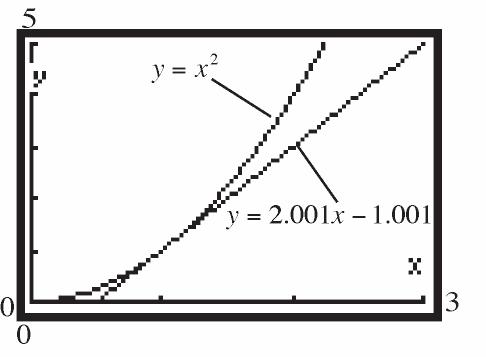
g. The secant lines are beginning to look more and more like the tangent line to the graph of f at the point where 1 x
h. The slopes of the secant lines are getting smaller and smaller. They seem to be approaching the number 2.
87. ()25 f xx
a.
b. When 1 x :
sec 0.52hm
sec 0.12hm
sec 0.012hm
sec as 0, 2 hm
c. Using the point
1,11,7 f and slope, 2 m , we get the secant line:
d. Graphing:
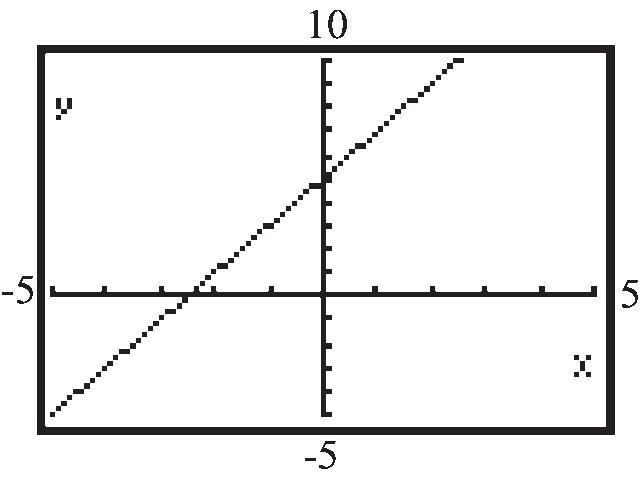
The graph and the secant line coincide.
88. ()32fxx
a. sec ()() 3()2(32) 3 3 fxhfx m h xhx h hh
b. When x = 1, sec 0.53hm sec 0.13hm sec 0.013hm sec as 0, 3 hm
c. Using point 1,11,1 f and slope = 3 , we get the secant line:
131 133 32 yx yx yx
d. Graphing:
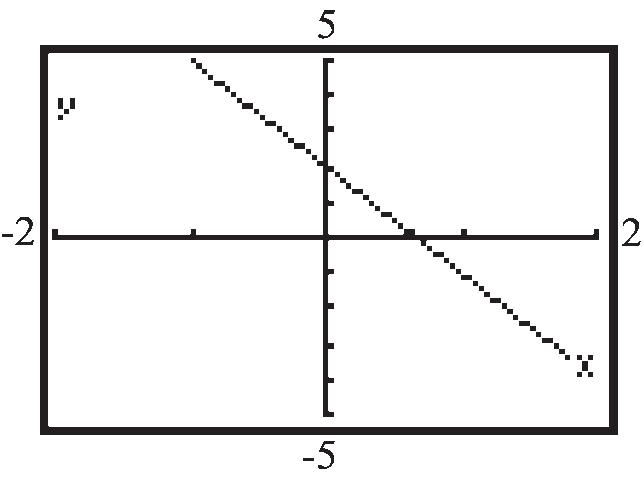
The graph and the secant line coincide.
89. 2 ()2 f xxx
a. sec 22 222 2 ()() ()2()(2) 2222 22 22 fxhfx m h xhxhxx h x xhhxhxx h xhhh h x h
b. When x = 1, sec 0.5210.524.5hm sec 0.1210.124.1hm sec 0.01210.0124.01hm sec as 0, 21024 hm
Chapter 1: Functions and Their Graphs
c. Using point 1,11,3 f and slope = 4.01, we get the secant line:
d. Graphing:

a.
b. When x = 1,
sec 0.54120.516hm sec 0.14120.115.2hm sec 0.014120.0115.02hm sec as 0, 412015 hm
c. Using point 1,11,3 f and slope = 5.02, we get the secant line: 35.021 35.025.02 5.022.02 yx yx yx
d. Graphing:
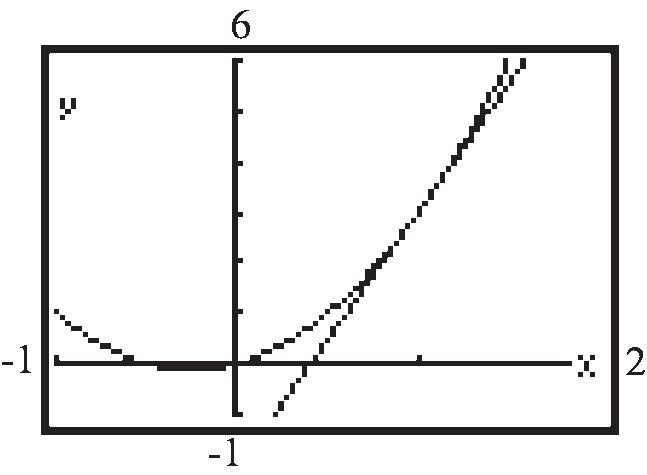
91. 2 ()231 f xxx
a. sec ()() f xhfx m h
222 222 2 2 2 2(2)331231 242331231 231231 423 423 xxhhxhxx h xxhhxhxx h xhxhxx h xhhh h xh
b. When x = 1, sec 0.54120.532hm sec 0.14120.131.2hm sec 0.014120.0131.02hm sec as 0, 412031 hm
c. Using point 1,11,0 f and slope = 1.02, we get the secant line: 01.021 1.021.02 yx yx
d. Graphing:

92. 2 ()32 fxxx
a. sec ()() f xhfx m h
b. When x = 1, sec 0.5210.530.5hm sec 0.1210.130.9hm sec 0.01210.0130.99hm
c. Using point
1,11,0 f and slope = 0.99, we get the secant line:
d. Graphing:
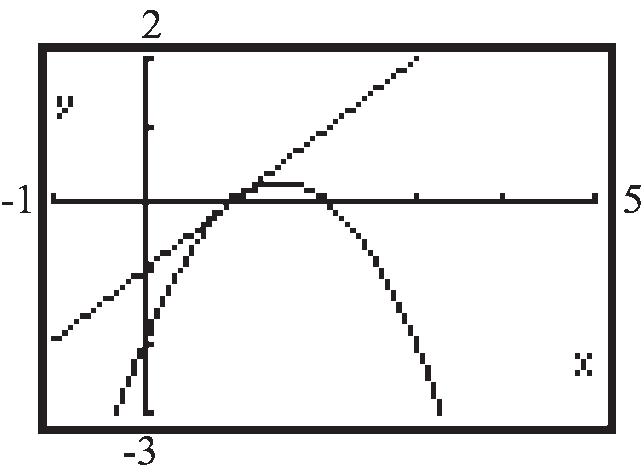
93. 1 ()fx x a.
c. Using
d. Graphing:
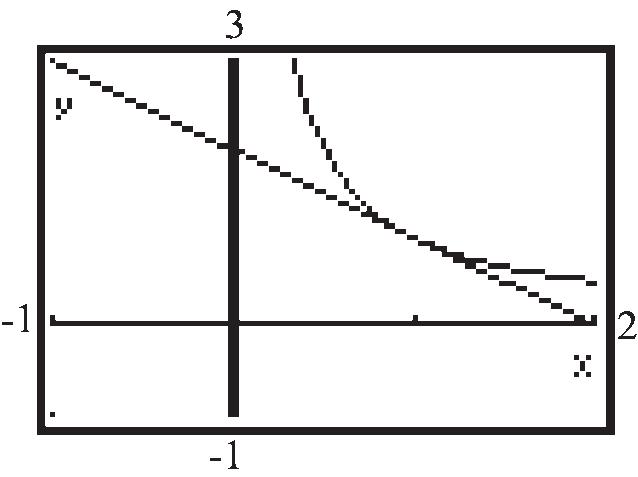
b.
95. 2 2 (2)12 and (1)8, so (2)(1) 12 4 2(1)3 ()4 3414 3450
ff ff fx xx xx 2 444(3)(5) 476 2(3)6 4219219 63 219 2.1 is outside the interval 3 219 .079 is in the interval. 3
x x x The only such number is 219 3 .
96. ()2233
x x gxff . Since f is odd, 33 ()22() 33 so is odd.
So g is odd.
97. a. (0)(100)$0. RR (0)$0 R because if the tax rate is 0%, the federal revenue will be $0. (100)$0 R because if the tax rate is 100%, then people are completely disincentivized to work.
c. Using point
1,11,1 f
and slope = 1.9704 , we get the secant line:
11.97041 11.97041.9704 1.97042.9704 yx yx yx
d. Graphing:
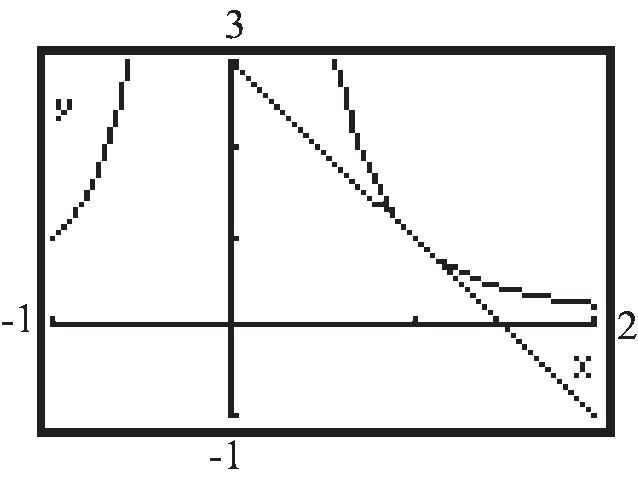
b. Answers may vary, but in all graphs, the maximum tax revenue must occur at some tax rate less than 70%. Draw a continuous function that is skewed right with the maximum value of R being at some tax rate t less than 70%. The function should have intercepts at (0, 0) and (100, 0).
c. The Extreme Value Theorem.
98. Answers will vary. One possibility follows:
Section 1.4: Library of Functions; Piecewise-defined Functions
101. To be an even function we need
and to be an odd function we need
f xfx
0)
2)
3)
6)
99. Answers will vary. See solution to Problem 98 for one possibility.
100. An increasing function is a function whose graph goes up as you read from left to right.
y 33 A decreasing function is a function whose graph goes down as you read from left to right.
. In order for a function be both even and odd, we would need f
This is only possible if 0 fx
102. The graph of 5 y is a horizontal line.
The local maximum is 5 y and it occurs at each x-value in the interval.
103. Not necessarily. It just means 52ff
. The function could have both increasing and decreasing intervals. 104.
.
105. A function that is increasing on an interval can have at most one x-intercept on the interval. The graph of f could not "turn" and cross it again or it would start to decrease.
Section 1.4
1. y x

Chapter 1: Functions and Their Graphs
2. y 1 x
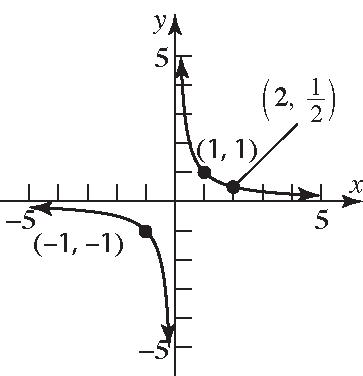
3. y x 3 8
y-intercept:
Let 0 x , then 3 088 y .
x-intercept:
Let 0 y , then 3 3 08 8 2 x x x
The intercepts are 0,8 and 2,0
5. piecewise-defined
6. True
7. False; the cube root function is odd and increasing on the interval ,
8. False; the domain and range of the reciprocal function are both the set of real numbers except for 0.
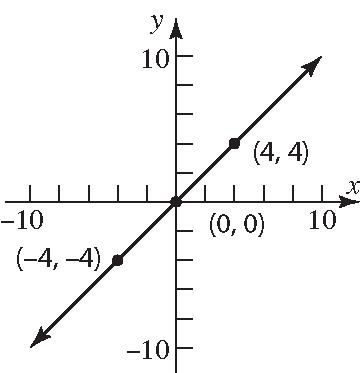
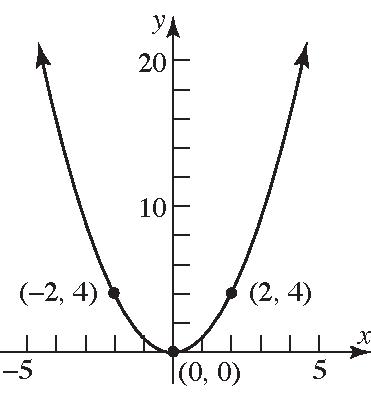
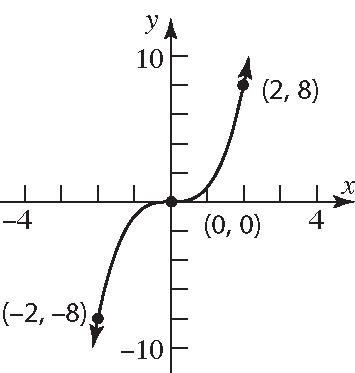

9. b
10. a
11. C
12. A
13. E 14. G 15. B
16. D
17. F
23. 1 fx x 24. f xx


25. 3 () f xx
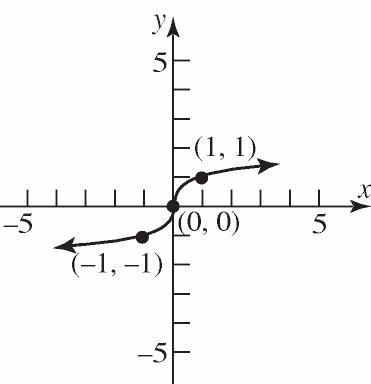
26. 3 fx
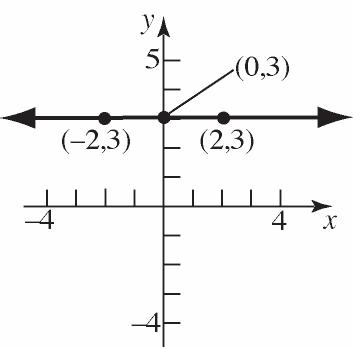
27. a. 2 (3)(3)9 f
b. (0)4 f
Section 1.4: Library of Functions; Piecewise-defined Functions
c. (2)3(3)27 f
28. a. 2326 f
b. 10 f
c. 2 02011 f
29. a. 22240 f
b. 02044 f
c. 12146 f
d. 3 33126 f
30. a. 3 (1)(1)1 f
b. 3 (0)00 f
c. (1)3(1)25 f
d. 333211 f
31. 2if 0 () 1 if 0 xx fx x
a. Domain: is any real number xx
b. x-intercept: none
y-intercept: 01 f
The only intercept is 0,1.
c. Graph:

d. Range: 0 yy ; ,00,
32. 3if 0 () 4 if 0 xx fx x
a. Domain: is any real number xx
b. x-intercept: none
y-intercept: 04 f
The only
c. Graph:
d. Range: 0 yy ;
33. 23if 1 () 32 if 1 x x fx xx
a. Domain: is any real number xx
b. x-intercept: none
y-intercept: 02033 f
The only intercept is 0,3.
c. Graph:

d. Range: 1 yy ; 1,
3if 2 () 23if 2 xx fx xx
a. Domain: is any real number xx
b. 30 3 x x 230 23 3 2 x x x
x-intercepts: 3 3, 2
y-intercept: 02033 f
The intercepts are 3,0 , 3 ,0 2
, and 0,3
c. Graph:
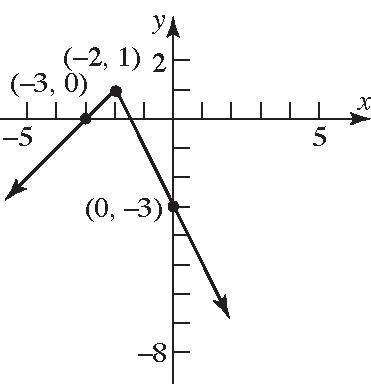
d. Range: 1 yy ; ,1 35. 3if 21 ()5 if 1 2 if 1 x x fxx xx
a. Domain: 2 xx ; 2,
b. 30 3 (not in domain) x x 20 2 2 x x x
x-intercept: 2
y-intercept: 0033 f
The intercepts are 2,0 and 0,3 .
c. Graph:
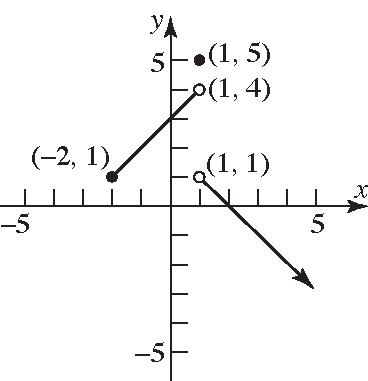
d. Range: 4, 5 yyy
36. 25if 30 ()3 if 0 5 if 0 xx fxx xx
a. Domain: 3 xx ;
b. 250 25 5 2 x x x 50 0 (not in domain of piece) x x
x-intercept: 5 2
y-intercept: 03 f The intercepts are 5 ,0 2
c. Graph:
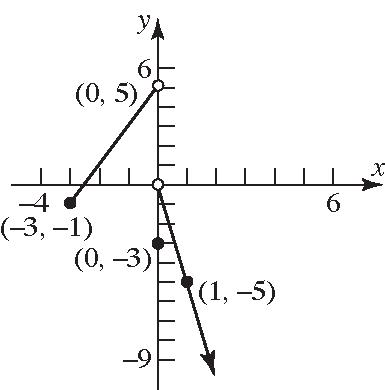
d. Range: 5 yy ; ,5
37. 2 1if 0 () if 0 xx fx xx
and 0,3
Section 1.4: Library of Functions; Piecewise-defined Functions
y-intercept: 2 000 f
The intercepts are 1,0 and 0,0.
c. Graph:
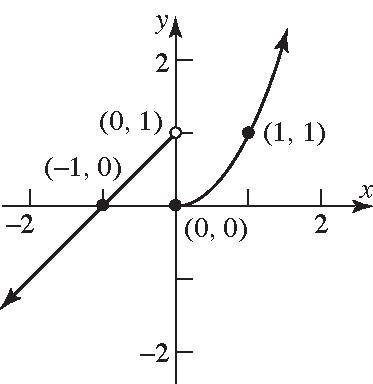
d. Range: is any real number yy
38. 3 1 if 0 () if 0 x x fx xx
a. Domain: is any real number xx
b. 1 0 (no solution) x 3 0 0 x x
x-intercept: 0
y-intercept: 3 000 f
The only intercept is 0,0.
c. Graph:

d. Range: is any real number yy
39. 3 if 20 () if 0 xx fx xx
a. Domain: is any real number xx
b. 10 1 x x 2 0 0 x x x-intercepts: 1,0
a. Domain: 20 and 0 xxx or |2,0xxx ; 2,00,
Chapter 1: Functions and Their Graphs
b. x-intercept: none
There are no x-intercepts since there are no values for x such that 0 fx
y-intercept: There is no y-intercept since 0 x is not in the domain.
c. Graph:
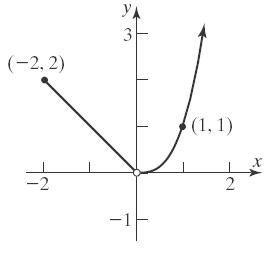
d. Range: 0 yy ; 0,
40. 2if 31 () if 1 x x fx xx
a. Domain: 31 and 1 xxx or |3,1xxx ; 3,11,
b. 20 2 x x 0 0 (not in domain of piece) x x no x-intercepts y-intercept: 0202 f The intercept is 0,2.
c. Graph: y 5 x 5 5 5 (3, 5) (0, 2) (4, 2)
d. Range: 1 yy ; 1,
xx fxxx
41. 2 if 02 ()2 if 25 7 if 5
a. Domain: 0 xx ; 0,
b. 2 0 0 (not in domain of piece) x x 20 2 (not in domain of piece) x x 70 (not possible)
No intercepts.
c. Graph:
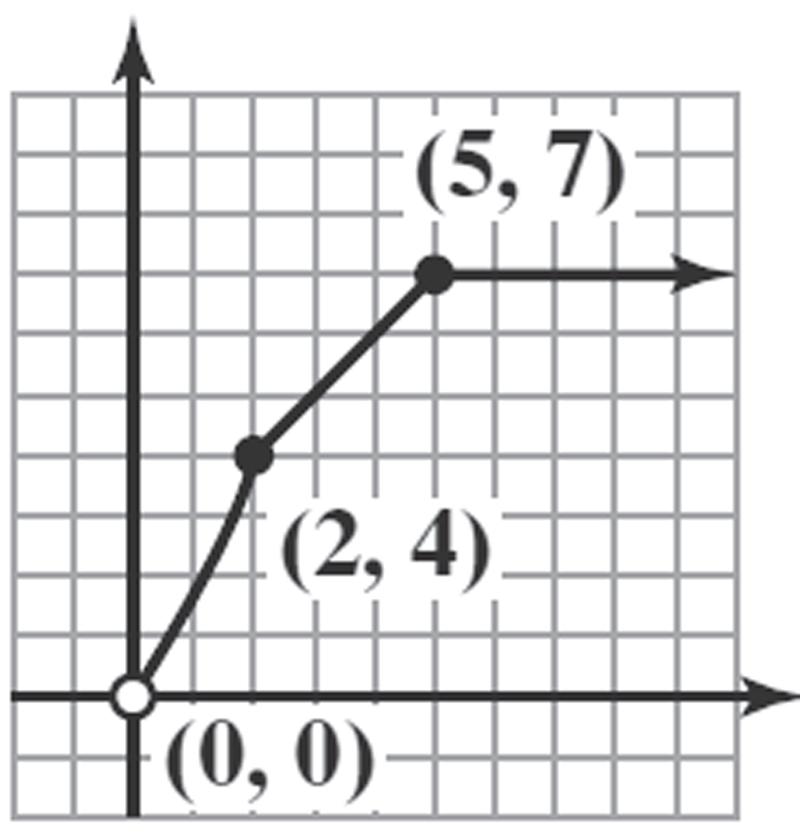
d. Range: 07 yy ; 0,7
42. 2 35 if 30 ()5 if 02 1 if 2
xx fxx xx
a. Domain: 3 xx ; 3, .
b. 350 5 3 x x 50 (not possible) 2 2 10 1 (not possible) x x
x-intercept: 5 3
y-intercept: 05 f
The intercepts are 5 (0,5) and ,0 3
c. Graph:

d. Range: 4,
43. Answers may vary. One possibility follows: if 10 () 1 if 02 2 xx fx xx
44. Answers may vary. One possibility follows: if 10 () 1 if 02 xx fx x
45. Answers may vary. One possibility follows: if 0 () 2 if 02 xx fx xx
46. Answers may vary. One possibility follows: 22 if 10 () if 0 xx fx xx
47. a.
b.
(1.7)int2(1.7)int(3.4)3 f
(2.8)int2(2.8)int(5.6)5
(3.6)int2(3.6)int(7.2)8 f
48. a. 1.2 (1.2)intint(0.6)0 2 f
b. 1.6 (1.6)intint(0.8)0 2 f
c. 1.8 (1.8)intint(0.9)1 2 f
49. a.

b. The domain is 0,6 .
c. Absolute max: (2)6 f
Absolute min: (6)2 f
50. a.
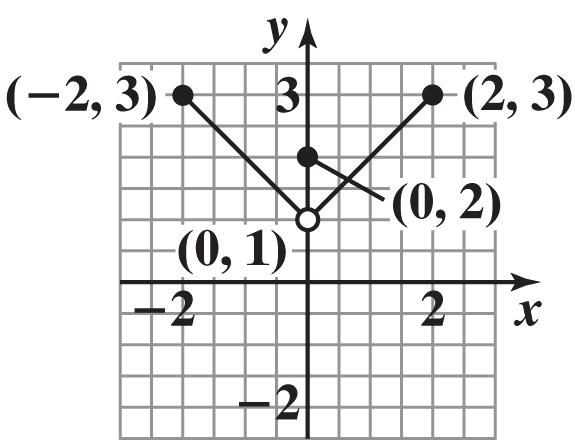
b. The domain is 2,2 . c. Absolute max: (2)(2)3ff Absolute min: none
51. 34.99 if 03 1510.01 if 3 x C xx
a. 2$34.99 C
b. 515510.01$64.99 C
c. 13151310.01$184.99 C
52.
xx Fxxx x a. 223int(12)5 F
23int104 29int349 74924
Parking for 2 hours costs $5.
b. 729int3738 F
Parking for 7 hours costs $38.
Chapter 1: Functions and Their Graphs
c. 1574 F
Parking for 15 hours costs $74.
d. 1 hr 24 min0.4 hr 60 min
8.429int38.429(6)56 F
Parking for 8 hours and 24 minutes costs $56.
53. a. Charge for 20 therms:
22.000.24863(20)
$26.97
b. Charge for 100 therms:
0.30123(50) $49.49 C
22.000.24863(50)
c. For 050 x : 22.000.24863 Cx For 50 x :
0.3012319.37 Cx x x
22.000.3012350
0.24863(50)
22.000.3012315.0615 12.4315
The monthly charge function: 22.000.24863 if 050 0.3012319.37 if 50 xx
xx
d. Graph:
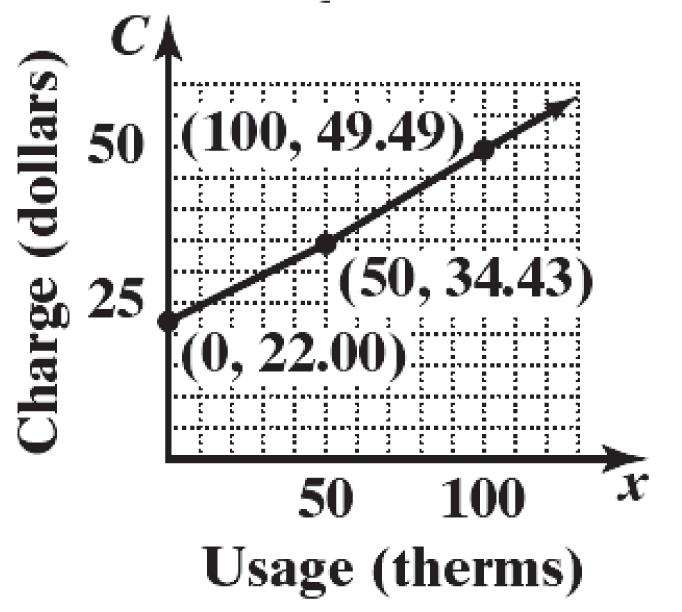
54. a. Charge for 1000 therms:
C
90.000.1201(150)0.0549(850) 0.55(1000)
$704.68
b. Charge for 6000 therms: 90.000.1201(150)0.0549(4850) +0.048210000.35(6000)
C
$3722.48
c. For 0150 x : 90.000.12010.55
0.670190.00 Cxx x
For 1505000 x :
90.000.12011500.0549150 0.55 90.0018.0150.05498.235 0.55 0.604999.78 Cx x x x x
For 5000 x :
C xx x x x
90.000.12011500.05494850 0.048250000.55
90.0018.015266.2650.0482241 0.55 0.5982133.28
The monthly charge function:
Cxxx xx
0.670190.00if0150 0.604999.78if1505000 0.5982133.28if5000
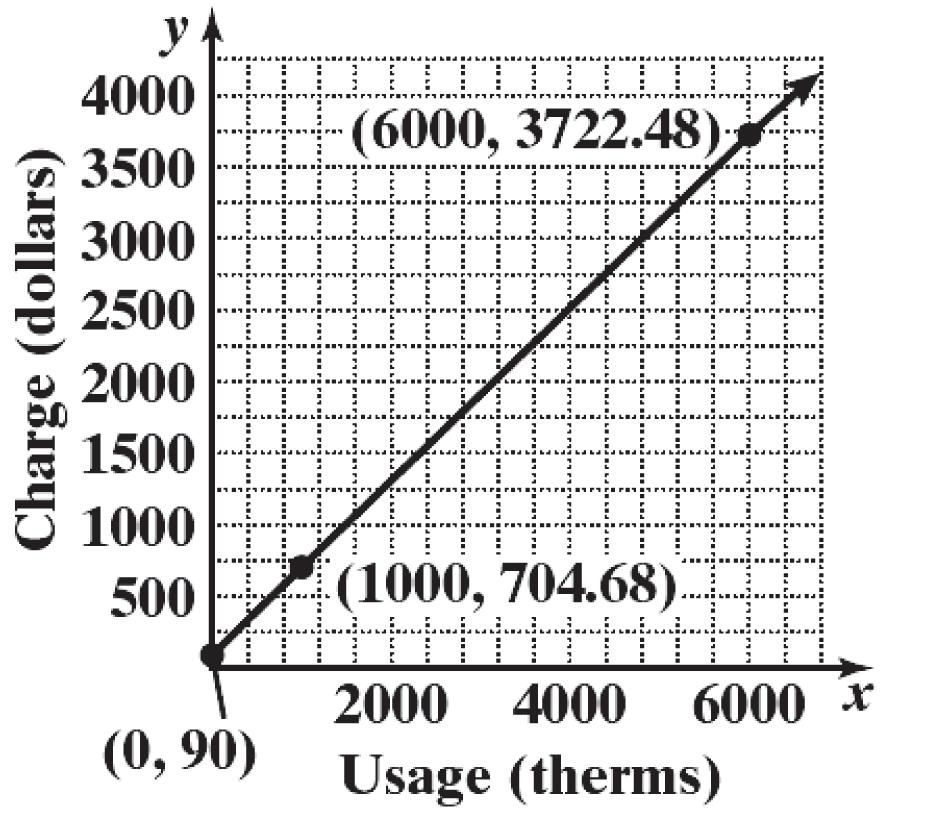
Section 1.4: Library of Functions; Piecewise-defined Functions
55. For schedule X:
0.10if 010,275
1,027.500.12(10,275)if 10,27541,775
4,807.500.22(41,775)if 41,77589,075 () 15,213.500.24(89,075)if 89,075170,050
34,647.500.32(170,050)
49,335.500.35(215,9
162,718.500.37(539,900)if 539,900 x x
if 170,050215,950 50) if 215,950539,900
56. For Schedule Y1 : 0.10if 020,550
2,055.000.12(20,550)if 20,55083,550
9,615.000.22(83,550)if 83,550178,150
() 30,427.000.24(178,150)if 178,150340,100
69,295.000.32(340,100)
98,671.000.35(43 xx
174,253.500.37(647,850)if 647,850 x x xx
if 340,100431,900 1,900) if 431,900647,850
57. a. Let x represent the number of miles and C be the cost of transportation. 0.50 if 0100
0.50(100)0.40(100) if 100400 ()
0.50(100)0.40(300)0.25(400) if 400800
0.50(100)0.40(300)0.25(400)0(800) if 800960
0.50if 0100
100.40if 100400 () 700.25if 400800
if 800960
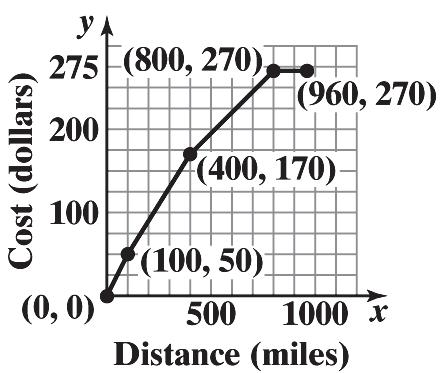
b. For hauls between 100 and 400 miles the cost is:
c. For hauls between 400 and 800 miles the cost is:
58. Let x = number of days car is used. The cost of renting is given by
185 if 7
222 if 78
259 if 89
296 if 910
333 if 1011
370 if 1114 x x x

59. a. Let s = the credit score of an individual who wishes to borrow $300,000 with an 80% LTV ratio. The adverse market delivery charge is given by
9000 if 659
8250 if 660679
5250 if 680699
3750 if 700719
2250 if 720739
1500 if 740
b. 725 is between 720 and 739 so the charge would be $2250.
c. 670 is between 660 and 679 so the charge would be $8250.
60. Let x = the amount of the bill in dollars. The minimum payment due is given by
if 010
10 if 10500
30 if 5001000
50 if 10001500 70 if 1500 xx x fxx x x
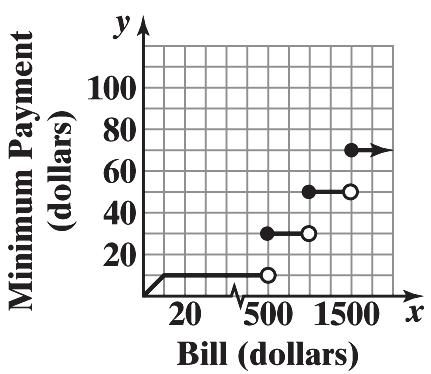
61.
e. When 01.79 v , the wind speed is so small that there is no effect on the temperature.
f. When the wind speed exceeds 20, the wind chill depends only on the air temperature.
62. a. 10 WC
b.
c.
10.451015153310 33 22.04 34 W C
331.5958331036 WC
63. Let x = the number of ounces and Cx = the postage due.
For 01 x : $1.16 Cx For 12 x : 1.160.2$1.36 Cx
For 23 x : 1.1620.2$1.56 Cx
For 34 x : 1.1630.2$1.76 Cx
Section 1.4: Library of Functions; Piecewise-defined Functions
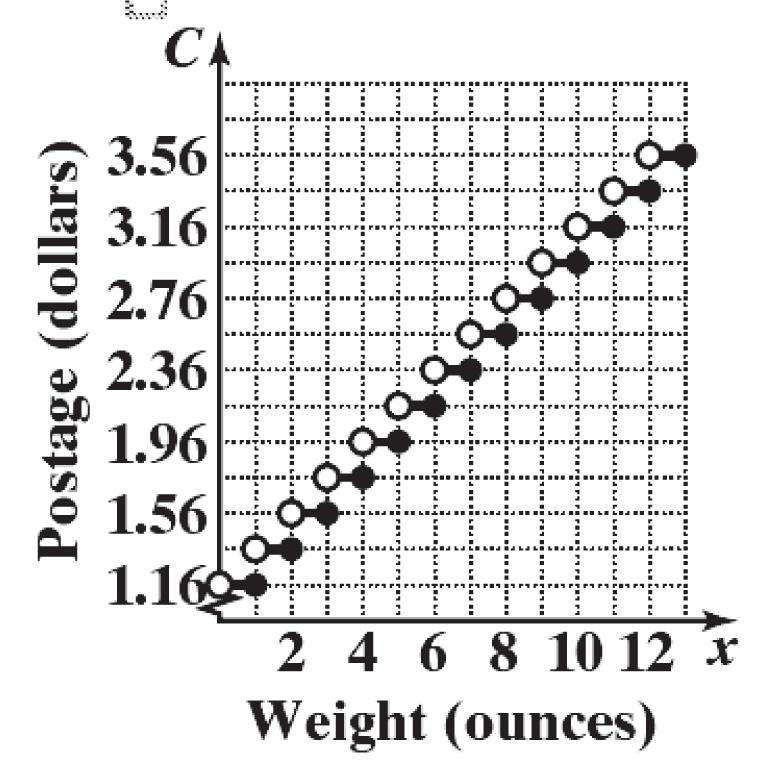
64. Use intervals
0,8,8,16,16,32,32,38 (exclude 0 and 38 since those would be the walls). Depth for the intervals
8,16 and 32,38 are constant (8 ft and 3 ft respectively). The other two are linear functions. On 0,8 the endpoint coordinates can be thought or as 0,3 and 8,8 8355 3 8088 myx
On 16,32 the endpoint coordinates can be thought of as 16,8 and 32,3 . 385 321616 5 8(16) 16 13 5 13 16
65. The function f changes definition at 2 and the function g changes definition at 0. Combining these together, the sum function will change definitions at 0 and 2.
On the interval ,0 : ()()()()(23)(41) 24 fgxfxgxxx x .
On the interval 0,2 : ()()()(23)(7) 34 fgxfxgxxx x
On the interval 2, : 2 2 ()()()()(5)(7) 67 fgxfxgxxxx xx
So, 2 24if0 ()34if02 67if2
66. Each graph is that of 2 y x , but shifted vertically.
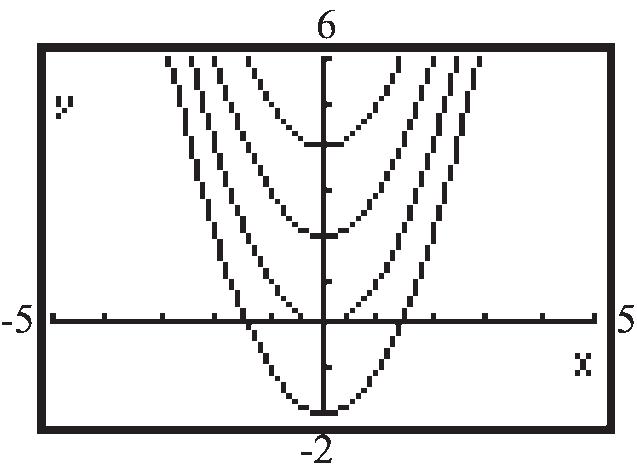
If 2 ,0yxkk , the shift is up k units; if 2 ,0yxkk , the shift is down k units. The graph of 2 4 yx is the same as the graph of 2 y x , but shifted down 4 units. The graph of 2 5 yx is the graph of 2 y x , but shifted up 5 units.
67. Each graph is that of 2 y x , but shifted horizontally.
xx x dx xx x
m b b yx Therefore, 5 3 if 08 8 8 if 816 () 5 13 if 1632 16 3 if 3238
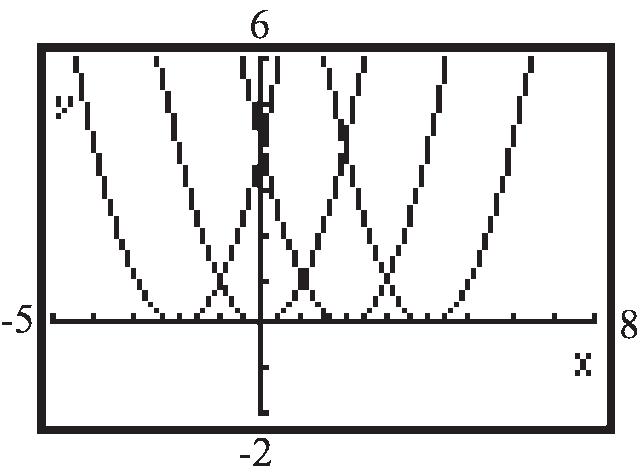
If 2 (),0yxkk , the shift is to the right k units; if 2 (),0yxkk , the shift is to the
Chapter 1: Functions and Their Graphs
left k units. The graph of 2 (4)yx is the same as the graph of 2 y x , but shifted to the left 4 units. The graph of 2 (5)yx is the graph of 2 y x , but shifted to the right 5 units.
68. Each graph is that of y x , but either compressed or stretched vertically.
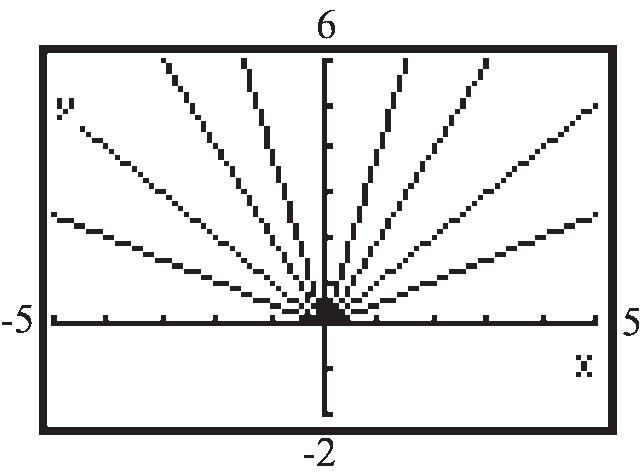
If y kx and 1 k , the graph is stretched vertically; if and 01ykxk , the graph is compressed vertically. The graph of 1 4 yx is the same as the graph of y x , but compressed vertically. The graph of 5 y x is the same as the graph of y x , but stretched vertically.
69. The graph of 2 y x is the reflection of the graph of 2 y x about the x-axis.

The graph of y x is the reflection of the graph of y x about the x-axis.
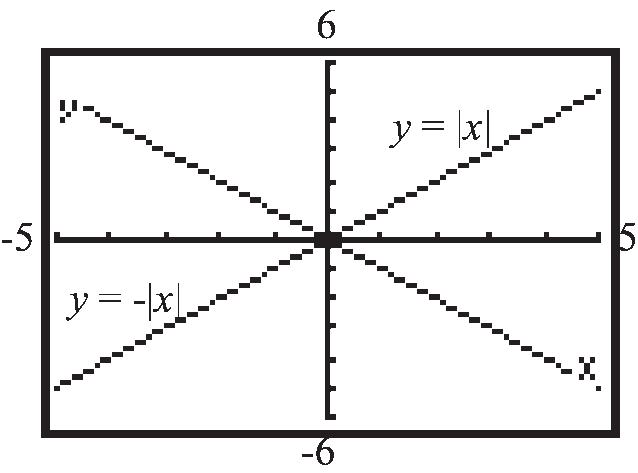
Multiplying a function by –1 causes the graph to be a reflection about the x-axis of the original function's graph.
70. The graph of y x is the reflection about the y-axis of the graph of y x

y x
The same type of reflection occurs when graphing 21 and 2()1yxyx
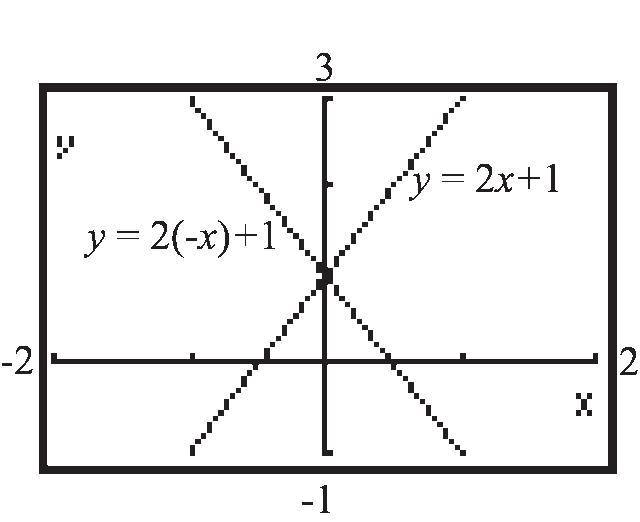
The graph of ()yfx is the reflection about the y-axis of the graph of ()yfx
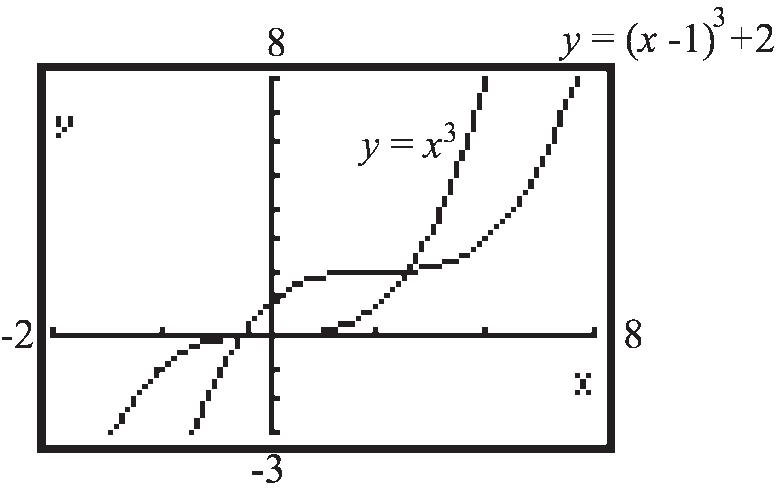
71. The graph of 3 (1)2yx is a shifting of the graph of 3 y x one unit to the right and two units up. Yes, the result could be predicted.
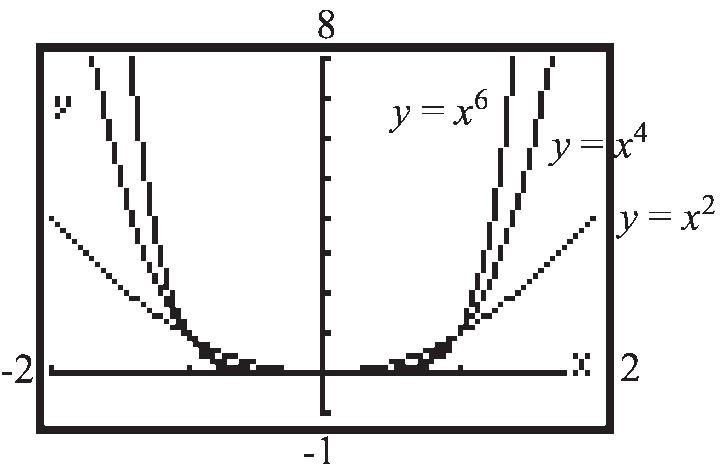
72. The graphs of , n y x n a positive even integer, are all U-shaped and open upward. All go through the points (1,1) , (0,0) , and (1,1) . As n increases, the graph of the function is narrower for 1 x and flatter for 1 x
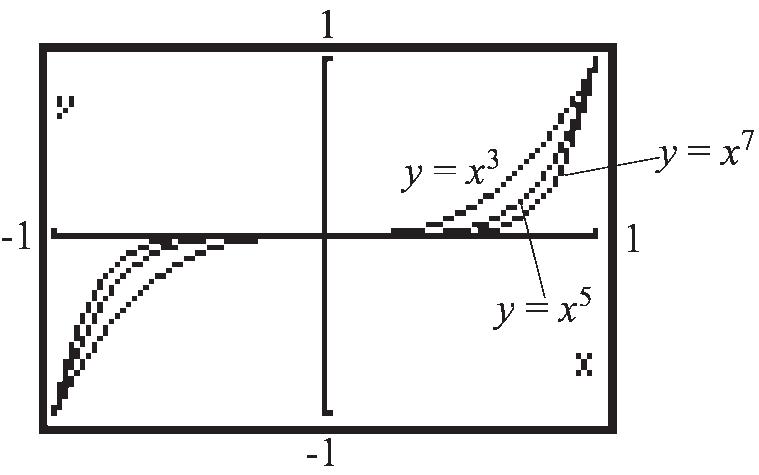
73. The graphs of , n y x n a positive odd integer, all have the same general shape. All go through the points (1,1) , (0,0) , and (1,1) . As n increases, the graph of the function increases at a greater rate for 1 x and is flatter around 0 for
1 x
74. 1 if is rational 0 if is irrational x fx x
Yes, it is a function.
Domain = is any real number xx or ,
Range = {0, 1} or |0 or 1 yyy
y-intercept: 0 is rational1xxy
So the y-intercept is 1 y
x-intercept: 0 is irrational yx
So the graph has infinitely many x-intercepts, namely, there is an x-intercept at each irrational value of x
1 f xfx when x is rational; 0 f xfx when x is irrational.
Thus, f is even.
The graph of f consists of 2 infinite clusters of distinct points, extending horizontally in both
Section 1.5: Graphing Techniques: Transformations
directions. One cluster is located 1 unit above the x-axis, and the other is located along the x-axis.
75. Answers will vary.
Section 1.5
1. a. vertically; up
b. vertically; down c. (2,6)
d. (3,5)
2. a. horizontally; up
b. horizontally; down c. (6,4)
d. (1,2)
3. a. a; vertically; stretched b. a; vertically; compressed c. (2,12)
d. (5,4)
4. a. 1 a ; horizontal; compression
b. 1 a ; horizontal; stretch
c. (4,5)
d. (12,2)
5. horizontal; right
6. y
7. False
8. True; the graph of y fx is the reflection about the x-axis of the graph of y fx
9. d 10. b 11. B 12. E 13. H 14. D
15. I
16. A
17. L
18. C
19. F
20. J
21. G
22. K
23. (4)3yx
24. (4)3yx
25. 3 4 yx 26. 3 4 yx
31. 3 3 28 yxx
32. 3 1 4 yx
33. (1)2 yx
34. (1) y x
(3)32
35. (1)3 y x (2)34 (3)354
36. (1)2 yx (2)2 (3)(3)232 yx yxx
37. (c); To go from y fx to y fx we reflect about the x-axis. This means we change the sign of the y-coordinate for each point on the graph of ()yfx . Thus, the point (3,6) would become 3,6 .
38. (d); To go from y fx to y fx , we reflect each point on the graph of y fx about the y-axis. This means we change the sign of the x-coordinate for each point on the graph of y fx . Thus, the point 3,6 would become 3,6
39. (c); To go from y fx to 2 y fx , we stretch vertically by a factor of 2. Multiply the y-coordinate of each point on the graph of y fx by 2. Thus, the point 1,3 would become 1,6
40. (c); To go from y fx to 2 y fx , we compress horizontally by a factor of 2. Divide the x-coordinate of each point on the graph of y fx by 2. Thus, the point 4,2 would become 2,2 .
41. 2 ()1fxx
Using the graph of 2 y x , vertically shift downward 1 unit.
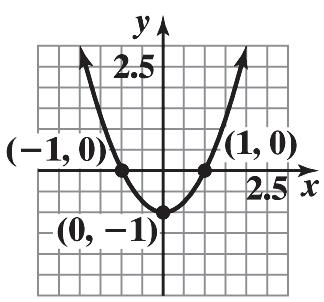
The domain is , and the range is 1, .
42. 2 ()4fxx
Using the graph of 2 y x , vertically shift upward 4 units.
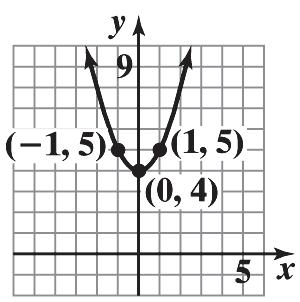
The domain is , and the range is 4, .
43. ()3 g xx
Using the graph of y x , horizontally compress by a factor of 3.
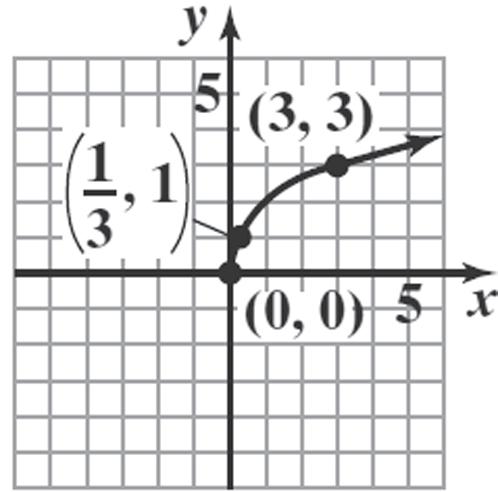
The domain is 0,
and the range is
44. 3 1 () 2 g xx
Using the graph of 3 y x , horizontally stretch by a factor of ½.
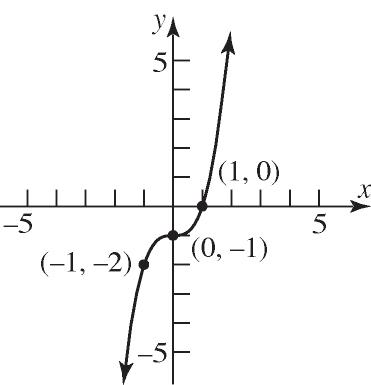
The domain is , and the range is
, .
Section 1.5: Graphing Techniques: Transformations

45. ()2hxx
Using the graph of y x , horizontally shift to the left 2 units.

The domain is 2,
and the range is
0,
.
46. ()1hxx
Using the graph of y x , horizontally shift to the left 1 unit.
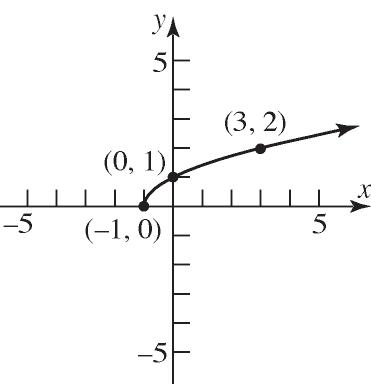
The domain is 1,
and the range is
0,
47. 3 ()(1)2fxx
Using the graph of 3 y x , horizontally shift to the right 1 unit
3 1 yx
, then vertically shift up 2 units
3 12 yx
.
Chapter 1: Functions and Their Graphs
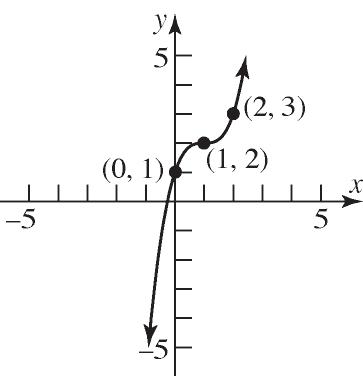
The domain is , and the range is
48. 3 ()(2)3fxx
Using the graph of 3 y x , horizontally shift to the left 2 units
3 2 yx
, then vertically shift down 3 units
3 23 yx
.
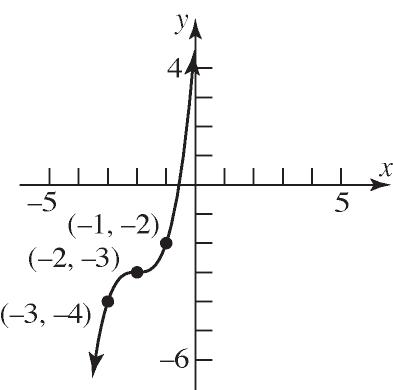
The domain is , and the range is
,
49. ()4 g xx
Using the graph of y x , vertically stretch by a factor of 4.

The domain is 0,
and the range is
0,
.
50. 1 () 2 g xx
Using the graph of y x , vertically compress by a factor of 1 2
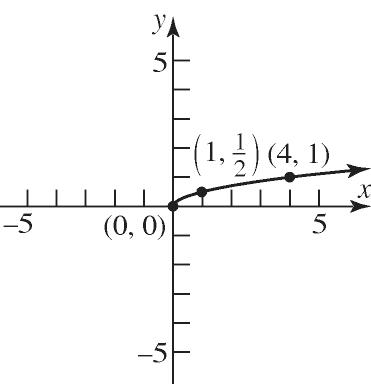
The domain is 0, and the range is 0,
51. 3 () f xx
Using the graph of 3 y x , reflect the graph about the x-axis.
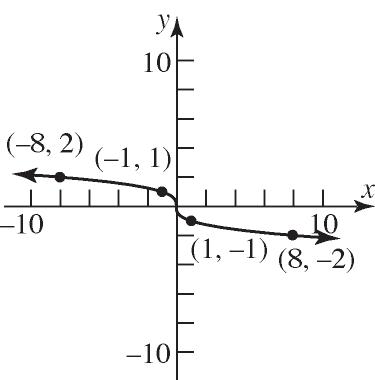
The domain is , and the range is ,
52. () f xx
Using the graph of y x , reflect the graph about the x-axis.

The domain is 0, and the range is ,0
.
53. 2 ()2(1)3fxx
Using the graph of 2 y x , horizontally shift to the left 1 unit 2 1 yx
, vertically stretch by a factor of 2
2 21yx
, and then vertically shift downward 3 units
2 213yx
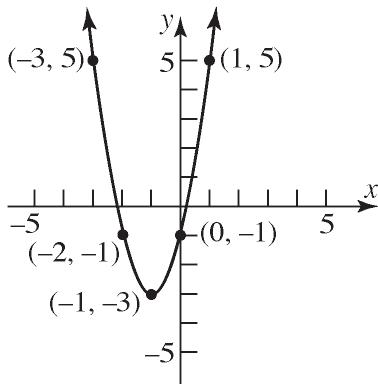
The domain is , and the range is
3,
54. 2 ()3(2)1fxx
Using the graph of 2 y x , horizontally shift to the right 2 units 2 2 yx
, vertically stretch by a factor of 3
2 32yx
, and then vertically shift upward 1 unit
2 321yx
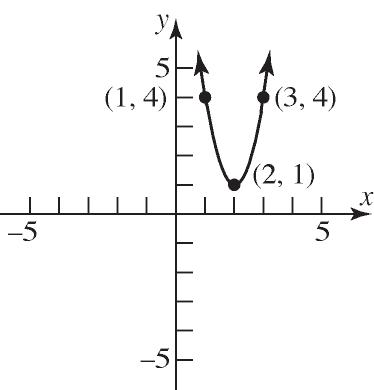
The domain is , and the range is 1,
.
Section 1.5: Graphing Techniques: Transformations
55. ()221gxx
Using the graph of y x , horizontally shift to the right 2 units 2 yx , vertically stretch by a factor of 2 22yx , and vertically shift upward 1 unit 221yx
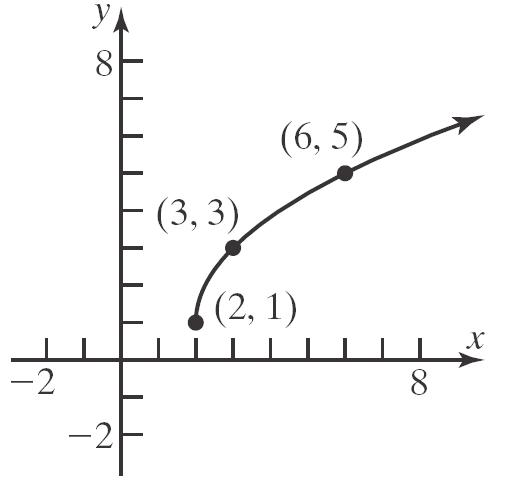
The domain is 2, and the range is 1, .
56. ()313gxx
Using the graph of y x , horizontally shift to the left 1 unit 1 yx , vertically stretch by a factor of 3 31yx , and vertically shift downward 3 units 313yx .

The domain is , and the range is 3,
Chapter 1: Functions and Their Graphs
57. ()2hxx
Using the graph of y x , reflect the graph about the y-axis yx
and vertically shift downward 2 units 2 yx
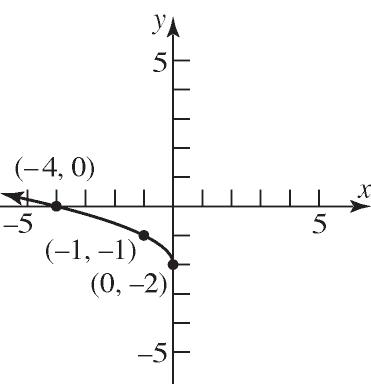
The domain is ,0
and the range is 2,
58. 41 ()242hx xx
Stretch the graph of 1 y x vertically by a factor of 4 14 4 y x x
and vertically shift upward 2 units 4 2 y x
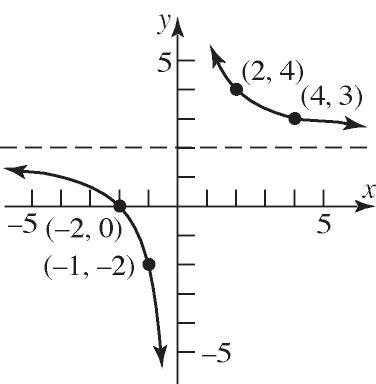
The domain is ,00, and the range is
,22,
59. 3 ()(1)1fxx
Using the graph of 3 y x , horizontally shift to the left 1 unit
3 1 yx
, reflect the graph about the x-axis
3 1 yx
, and vertically shift downward 1 unit
3 11 yx
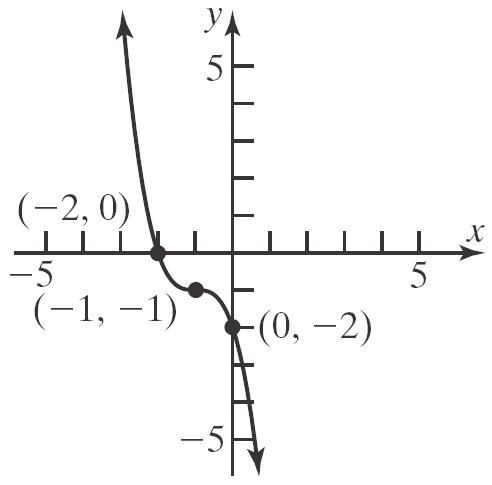
The domain is , and the range is , .
60. ()41 f xx
Using the graph of y x , horizontally shift to the right 1 unit 1 yx
, reflect the graph about the x-axis 1 yx
, and stretch vertically by a factor of 4 41yx .
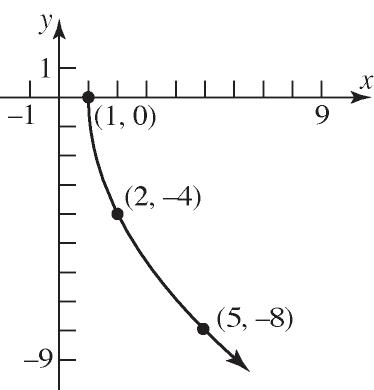
The domain is 1, and the range is ,0 .
61. ()212121 gxxxx
Using the graph of y x , horizontally shift to the right 1 unit 1 yx , and vertically stretch by a factor or 2 21yx .
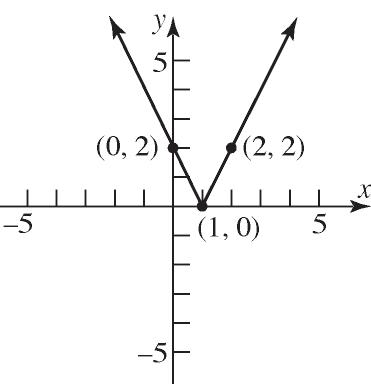
The domain is , and the range is 0, .
62. ()424(2) gxxx
Using the graph of y x , reflect the graph about the y-axis yx , horizontally shift to the right 2 units 2 yx , and vertically stretch by a factor of 4
42yx
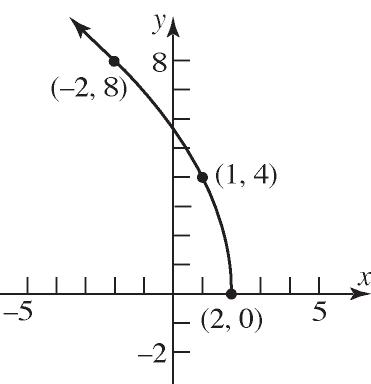
The domain is ,2 and the range is 0,
63. 1 () 2 hx x
Using the graph of 1 y x , vertically compress by a factor of 1 2
Section 1.5: Graphing Techniques: Transformations
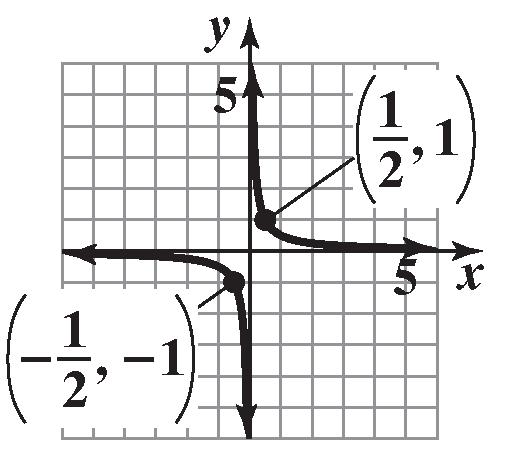
The domain is ,00, and the range is ,00,
64. 3 ()13fxx
Using the graph of 3 () f xx , horizontally shift to the right 1 unit 3 1 yx , then vertically shift up 3 units 3 13 yx .
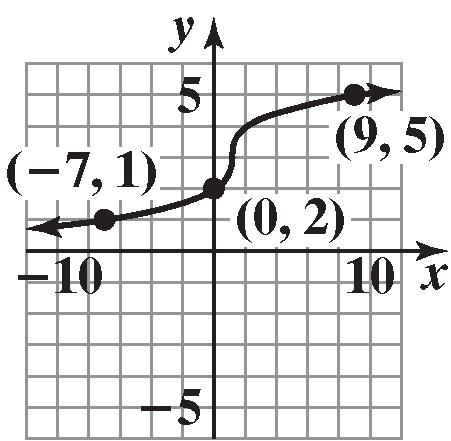
The domain is , and the range is ,
65. a. ()()3Fxfx Shift up 3 units.
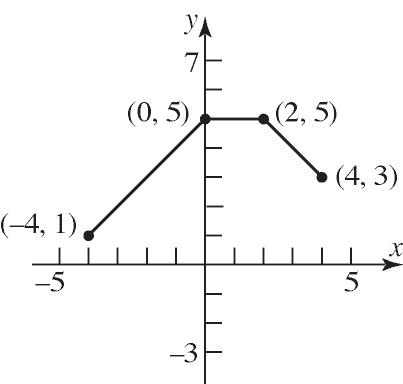
Chapter 1: Functions and Their Graphs
b. ()(2)Gxfx Shift left 2 units.

c. ()() Pxfx Reflect about the x-axis.
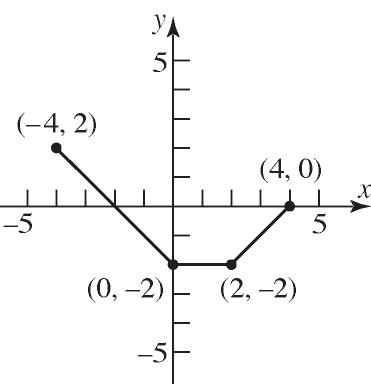
d. ()(1)2Hxfx Shift left 1 unit and shift down 2 units.
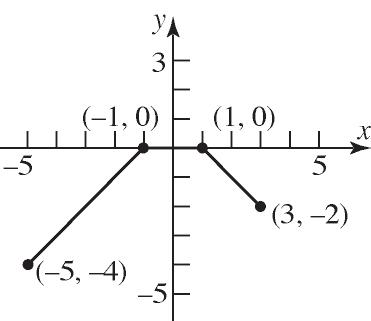
e. 1 ()() 2 Qxfx
Compress vertically by a factor of 1 2 .
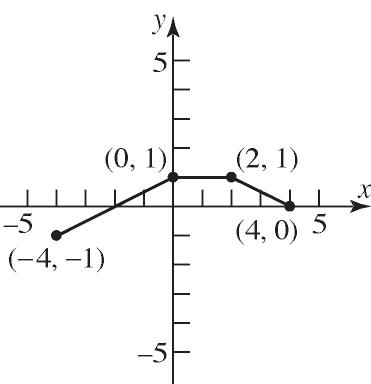
f. ()() g xfx
Reflect about the y-axis.
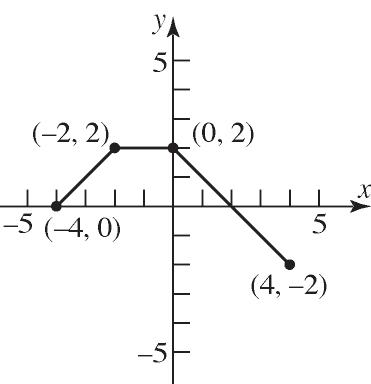
g. ()(2) hxfx
Compress horizontally by a factor of 1 2
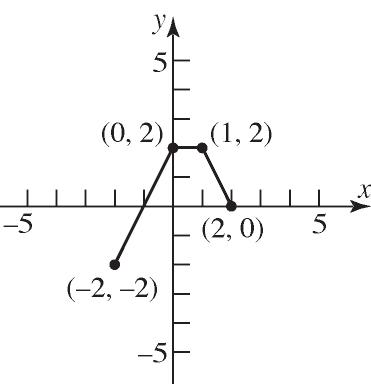
66. a. ()()3Fxfx Shift up 3 units.
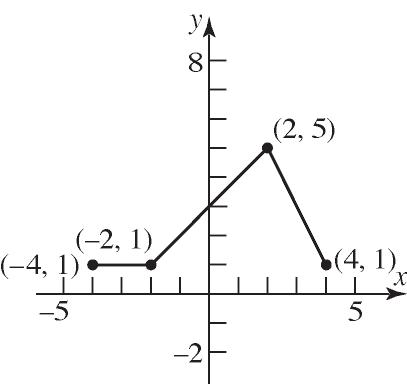
b. ()(2)Gxfx Shift left 2 units.
c. ()() Pxfx
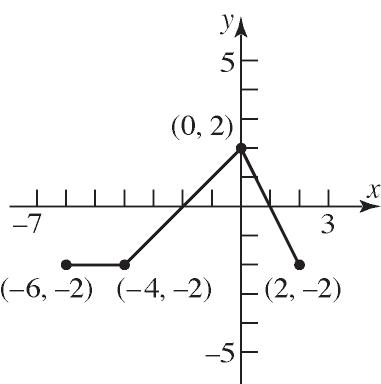
Reflect about the x-axis.
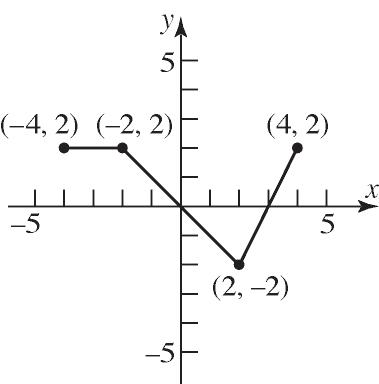
d. ()(1)2Hxfx Shift left 1 unit and shift down 2 units.
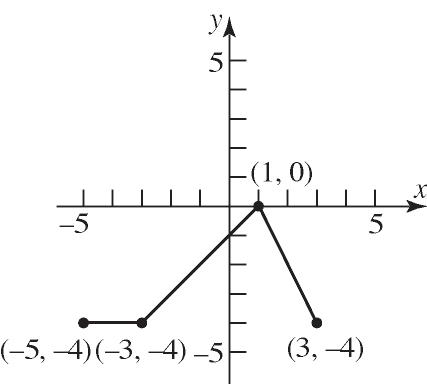
e. 1 ()() 2 Qxfx
Compress vertically by a factor of 1 2 .
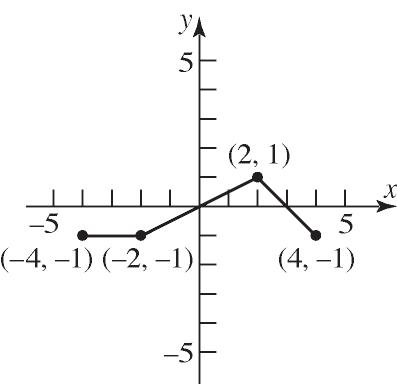
f. ()() g xfx
Reflect about the y-axis.
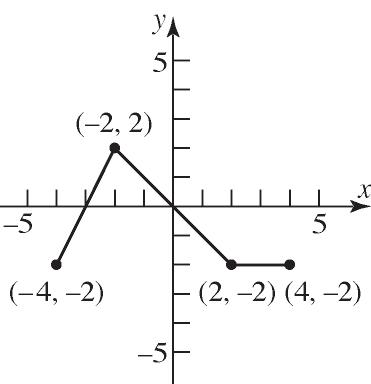
Section 1.5: Graphing Techniques: Transformations
g. ()(2) hxfx
Compress horizontally by a factor of 1 2 .
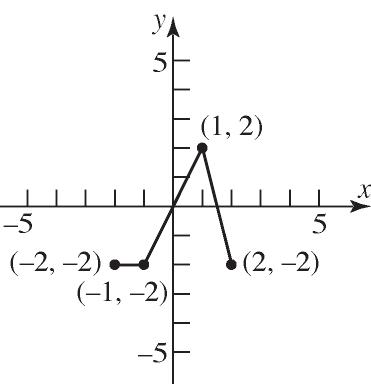
67. a. ()()3Fxfx Shift up 3 units.
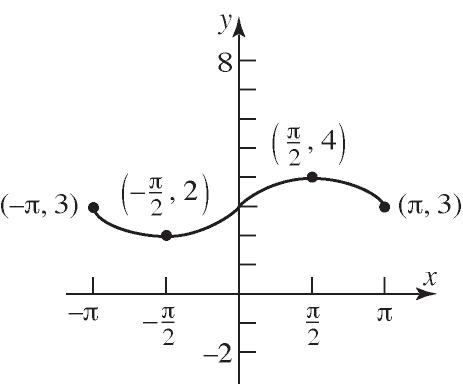
b. ()(2)Gxfx Shift left 2 units.
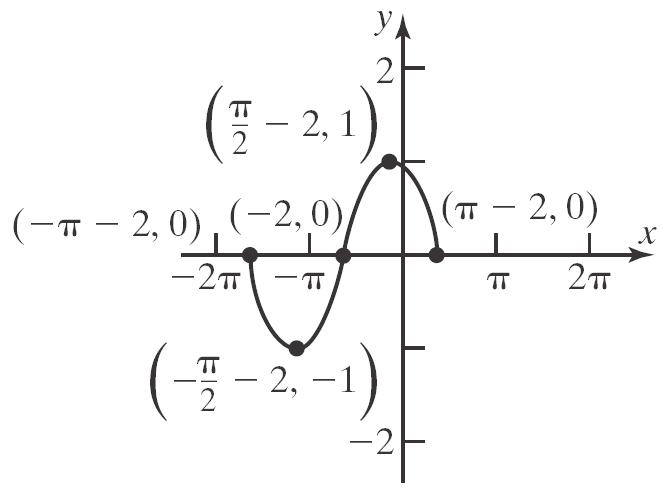
c. ()() Pxfx Reflect about the x-axis.

Chapter 1: Functions and Their Graphs
d. ()(1)2Hxfx Shift left 1 unit and shift down 2 units.
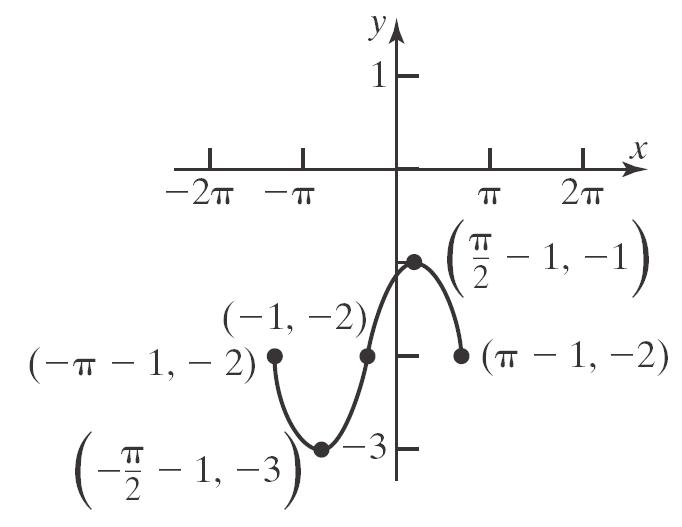
e. 1 ()() 2 Qxfx
Compress vertically by a factor of 1 2

f. ()() g xfx
Reflect about the y-axis.

g. ()(2) hxfx
Compress horizontally by a factor of 1 2
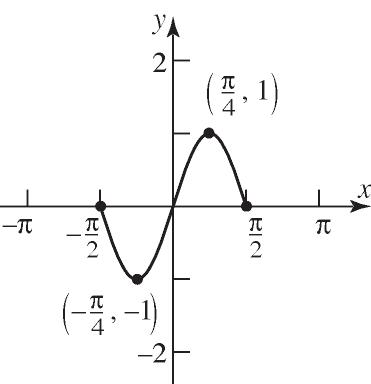
68. a. ()()3Fxfx Shift up 3 units.
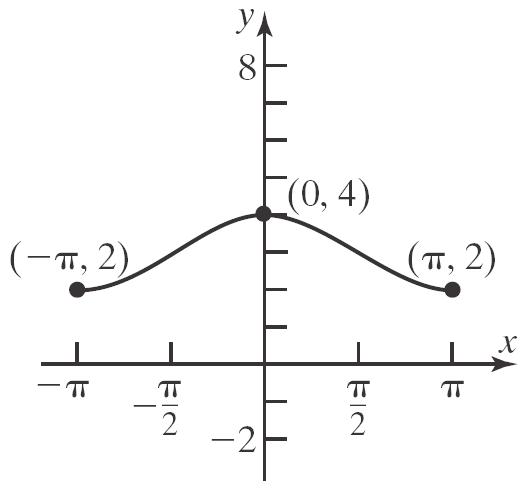
b. ()(2)Gxfx Shift left 2 units.
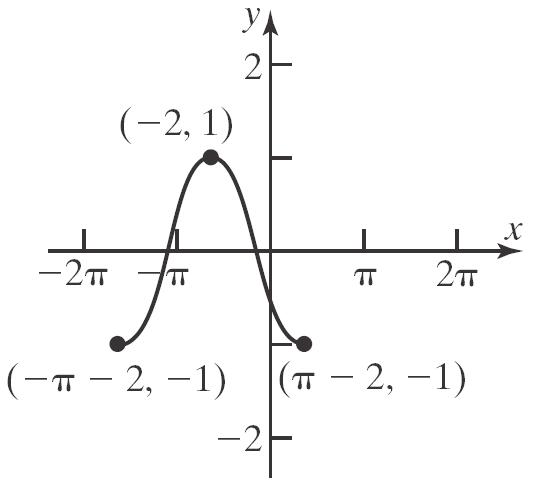
c. ()() Pxfx Reflect about the x-axis.
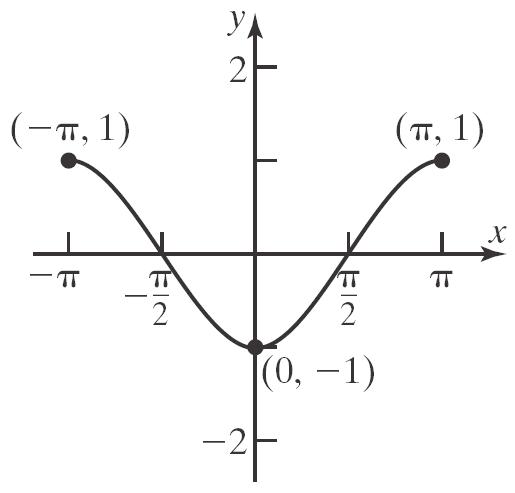
d. ()(1)2Hxfx Shift left 1 unit and shift down 2 units.
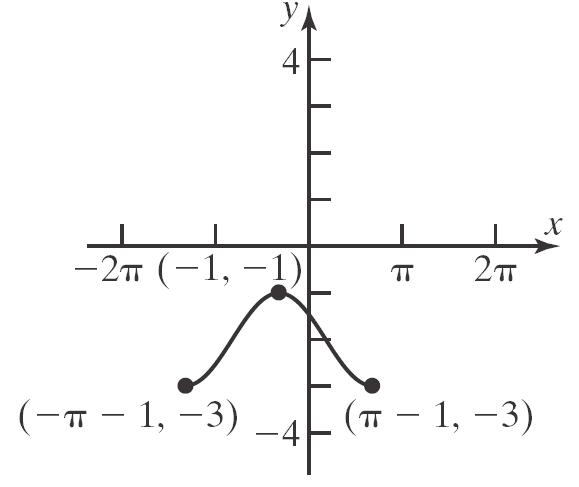
e. 1 ()() 2 Qxfx
Compress vertically by a factor of 1 2 .
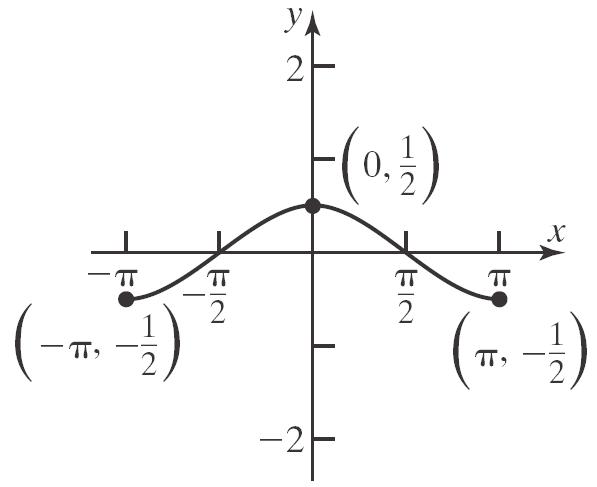
f. ()() g xfx Reflect about the y-axis.
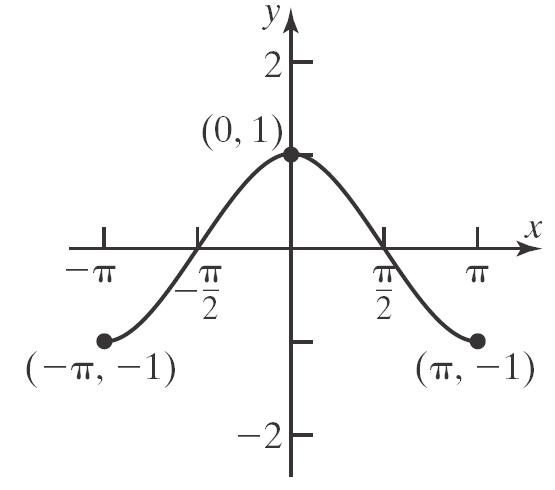
g. ()(2) hxfx
Compress horizontally by a factor of 1 2 .
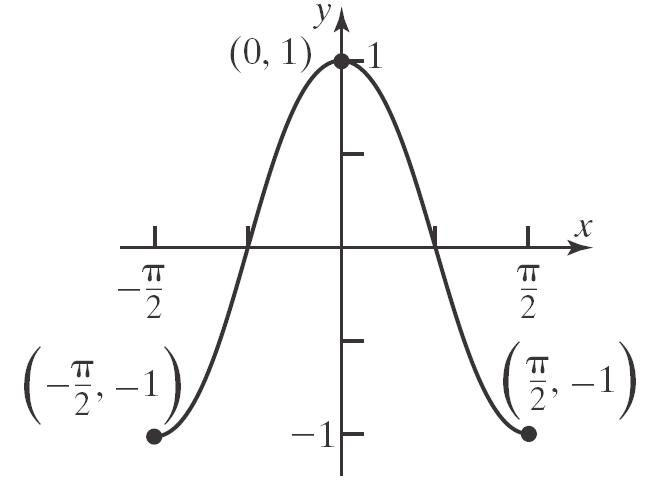
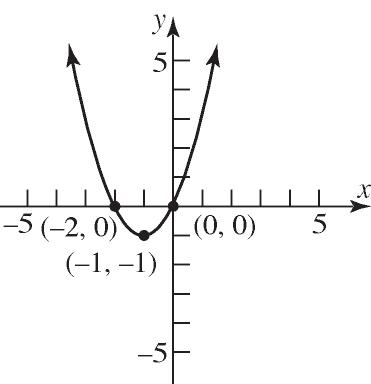
69. 2 ()2 f xxx 2 2 ()(21)1 ()(1)1 fxxx fxx
Using 2 () f xx , shift left 1 unit and shift down
Section 1.5: Graphing Techniques: Transformations
1 unit.
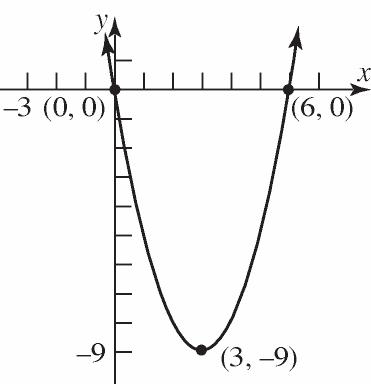
70. 2 ()6 f xxx 2 2 ()(69)9 ()(3)9 fxxx fxx
Using 2 () f xx , shift right 3 units and shift down 9 units.
71. 2 ()81 f xxx 2 2 ()816116 ()415 fxxx fxx
Using 2 () f xx , shift right 4 units and shift down 15 units.
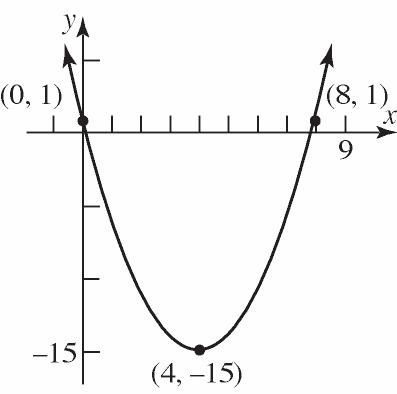
72. 2 ()42 fxxx
2 2 ()4424 ()22 fxxx fxx
Chapter 1: Functions and Their Graphs
Using 2 () f xx , shift left 2 units and shift down 2 units.

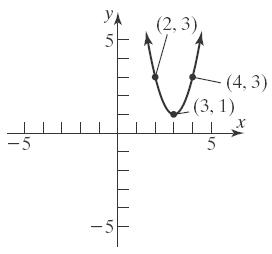
Using 2 f xx , shift right 3 units, vertically stretch by a factor of 2, and then shift up 1 unit.
Using 2 f xx , shift left 1 unit, vertically stretch by a factor of 3, and shift down 2 units.
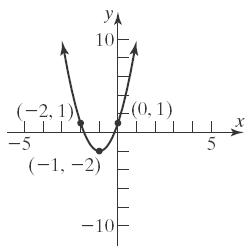
2 2 2 2 31217 3417 3441712 325 fxxx xx xx x
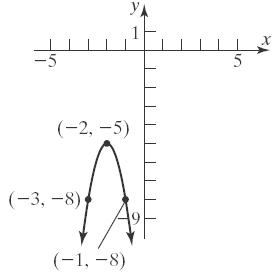
Using 2 f xx , shift left 2 units, stretch vertically by a factor of 3, reflect about the xaxis, and shift down 5 units.
2 2 2 2 21213 2613 2691318 235 fxxx xx xx x
Using 2 f xx , shift left 3 units, stretch vertically by a factor of 2, reflect about the xaxis, and shift up 5 units.
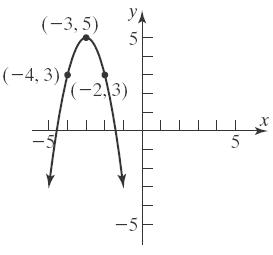
77. a. The graph of 2 yfx is the same as the graph of y fx , but shifted 2 units to the left. Therefore, the x-intercepts are 7 and 1.
b. The graph of 2 yfx is the same as the graph of y fx , but shifted 2 units to
the right. Therefore, the x-intercepts are 3 and 5.
c. The graph of 4 y fx is the same as the graph of y fx , but stretched vertically by a factor of 4. Therefore, the x-intercepts are still 5 and 3 since the y-coordinate of each is 0.
d. The graph of y fx is the same as the graph of y fx , but reflected about the y-axis. Therefore, the x-intercepts are 5 and 3 .
78. a. The graph of 4 yfx is the same as the graph of y fx , but shifted 4 units to the left. Therefore, the x-intercepts are 12 and 3 .
b. The graph of 3 yfx is the same as the graph of y fx , but shifted 3 units to the right. Therefore, the x-intercepts are 5 and 4.
c. The graph of 2 y fx is the same as the graph of y fx , but stretched vertically by a factor of 2. Therefore, the x-intercepts are still 8 and 1 since the y-coordinate of each is 0.
d. The graph of y fx is the same as the graph of y fx , but reflected about the y-axis. Therefore, the x-intercepts are 8 and 1
79. a. The graph of 2 yfx is the same as the graph of y fx , but shifted 2 units to the left. Therefore, the graph of 2 fx is increasing on the interval 3,3 .
b. The graph of 5 yfx is the same as the graph of y fx , but shifted 5 units to the right. Therefore, the graph of 5 fx is increasing on the interval 4,10 .
d. The graph of y fx is the same as the graph of y fx , but reflected about the y-axis. Therefore, we can say that the graph of y fx must be decreasing on the interval 5,1 .
80. a. The graph of 2 yfx is the same as the graph of y fx , but shifted 2 units to the left. Therefore, the graph of 2 fx is decreasing on the interval 4,5
b. The graph of 5 yfx is the same as the graph of y fx , but shifted 5 units to the right. Therefore, the graph of 5 fx is decreasing on the interval 3,12 .
c. The graph of y fx is the same as the graph of y fx , but reflected about the x-axis. Therefore, we can say that the graph of y fx must be increasing on the interval 2,7
d. The graph of y fx is the same as the graph of y fx , but reflected about the y-axis. Therefore, we can say that the graph of y fx must be increasing on the interval 7,2
81. a. () y fx
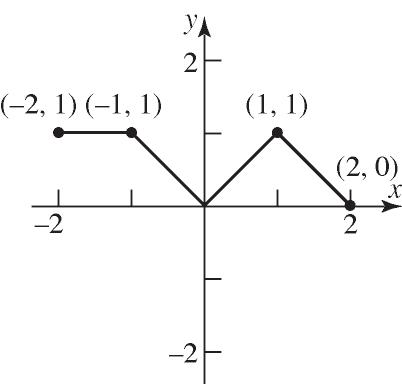
c. The graph of y fx is the same as the graph of y fx , but reflected about the x-axis. Therefore, we can say that the graph of y fx must be decreasing on the interval 1,5
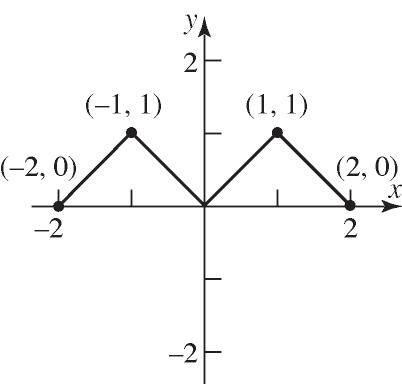
82. a. To graph () y fx , the part of the graph for f that lies in quadrants III or IV is reflected about the x-axis.

b. To graph yfx , the part of the graph for f that lies in quadrants II or III is replaced by the reflection of the part in quadrants I and IV reflected about the yaxis.
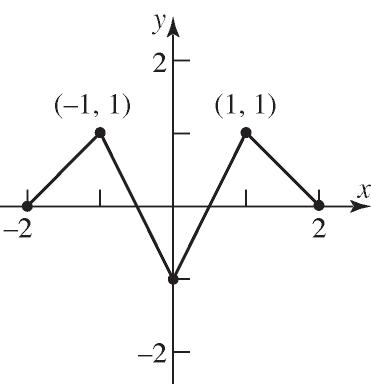
83. a. The graph of 35 yfx is the graph of yfx but shifted left 3 units and down 5 units. Thus, the point 1,3 becomes the point 2,2 .
b. The graph of 221yfx is the graph of yfx but shifted right 2 units, stretched vertically by a factor of 2, reflected about the x-axis, and shifted up 1 unit. Thus, the point 1,3 becomes the point 3,5
c. The graph of 23yfx is the graph of yfx but shifted left 3 units and horizontally compressed by a factor of 2. Thus, the point 1,3 becomes the point
1,3 .
84. a. The graph of 13 ygx is the graph of ygx but shifted left 1 unit and down 3 units. Thus, the point 3,5 becomes the point 4,2
b. The graph of 343ygx is the graph of ygx but shifted right 4 units, stretched vertically by a factor of 3, reflected about the x-axis, and shifted up 3 units. Thus, the point 3,5 becomes the point 1,12
c. The graph of 39ygx is the graph of yfx but shifted left 9 units and horizontally compressed by a factor of 3. Thus, the point 3,5 becomes the point
4,5
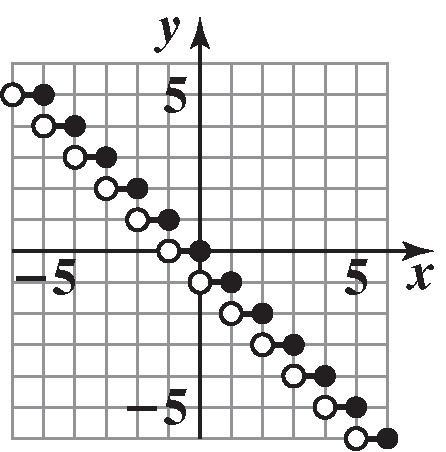
85. a. ()int() f xx
Reflect the graph of int()yx about the yaxis.
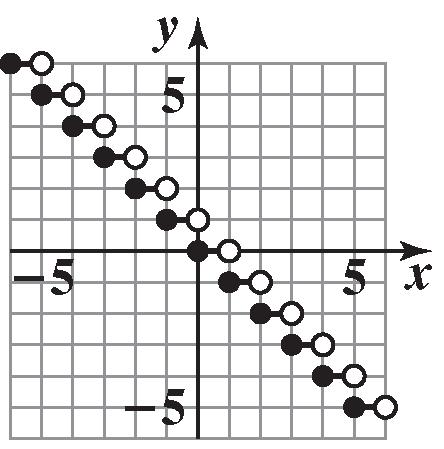
b ()int() g xx
Reflect the graph of int()yx about the xaxis.
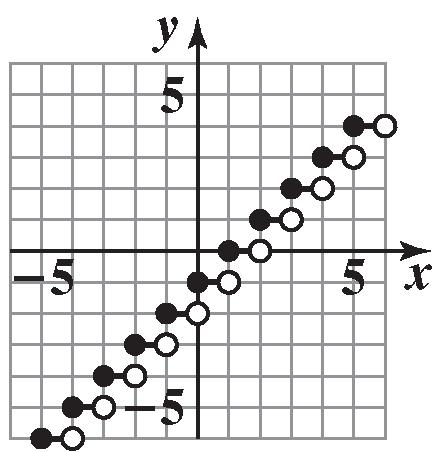
86. a. ()int(1)fxx
Shift the graph of int()yx right 1 unit.
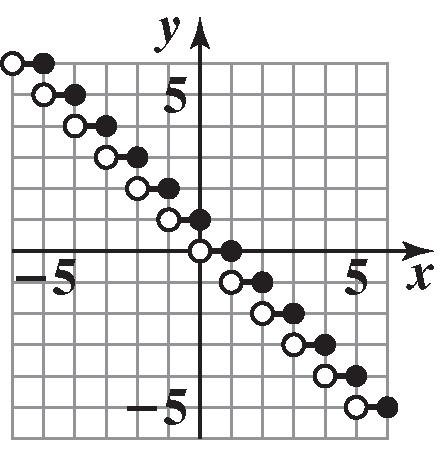
b. ()int(1)int((1)) gxxx
Using the graph of int()yx , reflect the graph about the y-axis int()yx , horizontally shift to the right 1 unit int((1))yx .
Section 1.5: Graphing Techniques: Transformations
87. a. ()33fxx
Using the graph of y x , horizontally shift to the right 3 units 3 yx and vertically shift downward 3 units 33 yx
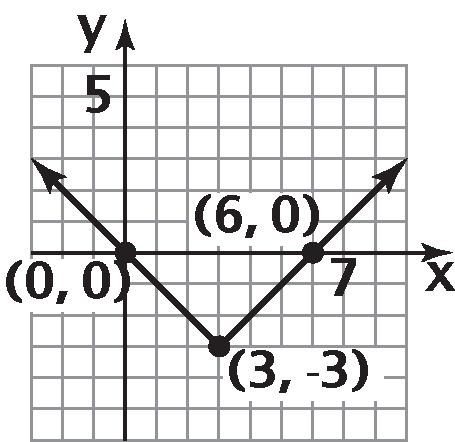
b. 1 2 1 (6)(3)9 2 Abh
The area is 9 square units.
88. a. ()244fxx
Using the graph of y x , horizontally shift to the right 4 units 4 yx , vertically stretch by a factor of 2 and flip on the x-axis 24yx , and vertically shift upward 4 units 244yx .

b. 1 2 1 (4)(4)8 2 Abh
The area is 8 square units.
89. a. From the graph, the thermostat is set at 72F during the daytime hours. The thermostat appears to be set at 65F overnight.
b. To graph 2 yTt , the graph of Tt is shifted down 2 units. This change will lower the temperature in the house by 2 degrees.
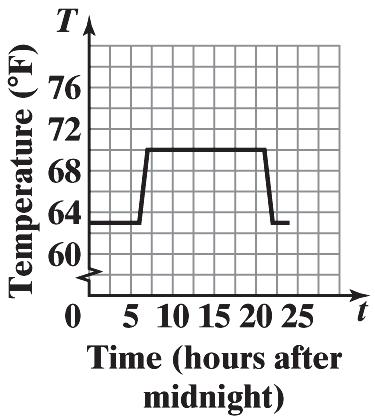
c. To graph 1 yTt , the graph of Tt should be shifted left one unit. This change will cause the program to switch between the daytime temperature and overnight temperature one hour sooner. The home will begin warming up at 5am instead of 6am and will begin cooling down at 8pm instead of 9pm. 90.

R The estimated worldwide music revenue for 2017 is $9.42 billion.
c. The graph of rx is the graph of Rx shifted 2 units to the left. Thus, rx represents the estimated worldwide music revenue, x years after 2010.
2 20.1820.8326.415.47 r
The estimated worldwide music revenue for 2012 is $5.47 billion.
2 50.1850.8356.41 6.76 r
The estimated worldwide music revenue for 2015 is $6.76 billion.
2 70.1870.8376.41 9.42 r
The estimated worldwide music revenue for 2017 is $9.42 billion.
d. In rx , x represents the number of years after 2010 (see the previous part).
e. Answers will vary. One advantage might be that it is easier to determine what value should be substituted for x when using rx instead of Rx to estimate worldwide music revenue.
Section 1.5: Graphing Techniques: Transformations
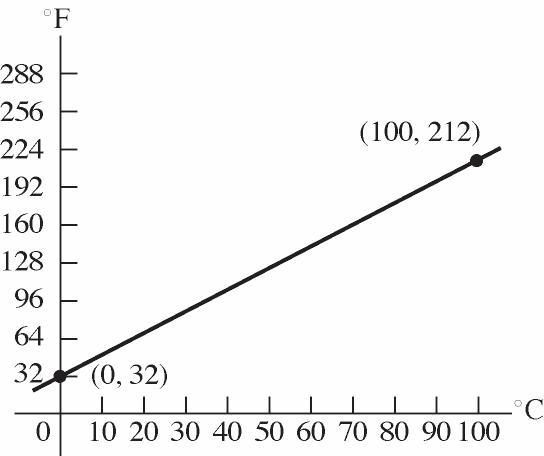

Shift the graph 273 units to the right. 92. a. 2 l T g b.
c. As the length of the pendulum increases, the period increases.
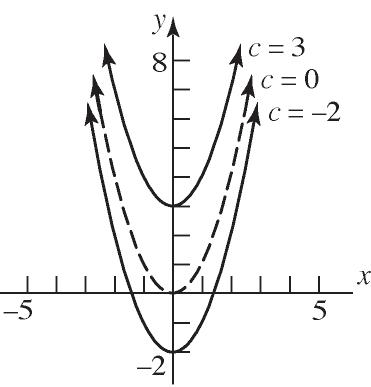
e. If the length of the pendulum is multiplied by k , the period is multiplied by k
93. 2 () y xc 2 2 2 If 0,.
If 3,(3); shift right 3 units. If 2,(2); shift left 2 units. cyx cyx cyx
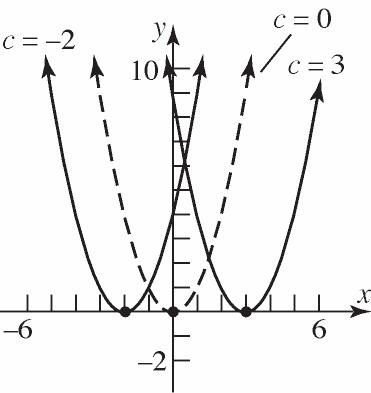
94. 2 y xc 2 2 2 If 0,.
If 3,3; shift up 3 units. If 2,2; shift down 2 units. cyx cyx cyx
95. (5)fx is a shift right 5 units; increasing on 2,8 and 16,24 ; decreasing of 8,16 (25)fx compresses horizontally by a factor of ½; increasing on 1,4 and 8,12 ; decreasing on 4,8 (25)fx reflects about the x-axis; increasing on 4,8 ; decreasing on 1,4 and 8,12 3(25) fx stretches vertically by a factor or 3 but does not affect
increasing/decreasing. Therefore 3(25) fx is increasing on 4,8
96. Write the general normal density as
fx . Starting with the standard normal density,
fx , stretch/compress horizontally by a factor of
to get
multiply all the -coordinates by
x , then shift the graph horizontally units (left if 0 and right if 0 ) to get
stretch/compress vertically by a factor of 1 to get
by
1. Stretch/compress horizontally by a factor or (stretch if 1 )
2. Shift horizontally units (left if 0 and right if 0 ).
3.Stretch/compress vertically by a factor of 1 (compress if 1 )
97. The graph of 4()yfx is a vertical stretch of the graph of f by a factor of 4, while the graph of (4)yfx is a horizontal compression of the graph of f by a factor of 1 4 .
98. The graph of ()2yfx will shift the graph of ()yfx down by 2 units. The graph of (2)yfx will shift the graph of ()yfx to the right by 2 units.
99. The graph of y x is the graph of y x but reflected about the y-axis. Therefore, our region is simply rotated about the y-axis and does not change shape. Instead of the region being bounded on the right by 4 x , it is bounded on the left by 4 x . Thus, the area of the second region would also be 16 3 square units.
100. The range of 2 () f xx is 0, . The graph of ()() g xfxk is the graph of f shifted up k units if k > 0 and shifted down k units if k < 0, so the range of g is , k
101. The domain of () g xx is 0, . The graph of () g xk is the graph of g shifted k units to the right, so the domaine of g is , k
Section 1.6
1. a. The distance from dP to the origin is 22dxy . Since P is a point on the graph of 2 8 yx , we have: 22242 ()(8)1564 dxxxxx
b. 42 (0)015(0)64648 d
c. 42 (1)(1)15(1)64 1156450527.07 d
d.

e. d is smallest when 2.74 x or when 2.74 x .
2. a. The distance from dP to (0, –1) is 22 (1)dxy . Since P is a point on the graph of 2 8 yx , we have: 222 2 2242 ()(81) 71349 dxxx xxxx
b. 42 (0)013(0)49497 d
c. 42 (1)(1)13(1)49376.08 d
d. 4 –4 10 0
Section 1.6: Mathematical Models: Building Functions
e. d is smallest when 2.55 x or when 2.55 x
3. a. The distance from dP to the point (1, 0) is 22 (1) dxy . Since P is a point on the graph of y x , we have: 2 22 ()(1)1 dxxxxx where 0 x .
b. 2 2 0 0
c. d is smallest when 1 2 x
d. 2 ()1113 222 dx
4. a. The distance from dP to the origin is 22dxy . Since P is a point on the graph of 1 y x , we have: 2 22 2 11 ()
dxxx x x
b. 5 –5 8 0
c. d is smallest when 1 x or 1 x
5. By definition, a triangle has area 1 ,base, height. 2 Abhbh From the figure, we know that and .bxhy Expressing the area of the triangle as a function of x , we have:
11134 () 222 A xxyxxx
6. By definition, a triangle has area 1 ,=base, height. 2 Abhbh Because one vertex of the triangle is at the origin and the other is on the x-axis, we know that and .bxhy Expressing the area of the triangle as a function of x , we have:
7. a. 2 ()16A xxyxx
b. Domain: 04xx
c. The area is largest when 2.31 x 4 30 0 0

d. The largest area is 2 (2.31)2.31162.3124.63 A square units.
8. a. 2 ()224A xxyxx b. 2 ()2(2)2()424 pxxyxx
c. Graphing the area equation: 2 0 4 0
The area is largest when 1.41 x
d. Graphing the perimeter equation: 2 0 10 0

The perimeter is largest when 1.79 x .
e. The largest area is 2 (1.41)21.4141.414 A square units.
The largest perimeter is 2 (1.79)41.79241.798.94 p units.
9. a. In Quadrant I, 222 4 4 x yyx 2 ()(2)(2)44A xxyxx
b. 2 ()2(2)2(2)444 pxxyxx
c. Graphing the area equation: 2 10 0 0
The area is largest when 1.41 x .
d. Graphing the perimeter equation: 2 12 0 0 The perimeter is largest when 1.41 x
10. a. 2 ()(2)(2)4A rrrr b. ()4(2)8 prrr
11. a. circumference, total area, radius, side of square CA rx
b. Since the lengths must be positive, we have: 1040 and 0 410 and 0 2.5 and 0
Section 1.6: Mathematical Models: Building Functions
c. The total area is smallest when 1.40 x meters.
12. a. circumference, total area, radius, side of equilateral triangle CA rx
The height of the equilateral triangle is 3 2 x trianglecircle
b. Since the lengths must be positive, we have: 1030 and 0
13. a. Since the wire of length x is bent into a circle, the circumference is x . Therefore, () Cxx
b. Since 2, 2 x Cxrr . 2 2 2 () 24 x x Axr
14. a. Since the wire of length x is bent into a square, the perimeter is x . Therefore, () pxx
b. Since 1 4, 4 Pxssx , we have 2 22 11 () 416 A xsxx
15. a. area, radius; diameter2 A rr 2 ()(2)()2A rrrr
b. perimeter p ()2(2)26 prrrr
16. circumference, radius; length of a side of the triangle Cr x
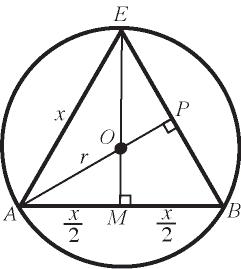
Therefore, the circumference of the circle is
17. Area of the equilateral triangle 2 133 224 A xxx
From problem 16, we have 2 2 3 x r
Area inside the circle, but outside the triangle: 22 2 22 3 () 4 33 3434 Axrx x x x
222 12 22 2 222 3040 9001600250050 ddd dtt dttttt
d d =40t d1=30t 2
19. a.
222 12 22 2 22 22 2 230340 230340 412090092401600 250036013 ddd dtt dttt tttt tt
1 230 dt 2 340 dt d
b. The distance is smallest at 0.07 t hours.
20. radius of cylinder, height of cylinder, volume of cylinder rh V
(1)5001700110129 50070020$3630.50

21. radius of cylinder, height of cylinder, volume of cylinder rh
By similar triangles: HHh
e. Using MINIMUM, the graph indicates that 2.96 x miles results in the least cost.
23. a. The time on the boat is given by 1 3 d . The time on land is given by 12 5 x
22. a. The total cost of installing the cable along the road is 500 x . If cable is installed x miles along the road, there are 5 x miles between the road to the house and where the cable ends along the road.
total time for the trip is: 2 1 12124 () 5353 d
b. Domain: 012xx c. 2 12444 (4) 53 820 3.09 hours
of
1: Functions and Their Graphs
(8)
24. a. Let amount of material A , length of the base x , height h , and volume V
b. 22 3 (3)3(242(3))3(18) 3(324)972 in.
c. 22 3 (10)10(242(10))10(4) 10(16)160 in.

e. The largest area is 22 40 2.712.7122.1 ft 2.71

The volume is largest when 4 x inches.
e. The largest volume is (4)4(242(4))102423 in V
26. Consider the diagrams shown below.
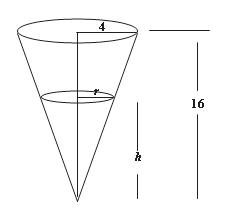
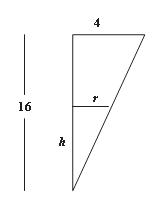
There is a pair of similar triangles in the diagram. This allows us to write
Substituting into the volume formula for the conical portion of water gives
27. a. The total cost is the sum of the shipment cost, storage cost, and product cost. Since each shipment will contain x units, there are 600/x shipments per year, each costing $15. So the shipment cost is 6009000 15 =.
The storage cost for the year is given as 1.60. x The product costs is 600(4.85)2910. So, the total cost is 9000 ()1.602910. Cxx x
b.

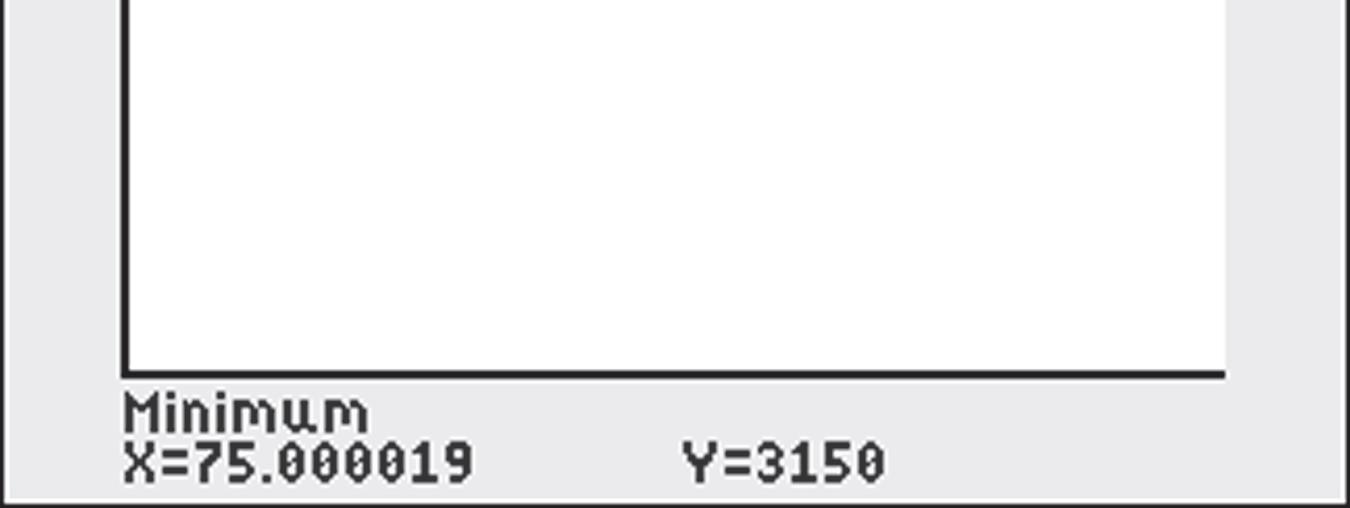
The retailer should order 75 drives per order for a minimum yearly cost of $3150.
Section 1.7
1. ykx
2. False. If y varies directly with x, then ,ykx where k is a constant. 3. b
c
Section 1.7: Building Mathematical Models Using Variation
equation
24.
Therefore we have the linear equation 0.00899 pB If 175000 B , then 0.00899175000$1573.25 p
25.
Therefore, we have equation 2 16. s t
If t = 3 seconds, then 2 163144 s feet.
If s = 64 feet, then 2 2 6416 4 2 t t
Time must be positive, so we disregard 2. t It takes 2 seconds to fall 64 feet.
26.
Therefore, we have the linear equation 32.vt
If t = 3 seconds, then
Therefore, we have the equation 12,288 . R l
If 576, R then 12,288 576 57612,288 12,28864 inches 5763 l l l
29. 47.4012 3.95 Rkg k k Therefore, we have the linear equation 3.95 Rg . If 10.5 g , then 3.9510.5$41.48 R .
30. 23.755 4.75 CkA k k Therefore, we have the linear equation 4.75. CA If 3.5 A , then 4.753.5$16.63 C
31. k D p a. 156 D , 2.75 p ; 156 2.75 429 k k So, 429 D p .
b. 429 143 bags of candy 3 D
32. k t s a. 40 t , 30 s ; 40 30 1200 k k So, we have the equation 1200 t s . b. 1200 30 minutes 40 t
33. k V P
600,150VP ; 600 150 90,000 k k
So, we have the equation 90,000 V P
If 200 P , then 3 90,000 450 cm. 200 V
34. k i R
If 30,8iR , then 30 and 240 8 k k
So, we have the equation 240 i R
If 10, R then 240 24 amperes 10 i .
35. 2 k W d
If 125,3960Wd then 2 125 and 1,960,200,000 3960 k k
So, we have the equation 1,960,200,000 W d
At the top of Mt. Denali, we have 39603.83963.8 d , so 2 1,960,200,000 124.76 pounds. 3963.8 W
36. 2 2 55 3960 862,488,000 k W d k k
So, we have the equation 2 862,488,000 . W d If =3965, d then 2 862,488,000 54.86 pounds. 3965 W
37. 2 Vrh
38. 2 3 Vrh
39. 2 k I d If 0.075,2Id , then 2 0.075 and 0.3 2 k k
So, we have the equation 2 0.3 I d If 5, d then 2 0.3 0.012 foot-candles. 5 I
40. 2 2 11(20)(22) 119860 111 9680880 FkAv k k k
So, we have the equation 2 1 880 F Av If 47.125 A and 36.5 v , then 2 1 47.12536.571.34 pounds. 880 F
41. 3 36(75)(2)3 36600 0.06 hksd k k k
So, we have the equation 3 0.06.hsd If 45 h and 125, s then 3 3 3 3 45(0.06)(125) 457.5 6 61.82 inches d d d d
42. (300) 100 15 10020 5 kT V P k k k
So, we have the equation 5T V P
Chapter 1 Review Exercises
43.
If 80 V and 310, T then 5(310) 80 801550 1550 19.375 atmospheres 80 P P
44.
So, we have the equation 2 0.5. K mv
If 25 m and 15, v then
2 0.525152812.5 K
Joules
45.
So, we have the equation
So, we have the equation 0.6 pd S t If 40, 8, pd and 0.50, t then 0.6(40)(8) 384 psi. 0.50 S
46. 2 2 (4)(2) 750 8 7502 375 kwt S l k k k
So, we have the equation 2 375 . wt S l
If 10, 6, lw and 2, t then 2 375(6)(2) 900 pounds. 10 S
47 – 50. Answers will vary.
Chapter 1 Review Exercises
1. a. Domain {8, 16, 20, 24}
Range {$6.30, $12.32, $13.99}
b. {(8,$6.30), (16,$13.99), (20,$12.32), (24,$13.99)}
c.


d.
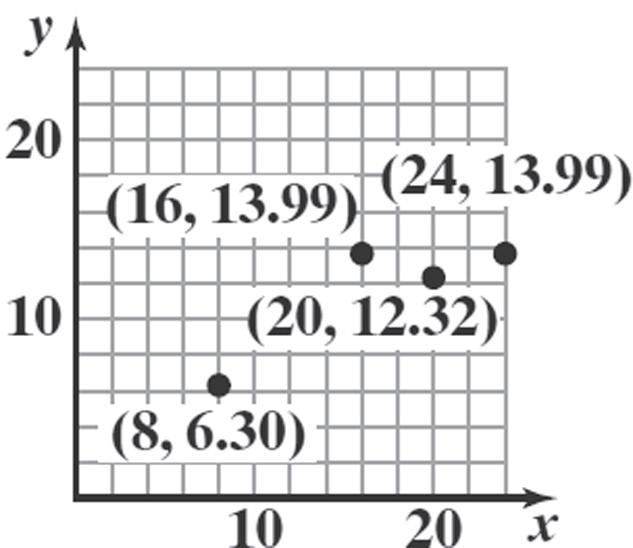
2. This relation represents a function. Domain = {–1, 2, 4}; Range = {0, 3}.
3. Domain {2,4}; Range {-1,1,2} Not a function
4. not a function; domain [-1, 3]; range [-2, 2]
5. function; domain: all real numbers; range 3,
6. 2 3 () 1 x fx x
a. 2 3(2) 66 (2)2 413 (2)1
b. 2 3(2) 66 (2)2 413 (2)1
c. 22 3() 3 () ()11 x x fx xx
d. 22 33 () 11 x x fx xx
e.
2 22 3(2) (2) (2)1 32 36 44143 x fx x x x xxxx
f. 22 3(2) 6 (2) (2)141 x x fx xx
7. 2 ()4fxx
a. 2 (2)244400 f
b.
2 (2)244400
c. 22 ()()44 fxxx
2 ()4fxx
e. 2 2 2 (2)(2)4 444 4 fxx xx xx
22 22 (2)(2)444 4121 fxxx xx
8. 2 2 4 () x fx x
c. 2 2 22 ()4 4 () () x x fx x x
d. 222 222 444 () xxx fx x xx
e. 2 2 22 2 22 (2)4 444 (2) (2)(2) 4 4 (2)(2) x xx fx xx xx xx xx
f. 2 2 22 2 2 22 (2)4 44 (2) (2)4 41 1 4 x x fx x x x x xx
9. 2 () 9 x fx x
The denominator cannot be zero: 2 90 (3)(3)0 3 or 3 x xx x
Domain: 3,3xxx
10. ()2 f xx
The radicand must be non-negative: 20 2 x x
Domain: 2 or ,2 xx
11. () x gx x
The denominator cannot be zero: 0 x
Domain: 0 xx
12. 2 () 23 x fx xx
The denominator cannot be zero:
Domain:3, 1 xx xx x xxx
2 230 310 3 or 1
13. 2 1 () 4 x fx x
The denominator cannot be zero:
2 40 220 2 or 2 x xx x
Also, the radicand must be non-negative: 10 1 x x
Domain: 1,22,
14. () 8 x fx x
The radicand must be non-negative and not zero: 80 8 x x
Domain: 8 xx
15. ()2()31 f xxgxx
()()() 23123 fgxfxgx x xx
Domain: is any real number xx
()()() 231 231 41 f gxfxgx xx xx x
Domain: is any real number xx
2 2 ()()() 231 623 352 fgxfxgx xx x xx xx
Domain: is any real number xx
2 () 31 fx f x x g x gx
310 1 31 3 x xx
1 Domain: 3 xx
16. 2 ()31()3 f xxxgxx 2 2 ()()() 313 341 fgxfxgx x xx xx
Domain: is any real number xx 2 2 ()()() 313 321 fgxfxgx x xx xx
Domain: is any real number xx
2 32 ()()() 313 933 fgxfxgx x xx x xx
Domain: is any real number xx 2 31 () 3 fx f x x x gx gx
300 xx
Domain: 0 xx
17. ()()11 1 x fxgx x x
Domain: 0,1xxx
111 11 1 1 11 11 fgxfxgx xxx x xx xx xxxx xxxx
22
Domain: 0,1xxx
111 ()()() 1 1 xx fgxfxgx xx xx
Domain: 0,1xxx
Chapter 1: Functions and Their Graphs
19. a. Domain: 43xx ; 4,3 Range: 33yy ; 3,3
b. Intercept: 0,0
c. 21 f
d. 3 fx when x = –4
e. ()0fx when 03 x
|03xx
f. To graph 3 yfx , shift the graph of f horizontally 3 units to the right.

g. To graph 1 2 yfx , stretch the graph of f horizontally by a factor of 2.
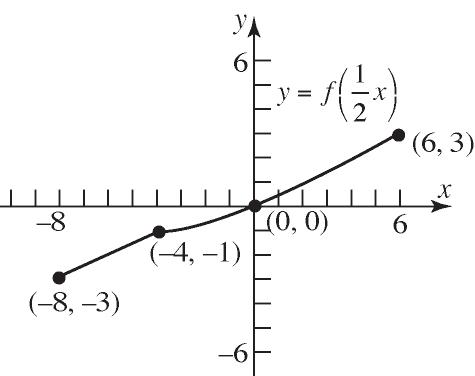
h. To graph y fx , reflect the graph of f vertically about the y-axis.
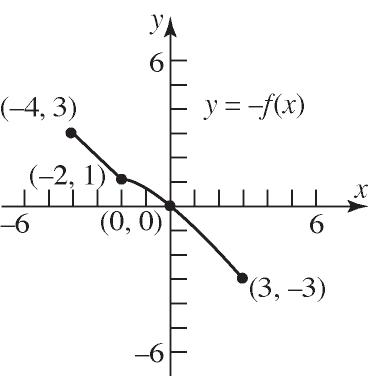
20. a. Domain: ,4
Range: ,3
b. Increasing: ,2 and 2,4 ; Decreasing: 2,2
c. Local minimum is 1 at 2 x ; Local maximum is 1 at 2 x
d. No absolute minimum; Absolute maximum is 3 at 4 x
e. The graph has no symmetry.
f. The function is neither.
g. x-intercepts: 3,0,0,0,3,0 ; y-intercept: (0,0)
21. 3 ()4 f xxx 33 3 ()()4()4 4() f xxxxx xxfx
f is odd.
22. 2 4 4 () 1 x gx x 2 2 44 4() 4 ()() 1()1 x x g xgx xx
g is even.
23. 3 ()1 Gxxx 3 3 ()1()() 1() or () Gxxx x xGxGx
G is neither even nor odd.
24. 2 () 1 x fx x 22 ()() 1()1 xx f xfx
f is odd.
25. 3 251 f xxx on the interval 3,3
Use MAXIMUM and MINIMUM on the graph of 3 1 251 y xx


f is increasing on:
3,0.91 and 0.91,3 ; f is decreasing on: 0.91,0.91 .
26. 43 2521 f xxxx on the interval 2,3
Use MAXIMUM and MINIMUM on the graph of


local minimal values: 0.54 when 0.34 x , 3.56 when 1.80 x f is increasing on: 0.34,0.41 and 1.80,3 ; f is decreasing on: 2,0.34 and 0.41,1.80 .
27. 2 ()8 f xxx
a. 22 (2)(1)8(2)2[8(1)1] 211 322(7)23 ff
b.
22 (1)(0)8(1)1[8(0)0] 101 8107 ff
c. 22 (4)(2)8(4)4[8(2)2] 422 1284(30) 94 47 22 ff
28. ()25 f xx
253252 (3)(2) 3232 215210 1 1385 ff
2 ()34 f xxx
30. Refer to question 29 for the slope. 1017(2) 101734 1724
31. The graph does not pass the Vertical Line Test and is therefore not a function.
32. The graph passes the Vertical Line Test and is therefore a function.
() f xx

() f xx
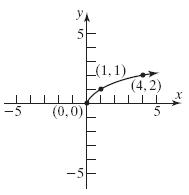
35. ()4Fxx . Using the graph of y x , vertically shift the graph downward 4 units.

Intercepts: (–4,0), (4,0), (0,–4)
Domain: is any real number xx
Range: 4 yy or 4,
36. ()2 g xx . Reflect the graph of y x about the x-axis and vertically stretch the graph by a factor of 2.
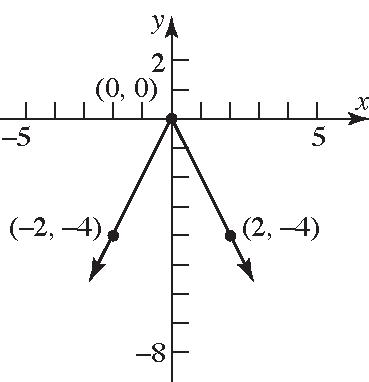
Intercepts: (0, 0)
Domain: is any real number xx
Range: 0 yy or ,0
37. ()1hxx . Using the graph of y x , horizontally shift the graph to the right 1 unit.
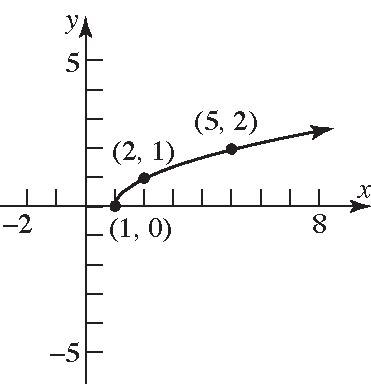
Intercept: (1, 0)
Domain: 1 xx or 1,
Range: 0 yy or 0,
38. ()1(1) fxxx . Reflect the graph of y x about the y-axis and horizontally shift the graph to the right 1 unit.
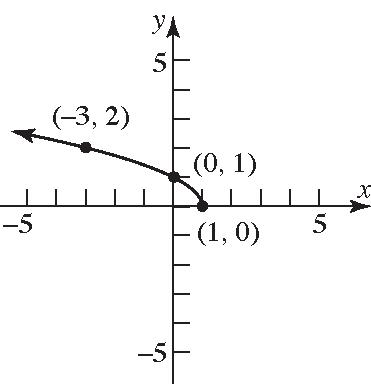
Intercepts: (1, 0), (0, 1)
Domain: 1 xx or ,1
Range: 0 yy or 0,
39. 2 ()(1)2hxx . Using the graph of 2 y x , horizontally shift the graph to the right 1 unit and vertically shift the graph up 2 units.
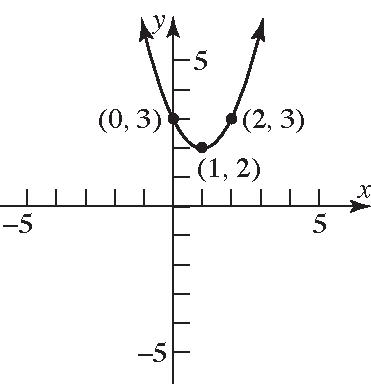
Intercepts: (0, 3)
Domain: is any real number xx
Range: 2 yy or 2,
40. 3 ()2(2)8gxx
Using the graph of 3 y x , horizontally shift the graph to the left 2 units, vertically stretch the graph by a factor of 2, reflect about the x-axis, and vertically shift the graph down 8 units.
y x 5
3 24,0
Intercepts: (0,–24), 3 24,03.6,0
Domain: is any real number xx
Range: is any real number yy
41. 3 if 21 () 1 if 1 xx fx xx
a. Domain: 2 xx or 2,
b. Intercept: 0,0
c. Graph:
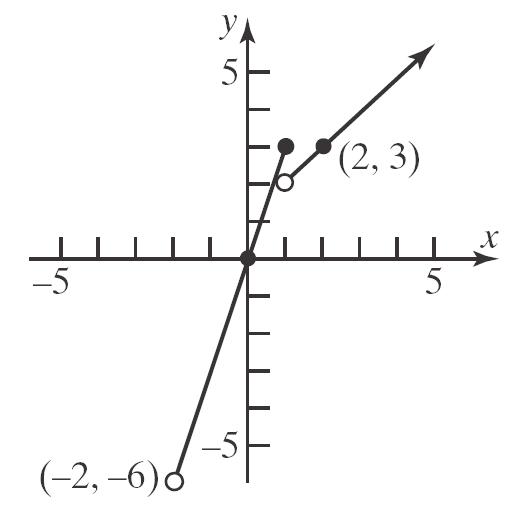
d. Range: |6yy or 6,
42. if 40 ()1if 0 3 if 0 xx fxx xx
a. Domain: 4 xx or 4,
b. Intercept: (0, 1)
c. Graph:

d. Range: 4,0yyy
43. 5 () and (1)4 62 Ax fxf x (1)5 4 6(1)2 5 4 4 516 11 A A A A
Chapter 1: Functions and Their Graphs
44. a. 2 2 10 10 xhh x 2 2 2 2 ()24 10 24 40 2 Axxxh xx x x x
b. 22 40 (1)2124042 ft 1 A
c. 22 40 (2)2282028 ft 2 A
d. Graphing: 5 0 50 0
The area is smallest when 2.15 x feet.
45. a. Consider the following diagram: P(x,y) x y y 10 x 2
The area of the rectangle is A xy . Thus, the area function for the rectangle is: 2 ()(10)A xxx
b. The maximum value occurs at the vertex:
The maximum area is roughly: 3 (1.83)(1.83)10(1.83) 12.17 square units A
46. 854130,000 854427 130,00065,000 pkB k k
Therefore, we have the equation 427 65,000 pB If 165,000 B , then
427 165,000$1083.92 65,000 p 47. 2 k w d
2 2 200 3960 20039603,136,320,000 k
Therefore, we have the equation 2 3,136,320,000 w d If 396013961 d miles, then 2 3,136,320,000 199.9 3961 w pounds.
48. 135(7.5)(40) 135300 0.45 Hksd k k k
So, we have the equation 0.45. H sd If 12 s and 35, d then
0.451235189 H BTU
Chapter 1 Test
1. a. 2,5,4,6,6,7,8,8
This relation is a function because there are no ordered pairs that have the same first element and different second elements.
Domain: 2,4,6,8
Range: 5,6,7,8
b. 1,3,4,2,3,5,1,7
This relation is not a function because there are two ordered pairs that have the same first element but different second elements.
Domain: 3,1,4
Range: 2,3,5,7
c. This relation is not a function because the graph fails the vertical line test.
Domain: 1,
Range: is any real number xx
d. This relation is a function because it passes the vertical line test.
Domain: is any real number xx
Range: |2yy or 2,
2. 45 f xx
The function tells us to take the square root of 45 x . Only nonnegative numbers have real square roots so we need 450 x
3.
The function tells us to divide 2 x by 2 x Division by 0 is undefined, so the denominator
can never equal 0. This means that 2 x
Domain: |2xx
12 1 11 1 12 g
4. 2 4 536 x hx xx
The function tells us to divide 4 x by 2 536xx . Since division by 0 is not defined, we need to exclude any values which make the denominator 0.
2 5360 940 xx xx 9 or 4 xx
Domain: |9,4xxx
(note: there is a common factor of 4 x but we must determine the domain prior to simplifying)
2 14 51 1 408 15136 h
5. a. To find the domain, note that all the points on the graph will have an x-coordinate between 5 and 5, inclusive. To find the range, note that all the points on the graph will have a y-coordinate between 3 and 3, inclusive.
Domain: |55xx or 5,5
Range: |33yy or 3,3
b. The intercepts are 0,2 , 2,0 , and 2,0 x-intercepts: 2,2 y-intercept: 2
c. 1 f is the value of the function when 1 x . According to the graph, 13 f
d. Since 5,3 and 3,3 are the only points on the graph for which 3 yfx , we have 3 fx when 5 x and 3 x
e. To solve 0 fx , we want to find xvalues such that the graph is below the xaxis. The graph is below the x-axis for values in the domain that are less than 2 and greater than 2. Therefore, the solution set is |52 or 25xxx . In
interval notation we would write the solution set as 5,22,5 . 6. 432242fxxxx
We set Xmin = 5 and Xmax = 5. The standard Ymin and Ymax will not be good enough to see the whole picture so some adjustment must be made.
We see that the graph has a local maximum value of 0.86 (rounded to two places) when 0.85 x and another local maximum value of 15.55 when 2.35 x . There is a local minimum value of 2 when 0 x . Thus, we have Local maxima:
Local minima: 02 f
The function is increasing on the intervals 5,0.85 and 0,2.35 and decreasing on the intervals 0.85,0 and
2.35,5
To graph the function, we graph each “piece”. First we graph the line 21 y x but only keep the part for which 1 x Then we plot the line 4 yx but only
keep the part for which 1 x
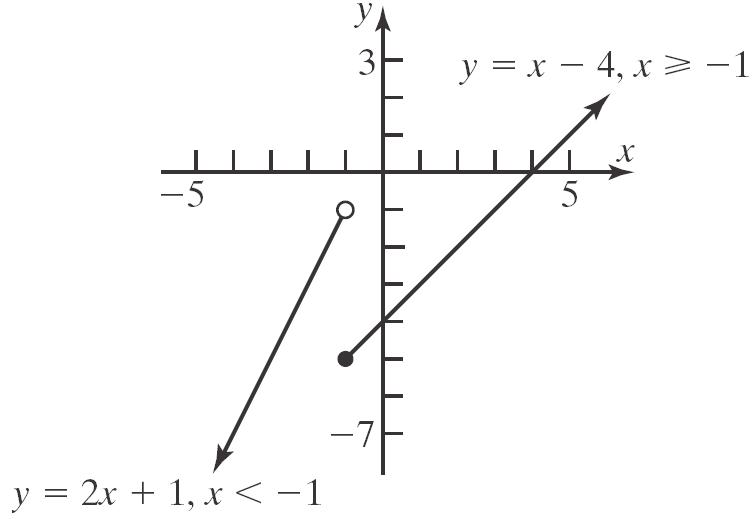
b. To find the intercepts, notice that the only piece that hits either axis is 4 yx 4 04 4 yx y y
The intercepts are 0,4 and 4,0
c. To find 5 g we first note that 5 x so we must use the first “piece” because 51 . 52511019 g
d. To find 2 g we first note that 2 x so we must use the second “piece” because 21 2242 g
8. a. The average rate of change from 3 to 4 is given by
22 43 43 3434433334 43 402218 18 431
b. 4018(4) 401872 1832 yx yx yx
9. a. 2 22 ()()2132 2132233 fgxxx x xxx
b. 2 32 ()()2132 6432 fgxxx x xx
10. a. The basic function is 3 y x so we start with the graph of this function.
Next we shift this graph 1 unit to the left to obtain the graph of 3 1 yx
3 21 y x
The last step is to shift this graph up 3 units to obtain the graph of 3 213yx
b. The basic function is y x so we start with the graph of this function.
Next we reflect this graph about the x-axis to obtain the graph of 3 1 yx
Next we shift this graph 4 units to the left to obtain the graph of 4 yx
Next we stretch this graph vertically by a factor of 2 to obtain the graph of
3 21
Next we shift this graph up 2 units to obtain
Chapter 1: Functions and Their Graphs
the graph of 42 yx
Now we multiply this by the area to obtain the volume. That is,
b. If the rink is 90 feet wide, then we have 90 x
12. a. Let x = width of the rink in feet. Then the length of the rectangular portion is given by 220 x . The radius of the semicircular portions is half the width, or 2 x r .
To find the volume, we first find the area of the surface and multiply by the thickness of the ice. The two semicircles can be combined to form a complete circle, so the area is given by
So, we have the equation
If l = 100 and 3 710 r , then
ohms
We have expressed our measures in feet so we need to convert the thickness to feet as well.
Chapter 1 Projects
Project I – Internet-based Project – Answers will vary
Project II
1. Silver:
3. Let y = #K-bytes of service over the plan minimum.
Silver: 200.1650
Silver is the best up to 187.5200387.5
K-bytes of service.
Gold: 500.08100 0.0850 625 y
Gold is the best from 387.5 K-bytes to 62510001625 K-bytes of service.
Platinum: Platinum will be the best if more than 1625 K-bytes is needed.
4. Answers will vary.
01000140425$753.92 11001140416$726.10 2100214049$704.78 3100314044$695.98 4100414041$713.05 5100514040$780.00
The choice where the cable goes 3 miles down the road then cutting up to the house seems to yield the lowest cost.
4. Since all of the costs are less than $800, there would be a profit made with any of the plans.
Using the MINIMUM function on a graphing calculator, the minimum occurs at 2.96 x
C() dollars x

The minimum cost occurs when the cable runs for 2.96 mile along the road.
Chapter 1: Functions and Their Graphs
6. 2 C(4.5) = 100(4.5) + 1404(54.5) $738.62
The cost for the Steven’s cable would be $738.62.
7. 5000(738.62) = $3,693,100 State legislated 5000(695.96) = $3,479,800 cheapest cost It will cost the company $213,300 more.
IV
4. 22 22 (4.4)60.82ft (5.5)95.03ft
5. (2.2)4.8422 A tt
4.84(2)60.82ft 4.84(2.5)95.03ft
7. (2.5)(2)95.0360.82 68.42 ft/hr 2.520.5
8. (3.5)(3)186.27136.85 98.84ft/hr 3.530.5
9. The average rate of change is increasing.
10. 150 yds = 450 ft 2.2 450 204.5 hours 2.2
11. 6 miles = 31680 ft Therefore, we need a radius of 15,840 ft. 15,840 7200 hours 2.2
