
CHAPTER 2 THINKING LIKE AN ECONOMIST
LEARNING OBJECTIVES:
By the end of this chapter, students should understand:
• how economists apply the methods of science.
• how assumptions and models can shed light on the world.
• two simple models the circular flow and the production possibilities frontier.
• the difference between microeconomics and macroeconomics.
• the difference between positive and normative statements.
• the role of economists in making policy.
• why economists sometimes disagree with one another.
CONTEXT AND PURPOSE:
Chapter 2 is the se cond chapter in a three-chapter section that serves as t he introductio n of the text. Chapter 1 introduced te n principles o f economics that will be revisited thro ugho ut the text. Chapter 2 develops how eco nomists approach pro blems while Chapter 3 will explain how individuals and co untries gain from trade.
The purpose o f Chapter 2 is to familiarize stude nts with how economists approach economic problems. With practice, t hey will learn how to approach similar pro blems in this dispassionate systematic way. They will see how economists emplo y the scientific method, t he role o f assumptions in model building, and the application of two specific economic models. Students will also learn the important distinctio n between two roles economists can play: as scientists when we try to e xplain the economic world and as policymakers when we try to improve it.
KEY POINTS:
• Economists try to address their subject with a scientist’s objectivity. Like all scientists, they make appropriate assumptions and build simplified models in order to understand the world around them. Two simple economic models are the circular-flow diagram and the production possibilities frontier.
• The field of economics is divided into two subfields: microeconomics and macroeconomics.
• Microeconomists study decision-making by households and firms and the interaction among households and firms in the marketplace. Macroeconomists study the forces and trends that affect the economy as a whole.
• A positive statement is an assertion about how the world is. A normative statement is an assertion about how the world ought to be. When economists make normative statements, they are acting more as policy advisers than scientists.
• Economists who advise policymakers offer conflicting advice either because of differences in scientific judgments or because of differences in values. At other times, economists are united in the advice they offer, but policymakers may choose to ignore it.
CHAPTER OUTLINE:
1. The Economist as Scientist
a. Economists Follow the Scientific Method: Observation, Theory and More Observation.
i. Observations help us to develop theory.
ii. Data can be collected and analyzed to evaluate theories.
iii. Using data to evaluate theories is more difficult in economics than in physical science because economists are unable to generate their own data and must make do with whatever data are available.
iv. Thus, economists pay close attention to the natural experiments offered by history.
b. The Role of Assumptions
i. Assumptions make the world easier to understand.
ii. Example: to understand international trade, it may be helpful to start out assuming that there are only two countries in the world producing only two goods. Once we understand how trade would work between these two countries, we can extend our analysis to a greater number of countries and goods.
iii. One important role of a scientist is to understand which assumptions one should make.
iv. Economists often use assumptions that are somewhat unrealistic but will have small effects on the actual outcome of the answer.
c. Economic Models

To illustrate to the class how simple but unrealistic models can be useful, bring a road map to class. Point out how unrealistic it is. For example, it does not show where all of the stop signs, gas stations, or restaurants are located. It assumes that the earth is flat and two-dimensional. But, despite these simplifications, a map usually helps travelers get from one place to another. Thus, it is a good model.
i. Economists use economic models to help explain the world around us.
ii. Most economic models are composed of diagrams and equations.
iii. The goal of a model is to simplify reality in order to increase our understanding. This is where the use of assumptions is helpful.
d. Our First Model: The Circular Flow Diagram (refer to Figure 2.1)
i. Definition of circular-flow diagram: a visual model of the economy that shows how dollars flow through markets among households and firms
ii. This diagram is a very simple model of the economy. Note that it ignores the roles of government and international trade.
1. There are two decision makers in the model: households and firms.
2. There are two markets: the market for goods and services and the market for factors of production.
3. Firms are sellers in the market for goods and services and buyers in the market for factors of production.
4. Households are buyers in the market for goods and services and sellers in the market for factors of production.
5. The inner loop represents the flows of inputs and outputs between households and firms.
6. The outer loop represents the flows of dollars between households and firms.
e. Our Second Model: The Production Possibilities Frontier
i. Definition of production possibilities frontier: a graph that shows the combinations of output that the economy can possibly produce given the available factors of production and the available production technology.
Spend more time with this model than you think is necessary. Be aware that the math and graphing skills of many of your students will be limited. It is important for the students to feel confident with this first graphical and mathematical model. Be deliberate with every point. If you lose them with this model, they may be gone for the rest of the course.
ii. Example: an economy that produces two goods, cars and computers (refer to Figure 2.2)
1. If all resources are devoted to producing cars, the economy would produce 1,000 cars and zero computers.
2. If all resources are devoted to producing computers, the economy would produce 3,000 computers and zero cars.
3. More likely, the resources will be divided between the two industries, producing some cars and some computers. The feasible combinations of output are shown on the production possibilities frontier.
4. You may want to include time dimensions for variables. This will help students to realize that a new production possibilities frontier occurs for each period. Thus, the axes show the levels of output per period.
You may want to include time dimensions for variables. This will help students to realize that a new production possibilities frontier occurs for each period. Thus, the axes show the levels of output per period.
Alternative classroom example
A small country produces two goods: DVD players and DVDs. Po ints o n a production possibilities frontier can be shown in a table or a graph:
The production possibilities frontier should be drawn from the num bers above.
Students should be asked to calculate the opportunity cost of increasing the number of DVD players produced by 100:
• between 0 and 100
• between 100 and 200
• between 200 and 300
• between 300 and 400
iii. Because resources are scarce, not every combination of computers and cars is possible. Production at a point outside of the curve (such as C) is not possible given the economy’s current level of resources and technology.
It is useful to point out that the production possibilities frontier depends on two things: the availability of resources and the level of technology.
iv. Production is efficient at points on the curve (such as A and B). This implies that the economy is getting all it can from the scarce resources it has available. There is no way to produce more of one good without producing less of another.
v. Production at a point inside the curve (such as D) is inefficient.
1. This means that the economy is producing less than it can from the resources it has available.
2. If the source of the inefficiency is eliminated, the economy can increase its production of both goods.
vi. The production possibilities frontier reveals Principle #1: People face trade-offs.
1. Suppose the economy is currently producing 600 cars and 2,200 computers.
2. To increase the production of cars to 700, the production of computers must fall to 2,000.
vii. Principle #2 is also shown on the production possibilities frontier: The cost of something is what you give up to get it (opportunity cost).
1. The opportunity cost of increasing the production of cars from 600 to 700 is 200 computers.
2. Thus, the opportunity cost of each car is two computers.
viii. The opportunity cost of a car depends on the number of cars and computers currently produced by the economy.
1. The opportunity cost of a car is high when the economy is producing many cars and few computers.
2. The opportunity cost of a car is low when the economy is producing few cars and many computers.
ix. Economists generally believe that production possibilities frontiers often have this bowed-out shape because some resources are better suited to the production of cars than computers (and vice versa).

Be aware that students often have trouble understanding why opportunity costs rise as the production of a good increases. You may want to use several specific examples of resources that are more suited to producing cars than computers (e.g., an experienced mechanic) as well as examples of resources that are more suited to producing computers than cars (e.g., an experienced computer programmer).
x. The production possibilities frontier can shift if resource availability or technology changes. Economic growth can be illustrated by an outward shift of the production possibilities frontier. (Refer to Figure 2.3)
You may also want to teach students about budget constraints at this time (call them “consumption possibilities frontiers”). This reinforces the idea of opportunity cost and allows them to see how opportunity cost can be measured by the slope. Also, it will introduce students to the use of straight-line production possibilities frontiers (which appear in Chapter 3). However, be careful if you choose to do this as students often find the difference between straight-line and concave production possibilities frontiers challenging.
Alternative classroom examples
Aarif receives an allowance from his parents of $20 each week. He spends his entire allowance on two goods: bags of sweets (which cost $2 each) and tickets to the movies (which cost $10 each).
Students should be asked to calculate the opportunity cost of one movie and the opportunity cost of one bag of sweets.
Aarif’s consumption possibilities frontier (budget constraint) can be drawn. It should be noted that the slope is equal to the opportunity cost and is constant because the opportunity cost is constant.
Ask students what would happen to the consumption possibilities frontier if Aarif’s allowance changes or if the price of bags of sweets or movies changes.
f. Microeconomics and Macroeconomics
i. Economics is studied on various levels.
1. Definition of microeconomics: the study of how households and firms make decisions and how they interact in markets.
2. Definition of macroeconomics: the study of economy-wide phenomena, including inflation, unemployment, and economic growth.
ii. Microeconomics and macroeconomics are closely intertwined because changes in
the overall economy arise from the decisions of individual households and firms.
iii. Because microeconomics and macroeconomics address different questions, each field has its own set of models which are often taught in separate courses.
iv. Economics can seem abstract at first, but it is fundamentally very practical and the study of economics is useful in many different career paths.
v. This box provides a sample of well-known individuals who majored in economics in college.
2. The Economist as Policy Adviser
a. Positive versus Normative Analysis
i. Example of a discussion of minimum-wage laws: Hoda says, “Minimum-wage laws cause unemployment.” Jawad says, “The government should raise the minimum wage.”
ii. Definition of positive statements: claims that attempt to describe the world as it is.
iii. Definition of normative statements: claims that attempt to prescribe how the world should be.
iv. Positive statements can be evaluated by examining data, while normative statements involve personal viewpoints
v. Positive views about how the world works affect normative views about which policies are desirable.
Use several examples to illustrate the differences between positive and normative statements and stimulate classroom discussion. Possible examples include the minimum wage, budget deficits, tobacco taxes, and seat-belt laws.
Have students bring in newspaper articles and in groups, identify each statement in an editorial paragraph as being a positive or normative statement. Discuss the differences among news stories, editorials, and blogs and the analogy to economists as scientists and as policy advisers.
b. Much of economics is positive; it tries to explain how the economy works. But those who use economics often have goals that are normative. They want to understand how to improve the economy.
c. Case Study: Minimum-wage laws in the Arab world
Looks at how minimum-wage laws vary across Arab world countries in terms of which citizens and which sectors it applies to.
d. Economists in Governments
i. Economists are aware that trade-offs are involved in most policy decisions.
ii. In the United States., the president receives advice from the Council of Economic Advisers (created in 1946).
iii. Economists are also employed by administrative departments within the various administrative departments such as the Office of Management and Budget, the Department of Treasury, the Department of Labor, the Congressional Budget Office and the Federal Reserve.
iv. The research and writings of economists can also indirectly affect public policy. economic policies.
e. Why Economists’ Advice Is Not Always Followed
i. The process by which economic policy is made differs from the idealized policy process assumed in textbooks.
ii. Economists offer crucial input into the policy process, but their advice is only part of the advice received by policymakers.
3. Why Economists Disagree
a. Differences in Scientific Judgments
i. Economists may disagree about the validity of alternative positive theories or about the size of the effects of changes in the economy on the behavior of households and firms.
ii. Example: some economists feel that a change from income to consumption tax would increase. However, other economists feel that the change in the tax system would have little effect on saving behavior and therefore do not support the change.
b. Differences in Values
i. For example, difficult questions that relate to the fairness of tax systems
c. Perception versus Reality
i. While it seems as if economists do not agree on much, this is in fact not true. Table 2.1 contains 20 propositions that are endorsed by a majority of economists.
Emphasize that there is more agreement among economists than most people think. The reason for this is probably that the things that are generally agreed upon are boring to most non-economists.
ii. Almost all economists believe that rent control adversely affects the availability and quality of housing.
iii. Most economists also oppose barriers to trade.
4. In the News: Saudi Arabia: Vision 2030
a. Looks at how Sadia Arabia will attempt to diversify its economy away from oil dependency.
5. Appendix Graphing: A Brief Review
Many instructors may be unaware of how much trouble beginning students have grasping the most basic graphs. It is important for instructors to make sure that students are comfortable with these techniques.
When reviewing graphing with the students, it is best to bring students to the board to be “recorders” of what the other students say as you give a series of instructions like “Draw a pie chart” or ask questions like “How tall should the bar be if the value is 120 million?” Do not make the student at the board responsible for the answer. Instead, they should be simply recording what the other students say. Students are often uneasy about graphing at first and need to gain confidence.
a. Graphs of a Single Variable (refer to Figure A2.1)
i. Pie Chart
ii. Bar Graph
iii. Time-Series Graph
b. Graphs of Two Variables: The Coordinate System (refer to Figure A2.2)
i. Economists are often concerned with relationships between two or more variables.
ii. Ordered pairs of numbers can be graphed on a two-dimensional grid.
1. The first number in the ordered pair is the x-coordinate and tells us the horizontal location of the point.
2. The second number in the ordered pair is the y-coordinate and tells us the vertical location of the point.
iii. The point with both an x-coordinate and y-coordinate of zero is called the origin.
iv. Two variables that increase or decrease together have a positive correlation.
v. Two variables that move in opposite directions (one increases when the other decreases) have a negative correlation.
c. Curves in the Coordinate System (refer to Table A2.1 and Figure A2.3)
i. Often, economists want to show how one variable affects another, holding all other variables constant.
1. An example of this is a demand curve.
2. The demand curve shows how the quantity of a good a consumer wants to purchase varies as its price varies, holding everything else (such as income) constant.
ii. If income does change, this will alter the amount of a good that the consumer wants to purchase at any given price. Thus, the relationship between price and quantity desired has changed and must be represented as a new demand curve (refer to Figure A2.4)
iii. A simple way to tell if it is necessary to shift the curve is to look at the axes. When a variable that is not named on either axis changes, the curve shifts.
d. Slope (refer to Figure A2.5)
i. We may want to ask how strongly a consumer reacts if the price of a product
changes.
1. If the demand curve is very steep, the quantity desired does not change much in response to a change in price.
2. If the demand curve is very flat, the quantity desired changes a great deal when the price changes.
ii. The slope of a line is the ratio of the vertical distance covered to the horizontal distance covered as we move along the line (“rise over run”).
iii. A small slope (in absolute value) means that the demand curve is relatively flat; a large slope (in absolute value) means that the demand curve is relatively steep.
e. Cause and Effect
i. Economists often make statements suggesting that a change in Variable A causes a change in Variable B.
ii. Ideally, we would like to see how changes in Variable A affect Variable B, holding all other variables constant.
iii. This is not always possible and could lead to a problem caused by omitted variables (refer to Figure A2.6)
1. If Variables A and B both change at the same time, we may conclude that the change in Variable A caused the change in Variable B.
2. But, if Variable C has also changed, it is entirely possible that Variable C is responsible for the change in Variable B.
iv. Another problem is reverse causality (refer to Figure A2.7)
1. If Variable A and Variable B both change at the same time, we may believe that the change in Variable A led to the change in Variable B.
2. However, it is entirely possible that the change in Variable B led to the change in Variable A.
3. It is not always as simple as determining which variable changed first because individuals often change their behavior in response to a change in their expectations about the future. This means that Variable A may change before Variable B but only because of the expected change in Variable B.
There are two very good examples in the text that you should use in class. To discuss the omitted variable problem, point out to students that a rise in the sales of cigarette lighters is positively related to the number of individuals diagnosed with lung cancer. To discuss reverse causality, show that an increase in sales of larger cars is followed by an increase in birth rates.
SOLUTIONS TO TEXT PROBLEMS:
Quick Quizzes
• Economics is like a science because economists devise theories, collect data, and analyze the data in an attempt to verify or refute their theories. In other words, economics is based on the scientific method.
Figure 1 shows the production possibilities frontier for a society that produces food and clothing. Point A is an efficient point (on the frontier), point B is an inefficient point (inside the frontier), and point C is an infeasible point (outside the frontier).
Figure 1

The effects of a drought are shown in Figure 2. The drought reduces the amount of food that can be produced, shifting the production possibilities frontier inward. (If a drought also reduced the amount of cotton available for the production of clothing, the intercept on the vertical axis would also decrease.)
Figure 2

Microeconomics is the study of how households and firms make decisions and how they interact in markets. Macroeconomics is the study of economy-wide phenomena, including inflation, unemployment, and economic growth.
• An example of a positive statement is “a higher price of coffee causes me to buy more tea.” It is a positive statement because it is a claim that describes the world as it is. An example of a normative statement is “the government should restrain coffee prices.” It is a normative statement because it is a claim that prescribes how the world should be. Many other examples are possible. Parts of the government that regularly rely on advice from economists are the treasury in designing tax policy, the department of labor in analyzing data on the employment situation, the budget office in evaluating policy proposals, and the central bank in analyzing economic developments. Many other answers are possible.
• Economic advisers to a president might disagree about a question of policy because of differences in scientific judgments or differences in values.
Case Study Guidance
• In might be viewed as macroeconomics since changes in minimum wage legislation will impact on the whole of the economy. However, there is a micro element as minimum wage changes have an effect on individual businesses and individual workers. For example, a higher minimum wage might discourage a small business from employing more inexperienced staff.
• The ILO report is an example of both. It is positive economics when it refers to how it is, and normative economics when it suggests how it should be.
• The science should be evidence-based. This depends on the quality of data. If it is not truly evidencedbased, then decisions are normative in nature.
• Answers should refer to the diverse nature of the workforce in some Arab states, especially if the minimum wage offer differs between migrant and indigenous workers. You should research the minimum wage policy in the country in which you are studying.
In The News Guidance
• Remember the model is a simplification of reality. An investment in technology and education capital should lead to an outward shift in the PPF. In the short-run think about the trade-off with consumer goods and how this shifts the curve outwards more for capital goods, but that it should lead to longterm increases consumer consumption. You can explain this diagrammatically showing shifts and using a simple example. For example, the government raises taxes to spend on education centers. This help attract inward investment which leads to jobs with higher incomes. People with these higher incomes spend more on consumer goods.
• The macroeconomic factors include the need to keep the economy growing when oil revenues decline. The microeconomic factors refer to improving the opportunities for individual people and businesses.
• Economists will have provided advice to the Saudi government including advice on the benefits of setting up special zones to help diversify the economy and promote economic growth. These special zones are linked to different business sectors. Each region would specialize in what it has a comparative advantage in. For example, the article notes that coastal regions target tourism. Economists might make a positive statement such as evidence demonstrates that encouraging tourism is more effective in coastal areas than in other regions. Additional evidence shows this will lead to a greater increase in jobs and in exports.
Economists might also make normative statements such as we must improve our national identity as a
key priority to keep people happy.
• Comment on things global companies must consider when looking for opportunities around the world to invest. These companies want to be sure that legislation on legal contracts meets international standards, so that it is easier for these companies to trade across different countries. The World Bank publish an ease of doing business index for countries which includes a number of measures. Take a look at how Saudi performs relative to other countries.
• Some differences will be based upon how reliable the evidence base is, but other differences are a result of economists having different value judgments. For example, one economist may feel the impact on the environment is the key priority, whilst another’s priority might be future jobs for young people.
Questions for Review
1. Economics is like a science because economists use the scientific method. They devise theories, collect data, and then analyze these data in an attempt to verify or refute their theories about how the world works. Economists use theory and observation like other scientists, but they are limited in their ability to run controlled experiments. Instead, they must rely on natural experiments.
2. Economists make assumptions to simplify problems without substantially affecting the answer.
3. Assumptions can make the world easier to understand.
4. An economic model cannot describe reality exactly because it would be too complicated to understand. A model is a simplification that allows the economist to see what is truly important.
5. There are many possible answers.
6. There are many possible answers.
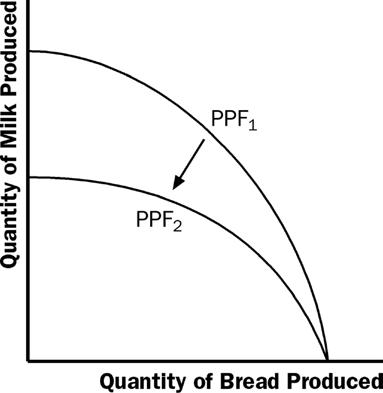
7. Figure 3 shows a production possibilities frontier between milk and bread (PPF1). If a disease kills half of the economy's cow population, less milk production is possible, so the PPF shifts inward (PPF2). Note that if the economy produces all bread, it does not need any cows and production is unaffected. But if the economy produces any milk at all, then there will be less production possible after the disease hits.
Figure 3
8. An outcome is efficient if the economy is getting all it can from the scarce resources it has available. In terms of the production possibilities frontier, an efficient point is a point on the frontier, such as
point A in Figure 4. When the economy is using its resources efficiently, it cannot increase the production of one good without reducing the production of the other. A point inside the frontier, such as point B, is inefficient since more of one good could be produced without reducing the production of another good.
4

9. The two subfields in economics are microeconomics and macroeconomics. Microeconomics is the study of how households and firms make decisions and how they interact in specific markets. Macroeconomics is the study of economy-wide phenomena, including inflation, unemployment, and economic growth.
10. Positive statements are descriptive and make a claim about how the world is, while normative statements are prescriptive and make a claim about how the world ought to be. Here is an example. Positive: A rapid growth rate of money is the cause of inflation. Normative: The government should keep the growth rate of money low.
11. Economists sometimes offer conflicting advice to policymakers for two reasons: (1) economists may disagree about the validity of alternative positive theories about how the world works; and (2) economists may have different values and, therefore, different normative views about what public policy should try to accomplish.
Figure
Problems and Applications
1. See Figure 5; the four transactions are shown.
Figure 5

2.
a. Figure 6 shows a production possibilities frontier between clothes and food. It is bowed out because the opportunity cost of food depends on how much food and how many clothes the economy is producing. When the economy is producing a lot of food, workers and machines best suited to making clothing are being used to make food, so each unit of clothing given up yields a small increase in the production of food. Thus, the frontier is steep and the opportunity cost of producing food is high. When the economy is producing a lot of clothing, workers and machines best suited to making food are being used to make clothing, so each unit of clothing given up yields a large increase in the production of food. Thus, the frontier is very flat and the opportunity cost of producing food is low.
Figure 6

b. Point A is impossible for the economy to achieve; it is outside the production possibilities frontier. Point B is feasible but inefficient because it is inside the production possibilities frontier.
c. Badroulbadour might choose a point like H, with much clothing and not much food. Marjanah might choose a point like D, with a lot of food and few clothes.
d. If both opposing economists reduced their desired quantity of clothing by the same amount, Badroulbadour would get a bigger dividend because the production possibilities frontier is much flatter at point H than at point D. As a result, the reduction of a given number of clothes starting at point H, leads to a much larger increase in the quantity of food produced than when starting at point D.
3. See Figure 7. The shape and position of the possibilities frontier depend on how costly it is to maintain a clean environment - the productivity of the environmental industry. Gains in environmental productivity, such as the development of new way to produce electricity that emits fewer pollutants, lead to shifts of the production-possibilities frontier, like the shift from PPF1 to PPF2 shown in the figure.
Figure 7

4. a.
A: 40 lawns mowed; 0 washed cars
B: 0 lawns mowed, 40 washed cars
C: 20 lawns mowed; 20 washed cars
D: 25 lawns mowed; 25 washed cars
b. The production possibilities frontier is shown in Figure 8. Points A, B and D are on the frontier, while point C is inside the frontier.
5.

c. Karam is equally productive at both tasks. Warda is more productive at washing cars, while Nasim is more productive at mowing lawns.
d. Allocation C is inefficient. More washed cars and mowed lawns can be produced by simply reallocating the time of the three individuals.
a. A family's decision about how much income to save is related to microeconomics.
b. The effect of government regulations on car emissions is related to microeconomics.
c. The impact of higher saving on economic growth is related to macroeconomics.
d. A firm's decision about how many workers to hire is related to microeconomics.
e. The relationship between the inflation rate and changes in the quantity of money is related to macroeconomics.
6.
a. The statement that society faces a short-run trade-off between inflation and unemployment is a positive statement. It deals with how the economy is, not how it should be. Since economists have examined data and found that there is a short-run negative relationship between inflation and unemployment, the statement is a fact, thus it is a positive statement.
b. The statement that a reduction in the rate of money growth will reduce the rate of inflation is a positive statement. Economists have found that money growth and inflation are very closely related. The statement thus tells how the world is, and so it is a positive statement.
c. The statement that the central bank should reduce the rate of money growth is a normative statement. It states an opinion about something that should be done, not how the world is.
Figure 8
d. The statement that society ought to require welfare recipients to look for jobs is a normative statement. It does not state a fact about how the world is. Instead, it is a statement of how the world should be and is thus a normative statement.
e. The statement that lower tax rates encourage more work and more saving is a positive statement. Economists have studied the relationship between tax rates and work, as well as the relationship between tax rates and saving. They have found a negative relationship in both cases. So the statement reflects how the world is and is thus a positive statement.
7. As the leader, you would be interested in both the positive and normative views of economists, but you would probably be most interested in their positive views. Economists are on your staff to provide their expertise about how the economy works. They know many facts about the economy and the interaction of different sectors. So you would be most likely to call on them about questions of fact or positive analysis. Since you are the leader, you are the one who has to make the normative statements as to what should be done, with an eye to the political consequences. The normative statements made by economists represent their own views, not necessarily your views or the electorate’s views.
Case study Part 1: Introduction to Economics
The beauty and wellness industry
During the COVID-19 pandemic, many countries reported increased instances of mental health issues as people have had to come to terms with a changed lifestyle. It is perhaps not surprising, therefore, that the global wellness industry, which includes personal care and beauty, mental and physical well-being, spa treatments and so on, is growing and is estimated to have a global worth of over $4.5 trillion, accounting for around 5 percent of global economic output. As with many other aspects of life these days, the beauty and wellness industry is very much focused on natural and organic products that have been ethically produced, responding to changing customer demands.
In the Middle East the sector is expected to grow at around 12 percent annually and to have a value in excess of $58 billion by 2025. This growth of the industry in the Middle East is reflected in the annual Beautyworld Middle East trade fair. In 2019, some 1,800 exhibitors and over 44,000 delegates from all over the world attended the 24th trade. Covid restrictions might limit the number of people who can physically attend subsequent fairs, but there will be plenty of virtual experiences to cater for those who cannot be there in person.
The increase in demand for beauty and wellness products across the Middle East is fueled in part by the increase in disposable income of people in the region. Standards of living in the Middle East as a whole are improving, and these are not simply about having more goods but about enhancing mental and physical well-being.
Questions:
1. The beauty and wellness industry must respond to changing demand in favor of more ethically produced and sourced products. What do you think are the trade-offs that both the industry and customers face in making choices about producing and consuming such products?
2. Using the wellness industry as a context, to what extent would you agree that improvements in the standard of living are not just about having more goods and services?
3. Do you think that the principle of comparative advantage applies to the global beauty and wellness industry?
Sources: www.arabnews.com/node/1871266/corporate-news
beautyworld-middle-east.ae.messefrankfurt.com/dubai/en.html globalwellnessinstitute.org/press-room/statistics-and-facts
Answer guidance
The following is a brief guide to how you might approach the answers to the questions and what you might include. They are not exclusive of other approaches.
Q1:
Producers might have to change their production methods, which will involve trade-offs and opportunity costs – sourcing and using ethically sustainable organic products might be more expensive, but what benefits do they provide to producers?
Consumers might have to pay more for organic products – comment on the trade-off of paying more versus the benefits of buying ethical products.
Q2:
Wellness is about both mental and physical well-being – you might comment on whether simply having more goods and services always leads to improvements in standards of living. The pandemic might have highlighted the importance of other factors in contributing to our ‘standard of living’, and you could explore what this concept actually means in reality.
Q3:
The exhibitors at the trade fair come from many different countries around the world. Does this mean that firms in each of those countries has a comparative advantage in the production of beauty and wellness products? How can so many firms each have comparative advantage? If these firms do not have comparative advantage, does this diminish the benefits of global trade in beauty and wellness products?