
Chapter 01 - The Role of Statistics and the Data Analysis Process
1. How do inferential and descriptive statistics differ?
a. Descriptive statistics involve organizing, summarizing, and presenting data that has been collected. Inferential statistics involve generalizing the results of a sample to a larger population.
b. Descriptive statistics involve generalizing the results of a sample to a larger population.
Inferential statistics involve organizing, summarizing, and presenting data that has been collected.
c. Descriptive statistics involve organizing and summarizing data that has been collected.
Inferential statistics involve presenting data that has been collected and generalizing the results of a sample to a larger population.
d. Descriptive statistics involve presenting data that has been collected and generalizing the results of a sample to a larger population.
Inferential statistics involve organizing and summarizing data that has been collected.
ANSWER: a
2. Which of the following lists the steps in the data analysis process in the correct order?
a. Data collection. Data summarization. Formal data analysis.
b. Data summarization. Formal data analysis. Data collection.
c. Data summarization. Data collection. Formal data analysis.
d. Data collection. Formal data analysis. Data summarization.
ANSWER: a
3. Suppose you want to learn how often chemistry students attending a local college visit the student fitness center on campus. You interviewed students from the chemistry department who have an athletic build. Which step in the data analysis process have you completed?
a. Data collection
b. Deciding what to measure and how to measure it
c. Data summarization and preliminary analysis
d. Formal data analysis
ANSWER: a
4. How do populations and samples differ?
a. A sample is only some part of a population that has been selected for study.
b. A population is only some part of a sample that has been selected for study.
c. A population is always a part of a sample, but some samples do not contain populations.
d. Sample and population are different words for the same information about a group.
ANSWER: a
5. Consider the chart below, which shows bird species gathered near the runways of an airport. To which step in the data analysis process does the chart relate?
Chapter 01 - The Role of Statistics and the Data Analysis Process
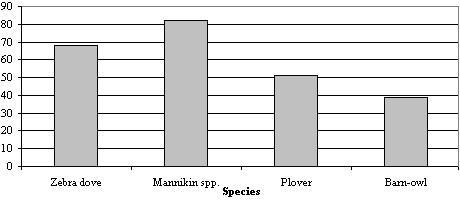
a. Data summarization and preliminary analysis.
b. Data collection.
c. Formal data analysis.
d. Understanding the nature of the problem.
ANSWER: a
INSTRUCTIONS:
The following questions are in a True/False format. The answers to these questions will frequently depend on remembering facts, understanding of the concepts, and knowing the statistical vocabulary. Before answering these questions, be sure to read them carefully!
6. The entire collection of individuals or objects about which information is desired is called a sample.
a. True
b. False
ANSWER: False
7. Methods for summarizing data make up the branch of statistics called inferential statistics.
a. True
b. False
ANSWER: False
8. A primary use of inferential statistics is to make generalizations from a sample to a population.
a. True
b. False
ANSWER: True
9. A data set is discrete if the possible values are isolated points on the number line.
a. True
b. False
ANSWER: True
10. A data set consisting of many observations of a single characteristic is a categorical data set.
a. True
b. False
ANSWER: False
11. Your laboratory procedure asks you to record the following information about each sample you analyze:
I) Sample weight in grams
II) Name of the customer who submitted the sample
III) Age of the customer who submitted the sample
IV) Sample temperature at the time of submission
Which of these represents numerical data?
a. I only
b. I and II only
c. I and III only
d. I, III, and IV only
ANSWER: d
12. A survey form regarding preferred breakfast food choices solicits the following responses:
I) Preferred hot beverage (coffee, tea, or cocoa)
II) Preferred entrée (omelet, pancakes, or sausages)
III) Amount of hot beverage consumed (cups)
IV) Age of the respondent
Which of these represents categorical data?
a. IV only
b. I and II only
c. II and III only
d. II and IV only
ANSWER: b
13. You are a wildlife biologist planning to gather field data on a rare bird species. For each study location, you will record the following data:
I) Prevalent vegetation (pine forest, grassland, or deciduous forest)
II) Distance in miles from the nearest city
III) Elevation above mean sea level in feet
IV) Maximum daytime temperature in degrees Fahrenheit
Which of the following accurately describes your data?
a. I and II are categorical, while III and IV are numerical
b. I, III, and IV are categorical, while II is numerical
c. I is categorical, while II, III, and IV are numerical
d. I and IV are categorical, while II and III are numerical
ANSWER: c
14. You are creating a survey to assess the political involvement of students at your university. Your survey questions ask respondents for the following:
I) What is your age?
II) What is your residence location (on-campus vs. off-campus)?
III) What is your political party?
IV) How many elections have you voted in over your lifetime?
Which of the following accurately describes the data you are gathering?
a. I and IV are numerical, while II and III are categorical
b. II and III are numerical, while I and IV are categorical
Chapter 01 - The Role of Statistics and the Data Analysis Process
c. I II, and III are numerical, while IV is categorical
d. IV is numerical, while I, II, and III are categorical
ANSWER: a
15. A consumer information survey form solicits the following responses:
I) Age of the respondent
II) Gender of the respondent
III) Level of job satisfaction (satisfied, somewhat satisfied, dissatisfied)
IV) Annual income
Which of the responses represents categorical data?
a. I only
b. II only
c. III only
d. II and III only
ANSWER: d
16. The following variables are commonly used to describe human appearance:
I) Eye color (blue, green, brown, grey)
II) Hair color (brown, black, blond, grey)
III) Hair length
IV) Waist circumference
Which of these variables are categorical?
a. I only
b. II only
c. II and III only
d. I and II only
ANSWER: d
17. A data set is discrete if the possible values are isolated points on the number line.
a. True
b. False
ANSWER: True
18. You are gathering data on the sales of packaged hard candies sold in a hotel gift shop. Your variables of interest include:
I) The type of container in which the candies are packaged (glass jar, cardboard box, or plastic bag)
II) The weight of the container
III) The number of candies in the container
IV) The height above the floor at which the candy-filled container was displayed
Which of the variables of interest are numerical and discrete?
a. I only
b. II only
c. III only
d. II and III only
ANSWER: c
19. Which of the following variables are discrete?
I) The volume of liquid in a 16-ounce bottle of soda pop
II) The percentage of males aged 18-25 years who participate in a contact sport
III) The number of broken eggs in a package of a dozen eggs
IV) A count of the statistics majors at a certain university
a. II only
b. II and III only
c. III and IV only
d. I only
ANSWER: c
20. Which of the following are characteristics of dotplots?
I. The horizontal axis corresponds to the numerical value for the variable of interest
II. Each observation is represented by a dot above the location on the horizontal axis corresponding to its value
III. Includes a dot for every observation in the data set
IV. If two or more observations share the same value, the dots are stacked corresponding to each observation vertically.
a. I, II, and III only
b. II, III, and IV only
c. III and IV only
d. I, II, III, and IV
ANSWER: d
INSTRUCTIONS:
The following questions are in a True/False format. The answers to these questions will frequently depend on remembering facts, understanding of the concepts, and knowing the statistical vocabulary. Before answering these questions, be sure to read them carefully!
21. Frequency distributions can only be used with categorical data.
a. True
b. False
ANSWER: False
22. The relative frequency for a particular category is the number of times the category appears in the data.
a. True
b. False
ANSWER: False
23. Dotplots work best for small and moderate sized numerical data sets.
a. True
b. False
ANSWER: True
24. Bar charts should be used with categorical data.
a. True
Chapter 01 - The Role of Statistics and the Data Analysis Process
b. False
ANSWER: True
25. The most important right and responsibility of citizens in a democratic society is voting. The bar chart shows what percentage of each age group registered to vote in the 2000 presidential elections in the United States. Select the best description of the registration pattern that you see in the data.
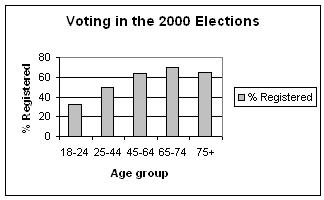
a. The proportion of people registering is the smallest for the 18-24 year-old group, and gets larger with age, until finally declining in the 75+ year-old group.
b. The proportion of people registering is the smallest for the 18-24 year-old group, and does not changes for groups of older ages, from the 25-44 to the 75+ year-old group.
c. The proportion of people registering is the smallest for the 18-24 year-old group, and gets larger with age, reaching its maximum in the 75+ year-old group.
d. The proportion of people registering is the smallest for the 18-24 year-old group, gets larger with age reaching its maximum in the 45-64 year, then gets smaller with age until the 75+ year-old group.
ANSWER: a
26. Artificial nest have often been used when biologists study predation on birds. It is usually assumed that predators will respond to artificial nests in the same way they do to real nests. An experiment was recently performed to check this assumption for predators of the American robin (Turdus migratorius) by comparing egg loss in three experimental treatments: (1) natural robin's nests, (2) artificial wicker-basket nests placed at 30 meters in a random direction from natural robin's nests, and (3) artificial wicker-basket nests placed in a 180 m by 240 m grid around robin's nests. The data below are cumulative counts of eggs predated (stolen or broken and eaten) at 5, 10, and 15 day points of the experiment. Cumulative count of depredated eggs
Select the correct relative frequency distribution table representing the cumulative counts for the artificial nests in the grid
b.
Chapter 01 - The Role of Statistics and the Data Analysis Process
c.
d.
ANSWER: a
27. Biologists know that bats have different flight characteristics. Some bats exhibit fast, straight, and long flights; others are moderately slow, and highly maneuverable. The data presented below are wing spans in centimeters for certain species of bats from Nicaragua and Costa Rica. Two categories of bat species are represented: fruit-eaters and insect-eaters. Fruit eaters: 25.2, 27.2, 42.0, 44.8, 31.3, 32.5, 32.0, 28.1, 30.7, 27.0, 41.1, 41.6, 58.4, 58.7, 53.9
Insect eaters: 32.8, 27.4, 21.0, 23.9, 27.5, 22.4, 18.7
Choose the correct description for the data.
a. Wingspans of fruit-eaters are generally longer than those of insect-eating bats. Wingspans vary more among fruit-eaters than among insect-eaters.
b. Wingspans of fruit-eaters are generally longer than those of insect-eating bats. Wingspans vary more among insect-eaters than among fruit-eaters.
c. Wingspans of fruit-eaters are generally shorter than those of insect-eating bats. Wingspans vary more among fruit-eaters than among insect-eaters.
d. Wingspans of fruit-eaters are generally shorter than those of insect-eating bats. Wingspans vary more among insect-eaters than among fruit-eaters.
ANSWER: a
28. Biologists know that bats have different flight characteristics. Some bats exhibit fast, straight, and long flights; others are moderately slow, and highly maneuverable. The flight capabilities of bats are presumably a function of (a) the characteristics of the bat wings, and (b) the laws of physics. The data presented below are wing weights in grams for certain species of bats from Nicaragua and Costa Rica. Two categories of bat species are represented: fruit-eaters and insect-eaters.
Fruit eaters:
9.9, 11.5, 47.0, 59.6, 18.2, 22.1, 22.9, 15.0, 15.4, 13.3, 38.3, 42.2, 114.3, 105.4, 80.9
Insect eaters:
23.8, 16.1, 4.2, 3.9, 7.5, 3.5, 3.9
What do this data tell you about the differences in wing weight of fruit- and insect-eaters?
a. Fruit eating bats have wings that are generally heavier than those of insect eating bats. Also, fruit eating bats' wings are much more varied in weight than incest eating bats' wings.
b. Fruit eating bats have wings that are generally heavier than those of insect eating bats. However, insect eating bats' wings are much more varied in weight than fruit eating bats' wings.
c. Insect eating bats have wings that are generally heavier than those of fruit eating bats. However, fruit eating bats' wings are much more varied in weight than incest eating bats' wings.
Chapter 01 - The Role of Statistics and the Data Analysis Process
d. Insect eating bats have wings that are generally heavier than those of fruit eating bats. Also, insect eating bats' wings are much more varied in weight than fruit eating bats' wings.
ANSWER: a
Copyright Cengage Learning. Powered by Cognero.