

Chapter 1: Data and Statistics
Textbook Exercises
1. Discuss the differences between statistics as numerical facts and statistics as a discipline or field of study.
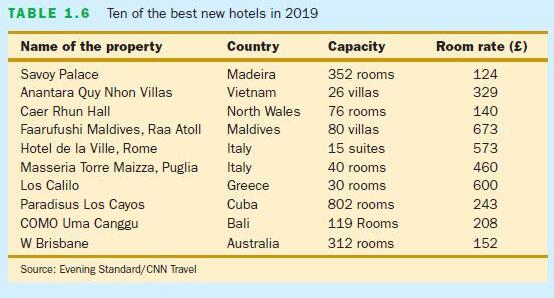
2. Every year surveys of subscribers are conducted to determine the best new places to stay throughout the world. Table 1.6 shows the ten hotels that were highly favoured in one such survey in 2019.
a. How many elements are in this data set?
b. How many variables are in this data set?
c. Which variables are categorical and which variables are quantitative?
d. What type of measurement scale is used for each of the variables?
3. Refer to Table 1.6.
a. What is the average number of rooms for the ten hotels?
b. Compute the average room rate.
c. What is the percentage of hotels located in Italy?
d. What is the percentage of hotels with 100 rooms/suites/villas or more?
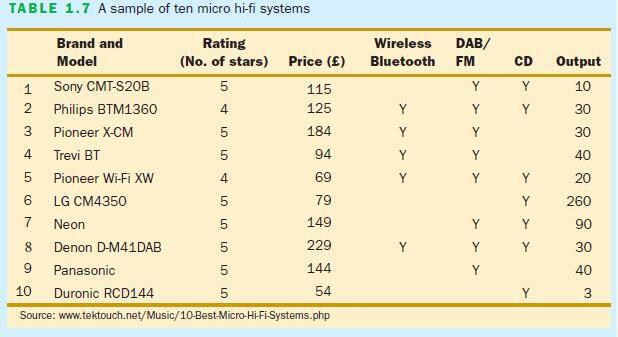
4. Micro hi-fi systems typically have a wireless Bluetooth facility, DAB/FM reception and a
Anderson, Sweeney, Williams, Camm, Cochran, Fry, Ohlmann, Freeman, Shoesmith, Statistics
Cengage
CD player. The data in Table 1.7 show the product rating and retail price range for a popular selection of systems. Note that the code Y is used to confirm when a facility is included in the system, N when it is not. Output power (watts) details are also provided (Tektouch, 2019).
a. How many elements does this data set contain?
b. What is the population?
c. Compute the average output power for the sample.
5. Consider the data set for the sample of ten micro hi-fi systems in Table 1.7.
a. How many variables are in the data set?
b. Which of the variables are quantitative and which are categorical?
c. What percentage of the hi-fi systems has a four star rating or higher?
d. What percentage of the hi-fi systems includes a CD player?
6. State whether each of the following variables is categorical or quantitative and indicate its measurement scale.
a. Annual Sales
b. Soft drink size (small, medium, large).
c. Occupational classification (SOC 2000).
d. Earnings per share.
e. Method of payment (cash, cheque, credit card).
Anderson, Sweeney, Williams, Camm, Cochran, Fry, Ohlmann, Freeman, Shoesmith, Statistics for Business and Economics
Cengage
7. In Spring 2015 the first ever SPA/Police Scotland opinion survey was commissioned to determine officer and staff opinion. All 23,438 Police Officers, Staff and Special Constables were invited to participate in the Survey, (http://inform. glam.ac.uk/news/2007/10/ 24/healthwellbeing-staff-survey-results/). Response categories were strongly agree, agree, neither agree or disagree, disagree and strongly disagree, don’t know / no opinion, no reply.
a. What was the population size for this survey?
b. Are the data categorical or quantitative?
c. Would it make more sense to use averages or percentages as a summary of the data for this question?
d. Of those surveyed, 50.4 per cent responded. How many individuals provided this response?
8. State whether each of the following variables is categorical or quantitative and indicate its measurement scale.
a. Age.
b. Gender.
c. Class rank.
d. Make of car.
e. Number of people favouring closer European integration.
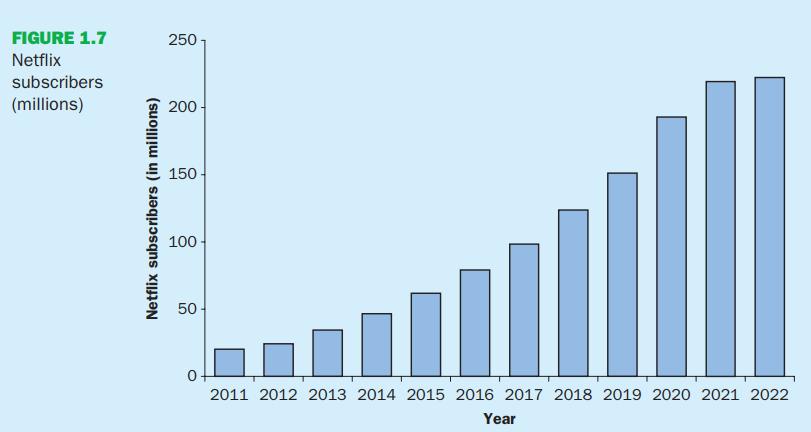
9. Figure 1.7 shows a bar chart showing the number of Netflix subscribers from 2011 to 2022 (www.demandsage.com/netflix-subscribers/)
a. What is the variable of interest?
b. Are the data categorical or quantitative?
c. Are the data time series or cross-sectional?
d. Comment on the trend in Netflix subscribers over time.
Anderson, Sweeney, Williams, Camm, Cochran, Fry, Ohlmann, Freeman, Shoesmith, Statistics
10. The Hawaii Visitors Bureau collects data on visitors to Hawaii. The following questions were among 16 asked in a questionnaire handed out to passengers during incoming airline flights.
• This trip to Hawaii is my: 1st, 2nd, 3rd, 4th, etc.
• The primary reason for this trip is: (10 categories including vacation, convention, honeymoon)
• Where I plan to stay: (11 categories including hotel, apartment, relatives, camping)
• Total days in Hawaii
a. What is the population being studied?
b. Is the use of a questionnaire a good way to reach the population of passengers on incoming airline flights?
c. Comment on each of the four questions in terms of whether it will provide categorical or quantitative data.
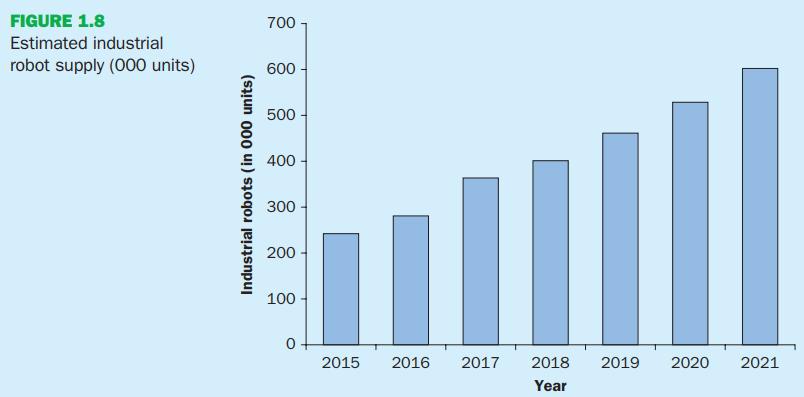
11. The International Federation of Robotics estimates the worldwide supply of industrial robots each year. Figure 1.8 shows estimates of the worldwide supply of industrial robots for the years 2015 to 2021.
a. What is the variable of interest?
b. Are the data quantitative or categorical?
c. Are the data cross-sectional or time series?
12. In a recent study of causes of death in men 60 years of age and older, a sample of 120 men indicated that 48 died as a result of some form of heart disease.
a. Develop a descriptive statistic that can be used as an estimate of the percentage of men 60 years of age or older who die from some form of heart disease.
b. Are the data on cause of death categorical or quantitative?
c. Discuss the role of statistical inference in this type of medical research.
Anderson, Sweeney, Williams, Camm, Cochran, Fry, Ohlmann, Freeman, Shoesmith, Statistics for Business and Economics 6e (978-1-4737-9135-0) © Cengage EMEA
Chapter 1: Data and Statistics
Textbook
Exercises Solutions
1. Statistics can be referred to as numerical facts. In a broader sense, statistics is the field of study dealing with the collection, analysis, presentation and interpretation of data.
2. a. 10
b. 3
c. Country is a categorical variable; capacity and room rate are quantitative variables.
d. Country is capacity and room rate are ratio.
3. a. Ignoring suites and villas, average number of rooms = 1731/7 = 247.29 or approximately 247 rooms
b. Average room rate (£) = 3502/10 = 350.2
c. 2 of 10 are located in Italy; or 20%
d. 4 of 10 have 100 rooms, suites, villas or more; or 40%
4. a. 10
b. All brands of micro Hi Fi systems on the market at the time of the sampling.
c. Average output power = 553/10 = 55.3 watts
5. a. 6
b. No of stars, Price|(£) and Output are quantitative. Bluetooth, DAB/FM and CD player are categorical
Anderson, Sweeney, Williams, Camm, Cochran, Fry, Ohlmann, Freeman, Shoesmith, Statistics for Business and Economics 6e (978-1-4737-9135-0) © Cengage EMEA
c. Number of systems rated 4 stars or higher = 10/10 = 100%
d. 7 out of 10 or 70%
6. Questions a, c, and d provide quantitative data.
Questions b and e provide categorical data.
7. a. 23,438
b. The variable is categorical
c. Percentages.
d. 11,813 respondents
8. a. Quantitative; ratio
b. Categorical; nominal
c. Categorical (Note: Rank is a numeric label that identifies the position of a student in the class. Rank does not indicate how much or how many and is not quantitative.); ordinal
d. Categorical; nominal
e. Quantitative; ratio
9. a. Number of Netflix subscribers.
b. Quantitative
c. Time series
d. The number of Netflix subscribers is increasing at an increasing rate over time.
6e (978-1-4737-9135-0) ©
Anderson, Sweeney, Williams, Camm, Cochran, Fry, Ohlmann, Freeman, Shoesmith, Statistics for Business and Economics
Cengage EMEA
10. a. All visitors to Hawaii
b. Yes
c. First and fourth questions provide quantitative data Second and third questions provide-categorical data
11. a. Estimated supply of industrial robots worldwide.
b. Quantitative
c. Time series
12. a. (48/120)100% = 40% in the sample died from some form of heart disease. This can be used as an estimate of the percentage of all men 60 or older who die of heart disease.
b. The data on cause of death is categorical
c. Answers may vary. Students may mention that clinical and statistical reasoning are both crucial to progress in medicine. Clinical researchers must generalize from the few to many and combine empirical evidence (from observation and data) with theory.
(978-1-4737-9135-0)
Anderson, Sweeney, Williams, Camm, Cochran, Fry, Ohlmann, Freeman, Shoesmith, Statistics for Business and Economics
Cengage EMEA
Chapter 1: Data and Statistics
Supplementary Exercises
13. In 2007, 75.4 per cent of Economist readers had stayed in a hotel on business in the previous 12 months with 32.4 per cent of readers using first / business class for travel.
a. What is the population of interest in this study?
b. Is class of travel a categorical or quantitative variable?
c. If a reader had stayed in a hotel on business in the previous 12 months would this be classed as a categorical or quantitative variable?
d. Does this study involve cross-sectional or time series data?
e. Describe any statistical inferences The Economist might make on the basis of the survey.
14. Statistics released by Emerald, the publisher of TQM Magazine (www.brad.ac.uk/acad/management/ectqm) , indicate that: the UK provides 30 per cent of contributions to the TQM Magazine; north America and Europe provide 20 per cent; south and east Asia provide 19 per cent; Australasia provides 9 per cent; the Middle East and Africa provide 1 per cent.
a. Would the geographical source of contributions be described as nominal or ratio data?
b. What percentage of the applications come from Europe (including the UK) and North America?
15. State whether each of the following variables is categorical or quantitative and indicate its measurement scale.
a. Annual sales
b. Soft-drink size (small, medium, large)
c. European Socio-economic Classification (Class 1 through Class 10)
d. Earnings per share
e. Method of payment (cash, cheque, credit card)
16. The Hawaii Visitors Bureau collects data on visitors to Hawaii. The following questions were among 16 asked in a questionnaire handed out to passengers during incoming airline flights in June 2001.
• This trip to Hawaii is my: 1st, 2nd, 3rd, 4th, etc.
• The primary reason for this trip is: (10 categories including vacation, convention, honeymoon)
• Where I plan to stay: (11 categories including hotel, apartment, relatives, camping)
• Total days in Hawaii
a. What is the population being studied?
b. Is the use of a questionnaire a good way to reach the population of passengers on incoming airline flights?
c. Comment on each of the four questions in terms of whether it will provide categorical or quantitative data.
17. IPFI regularly releases definitive statistics on the global recorded music industry. For 2005, a breakdown of Total Music Sales (physical & digital) by Market (www.ifpi.org/sitecontent/library/worldsales2005-ff.pdf ) was confirmed by IPFI as follows:
a. Is local currency a categorical or quantitative variable?
b. Construct a bar graph for music sales by country in 2005. Is this graph based on crosssectional data or time series data?
18. A Business Week North American subscriber study collected data from a sample of 2861 subscribers. Fifty-nine percent of the respondents indicated an annual income of $75,000 or more, and 50% reported having an American Express credit card.
a. What is the population of interest in this study?
b. Is annual income a categorical or quantitative variable?
c. Is ownership of an American Express card a categorical or quantitative variable?
d. Does this study involve cross-sectional or time series data?
e. Describe any statistical inferences Business Week might make on the basis of the survey.
19. A Fall 2002 sample survey of 131 investment managers in Barron's Big Money poll revealed the following (Barron's, October 28, 2002):
• 43% of managers classified themselves as bullish or very bullish on the stock market.
• The average expected return over the next 12 months for equities was 11.2%.
• 21% selected health care as the sector most likely to lead the market in the next 12 months.
• When asked to estimate how long it would take for technology and telecom stocks to resume sustainable growth, the managers' average response was 2.5 years.
a. Cite two descriptive statistics.
b. Make an inference about the population of all investment managers concerning the average return expected on equities over the next 12 months.
c. Make an inference about the length of time it will take for technology and telecom stocks to resume sustainable growth.
20. A seven-year medical research study reported that women whose mothers took the drug DES during pregnancy were twice as likely to develop tissue abnormalities that might lead to cancer as were women whose mothers did not take the drug.
a. This study involved the comparison of two populations. What were the populations?
b. Do you suppose the data were obtained in a survey or an experiment?
c. For the population of women whose mothers took the drug DES during pregnancy, a sample of 3980 women showed 63 developed tissue abnormalities that might lead to cancer. Provide a descriptive statistic that could be used to estimate the number of women out of 1000 in this population who have tissue abnormalities.
d. For the population of women whose mothers did not take the drug DES during pregnancy, what is the estimate of the number of women out of 1000 who would be expected to have tissue abnormalities?
e. Medical studies often use a relatively large sample (in this case, 3980). Why?
21. A firm wants to test the advertising effectiveness of a new television commercial. As part of the test, the commercial is shown on a local evening TV news programme in the Czech Republic
Anderson, Sweeney, Williams, Camm, Cochran, Fry, Ohlmann, Freeman, Shoesmith, Statistics for Business and Economics 6e (978-1-4737-9135-0) © Cengage EMEA
Two days later, a market research firm conducts a telephone survey to obtain information on recall rates (percentage of viewers who recall seeing the commercial) and impressions of the commercial.
a. What is the population for this study?
b. What is the sample for this study?
c. Why would a sample be used in this situation? Explain.
22. AC Nielsen is the world's leading marketing information company with 21,000 employees worldwide offering services in more than 100 countries. Recently AC Nielsen contributed data to a study on internet usage in Europe (www.internetworldstats.com/stats4.htm) – selected details from which are summarized below:
a. How many populations were involved in this study and how do you think it / they would be defined?
b. Do you think the internet usage figures here were calculated by census or sample surveys? How do you think such surveys would be carried out?
c. Where is the fastest and slowest growth in internet usage taking place? Any comments on this?
23. The Broadcasters' Audience Research Board (BARB) is responsible for providing estimates of the number of people watching television. This includes which channels and programmes are being watched, at what time, and the type of people who are watching at any one time. BARB provides television audience data on a minute-by-minute basis for channels received within the UK. The data is available for reporting nationally and at ITV and BBC regional level and covers all analogue and digital platforms.
Anderson, Sweeney, Williams, Camm, Cochran, Fry, Ohlmann, Freeman, Shoesmith, Statistics for Business and Economics 6e (978-1-4737-9135-0) © Cengage EMEA
For the years 1990-2005, BARB confirms the Annual % Shares of Viewing (Individuals) to be as follows:
* including GMTV
Here, the Channel “Others” signifies non-terrestrial channels.
a. Is channel a categorical or quantitative variable?
b. Construct a graph of BBC (BBC1 and BBC2) viewing share over the sixteen year period. Use the horizontal axis to display the year and the vertical axis to display the percentage viewing share. Is this graph based on cross-sectional or time series data?
c. Construct a graph for viewing shares in 2005. Is the graph based on cross-sectional or time series data?
24. In a recent research study (www.springerlink.com/content/3hbfafkg8pnp2uq2/) of TV viewing habits by Greek children, 4876 questionnaires - completed by children with the assistance of their parents - were analysed. Key results were as follows:
• The mean time spent watching TV ranged from 21-32 hours per week.
• The age when children started watching TV correlated with their later educational achievement: good students started watching TV earlier. Bad students, however, watched more TV, as did children from urban areas, and from lower socioeconomic groups.
• Children from households with more than one TV (especially if it was in the child's bedroom) also watched more.
• Children who watched more TV were less compliant with TV restrictions and more likely to imitate TV characters.
• Eating while watching TV was associated with obesity in teenagers.
• Most children watched TV from appropriate distances, with the lights on, and with the sound at medium volume.
a. What do you think the researchers were attempting to measure here?
b. What is the population?
c. Why would a sample be used for this situation?
d. What kinds of decisions or actions are likely to be based on this study?
25. A sample of course percentages for five students showed the following results: 72, 65, 82, 90, 76. Which of the following statements are correct, and which should be challenged as being too generalized?
a. The average course percentage for the sample of five students is 77.
b. The average course percentage for all students who took the exam is 77.
c. An estimate of the average course percentage for all students who took the exam is 77.
d. More than half of the students who take this exam will achieve a percentage of between 70 and 85.
e. If five other students are included in the sample, their course percentage will be between 65 and 90
(978-1-4737-9135-0)
Anderson, Sweeney, Williams, Camm, Cochran, Fry, Ohlmann, Freeman, Shoesmith, Statistics for Business and Economics
Cengage EMEA
26. Figures by the European Council on Refugees and Exiles (www.ecre.org/) on undocumented persons entering into Europe are summarized below (2001–2005).
Sweeney, Williams, Camm, Cochran, Fry, Ohlmann, Freeman, Shoesmith, Statistics
a. Are these time series or cross-sectional data?
b. What are the elements and variables here?
c. Give an example of an observation in this example.
d. Is the scale of measurement used for the quantitative details here interval or ratio?
e. Comment on any trends revealed by the summary.
27. In January 2005, the European Consumer Centre, Dublin (www.ecic.ie) commissioned Insight Statistical Consulting (ISC), a marketing research company, to undertake research on airline
complaints in Ireland. Subsequently a telephone survey of a total of 1067 adults in Ireland was conducted. Amongst the questions asked by ISC were the following:
• Did you take a flight-only journey within the last year i.e. not any part of a package holiday?
• Do you know your rights as an airline passenger?
• Have you heard of the small claims court?
a. What is the population being studied?
b. Do you think the choice of a telephone survey a good way to reach the population of interest?
c. Comment on each of the sample questions in terms of whether it will provide categorical or quantitative data.
28. In a survey in 2001 (www.uri.edu/personal/awel5922/gambling.index.html), nearly 500 customers of the online casinos kennyrogers.com, casinoaustralia.com and goodluck.com were asked by Inland Entertainment Corporation (IEC) to confirm their
Primary language
Gender and
Age range
The questionnaire was used for the survey was in English
Comment on
a. the quality of the survey design employed by IEC and – following on –b. the validity / precision of results arising from the survey.
Anderson, Sweeney, Williams, Camm, Cochran, Fry, Ohlmann, Freeman, Shoesmith, Statistics for
Cengage
Chapter 1: Data and Statistics
Supplementary Exercises Solutions
13.
a. All readers of The Economist at the time the survey was conducted.
b. Categorical
c. Categorical (stayed in a hotel or not stayed in a hotel)
d. Cross-sectional - all the data relate to the same time.
e. Using the sample results, we could infer or estimate that in 2007, 75.4% per cent of the population of Economist readers had stayed in a hotel on business in the previous 12 months; also 32.4% of the population of readers used first / business class for travel.
14. a. Nominal
b. 50%
15. a. Quantitative; ratio
b. Categorical; ordinal
c. Categorical; ordinal (assuming employees can be ranked by classification)
d. Quantitative; ratio
e. Categorical; nominal
16. a. The population is all visitors coming to the state of Hawaii.
b. Since airline flights carry the vast majority of visitors to the state, the use of questionnaires for passengers during incoming flights is a good way to reach this population. The questionnaire actually appears on the back of a mandatory plants and animals declaration form that passengers must complete during the incoming flight. A large percentage of passengers complete the visitor information questionnaire.
c. Questions 1 and 4 provide quantitative data indicating the number of visits and the number of days in Hawaii. Questions 2 and 3 provide categorical data indicating the categories of reason for the trip and where the visitor plans to stay.
17. a Categorical
Sweeney, Williams, Camm, Cochran, Fry, Ohlmann, Freeman, Shoesmith,
Cross-sectional
18. a. All subscribers of Business Week in North America at the time the survey was conducted.
b. Quantitative
c. Categorical (yes or no)
d. Cross-sectional - all the data relate to the same time.
e. Using the sample results, we could infer or estimate 59% of the population of subscribers have an annual income of $75,000 or more and 50% of the population of subscribers have an American Express credit card.
19. a. 43% of managers were bullish or very bullish. 21% of managers expected health care to be the leading industry over the next 12 months.
b. We estimate the average 12-month return estimate for the population of investment managers to be 11.2%.
c. We estimate the average over the population of investment managers to be 2.5 years.
20. a. The two populations are the population of women whose mothers took the drug DES during pregnancy and the population of women whose mothers did not take the drug DES during pregnancy.
Sweeney, Williams, Camm, Cochran, Fry, Ohlmann, Freeman, Shoesmith,
b. It was a survey.
c. 63/3.980 = 15.8 women out of each 1000 developed tissue abnormalities.
d. The article reported “twice” as many abnormalities in the women whose mothers had taken DES during pregnancy. Thus, a rough estimate would be 15.8/2 = 7.9 abnormalities per 1,000 women whose mothers had not taken DES during pregnancy.
e. In many situations, disease occurrences are rare and affect only a small portion of the population. Large samples are needed to collect data on a reasonable number of cases where the disease exists.
21. a. All adult viewers reached by the Czech television station.
b. The viewers contacted in the telephone survey.
c. It would clearly be too costly and time consuming to try to contact all viewers.
22. a. One. All computers in Europe available to the public for internet usage
b. Sample. A statistically representative panel of internet users.
c. EU candidate countries. One measure of the rapid convergence of candidate states with existing EU countries
23. a. Categorical
Anderson, Sweeney, Williams, Camm, Cochran, Fry, Ohlmann, Freeman, Shoesmith, Statistics
Cengage
Cross-sectional
24. a. Percent of television sets that were tuned by Greek children to a particular television show and/or total viewing audience.
b. All television sets in Greece which are available for the children to view. Note this would not include television sets in store displays.
c. A sample is used because it would be too costly to collect data on all television sets in Greece.
d. A demographic understanding of Greek children’s TV viewing and possible problems associated with viewing habits.
25. a. This is a statistically correct descriptive statistic for the sample.
b. An incorrect generalization since the data was not collected for the entire population.
c. An acceptable statistical inference based on the use of the word “estimate.”
d. While this statement is true for the sample, it is not a justifiable conclusion for the entire population.
e. This statement is not statistically supportable. While it is true for the particular sample observed, it is entirely possible and even very likely that at least some students will be outside the 65 to 90 range of grades.
26. a No
b. Country; annual illegal immigration totals
c.
Sweeney, Williams, Camm, Cochran, Fry, Ohlmann, Freeman, Shoesmith, Statistics
d. Ratio
e. Between 2001 and 2005 illegal immigration into the European countries listed as almost halved.
27. a. The population of Irish airline travellers
b. Yes, on the not unreasonable assumption that airline travellers are likely to have phones.
c. All categorical
28. a. Non-English speaking respondents may have difficulty answering a questionnaire in English. There may also be a bias resulting from the particular casinos chosen for the study.
b. A sample size of 500 is comparatively small by many survey standards so the results are likely to be comparatively imprecise.
(978-1-4737-9135-0)
Anderson, Sweeney, Williams, Camm, Cochran, Fry, Ohlmann, Freeman, Shoesmith, Statistics for Business and Economics
Cengage EMEA