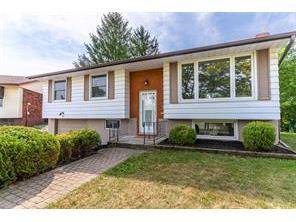
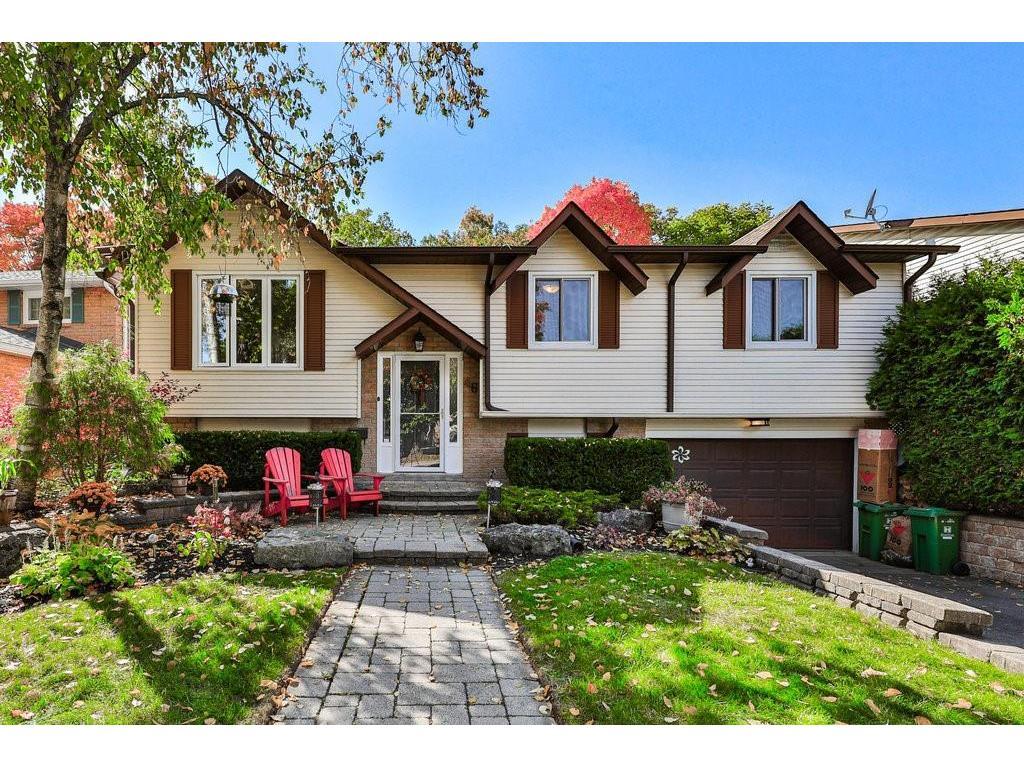
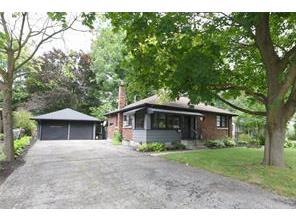
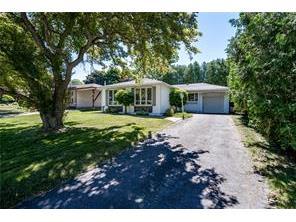
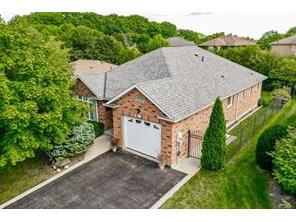
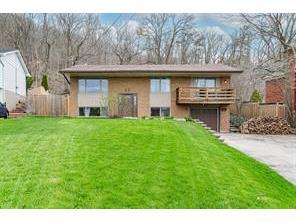
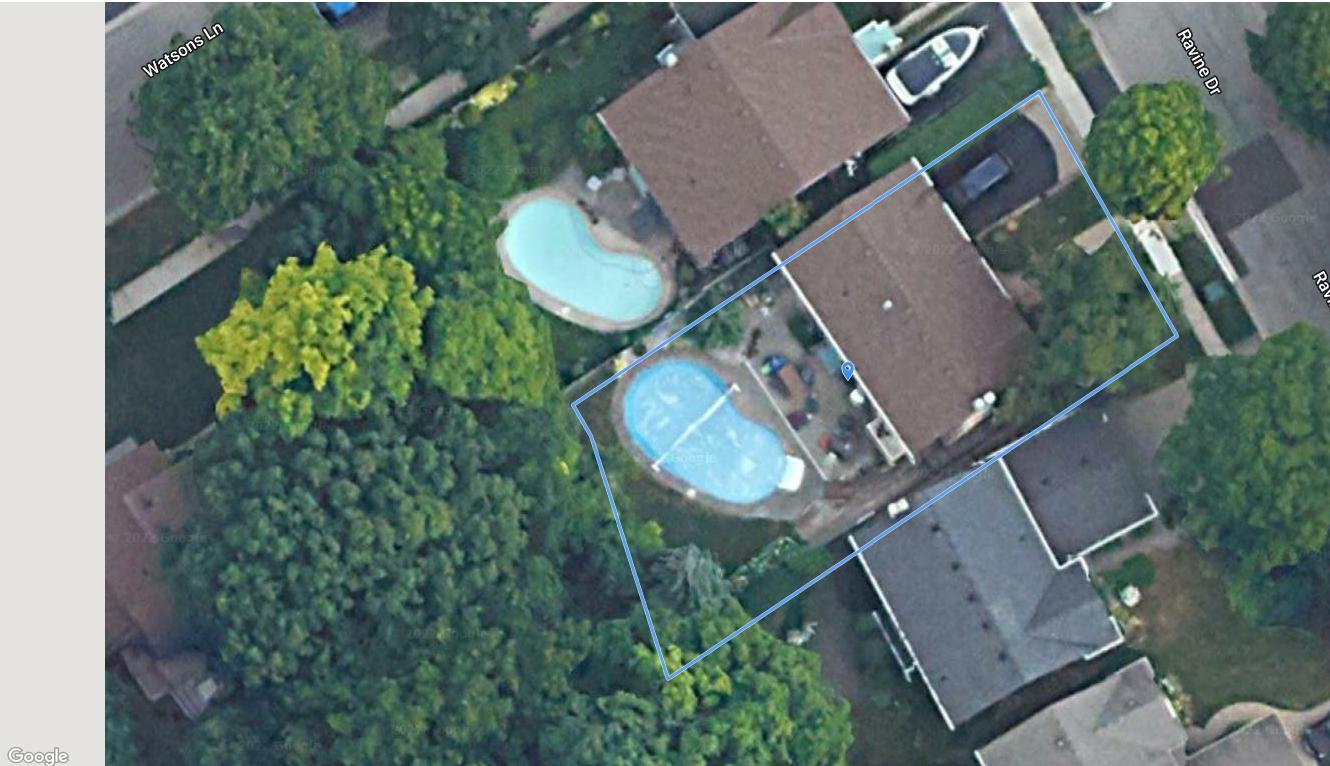
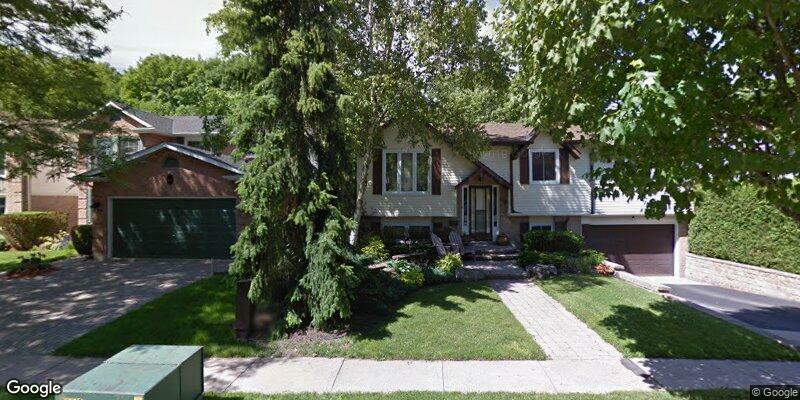
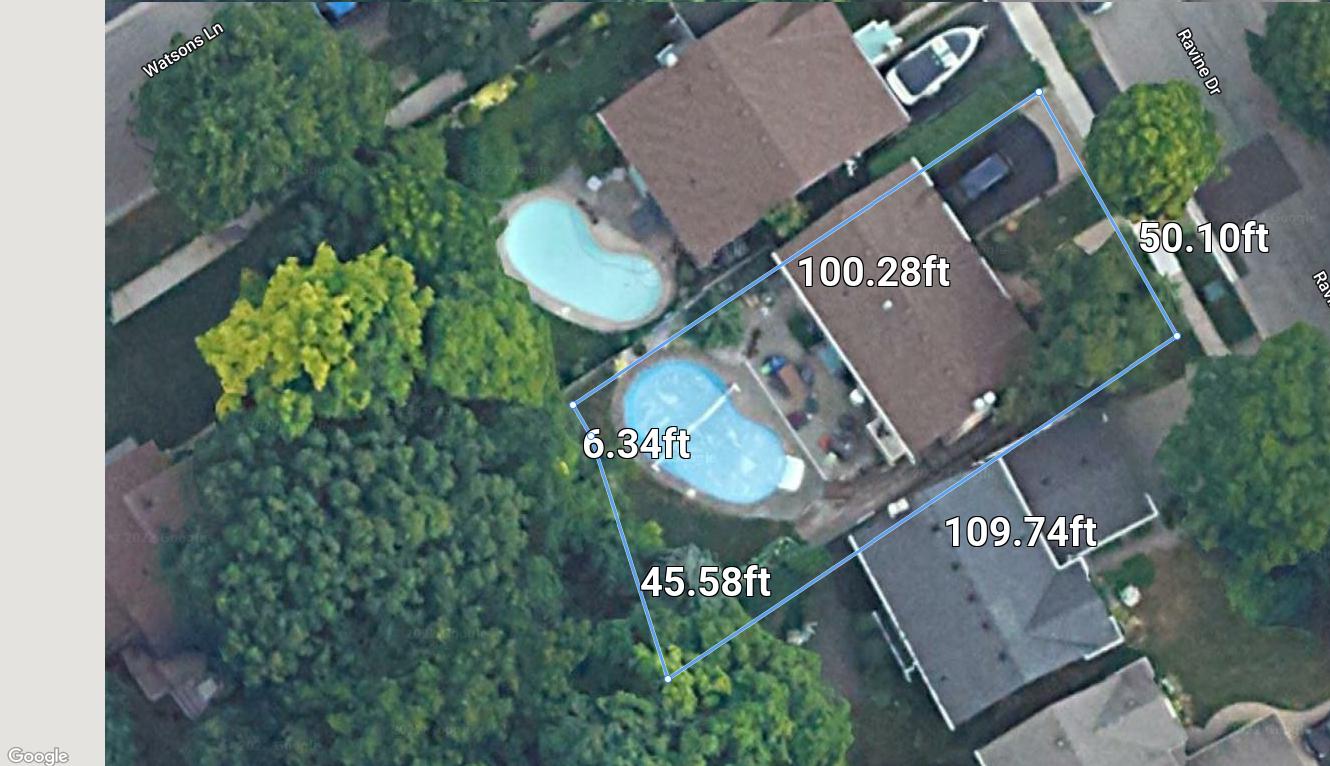
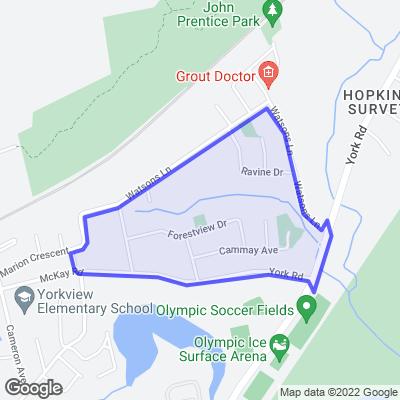
46 Ravine Drive


In response to your request for an evaluation, as a practicing real estate salesperson I am establishing Market Value for Listing purposes
Value is established, for the property at 46 Ravine Drive as of this dated letter.
Date: October 18, 2022 Market Value: $999,000 (range +/- 3%)

There are limiting conditions and assumptions connected with this evaluation done by the herein sales representative:
It is assumed any MLS® data used is reliable and correct
The client will not circulate or expose information provided herein without prior approval of the writer
Any update expected must be requested in writing
If the herein sales representative is required in a court of law, in relation to this evaluation, the court cost will be $350 per hour.
Please find enclosed some general information about the process of selling real estate. If you have any other questions about preparing your home to ensure that you get the top price the market will bring in, please feel free to contact me. I look forward to helping you with all of your real estate needs, and ensuring that you get the best price and terms on the sale of you r property!
Sincerely,
Mike Heddle, Hon. B. Comm. Broker
The Heddle Group | Team Leader Royal LePage State Realty, Brokerage P. (905) 574 7441 F. (905) 662 2227 www.LiveInHamilton.ca

This page summarizes the
in
market
Address Price
46 RAVINE Drive
List Date
$/SqFt 1196827.68 $599,900 3 10/13/2022
Park Street W $640.929361 $899,900 3 10/05/2022
The Haven Street $810.721,1102 $1,100,000 4 07/25/202238 Helen Street $907.591,2121
Averages: $866,600 1,086 $786.411.43.3
SqFt
Sale Date
46 RAVINE Drive $/SqFt 1196827.68 $730,000 3 09/17/2022
SKYLINE Drive $657.661,1102 $740,000 3 08/02/2022
Pleasant Avenue $722.661,0241 $800,000 3 06/30/2022
MOONGLOW Place $637.451,2550 $840,000 3 10/11/202225 NEWCOMBE Road $585.371,4352 $873,000 5 10/14/20224 Kings Gate $761.781,1462 $950,000 5 09/26/2022
PLEASANT Avenue $758.791,2522 $980,000 3 04/30/2022
Watsons Lane $915.891,0702 $1,007,000 5 06/30/2022
GREENING Court $567.641,7743 $1,290,000 4 06/03/202229 MARTINGROVE Drive $1,085.861,1882
Averages: $912,222 1,250 $743.682.03.8
MedianLow Average High Count $599,900
$886,450 $900,817 $1,290,000
$789,900 $870,375 $942,275 $1,317,000
Dundas (41)
Dundas (41)
Valley (414)
Helen Street
Hamilton
Dundas (41)
Coote's
(411)
Freehold Sale
Hamilton Dundas (41) Coote's Paradise (411)
- Partially
-
12,500
(see Remarks)
AdjustDetails 33 SKYLINE Drive H4143043
Residential Freehold Sale Sold Hamilton Dundas (41) Pleasant Valley (414) 3 50,000 2.0
Full - Partially Finished 08/02/2022 $799,000 09/17/2022 $730,000
spaces / Attached 1,110
- / 31-50 Years $5,196 / 2022
25,000Partially Finished
Forced Air Bungalow/Ranch - Raised 25,000Partially Finished 55.02 215.67
$730,000
$826,500
Finished
- Raised
MOONGLOW Place H4139632
Residential Freehold Sale
Hamilton Dundas (41) Pleasant Valley (414)
50,000
Full - Fully Finished 06/27/2022 $749,900 06/30/2022 $800,000
spaces
- / 51-99 Years $4,551 /
Forced Air Bungalow Fully Finished 50.23
Dundas (41)
Valley (414)
PLEASANT Avenue
Type
Type Freehold
Type
Hamilton
Dundas (41)
Coote's Paradise (411)
Residential Freehold Sale
Hamilton Dundas (41) Pleasant Valley (414)
AdjustDetails 6 Watsons Lane H4133229
-12,500
Full -
Finished 09/22/2022 $934,900
Dundas Residential Freehold Sale Sold Hamilton Dundas (41) Coote's Paradise (411) 3 50,000 2.0 8 Full - Fully Finished 04/27/2022 $879,900 04/30/2022 $980,000 4 1 spaces / Built-In 1,070 31,500/0 50 - / 31-50 Years $4,591 / 2021
$950,000
Fully Finished 50.00 110.00 $-26,500 $923,500
Gas Forced Air Bungalow/Ranch - Raised Fully Finished 50.00 125.06 $81,500 $1,061,500
$980,000
GREENING Court
Type
Type
Hamilton
Dundas (41)
Coote's Paradise (411)
Residential Freehold Sale
Hamilton Dundas (41) Coote's Paradise (411)
-25,000
AdjustDetails 29 MARTINGROVE Drive H4133445
Full -
Finished
- Raised Fully Finished 47.00 135.50 $-169,500 $837,500
$1,007,000
Dundas Residential Freehold Sale Sold Hamilton Dundas (41) Coote's Paradise (411) 4 25,000 2.0 9 Full - Fully Finished 04/29/2022 $1,349,000 06/03/2022 $1,290,000 11 1 spaces / Attached 1,188 2,000/0 65 1972 / 31-50 Years $5,055 / 2021 Gas Forced Air Bungalow/Ranch - Raised Fully Finished 65.00 372.25 $27,000 $1,317,000
$1,290,000
This page summarizes key fields of
The listings in this analysis can be summarized as follows:
Listing Price between $599,900 and $1,349,000
Sale Price between $730,000 and $1,290,000
936 to 1,774 Square Feet
$506.76 to $1,135.52 per Square Foot
$567.64 to $1,085.86 per Sold Square Foot
This chart illustrates the level of excitement and interest in a new listing over time. It also demonstrates the importance of pricing correctly. When a property is first listed, it generates a very high level of interest from prospective buyers, which reduces dramatically over time. It is important to be priced correctly from the beginning, during the peak of this curve.
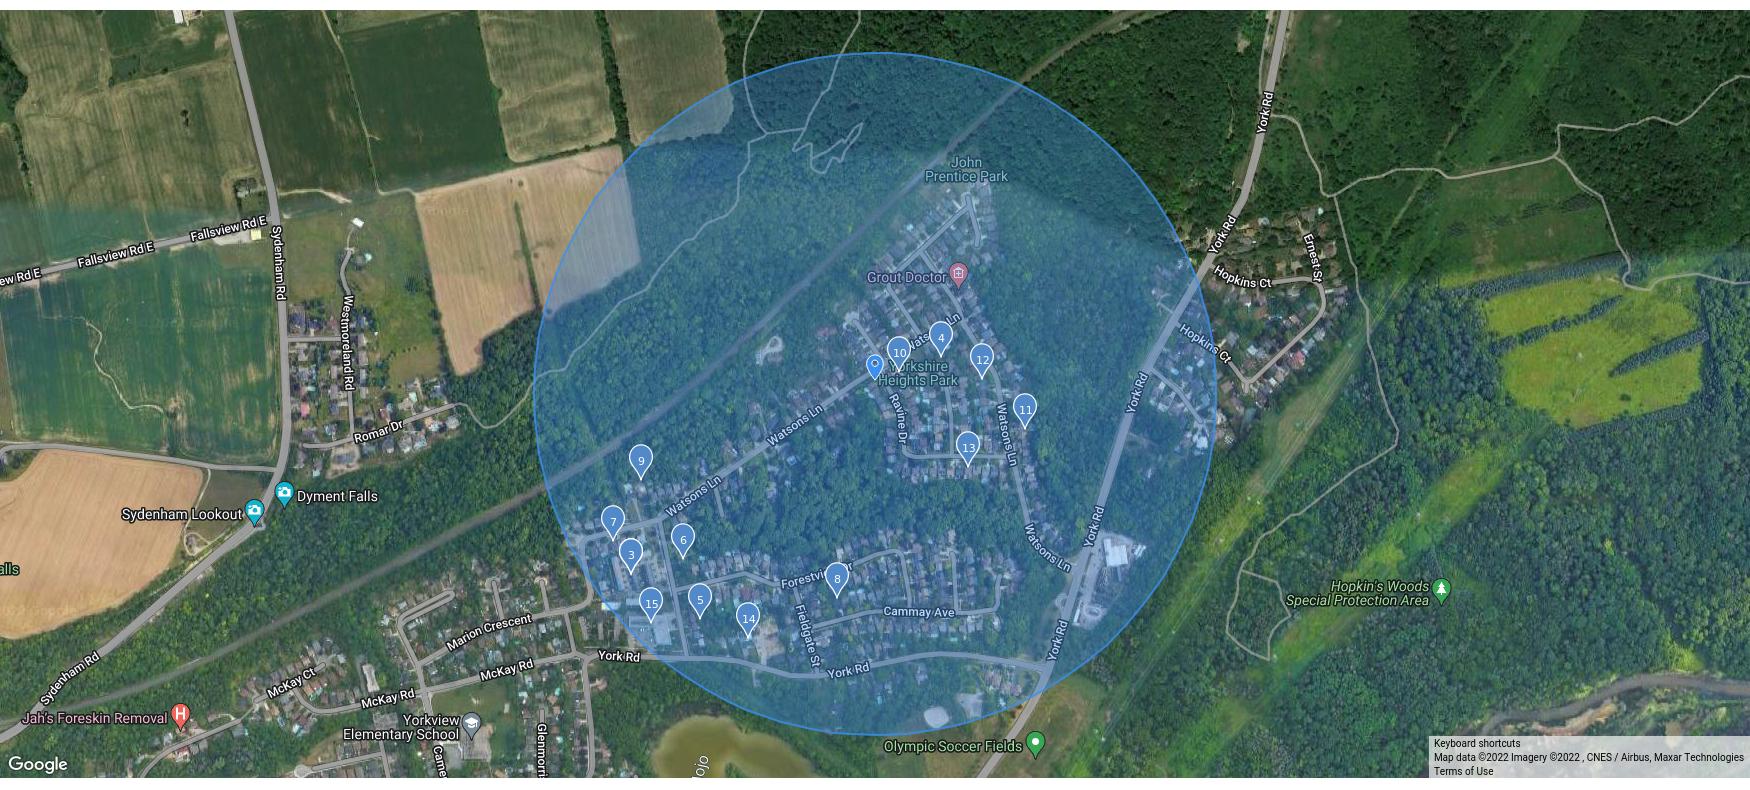
Park Street W, Dundas
The Haven Street, Dundas
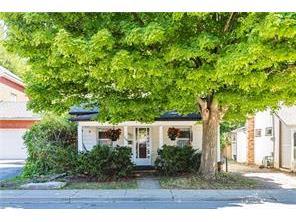
Helen Street, Dundas
NEWCOMBE Road, Dundas
PLEASANT Avenue, Dundas
Kings Gate, Dundas
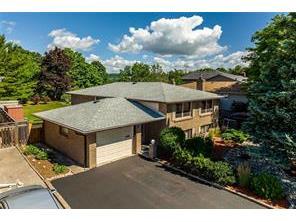
SKYLINE Drive, Dundas
MOONGLOW Place, Dundas
GREENING Court, Dundas
Pleasant Avenue, Dundas
MARTINGROVE Drive, Dundas
Watsons Lane, Dundas
This report summarizes the comparable listings contained in this market analysis
Status: Active
Bds BthList Date
Address L Price
SqFt
Freehold269 Park Street W $599,900H4148585 10/13/2022 1.0936
Freehold12 The Haven Street $899,900H4148087 10/05/2022 2.01,110
Freehold38 Helen Street $1,100,000H4132902 07/25/2022 1.11,212
Averages: 3.3 1.4
1,086 $866,600
Status: Sold Bds BthSale Date
Price SP/LP
MLS® # DOMProp Sub Type
Price SP/LP
Address L PriceSqFtMLS® # DOMProp Sub Type
5 MOONGLOW Place $749,900H4139632 06/30/2022 0.01,255 3$800,000 106.7
Freehold
Freehold7 Pleasant Avenue $789,900H4134835 08/02/2022 1.11,024 82$740,000 93.7
Freehold33 SKYLINE Drive $799,000H4143043 09/17/2022 2.01,110 46$730,000 91.4
Freehold25 NEWCOMBE Road $849,900H4148183 10/11/2022 2.01,435 5$840,000 98.8 3Freehold6 Watsons Lane $879,900H4133229 04/30/2022 2.01,070 3$980,000 111.4
Freehold7 GREENING Court $899,000H4139304 06/30/2022 3.01,774 9$1,007,000 112.0 5
Freehold4 Kings Gate $899,900H4146753 10/14/2022 2.01,146 23$873,000 97.0 5
Freehold66 PLEASANT Avenue $934,900H4146953 09/26/2022 2.11,252 4$950,000 101.6 4
Freehold29 MARTINGROVE Drive $1,349,000H4133445 06/03/2022 2.01,188 35$1,290,000 95.6 1,250 $905,711 23
Averages: 3.8 2.0 $912,222 100.9
There are certain factors that are within our control and some factors beyond our control when it comes to setting the price. Those factors within our control are: the appearance of the property, how aggressively we market the property and the price Factors outside our control are: location of property, size and local amenities. It's important to accept those factors that are beyond our control and focus on the pricing and preparation
A property priced at market value will attract more buyers than a home priced above market value. Consider that a competitively priced property will also attract a greater number of potential buyers and increase your opportunity for a quick sale
Summary...
Sell Price Per Sq. Ft. Statistics
$931,900
$1,317,000 $855,300 $1,109
Average Price/Sq Ft: High Price/Sq Ft: Median Price/Sq Ft: Low Price/Sq Ft:$826,500
Average Price: High Price: Median Price: Low Price: Figures are based on selling price after adjustments, and rounded to the nearest $100
After analyzing your property, comparable properties on the market now, recent sales and comparable properties that failed to sell, I conclude that in the current market, your property is most likely to sell for .
This is an explanation and overview of this market analysis.
This Comparative Market Analysis will help to determine the correct selling price of your home. Ultimately, the correct selling price is the highest possible price the market will bear.
This market analysis is divided into three categories:
1. Comparable homes that are currently for sale
2. Comparable homes that were recently sold
3. Comparable homes that failed to sell
Looking at similar homes that are currently offered for sale , we can assess the alternatives that a serious buyer has from which to choose. We can also be sure that we are not under pricing your home.
Looking at similar homes that were sold in the past few months, we can see a clear picture of how the market has valued homes that are comparable to yours. Banks and other lending institutions also analyze these sales to determine how much they can lend to qualified buyers.
Looking at similar homes that failed to sell, we can avoid pricing at a level that would not attract buyers.
This Comparative Market Analysis has been carefully prepared for you , analyzing homes similar to yours. The aim of this market analysis is to achieve the maximum selling price for your home, while being able to sell your home within a relatively short period of time.
This is a comparative
Subject 46 Ravine Dr 474,000$
Active 269 Park St. W 326,000$ $
Active 12 The Haven St. 405,000$ $
Active 38 Helen St. 416,000$ $
Sold 33 Skyline Dr. 459,000$ 730,000.00$ 59.04%
Sold 7 Pleasant Ave* 403,000$ 740,000.00$ 83.62%
Sold 5 Moonglow Pl. 402,000$ 800,000.00$ 99.00%
Sold 25 Newcombe Rd. 462,000$ 840,000.00$ 81.82%
Sold 66 Pleasant Ave. ** 428,000$ 950,000.00$ 121.96%
Sold 6 Watsons Lane *** 415,000$ 980,000.00$ 136.14%
Sold 7 Greening Crt. 493,000$ 1,007,000.00$ 104.26%
Sold 29 Martingrove Dr. 457,000$ 1,290,000.00$ 182.28% 108.52%
Average $ 988,367 Range $ 861,818 to 1,119,325$
NOTE: * denotes properties included in the "Direct Comparison Approach".
However, this method of deriving value is only presented as an alternative analytical tool to provide the Seller with additional "actual" statistical information regarding the subject property. Furthermore, it is noted that this method of deriving value is not as accurate as traditional valuation methods such as the "Direct Comparison Approach to Value" and the "Cost Approach to Value". The information contained herein is provided for analytical purposes only and Royal LePage State Realty, Brokerage makes NO representations and/or warranties regarding the accuracy of this information and the relationship between this information and true market value.
Land Value: 50.00 Front Ft @ 8500 425,000.00$
Actual Age: 39 years
Effective Age: 15 years
Improvements:
* estimate square footage
5,752.00$ $
Cost New Depreciation @ 10% Current Value Building 1091 Sq. ft. @ $300 327,300.00$ 294,570.00$ Basement 719 *Sq. ft. @ $80 57,520.00$ 51,768.00$ Garage 0 Sq. ft. $ $ Landscaping @ 125,000.00$ 112,500.00$
Total Current Value of All Improvements 458,838.00$ 458,838.00$
Indicated Value by the Cost Approach 883,838.00$ Value Rounded to 885,000.00$
The cost approach value has a minimal value in terms of deriving market value since the Land Value is a difficult value to derive based on comparable available market values in the area. Thus, this method of deriving value is only presented for the purpose of an alternative analytical tool used inorder to provide "actual" statistical information regarding the subject property. Furthermore, it is noted that this method of deriving value is not an accuarate representation of "market" value and the "Direct Comparison Approach to Value" illustrates a more accurate representation of value. The information contained herein is provided for analytical purposes only and Royal LePage State Realty, Brokerage makes NO representations and/or warranties regarding the accuracy of this information and the relationship between this information and true market value.
Jan-17 Sep-22
% Change
Average Sale Value 599,913.00$ 985,556.00$ 64.28%
Median Sale Value 569,700.00$ 950,000.00$ 66.75%
YTD 2016 YTD 2022 % Change
Average Price 541,988.00$ 1,069,498.00$ 97.33%
Median Price 512,417.00$ 966,345.00$ 88.59%
46 Ravine Dr 615,000.00$ Adjusted Value (vs. Average) 1,010,341.40$
Adjusted Value (vs. Median) 1,025,539.76$
Adjusted Value (vs. Average) 1,213,571.65$
Adjusted Value (vs. Median) 1,159,801.83$
Based on an analysis of the average sale price in the acqusition year versus the market change, the estimated "market" value of the subject property is:
Estimate of Value: $ 1,102,314 Value Add: $Return: 100%
Estimate of Value: $ 1,102,314
Estimate of value (Range): $ 1,010,341.40 to $ 1,213,572
However, this method of deriving value is only presented as an alternative analytical tool to provide the Seller with additional "actual" statistical information regarding the subject property. Furthermore, it is noted that this method of deriving value is typically not as accurate as traditional valuation methods such as the "Direct Comparison Approach to Value" and the "Cost Approach to Value". Thus, the relative significance of this method of deriving value is extremely low. The information contained herein is provided for analytical purposes only and Royal LePage State Realty, Brokerage makes NO representations and/or warranties regarding the accuracy of this information and the relationship between this information and true market value.


Copyright © 2002-2022 Teranet Inc. and its suppliers. All rights reserved.

This report was prepared by: SALES REPRESENTATIVE mikeheddle@royallepage.ca
MICHAEL HEDDLE ROYAL LEPAGE STATE REALTY Office: (905)574-7441
www.mikeheddle.ca Fax: (905)662-2227

Assessment Roll Legal Description: PLAN M250 LOT 2
Property Address: 46 RAVINE DR DUNDAS ON L9H6K7
Zoning: R2
Property Type: RESIDENTIAL Site Area: 0.12A
Site Variance: Regular
Driveway Type: Separate or Private Driveway
Garage Type: BASEMENT GARAGE
Garage Spaces: 0
Water Service Type: Municipal
Sanitation Type: Municipal
Pool: Indoor :N, Outdoor :N Locker: 0
Sale Date Sale Amount Type Notes
Mar 23, 2017 $615,000 Transfer
Jun 25, 2010 $360,000 Transfer
Jun 23, 2006 $325,000 Transfer
Aug 20, 1984 $1 Transfer
MICHAEL HEDDLE (78672)

Maximum: $7,605,000
$600,000
$1,633,497
Median: $1,246,000
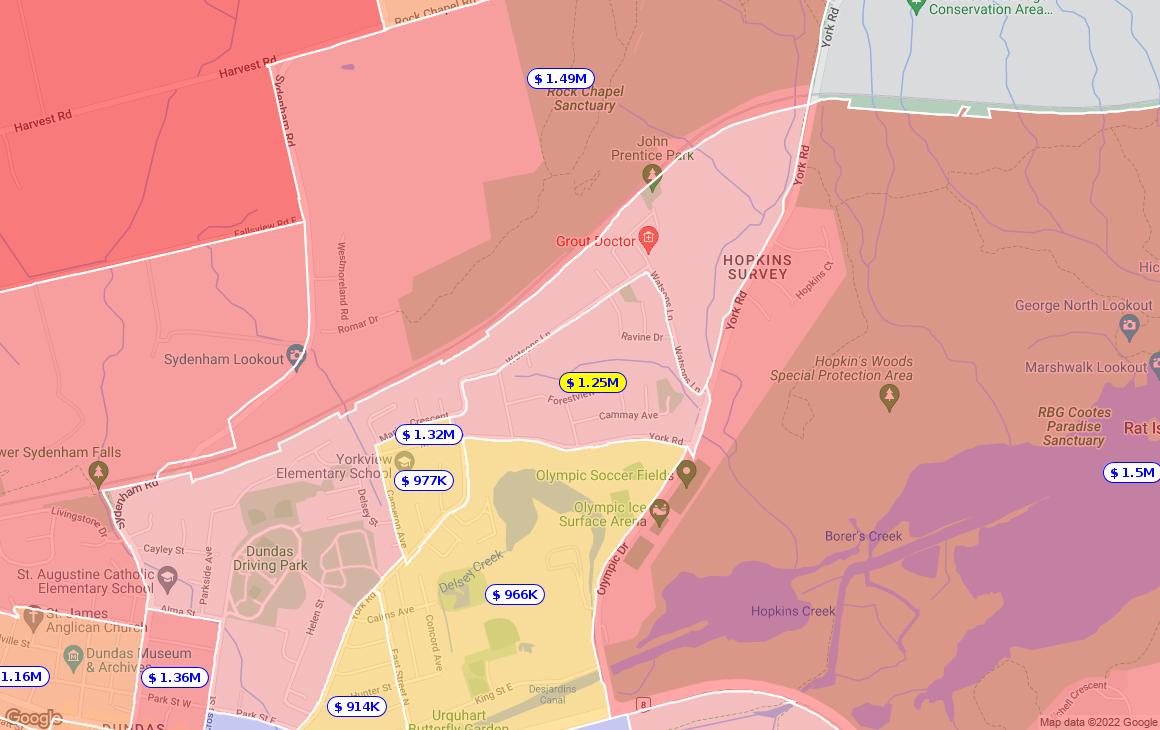
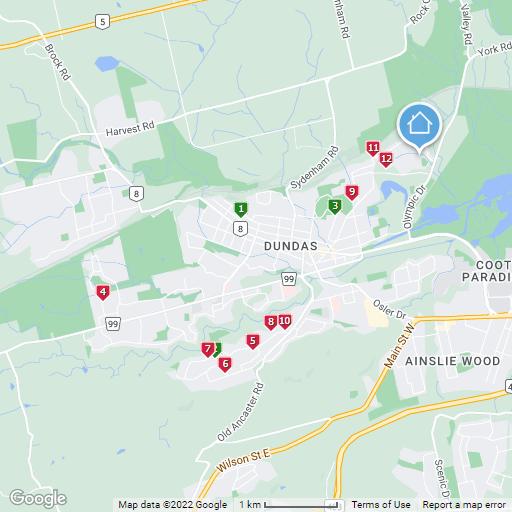
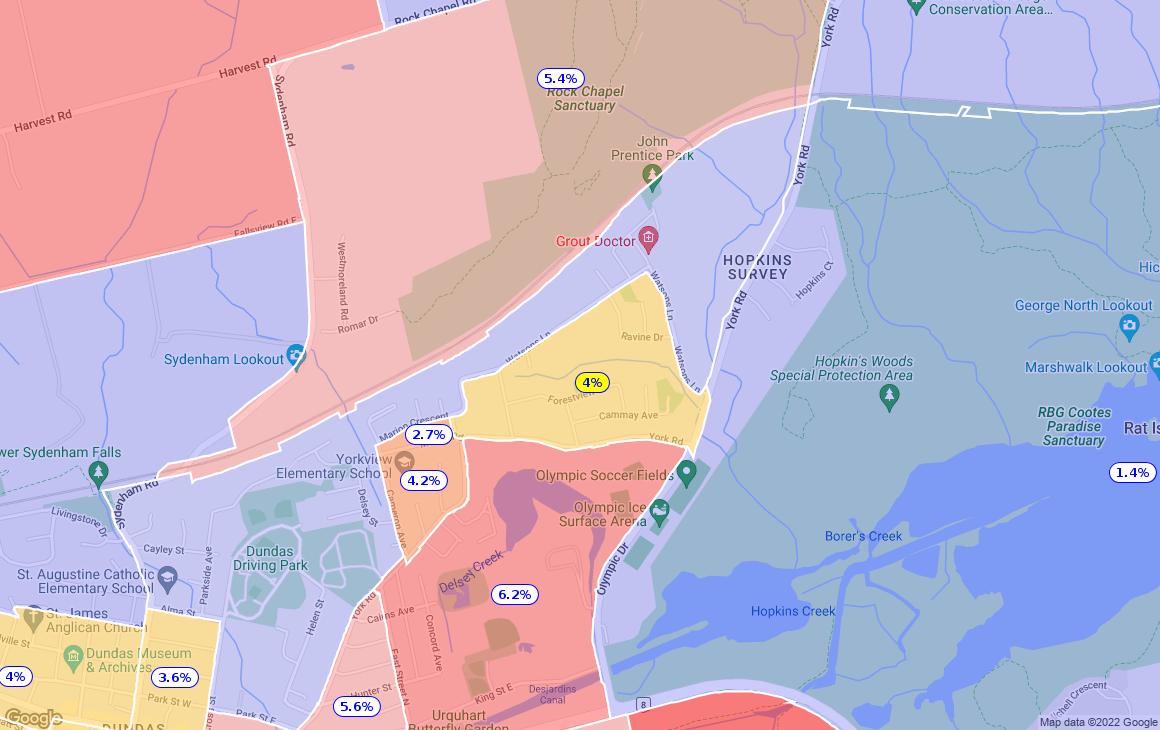
The Average Sales Heat Map shows the
surrounding
compared
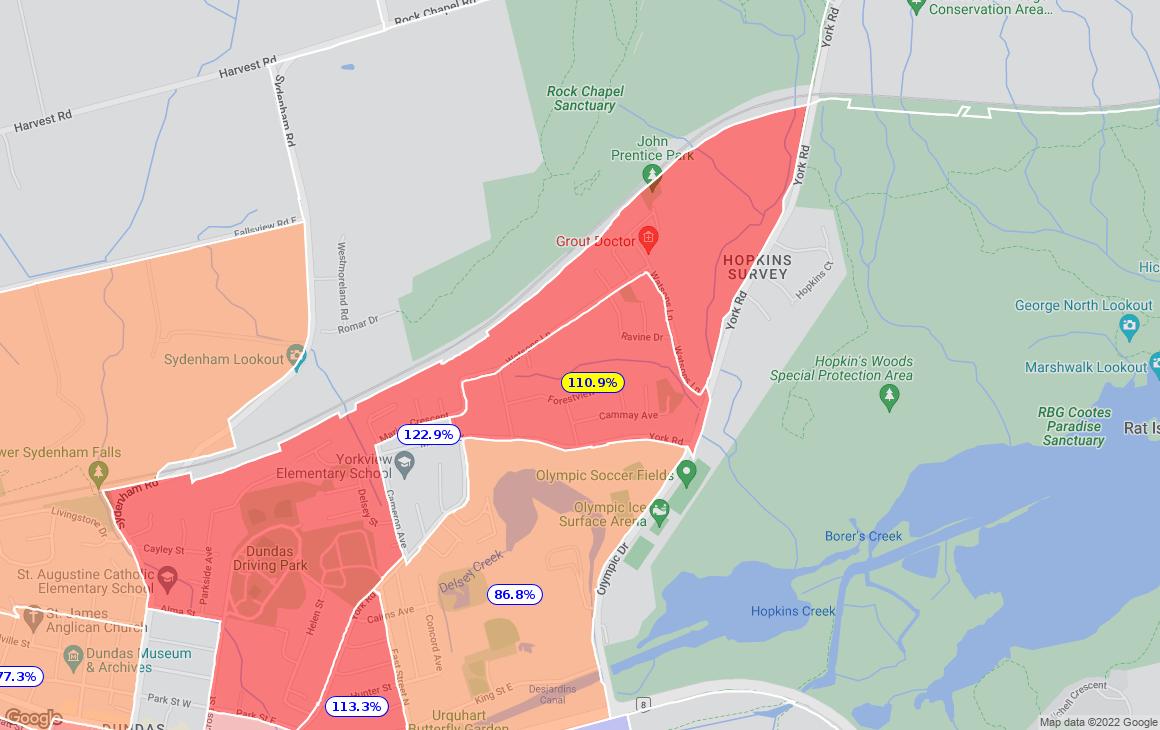
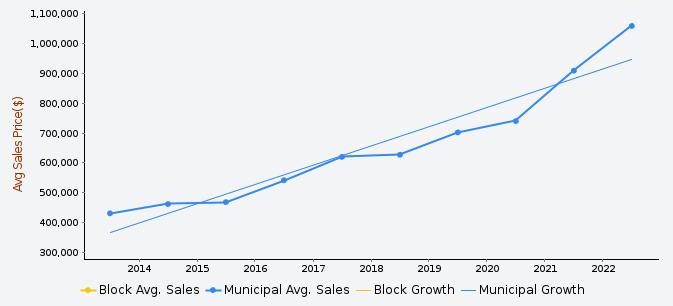
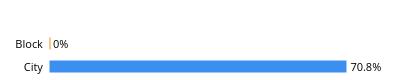
Growth Rate Heat Maps - Last 5 Years
The Growth Rate Heat Map shows the growth of the average sale price of properties within the subject property's block compared to surrounding blocks.
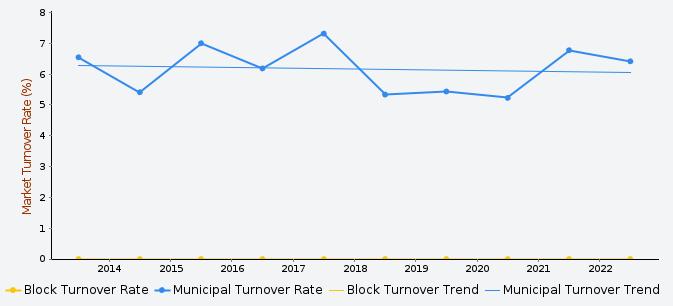
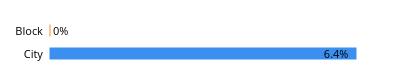
Market Turnover Heat Maps - Last 1 Year
The Market Turnover Heat Map shows the percentage of properties that have sold in the past year within the subject property's block compared to surrounding blocks.
by MICHAEL HEDDLE (78672)
Growth Rate - Last 5 Years
Market Turnover - Last 1 Year
Up and Coming - This area has proven more affordable than many areas of the municipality, and has seen property prices grow 21.4% higher than the average municipal growth. Worth investigating for investment potential.
Reports Not the Official Record. Reports, other than the Parcel Register, obtained through Geowarehouse are not the official government record and will not necessarily reflect the current status of interests in land.
Data contained in the Geowarehouse reports are notCurrency of Information. maintained real-time. Data contained in reports, other than the Parcel Register, may be out of date ten business days or more from data contained in POLARIS.
Data, information and other products and services accessed through the LandCoverage. Registry Information Services are limited to land registry offices in the areas identified on the coverage map.
Some Sales History Reports may be incomplete due to the amount of data collected during POLARIS title automation. Subject properties may also show nominal consideration or sales price (e.g. $2) in cases such as transfers between spouses or in tax exempt transfers.
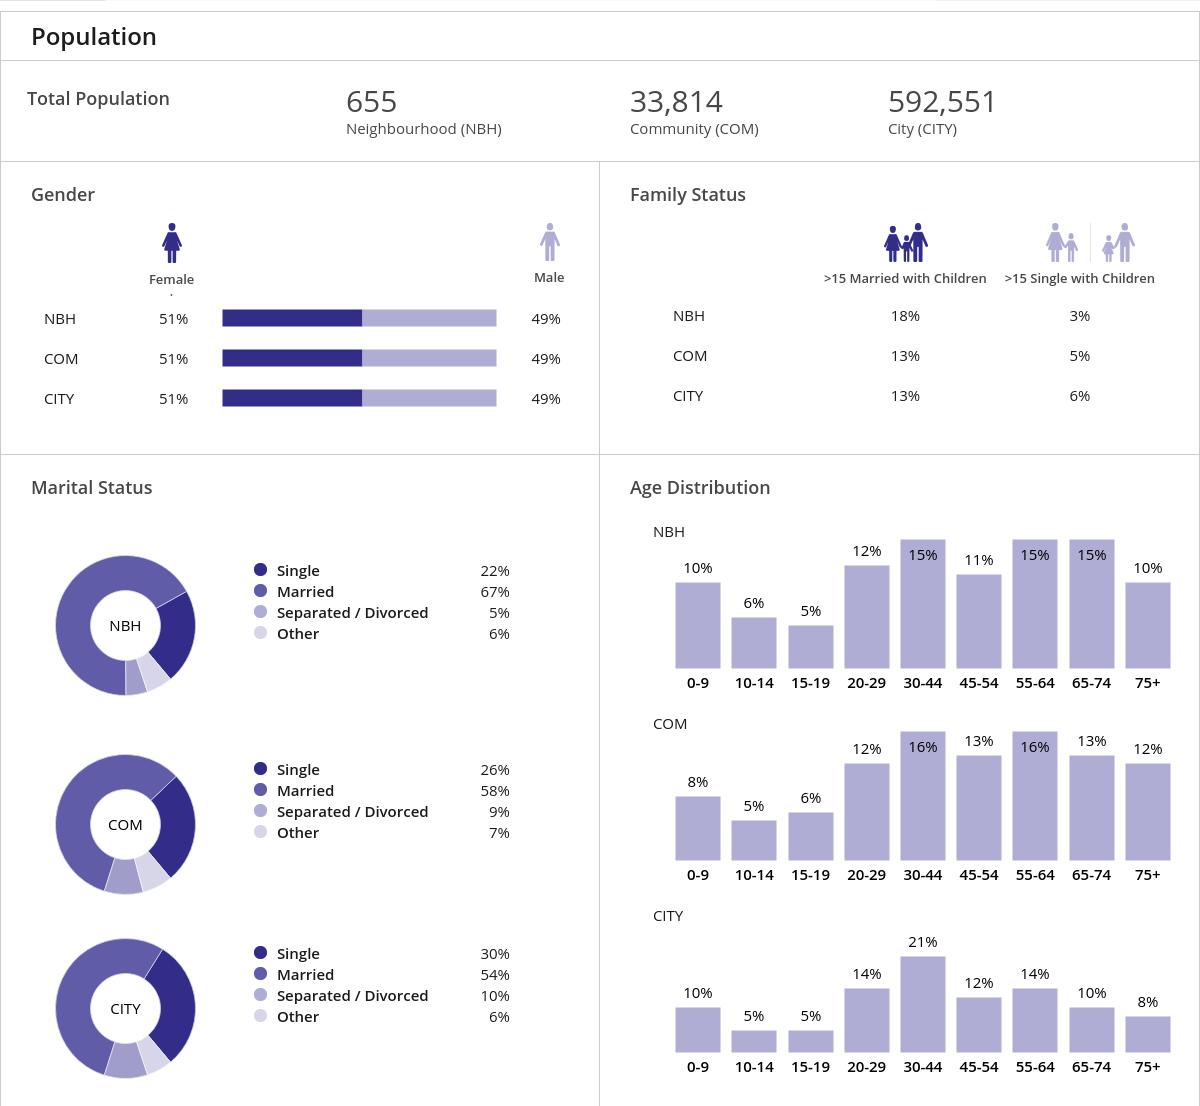
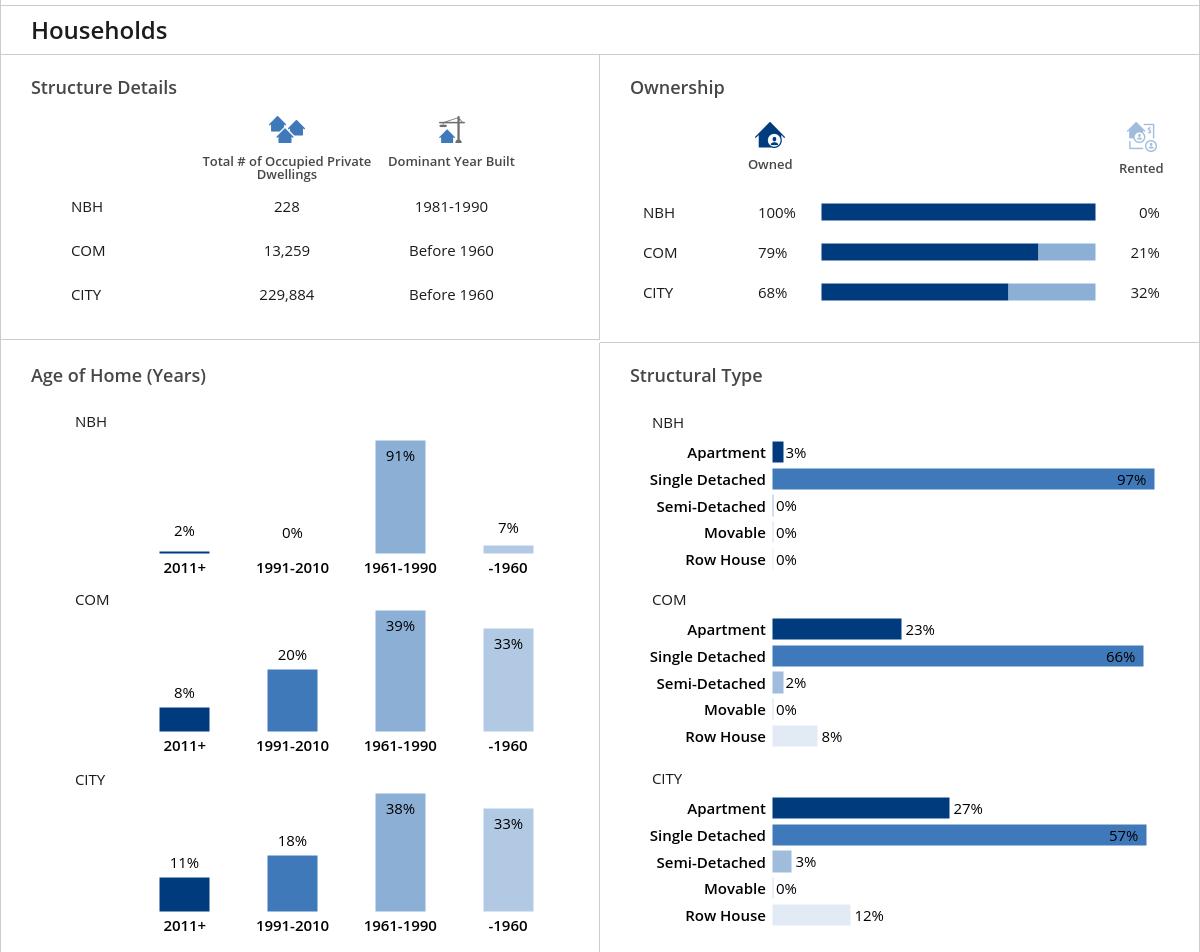
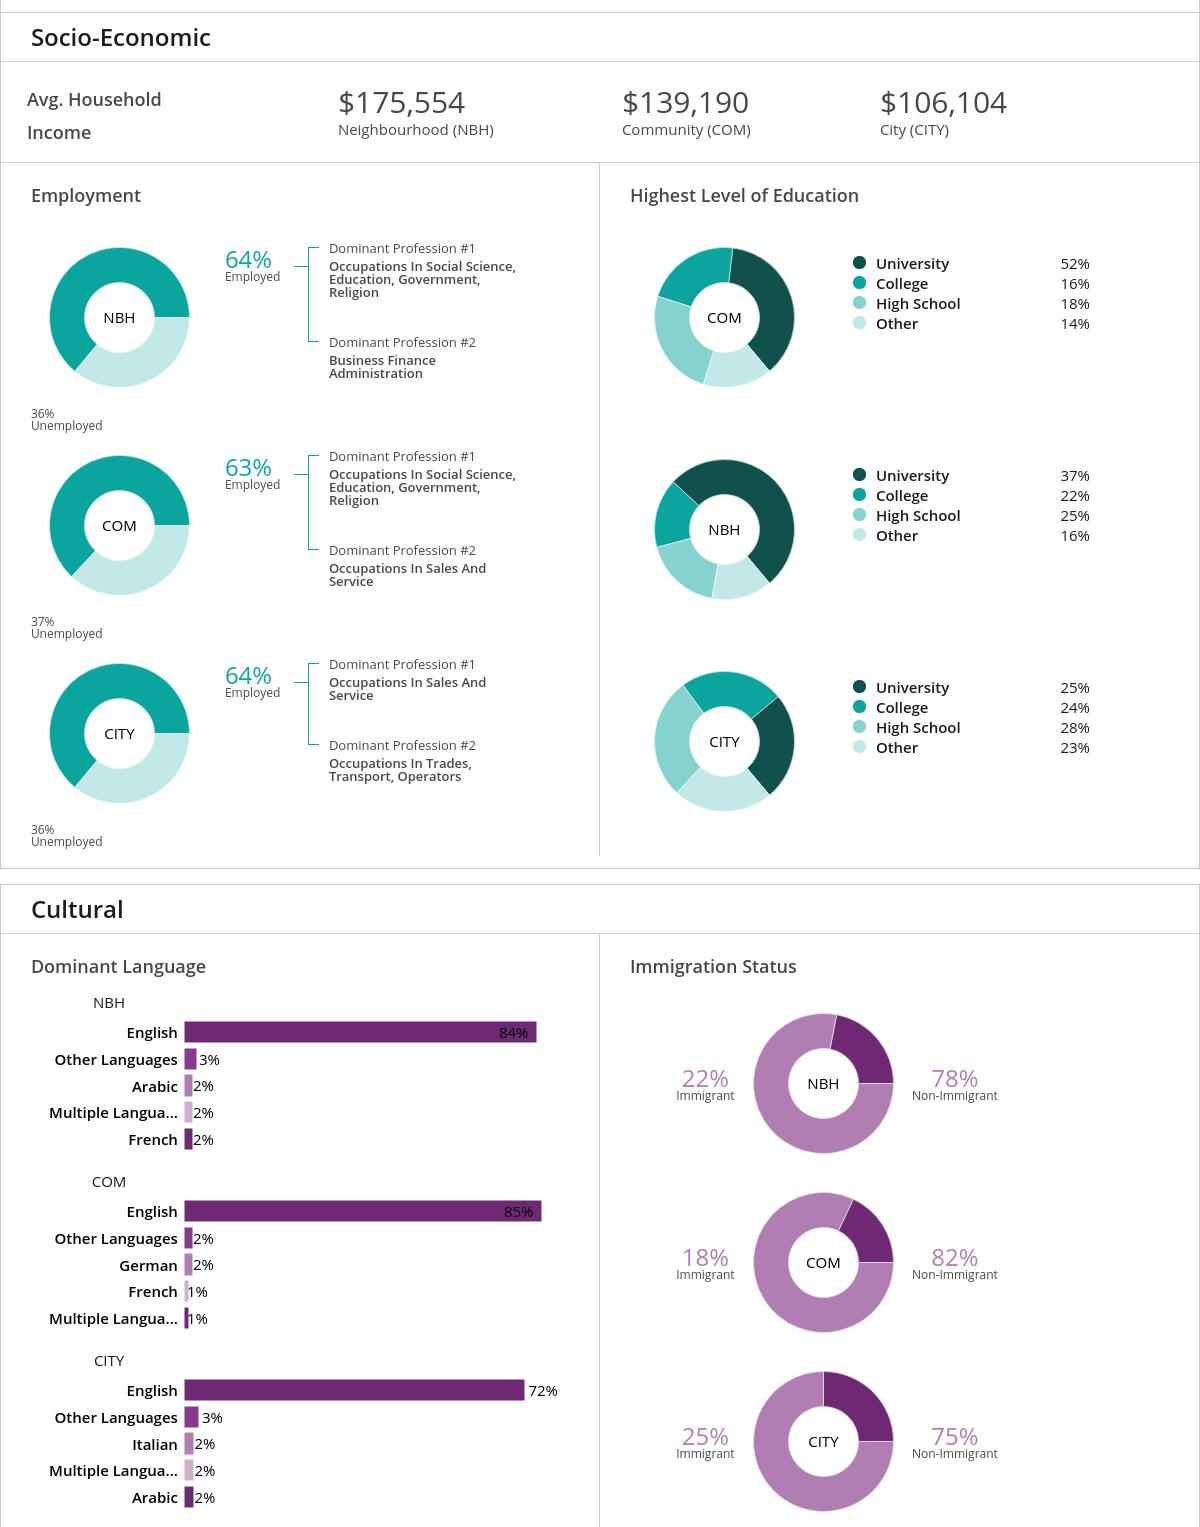
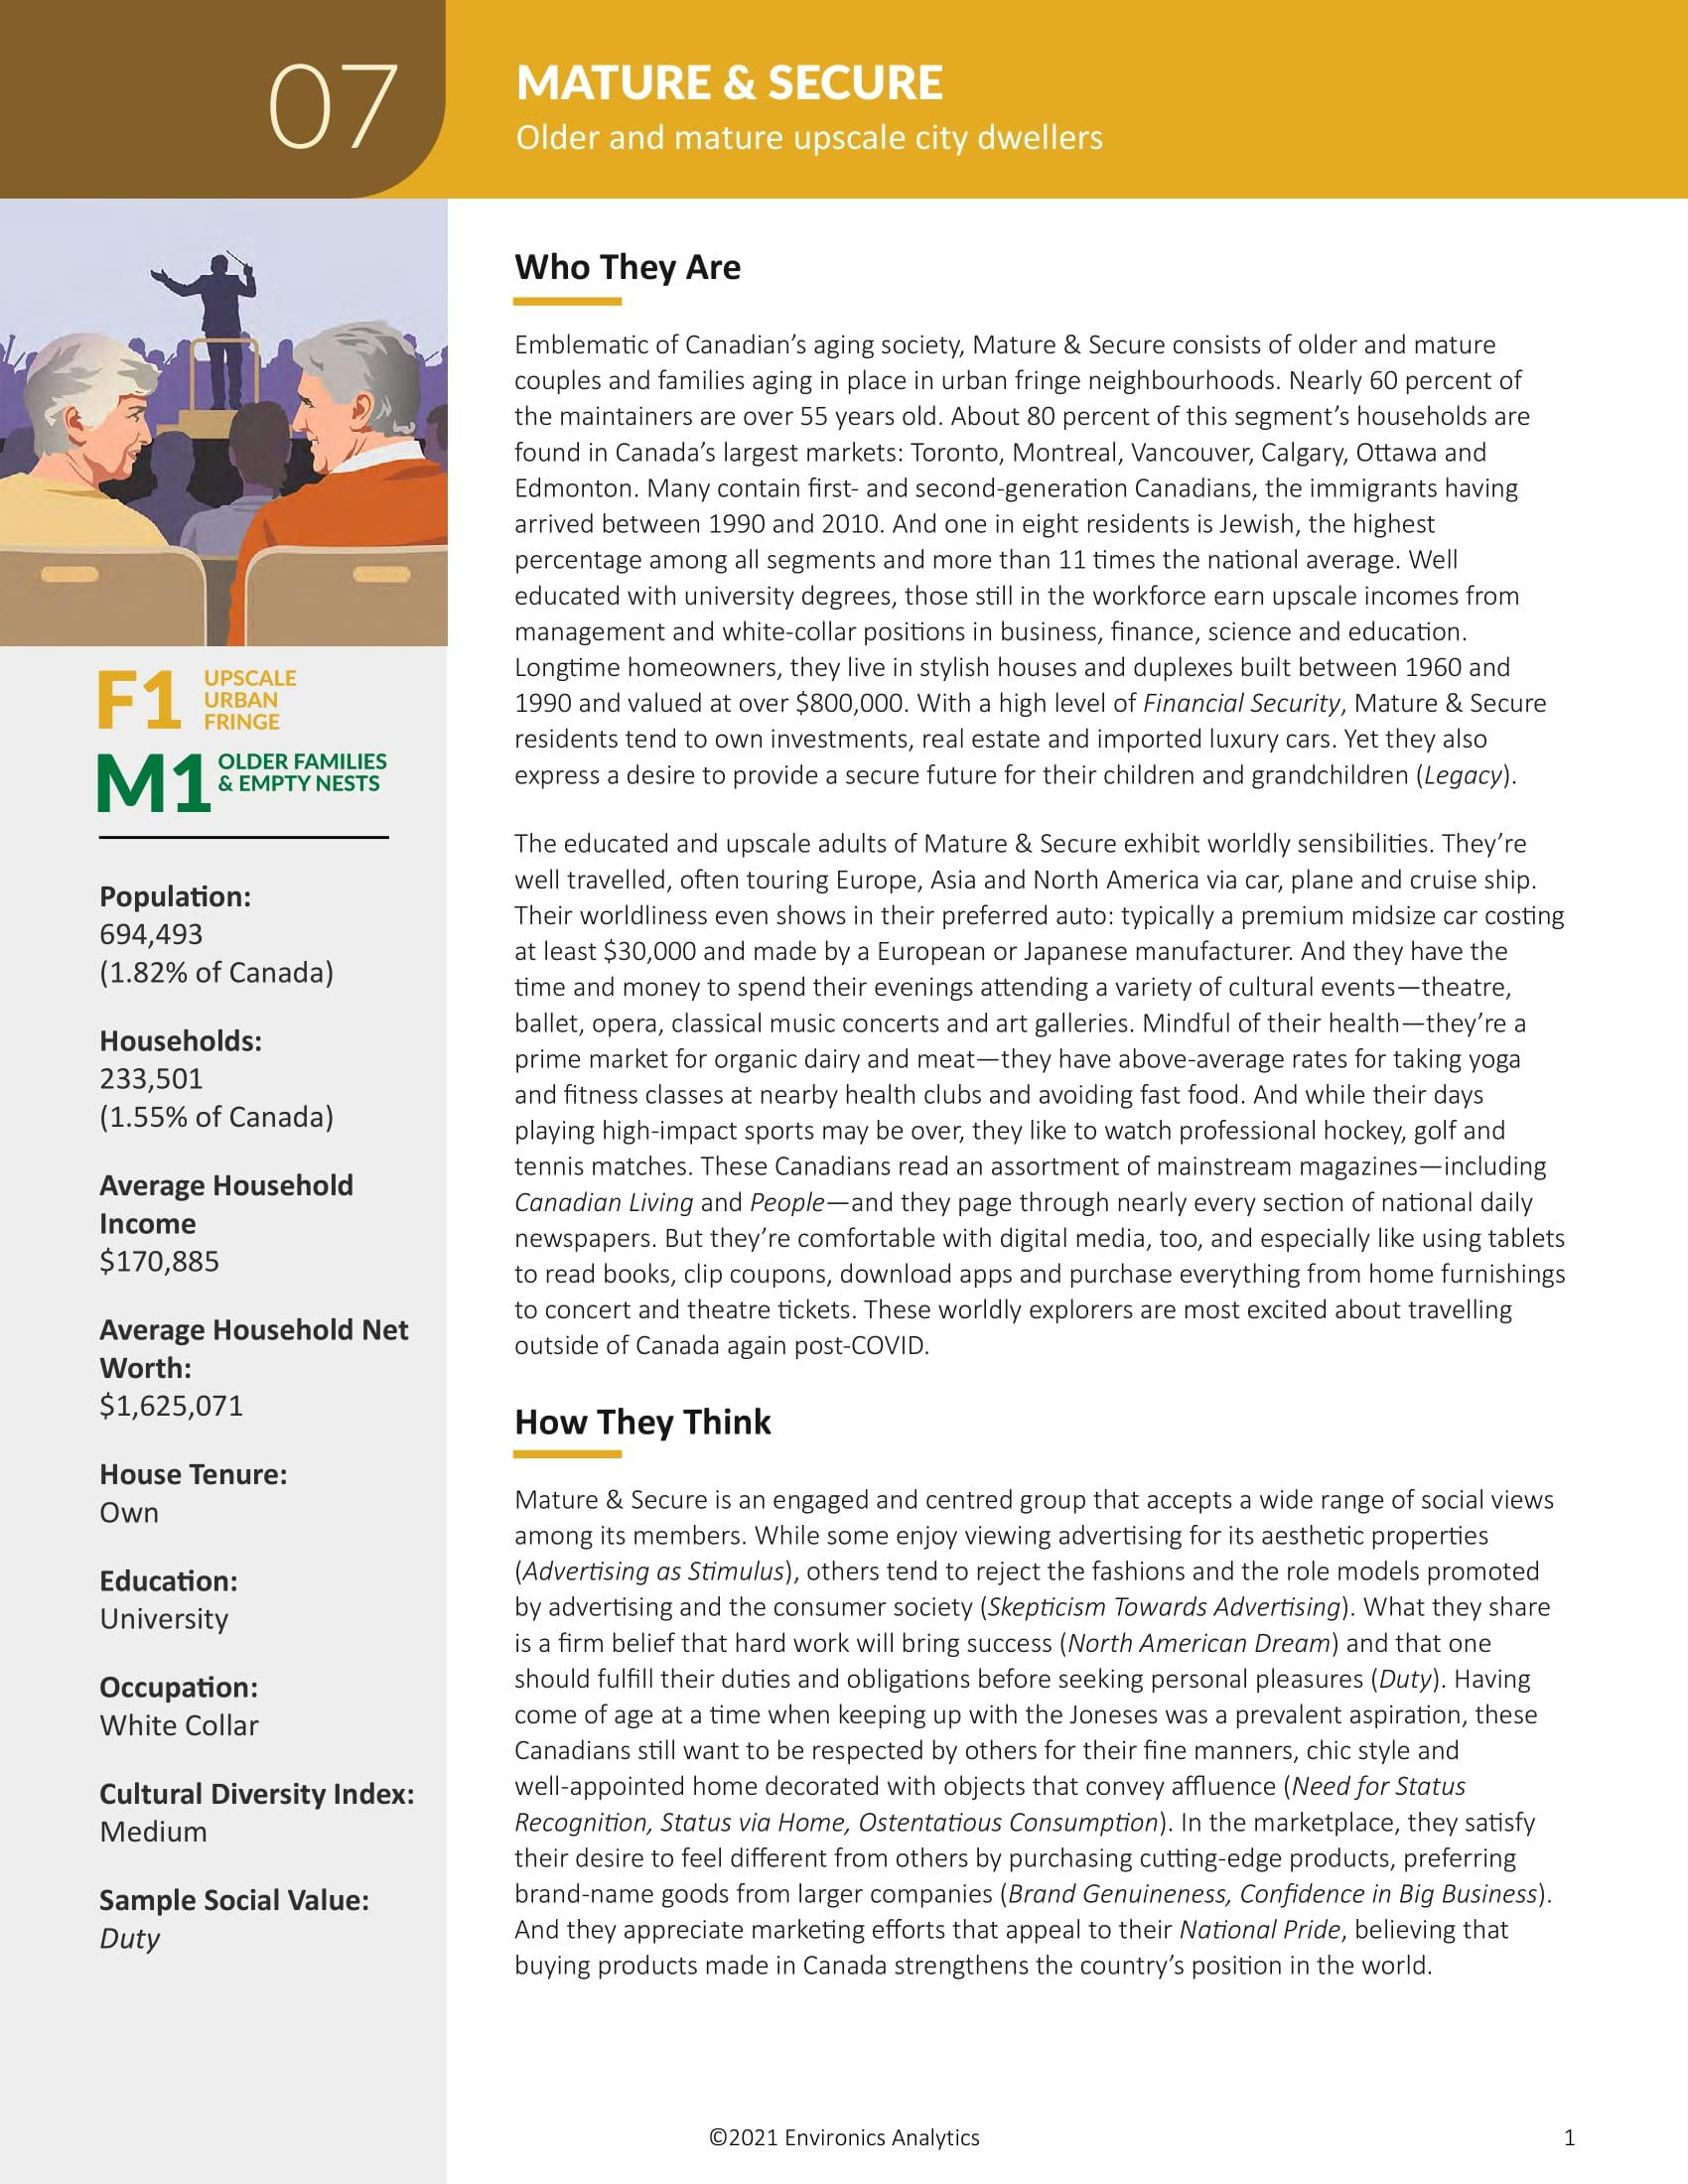
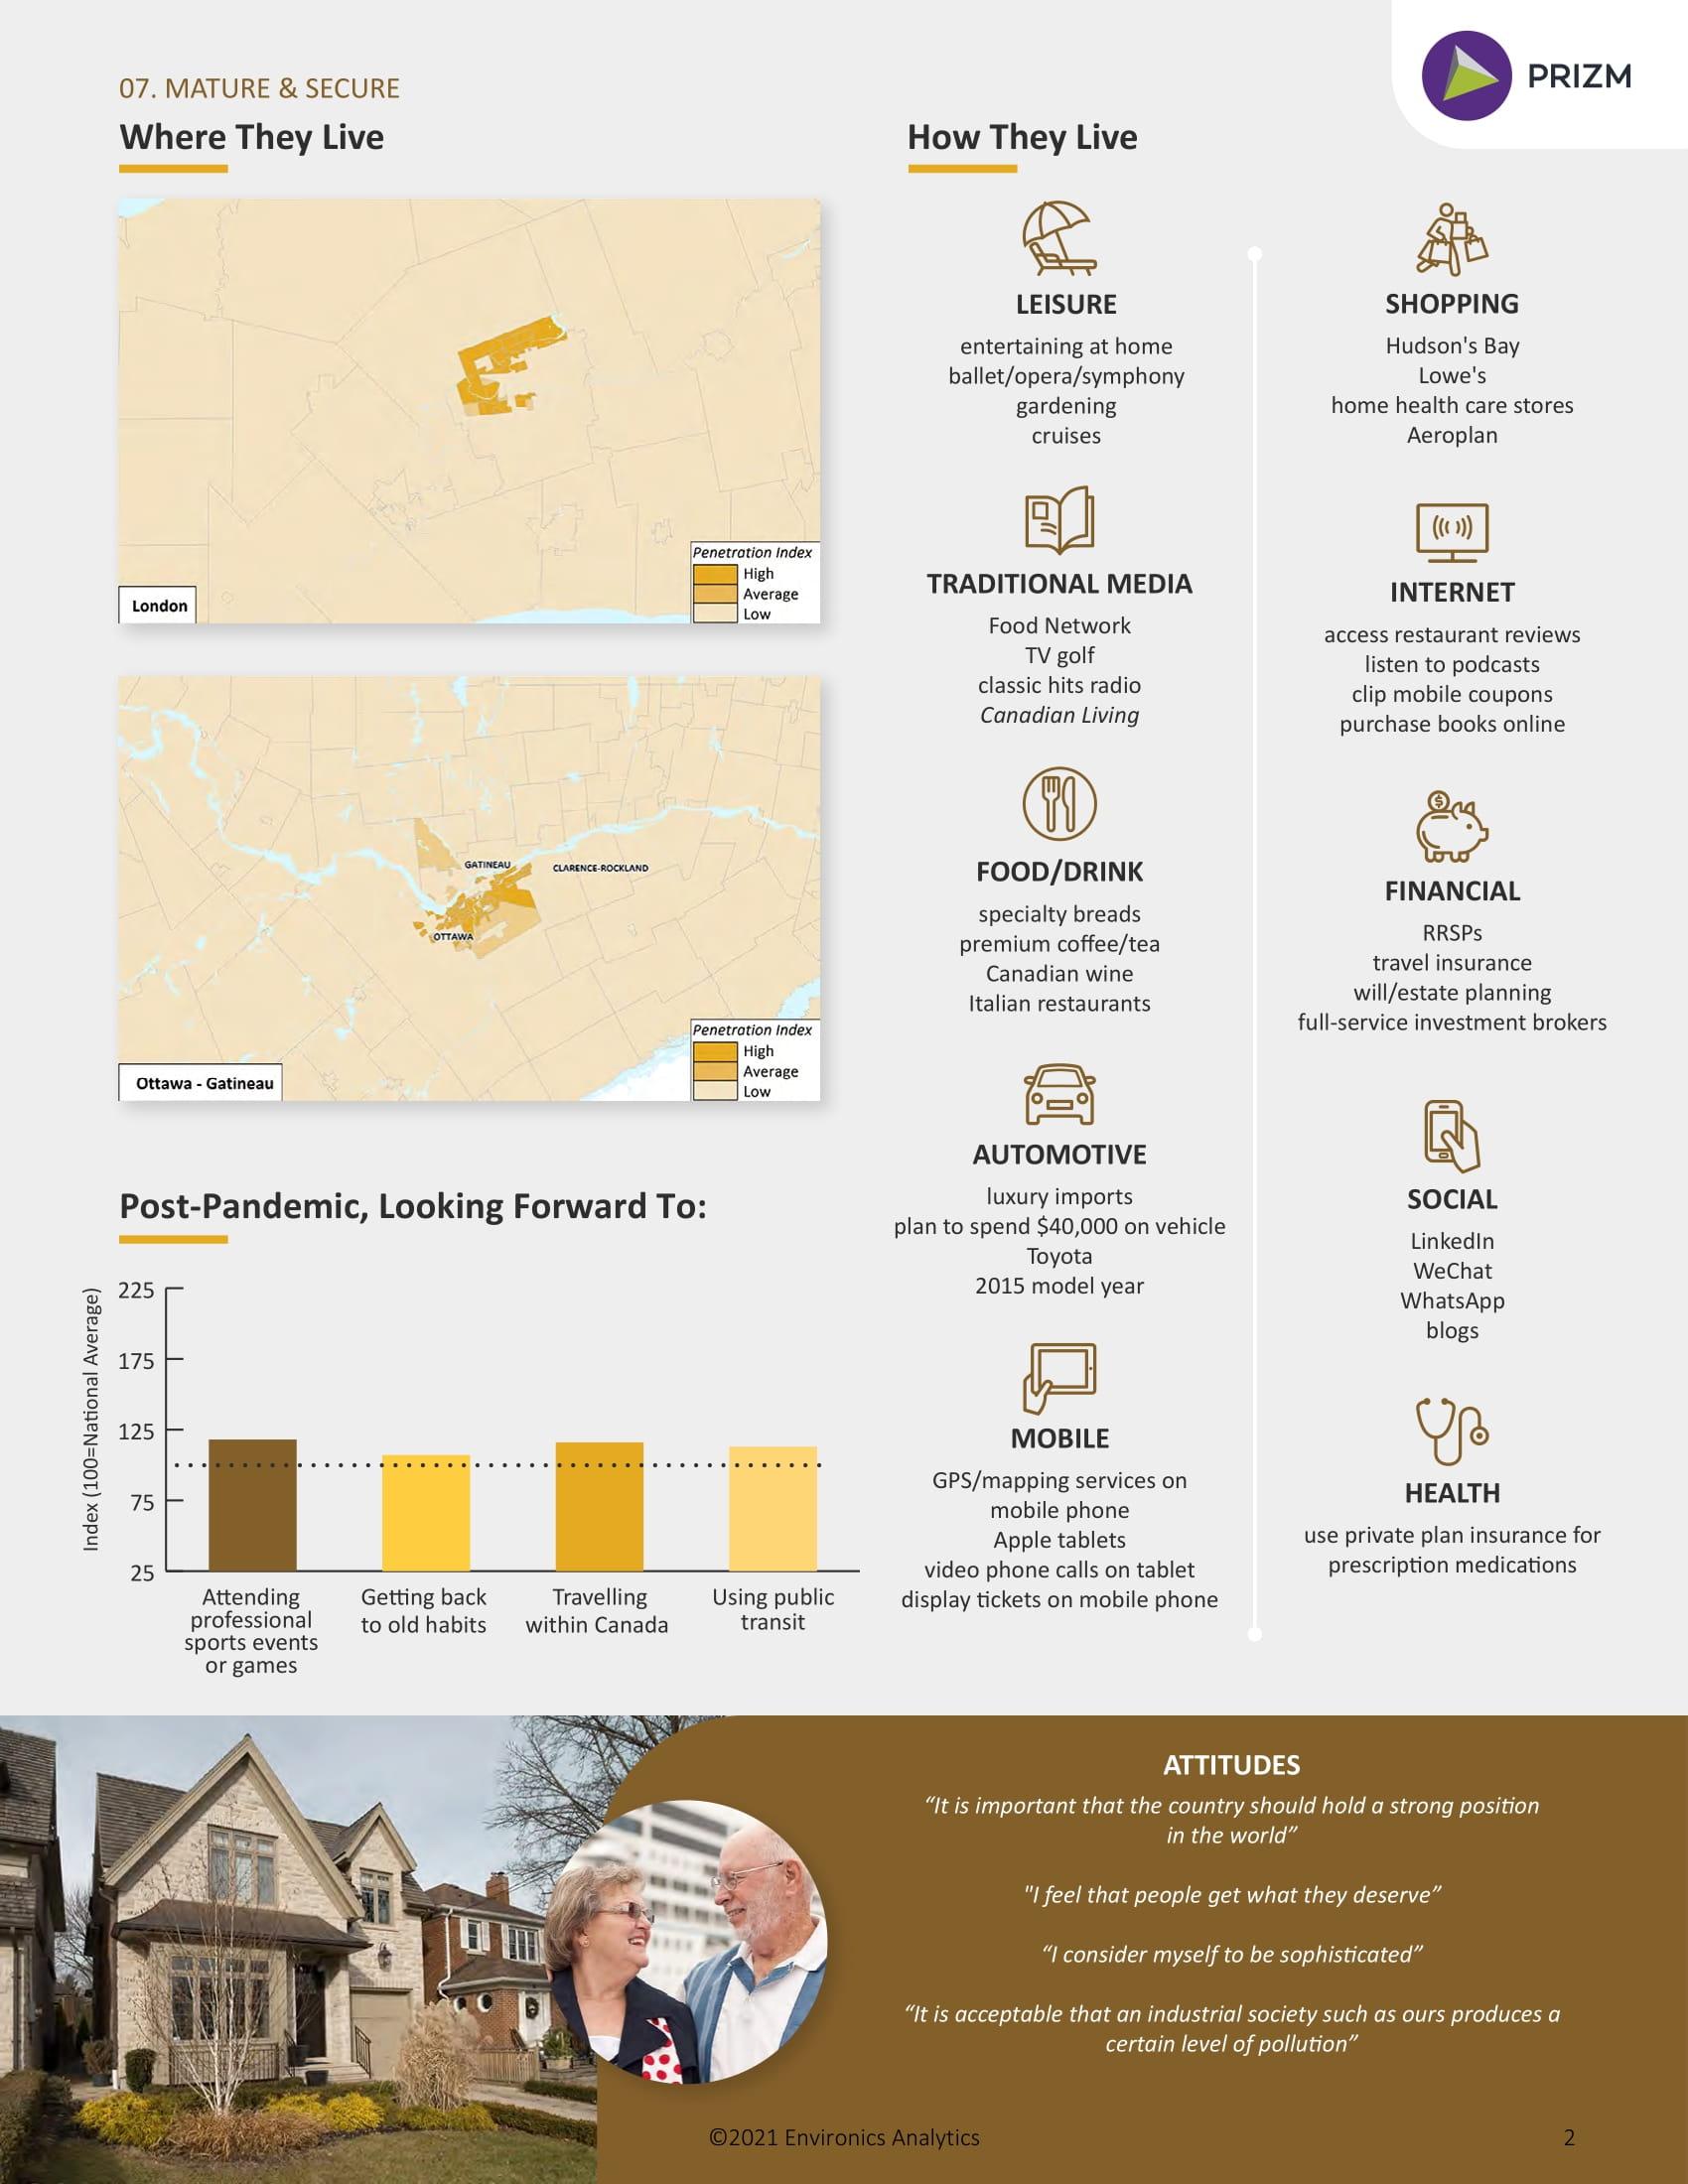
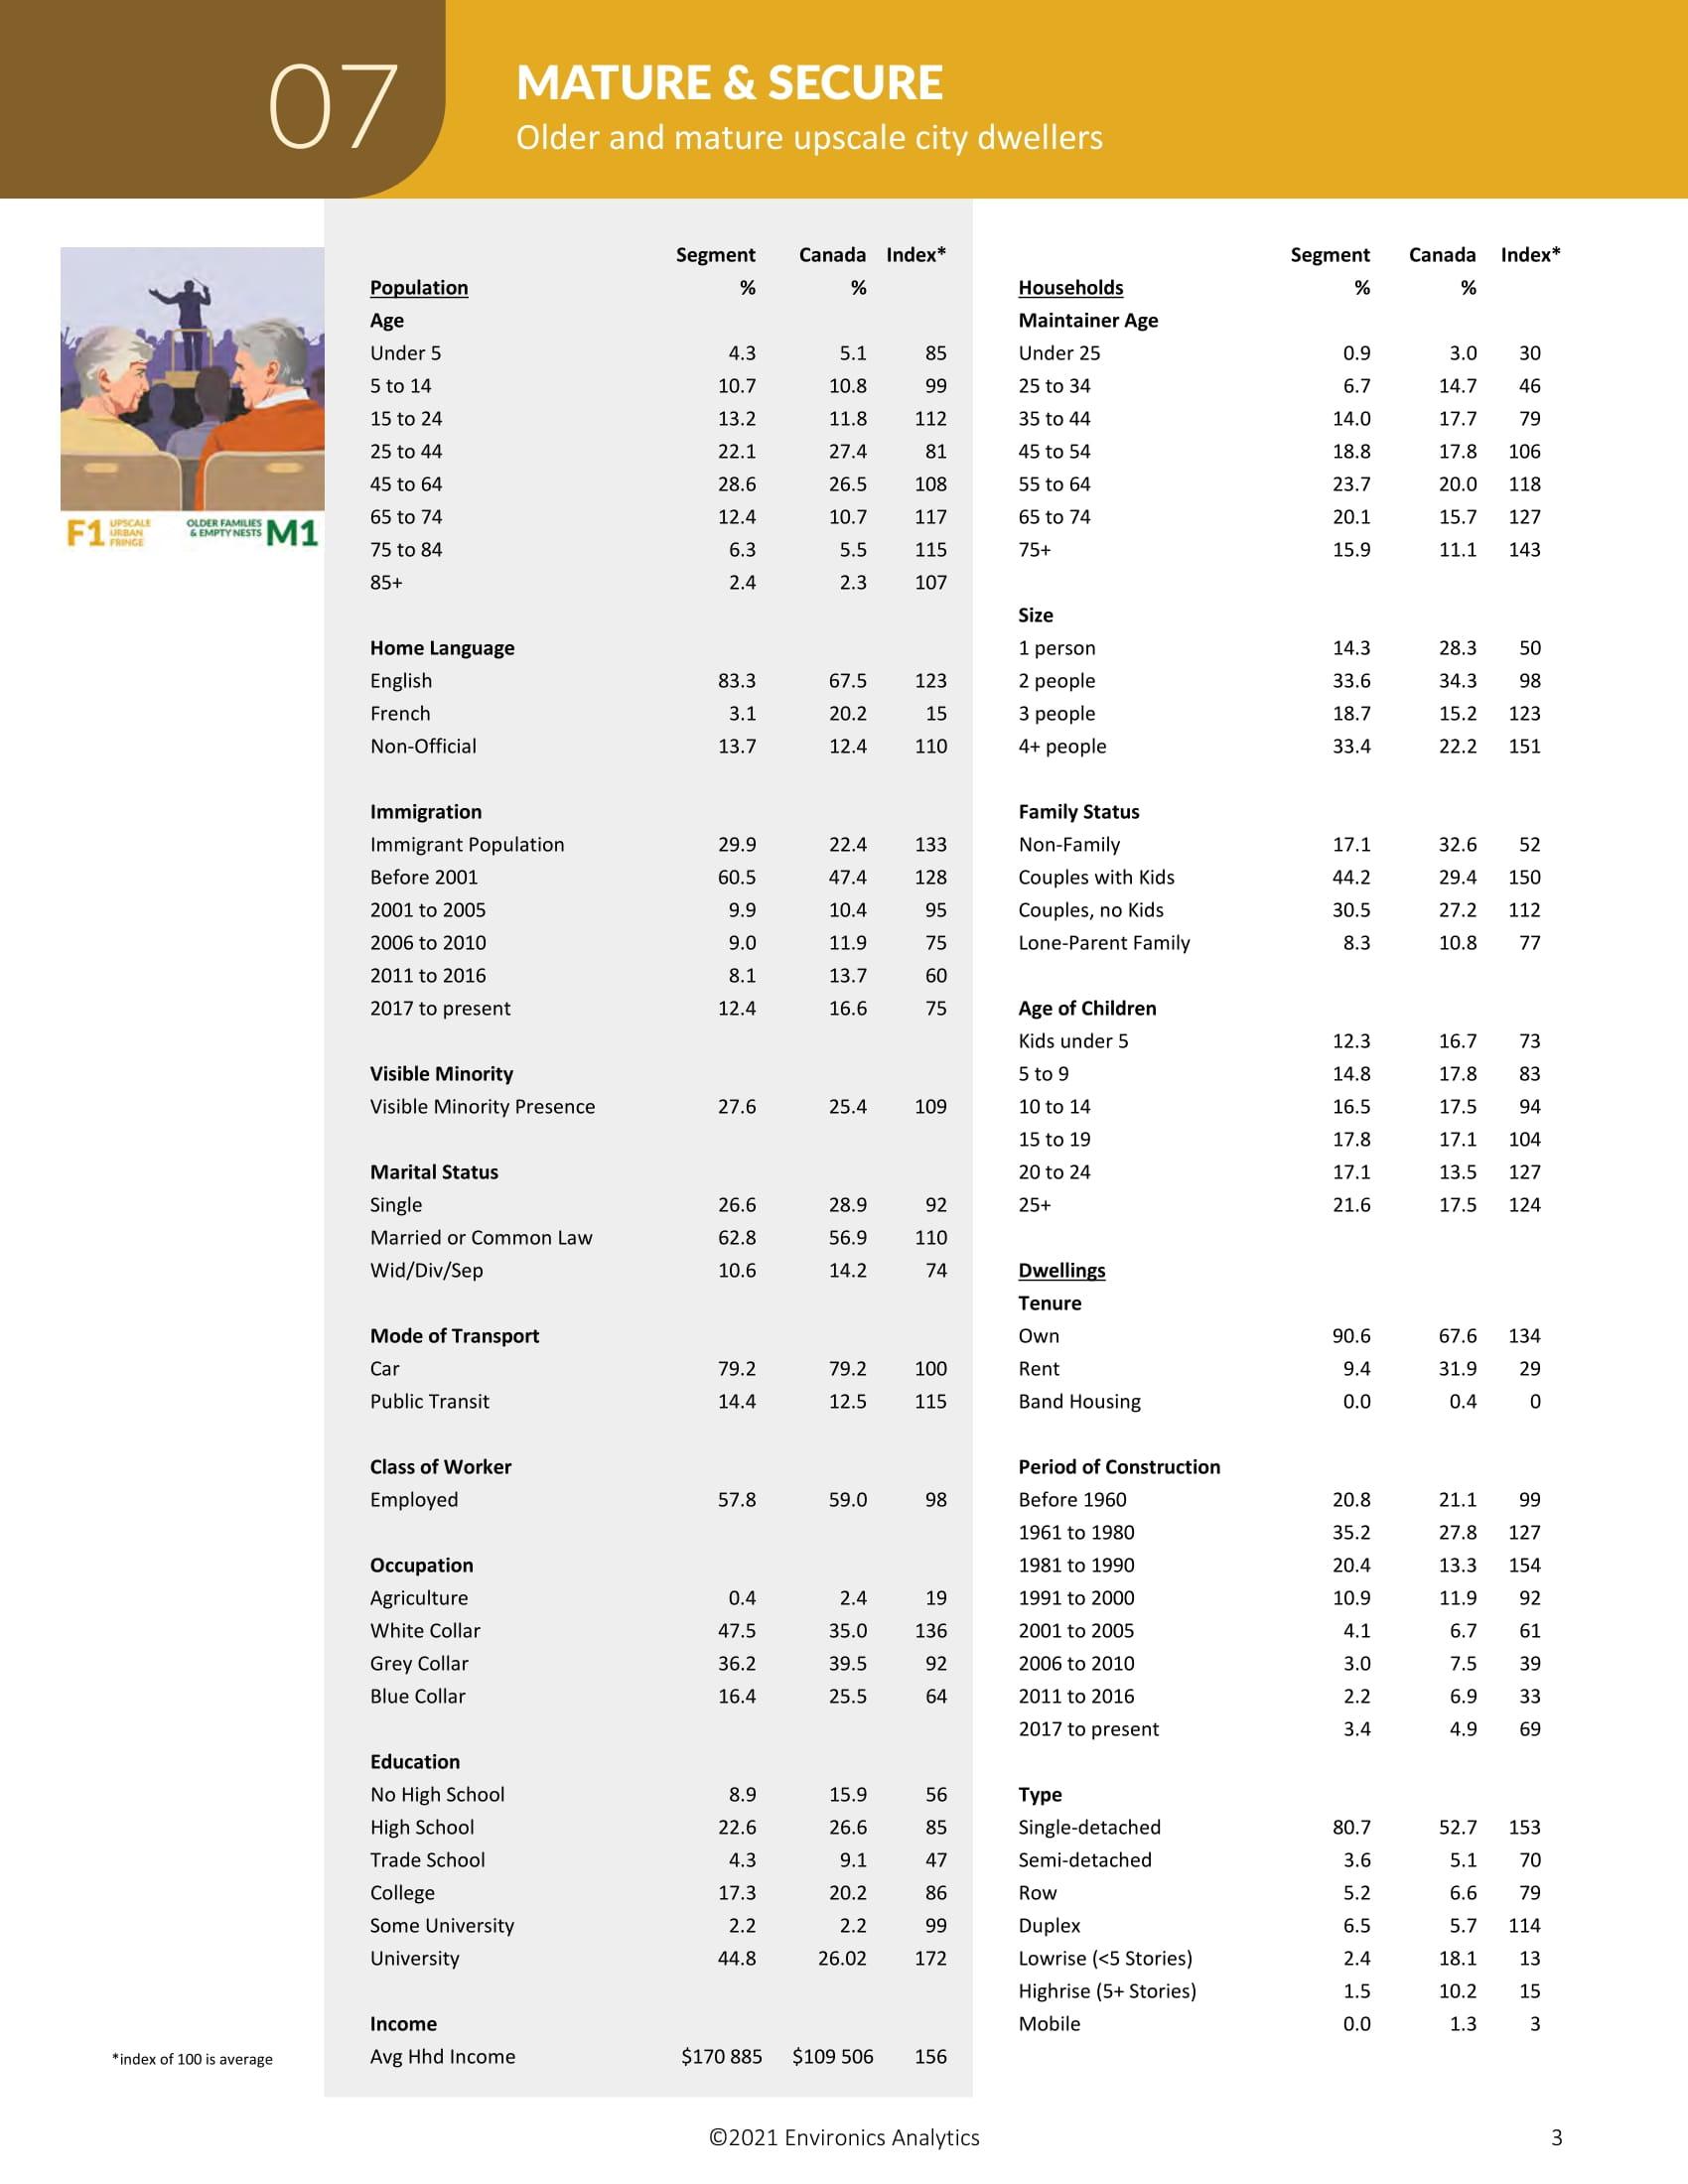
Demographic Information is obtained from Environics
Demographic Information. Analytics. Environics Analytics acquires and distributes Statistics Canada files in accordance with the Government of Canada's Open Data Policy. No information on any individual or household was made a vailable to Environics Analytics by Statistics Canada. PRIZM and selected PRIZMC2 nicknames are registered trademarks of The Nielsen Company (U.S.) and are used with permission.
The Property Information Services, reports and information are provided "as is" and your use is subject to the applicable Legal Terms and Conditions. Some information obtained from the Land Registry Information Services is not the official government record and will not reflect the current status of interests in land. Use of personal information contained herein shall relate directly to the purpose for which the data appears in land registry records and is subject to all applicable privacy legislation in respect of personal information. Such information shall not be used for marketing to a named individual.
Parcel Mapping shown on the site was compiled using plans and documents recorded in the Land Registry System and has been prepared for property indexing purposes only. It is not a Plan of Survey. For actual dimensions of property boundaries, see recorded plans and documents.
Copyright © 2002-2022 Teranet Inc. and its suppliers. All rights reserved.
Our goal is to ensure that our aggressive and ‘dialled in’ marketing plan get the most exposure of your property listing in front of serious qualified purchasers. It’s important for us to keep communication open with you and routinely review the market conditions and our marketing efforts.
The conditions of the macro and micro markets surrounding your property are key to understand when offering your property for sale. As your real estate advisors, it’s important for us to make sure that we effectively communicate those conditions with you so that you may be informed.
Determining the current market conditions, and type of market, is key in order to provide professional guidance with the sale of your property. A ‘market intelligence’ tool that illustrates the strength of the market is determining the number of months’ of inventory. This metric identifies the strength of the market be indicating market demand. Typically:
“Seller’s Market” is identified as between 0 4 months’ of inventory. “Balanced Market” is typically represented by 4 6 months of inventory. “Buyer’s Market” is defined as anything over 6+ months of inventory.
The Heddle Group. | www.theHeddleGroup.ca | info@theheddlegroup.ca

https://matrix.rahb.ca/Matrix/Stats/StatsPrint.aspx?c=AAEAAAD**…GNoYXJ0LXR5cGUxPSJTcGxpbmUiIGNoYXJ0LXR5cGUyPSJDb2x1bW4iIC8(&t2=
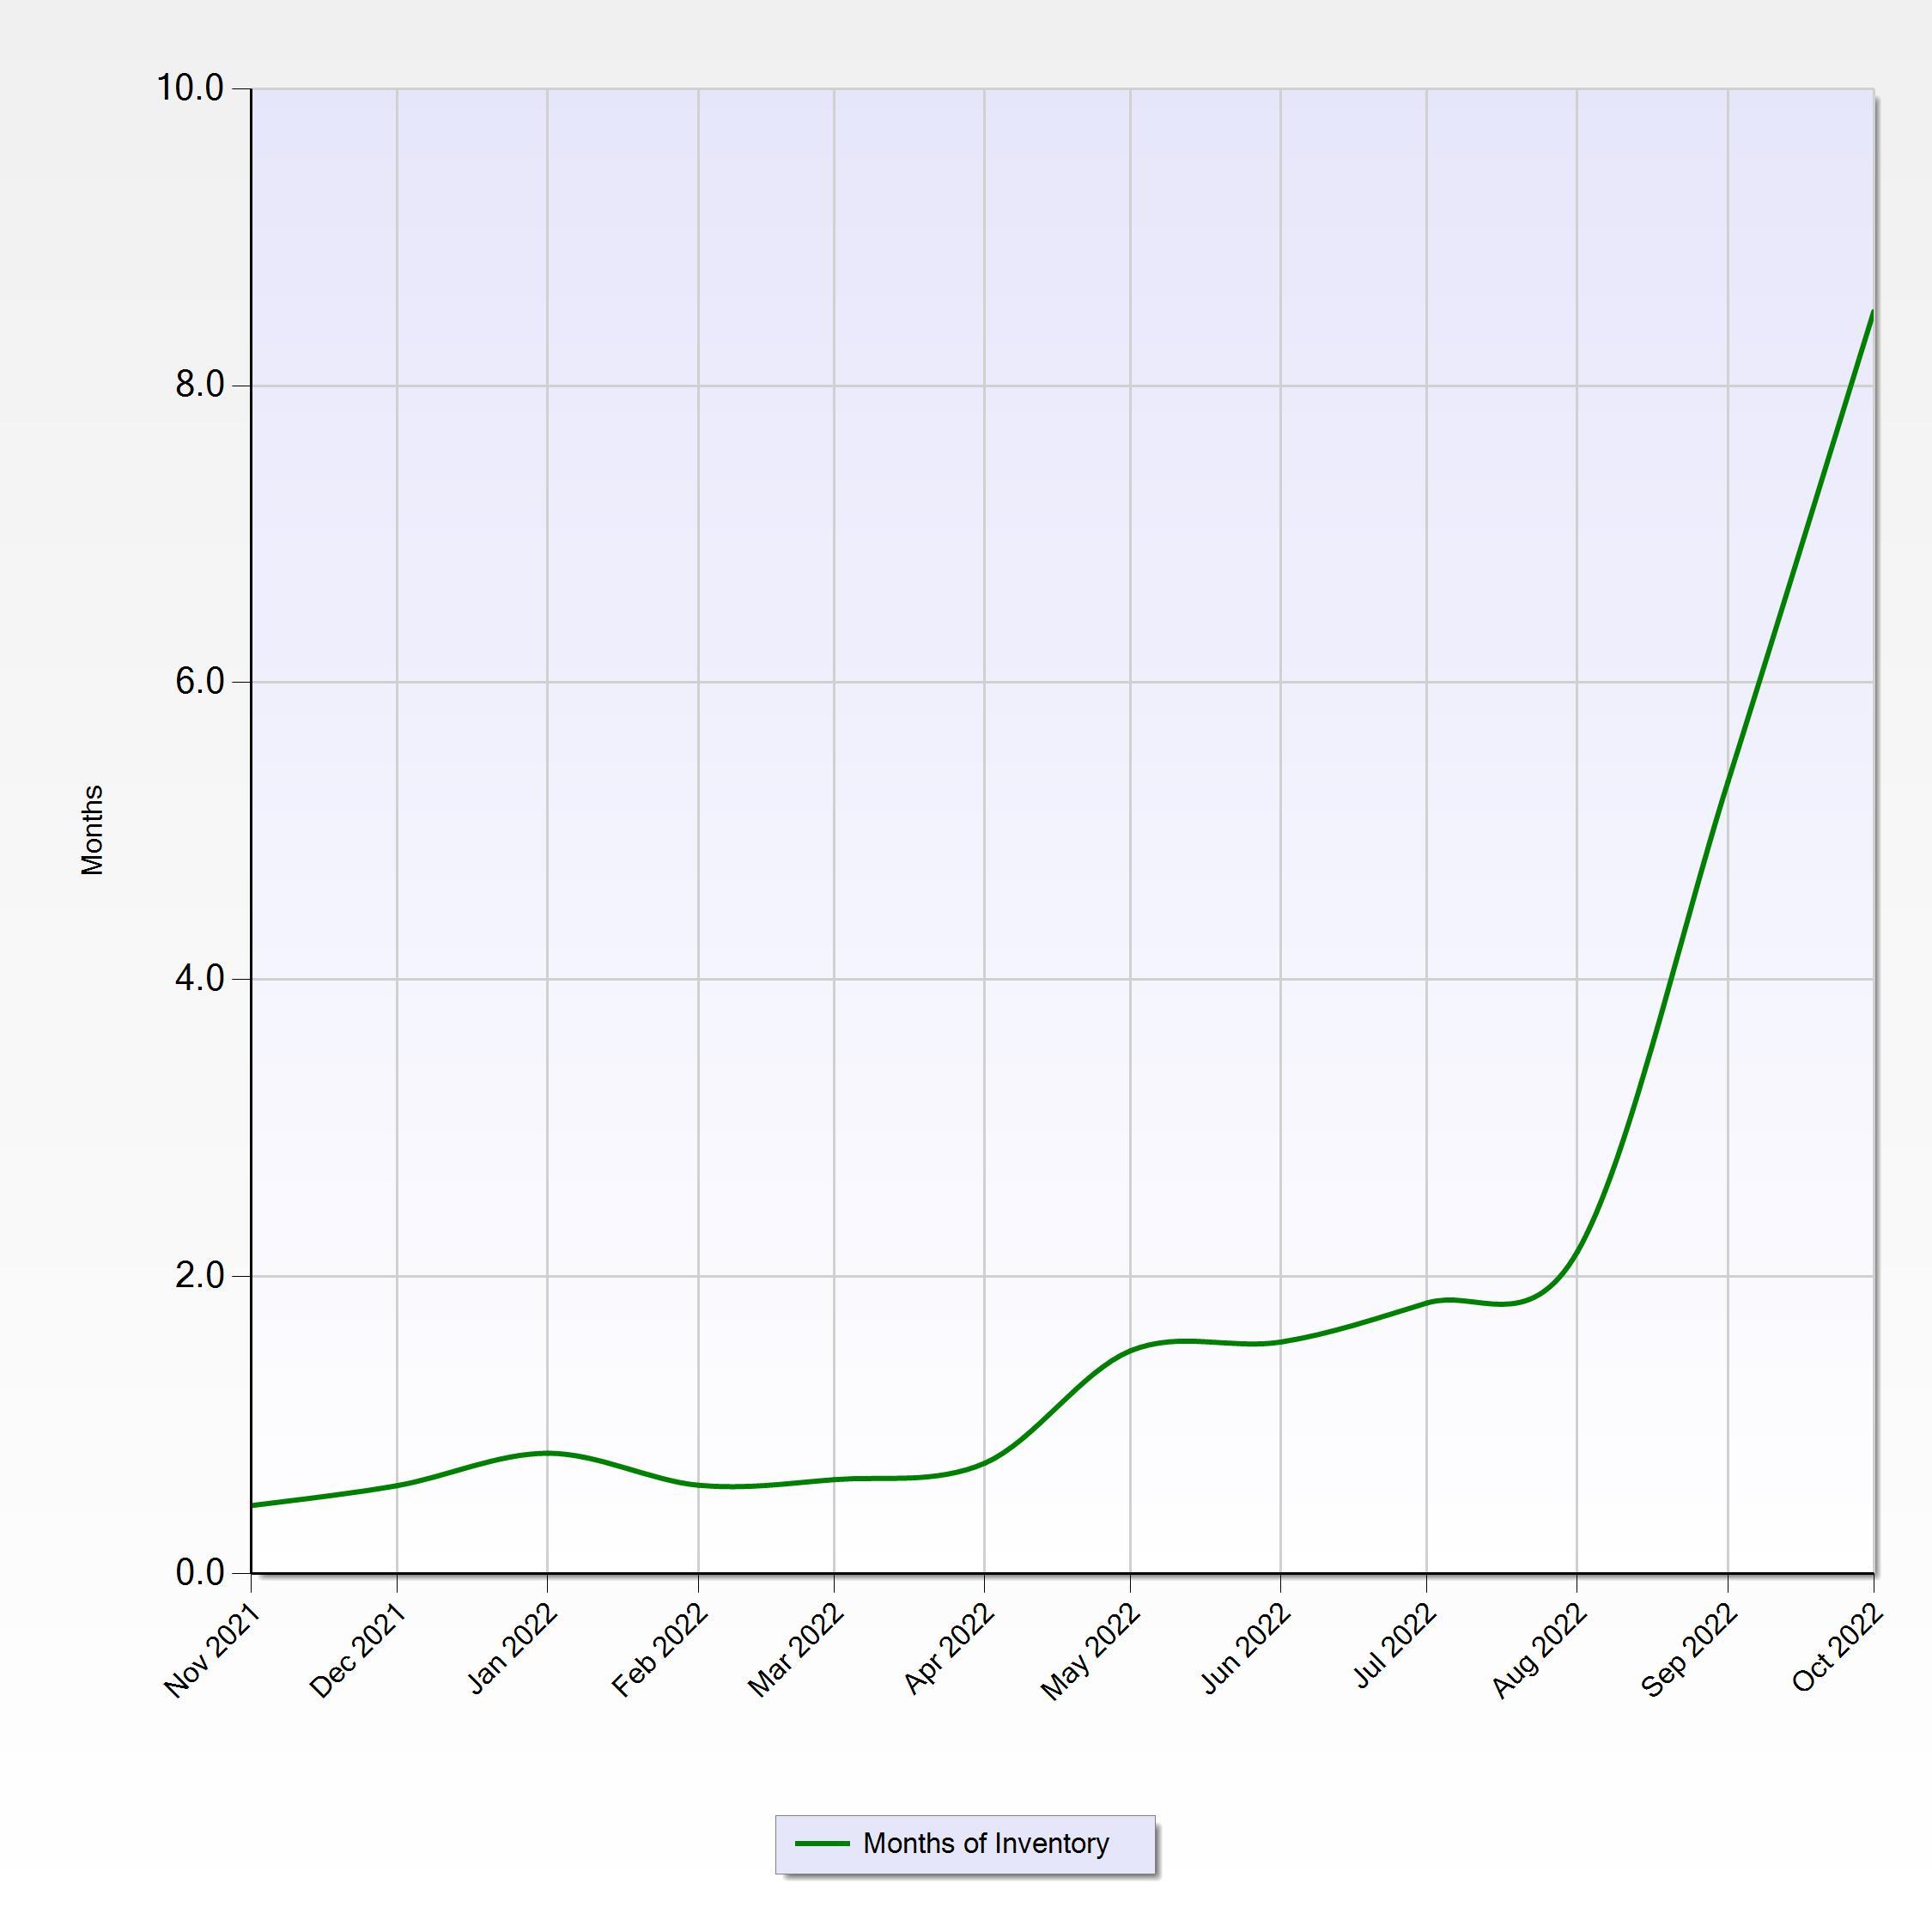
Nov 2021 0.5
Dec 2021 0.6
Jan 2022 0.8 Feb 2022 0.6 Mar 2022 0.6 Apr 2022 0.7 May 2022 1.5 Jun 2022 1.6 Jul 2022 1.8 Aug 2022 2.2 Sep 2022 5.3 Oct 2022 8.5
Time frame is from Nov 2021 to Oct 2022 Region is 'Hamilton' Municipality is 'Dundas (41)' Transaction Type is 'Sale' Results calculated from approximately 500 listings
2https://matrix.rahb.ca/Matrix/Stats/StatsPrint.aspx?c=AAEAAAD**…NoYXJ0LXR5cGUxPSJTcGxpbmUiIGNoYXJ0LXR5cGUyPSJDb2x1bW4iIC8(&t2=
https://matrix.rahb.ca/Matrix/Stats/StatsPrint.aspx?c=AAEAAAD**…GNoYXJ0LXR5cGUxPSJTcGxpbmUiIGNoYXJ0LXR5cGUyPSJDb2x1bW4iIC8(&t2=
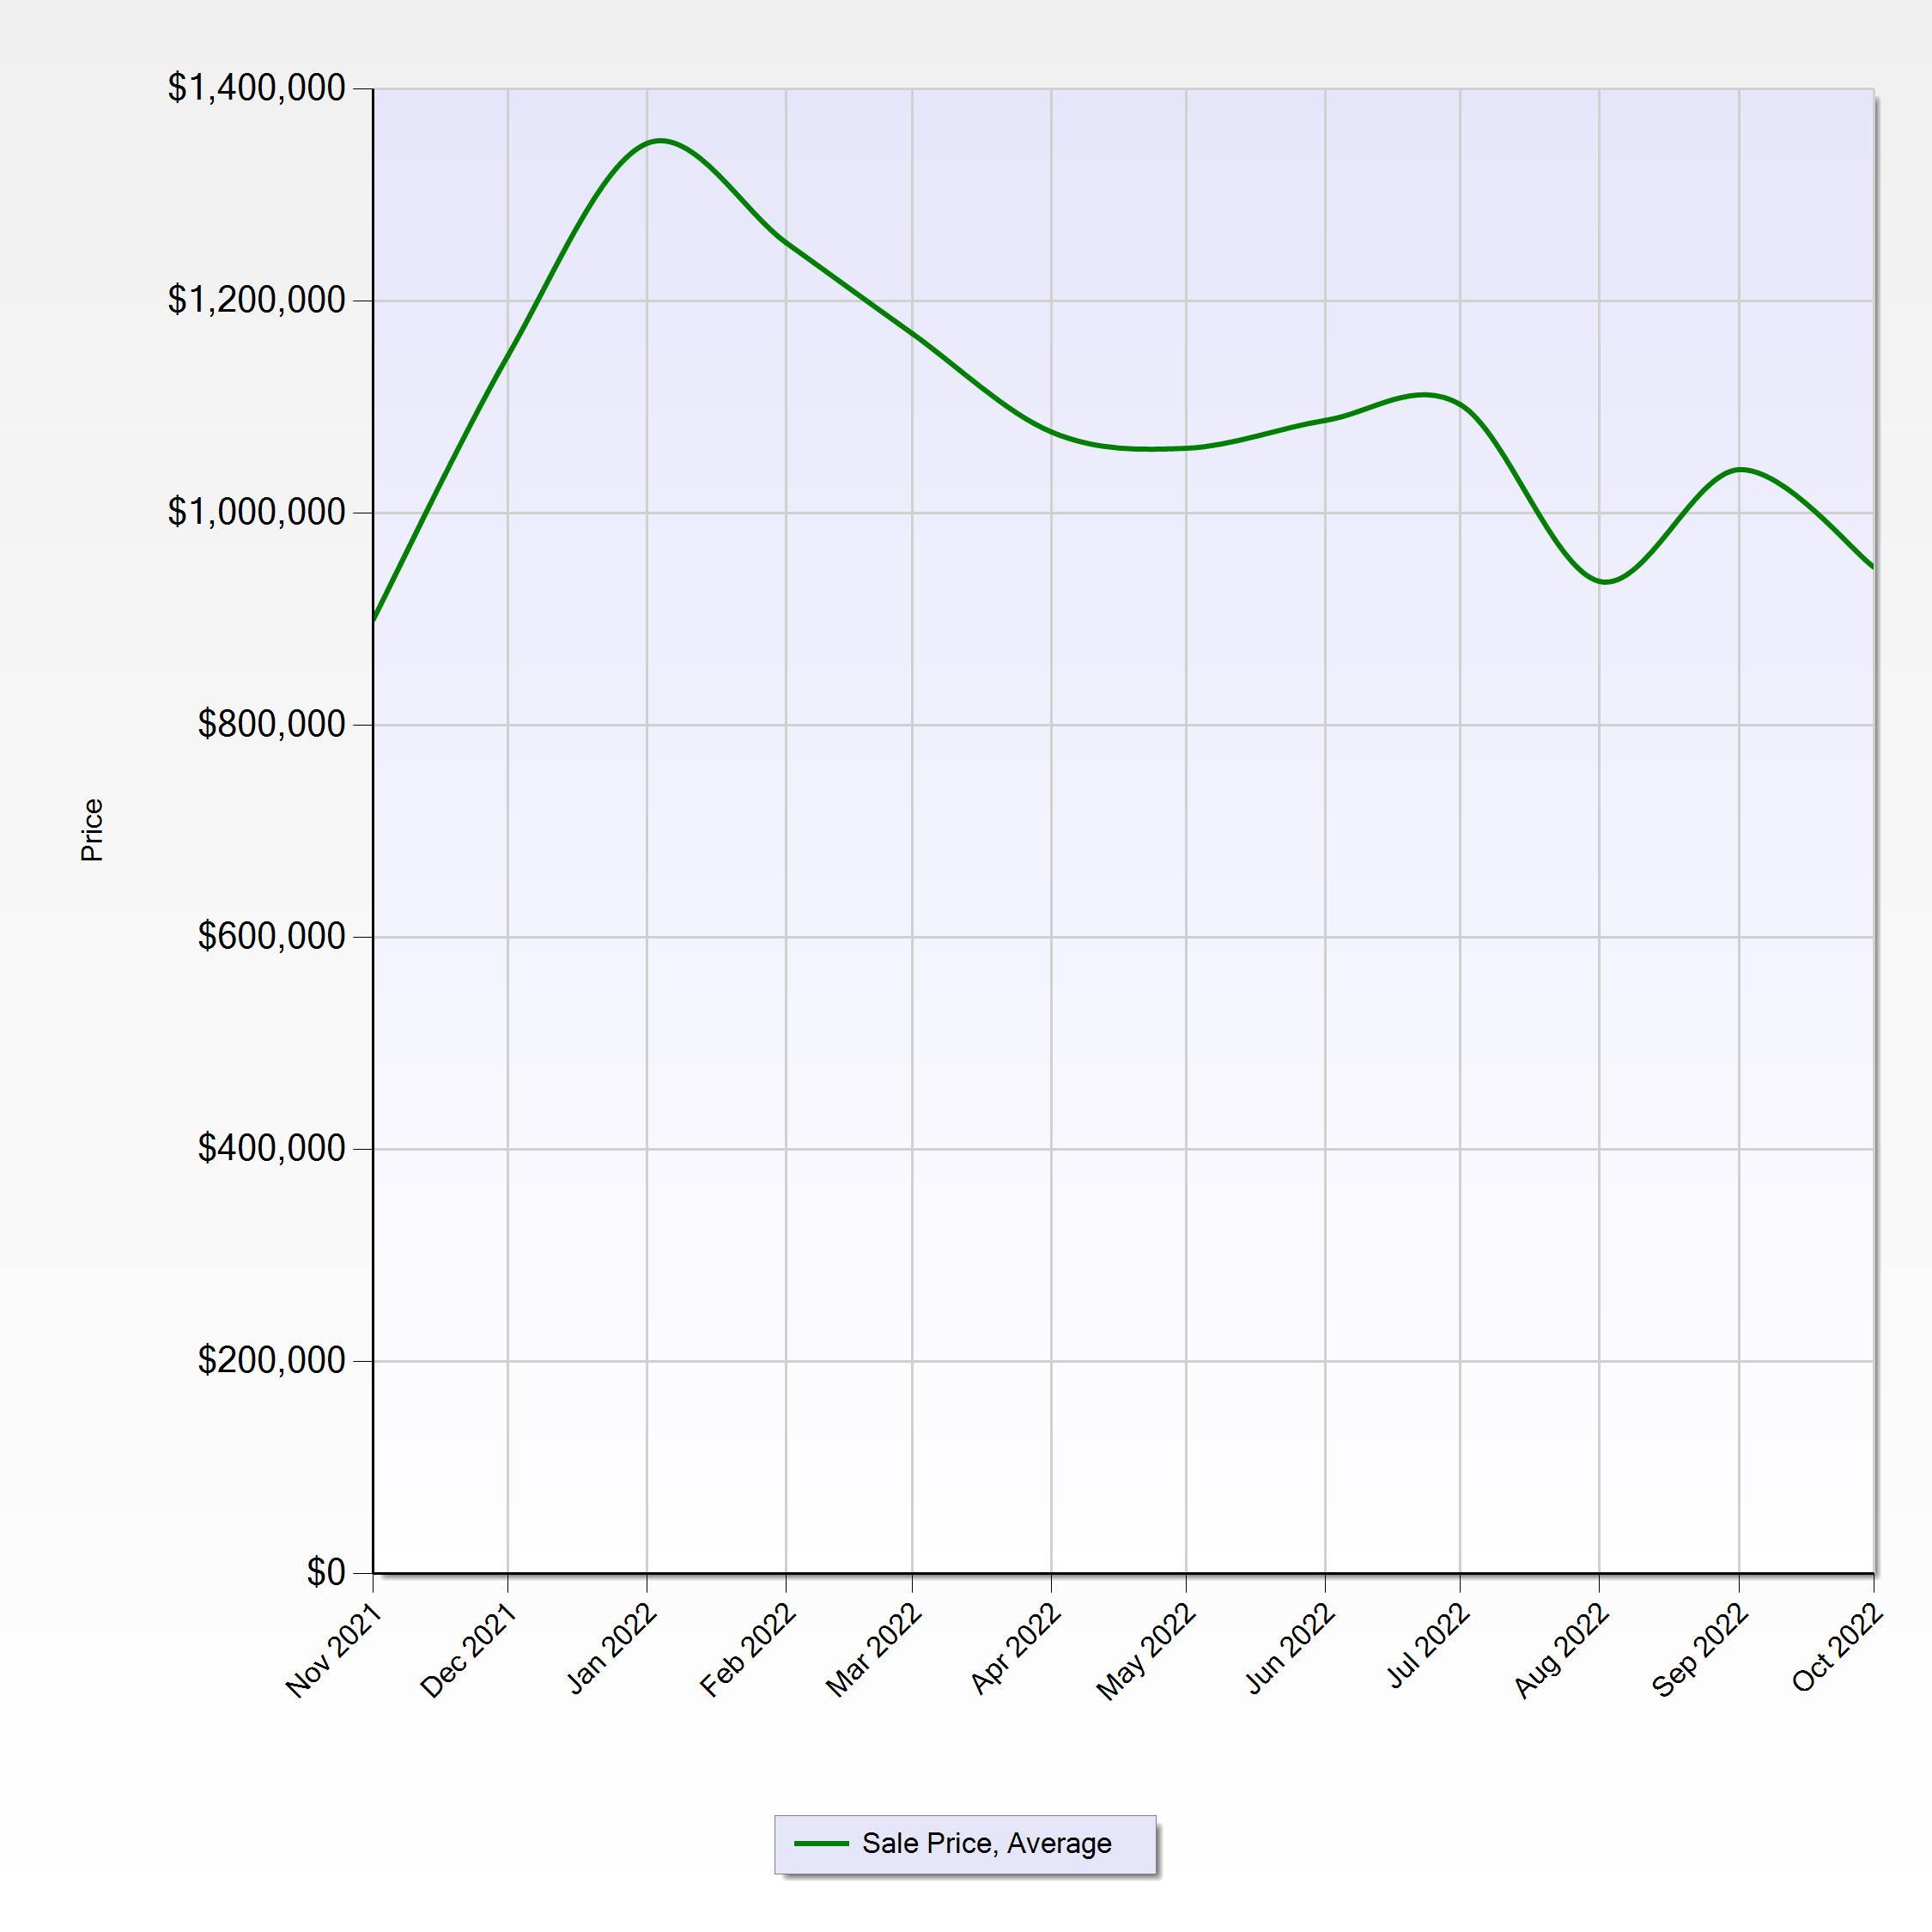
Month Sale Price, Average
Nov 2021 $899,384
Dec 2021 $1,148,382
Jan 2022 $1,348,704
Feb 2022 $1,254,670 Mar 2022 $1,169,316 Apr 2022 $1,076,401 May 2022 $1,061,108 Jun 2022 $1,087,390 Jul 2022 $1,102,232 Aug 2022 $935,468 Sep 2022 $1,040,917 Oct 2022 $949,125
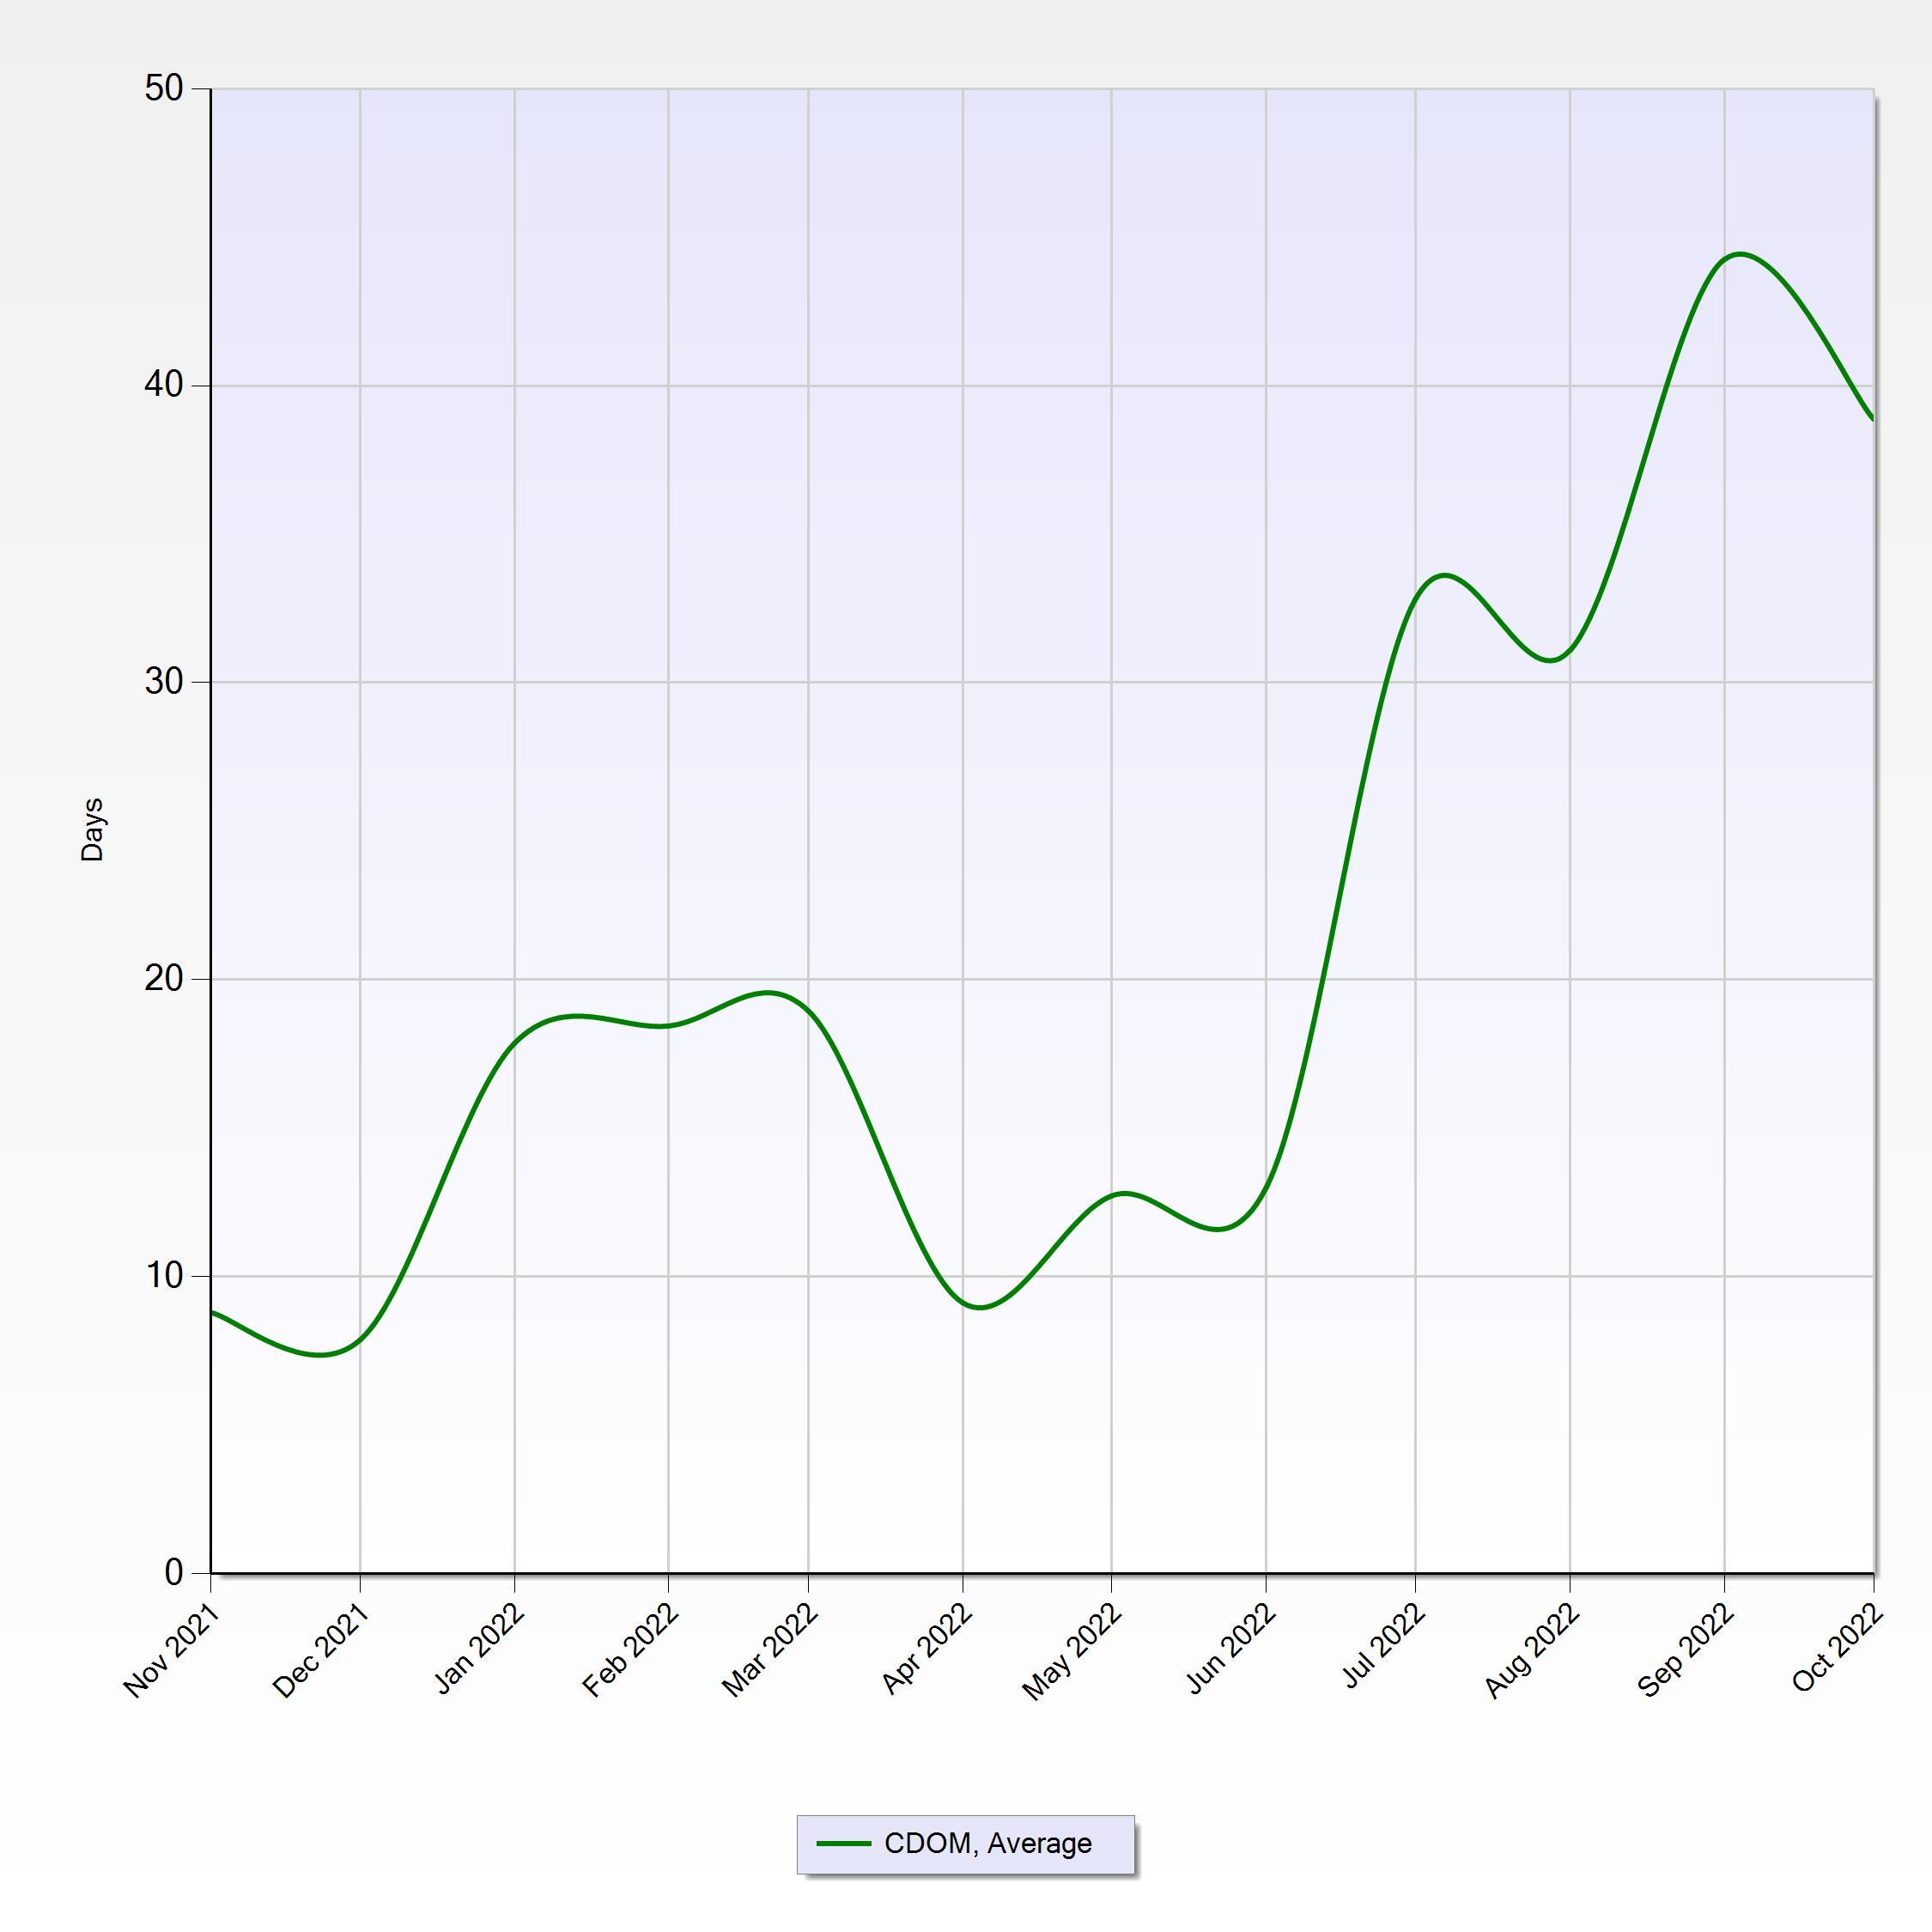
Time frame is from Nov 2021 to Oct 2022 Region is 'Hamilton' Municipality is 'Dundas (41)' Transaction Type is 'Sale' Results calculated from 332 listings
of 2https://matrix.rahb.ca/Matrix/Stats/StatsPrint.aspx?c=AAEAAAD**…NoYXJ0LXR5cGUxPSJTcGxpbmUiIGNoYXJ0LXR5cGUyPSJDb2x1bW4iIC8(&t2=
https://matrix.rahb.ca/Matrix/Stats/StatsPrint.aspx?c=AAEAAAD**…GNoYXJ0LXR5cGUxPSJTcGxpbmUiIGNoYXJ0LXR5cGUyPSJDb2x1bW4iIC8(&t2=
Oct 2022
Time frame is from Nov 2021 to Oct 2022 Region is 'Hamilton' Municipality is 'Dundas (41)' Transaction Type is 'Sale' Results calculated from 332 listings
https://matrix.rahb.ca/Matrix/Stats/StatsPrint.aspx?c=AAEAAAD**…NoYXJ0LXR5cGUxPSJTcGxpbmUiIGNoYXJ0LXR5cGUyPSJDb2x1bW4iIC8(&t2=