In response to your request for an evaluation, as a practicing real estate salesperson I am establishing Market Value for Listing purposes.
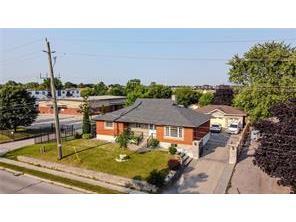
Value is established, for the property at 313 Barton St. E. as of this dated letter.
Date: August 8, 2024
Market Value: $900,000 (+/- 5%)
There are limiting conditions and assumptions connected with this evaluation done by the herein sales representative:
- It is assumed any MLS® data used is reliable and correct
- The client will not circulate or expose information provided herein without prior approval of the writer
- Any update expected must be requested in writing
- If the herein sales representative is required in a court of law, in relation to this evaluation, the court cost will be $350 per hour.
- The condition of the property at time of walkthrough was ‘poor’ as there was significant water damage due to lack of roofing. It is recommended that a engineer report be obtained to determine the structural integrity of the structure.
- The property to be sold in ‘as is – where is’ condition
Please find enclosed some general information about the process of selling real estate. If you have any other questions about preparing your home to ensure that you get the top price the market will bring in, please feel free to contact me. I look forward to helping you with all of your real estate needs and ensuring that you get the best price and terms on the sale of your property!
Sincerely,
Mike Heddle, Hon. B. Comm. Broker Heddle Real Estate | Team Leader
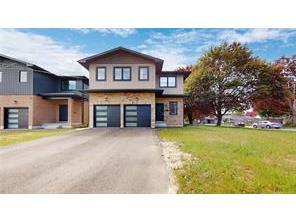
Brief Summary of Comparable Properties
$-171,800 $1,007,200 $1,179,000
Birch St
Listing Price between $699,900 and $1,179,000 Selling Price between $700,000 and $910,000
Beds
882 to 2,714 Square Feet $308.77 to $856.99 per Sold Square Foot Year Built between 1908 and 2024
List Price, Sale Price, and Days on Market
Pricing Recommendation
Setting the right price is critical to a successful sale.
General Facts About Pricing
There are many things we can do to help ensure the successful sale of your home--such as sprucing up its appearance and marketing it aggressively--but the single most important thing is choosing the right price.
The best, most reliable way of choosing the right list price for your home is by comparing it to similar properties in the neighborhood. How much are comparable properties currently listed for? How much did comparable properties recently sell for? How are these properties different than yours? Are prices rising or falling? These questions will guide us to the best possible list price for your home: a price that is as high as possible but low enough to generate interest and lead to a quick sale.
Market Statistics
Prices are adjusted for property differences, rounded to the nearest $100.
After comparing your property to similar properties that are on the market now, that recently sold, and that failed to sell, my analysis suggests a realistic list price for your property of:
by Michael Heddle Royal LePage State Realty
Market Analysis Explanation
An explanation and overview of this market analysis.
This Comparative Market Analysis will help determine the correct list price of your home. Ultimately, the correct list price is the highest possible price the market will bear.
This market analysis is divided into three categories:
1
2
Comparable homes that are currently for sale
3
Comparable homes that were recently sold
Comparable homes that failed to sell
Looking at similar homes currently for sale, we can assess the alternatives available to a serious buyer. We can also be sure we are not underpricing your home.
Looking at similar homes sold in the past few months, we can see a clear picture of how the market has valued homes comparable to yours. Banks and other lending institutions also analyze these sales to determine how much they can lend to qualified buyers.
Looking at similar homes that failed to sell, we can avoid pricing at a level that would not attract buyers.
This Comparative Market Analysis has been carefully prepared by analyzing homes similar to yours. The aim of this market analysis is to achieve the highest sale price for your home in a reasonably short period of time.
APPENDIX A: MPAC Assessment vs. Market Sale Price
APPENDIX A
- MPAC Assessment vs. Market Sale Price
NOTE: * denotes properties included in the "Direct Comparison Approach".
However, this method of deriving value is only presented as an alternative analytical tool to provide the Seller with additional "actual" statistical information regarding the subject property. Furthermore, it is noted that this method of deriving value is not as accurate as traditional valuation methods such as the "Direct Comparison Approach to Value" and the "Cost Approach to Value". The information contained herein is provided for analytical purposes only and Royal LePage State Realty, Brokerage makes NO representations and/or warranties regarding the accuracy of this information and the relationship between this information and true market value.
APPENDIX B: Cost Approach to Value
APPENDIX B - COST APPROACH TO VALUE
estimate square footage
The cost approach value has a minimal value in terms of deriving market value since the Land Value is a difficult value to derive based on comparable available market values in the area. Thus, this method of deriving value is only presented for the purpose of an alternative analytical tool used inorder to provide "actual" statistical information regarding the subject property. Furthermore, it is noted that this method of deriving value is not an accuarate representation of "market" value and the "Direct Comparison Approach to Value" illustrates a more accurate representation of value. The information contained herein is provided for analytical purposes only and Royal LePage State Realty, Brokerage makes NO representations and/or warranties regarding the accuracy of this information and the relationship between this information and true market value.
These lot boundaries may have been adjusted to fit within the overall parcel fabric and should only be considered to be estimates.
Assessment Information
Enhanced Site & Structure
Report Date: 2024-08-08
Sales History
Sale Date Sale Amount Type Notes
Jan 24, 2018 $374,000 Transfer
Jun 26, 2014 $234,000 Transfer
Jun 27, 2008 $187,000 Transfer
Sep 29, 2006 $172,000 Transfer
Apr 29, 1980 $2 Transfer
Demographics
MICHAEL HEDDLE (78672)
MICHAEL HEDDLE (78672)
MICHAEL HEDDLE (78672)
Dominant Market Group
MICHAEL HEDDLE (78672)
MICHAEL HEDDLE (78672)
Dominant Market Group
MICHAEL HEDDLE (78672)
Area Heat Maps
Average Sales Heat Maps - Last 1 Year
The Average Sales Heat Map shows the average sale price of properties within the subject property's block compared to surrounding blocks.
MICHAEL HEDDLE
Growth Rate Heat Maps - Last 5 Years
The Growth Rate Heat Map shows the growth of the average sale price of properties within the subject property's block compared to surrounding blocks.
Market Turnover Heat Maps - Last 1 Year
The Market Turnover Heat Map shows the percentage of properties that have sold in the past year within the subject property's block compared to surrounding blocks.
Historical Market Trends
Average Sale Values and Growth Rates
Market Turnover Rates
MICHAEL HEDDLE
Market Statistics
Area Map
5 Year Analysis
Up and Coming - This area has proven more affordable than many areas of the municipality, and has seen property prices grow 26.1% higher than the average municipal growth. Worth investigating for investment potential.
Average Sales Price - Last 1 Year
$678,254 $750,951
Block Municipality
Growth Rate - Last 5 Years
Market Turnover - Last 1 Year
Terms and Conditions
Reports Not the Official Record. Reports, other than the Parcel Register, obtained through Geowarehouse are not the official government record and will not necessarily reflect the current status of interests in land.
Data contained in the Geowarehouse reports are not
Currency of Information. maintained real-time. Data contained in reports, other than the Parcel Register, may be out of date ten business days or more from data contained in POLARIS.
Data, information and other products and services accessed through the Land Coverage. Registry Information Services are limited to land registry offices in the areas identified on the coverage map.
Completeness of the Sales History Report.
Some Sales History Reports may be incomplete due to the amount of data collected during POLARIS title automation. Subject properties may also show nominal consideration or sales price (e.g. $2) in cases such as transfers between spouses or in tax exempt transfers.
Demographic Information is obtained from Environics
Demographic Information. Analytics. Environics Analytics acquires and distributes Statistics Canada files in accordance with the Government of Canada's Open Data Policy. No information on any individual or household was made a vailable to Environics Analytics by Statistics Canada. PRIZM and selected PRIZMC2 nicknames are registered trademarks of The Nielsen Company (U.S.) and are used with permission.
The Property Information Services, reports and information are provided "as is" and your use is subject to the applicable Legal Terms and Conditions. Some information obtained from the Land Registry Information Services is not the official government record and will not reflect the current status of interests in land. Use of personal information contained herein shall relate directly to the purpose for which the data appears in land registry records and is subject to all applicable privacy legislation in respect of personal information. Such information shall not be used for marketing to a named individual.
Parcel Mapping shown on the site was compiled using plans and documents recorded in the Land Registry System and has been prepared for property indexing purposes only. It is not a Plan of Survey. For actual dimensions of property boundaries, see recorded plans and documents.