3 minute read
Chapter 14: Visual representations of data


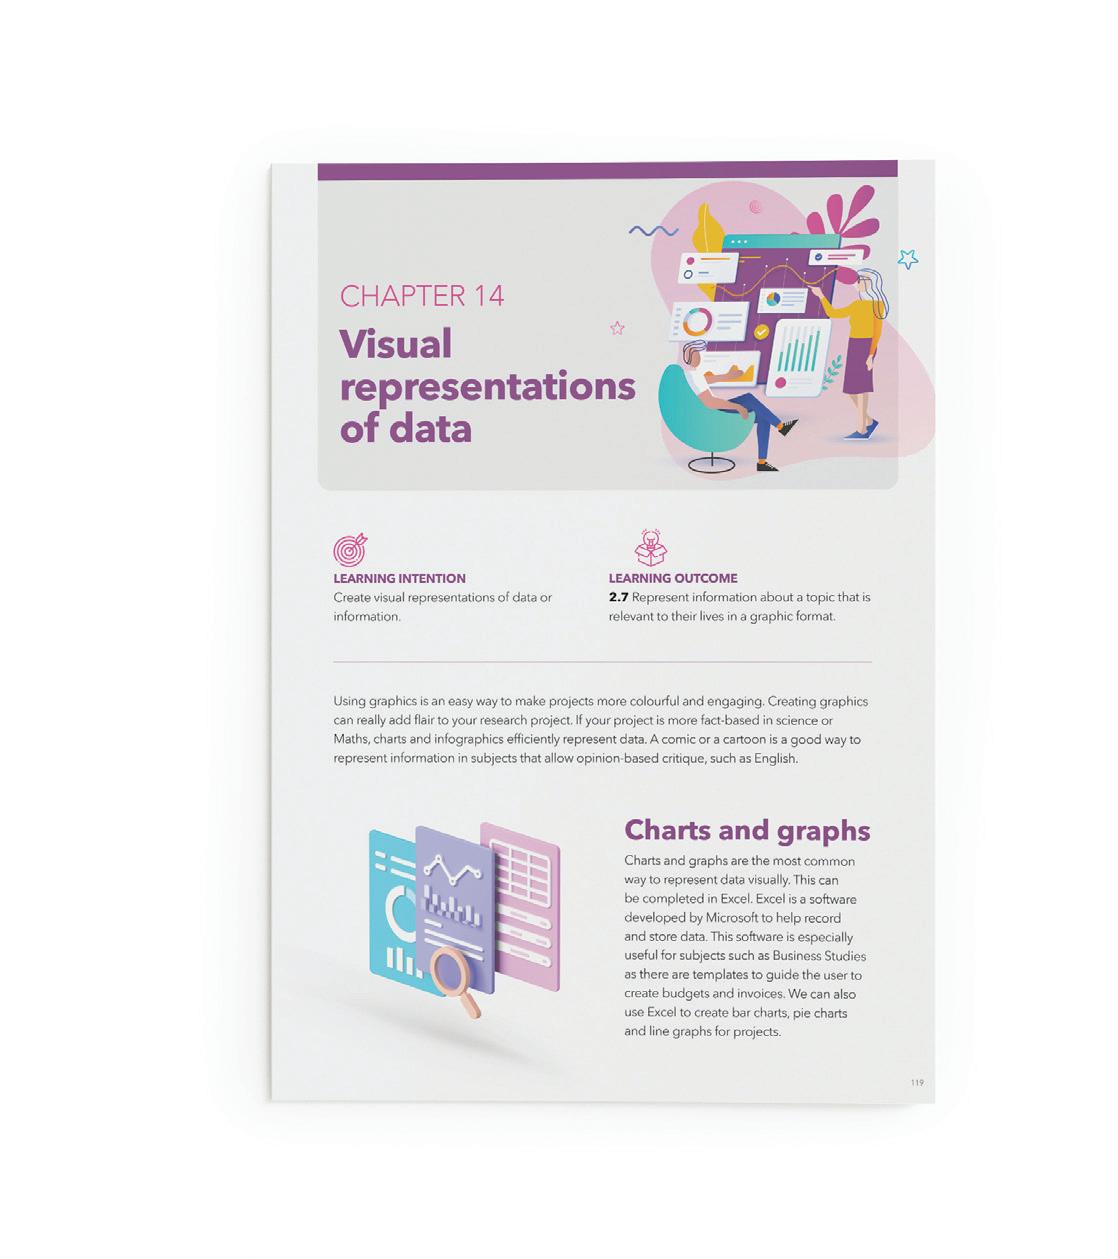
CHAPTER 14
Visual representations of data
LEARNING INTENTION
Create visual representations of data or information.
LEARNING OUTCOME
2.7 Represent information about a topic that is relevant to the students’ live in a graphic format.
CHAPTER OVERVIEW
Graphics are an easy way to make projects more colourful and engaging. Creating graphics can really add flair to your research project. If your project is more fact based in subjects such as Science or Maths, charts and infographics are an efficient way to represent data. In subjects that allow opinionbased critique, such as in English, a comic or a cartoon is a good way to represent information.
SAMPLE
MATERIALS
Digital devices with internet access eLearning platform: Microsoft Teams, Google Classroom Microsoft Word Microsoft Excel Canva.com Adobe Spark
ACTIVE LEARNING METHODOLOGIES
Reflection journal
PRACTICAL SKILLS
Infographics Excel: bar chart, PIE chart, line graph, timetable Comic strips
OBJECTIVES
By the end of this chapter students will be able to:
Define
Infographics Smart Art
Describe What graphics are used for The characteristics of different graphic types
Explain How graphics are created Why representing data visually is effective
Design Create Infographic using Adobe Spark or Canva.com Comic strip using StoryBoardThat.com PIE chart Line chart Bar chart Timetable SmartArt SAMPLE
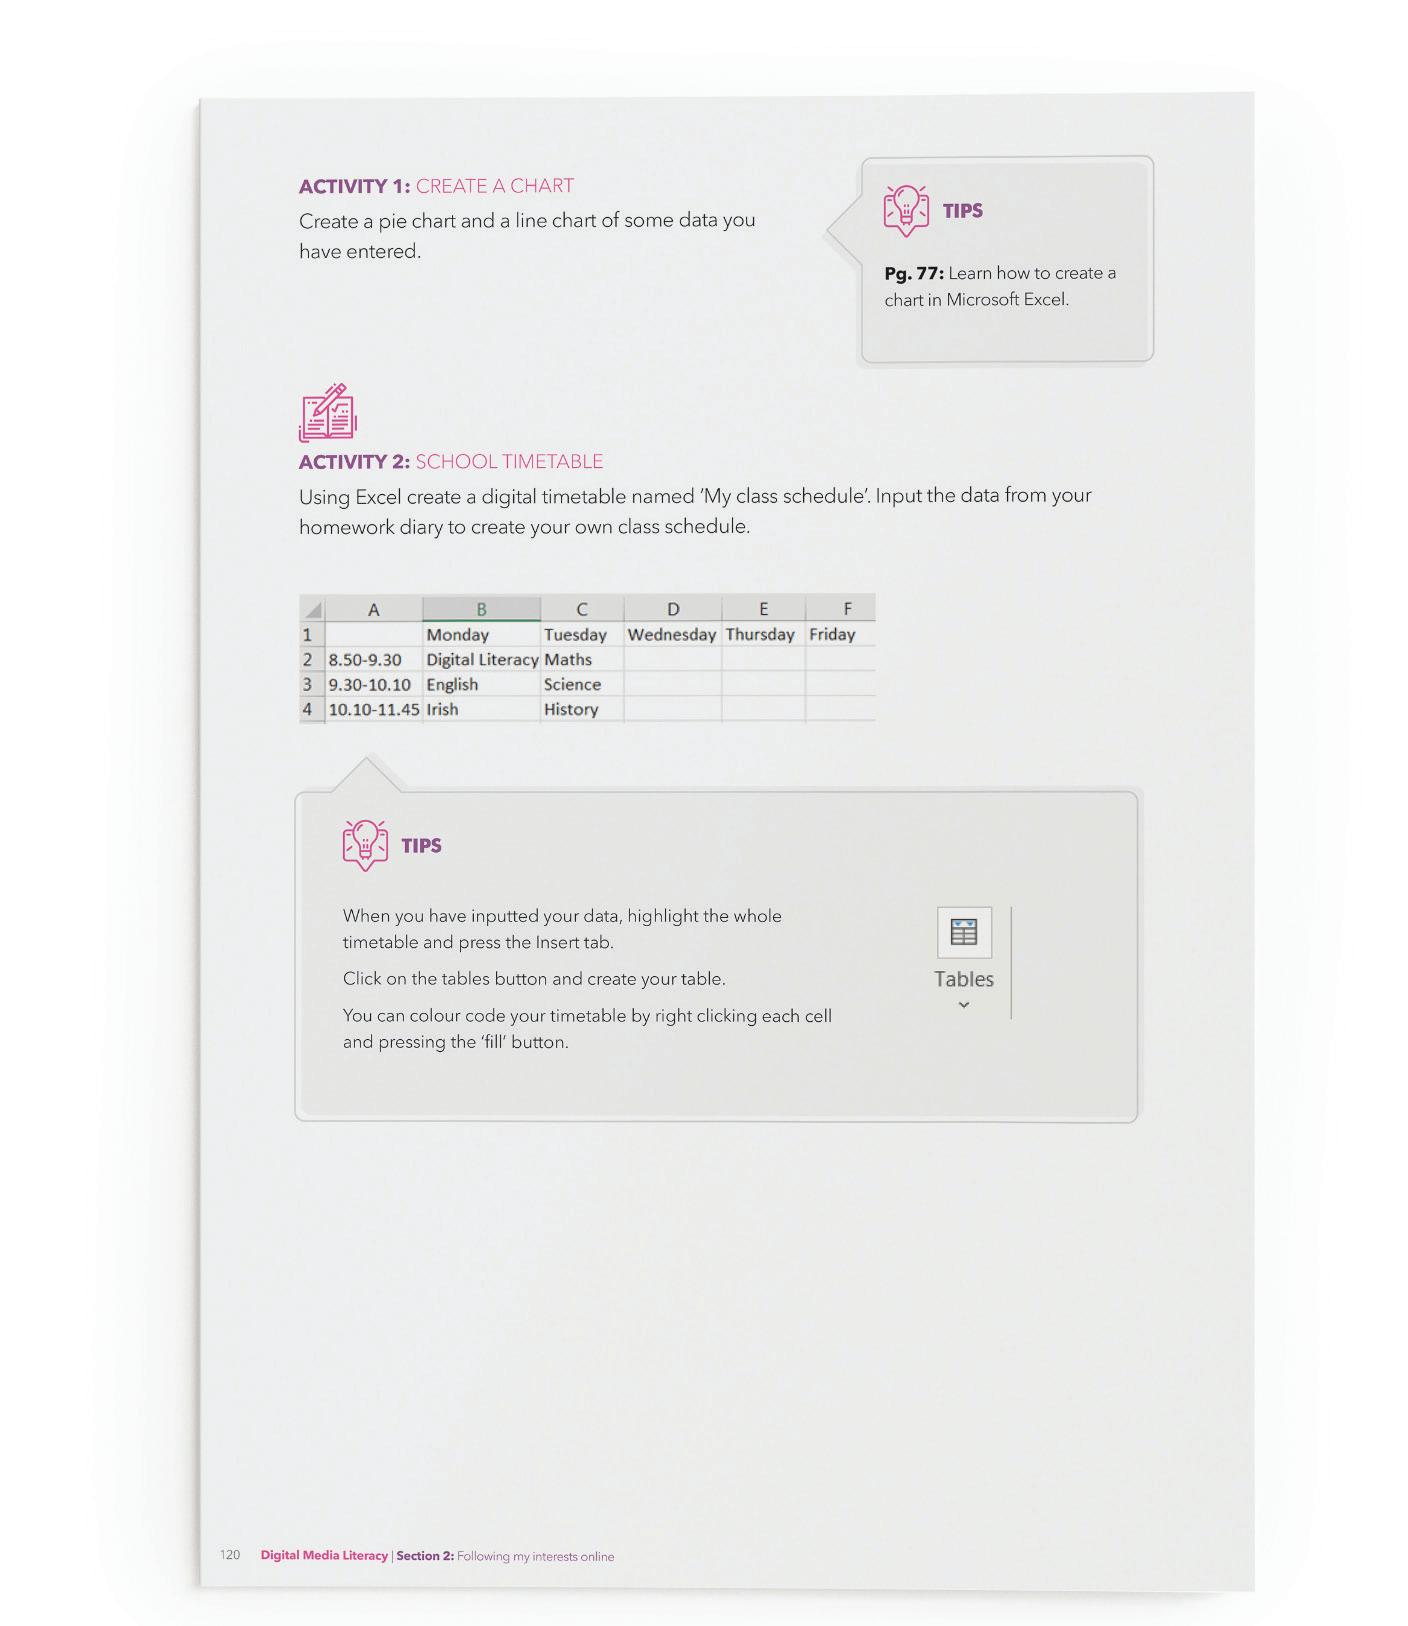
ACTIVITY 1: CREATE A CHART Student will create a PIE chart and a line chart of some data you have entered.
ACTIVITY 2: SCHOOL TIMETABLE Using Excel students will create a digital timetable entitled ‘My class schedule’. They will input the data from their homework diary to create their own class schedule.
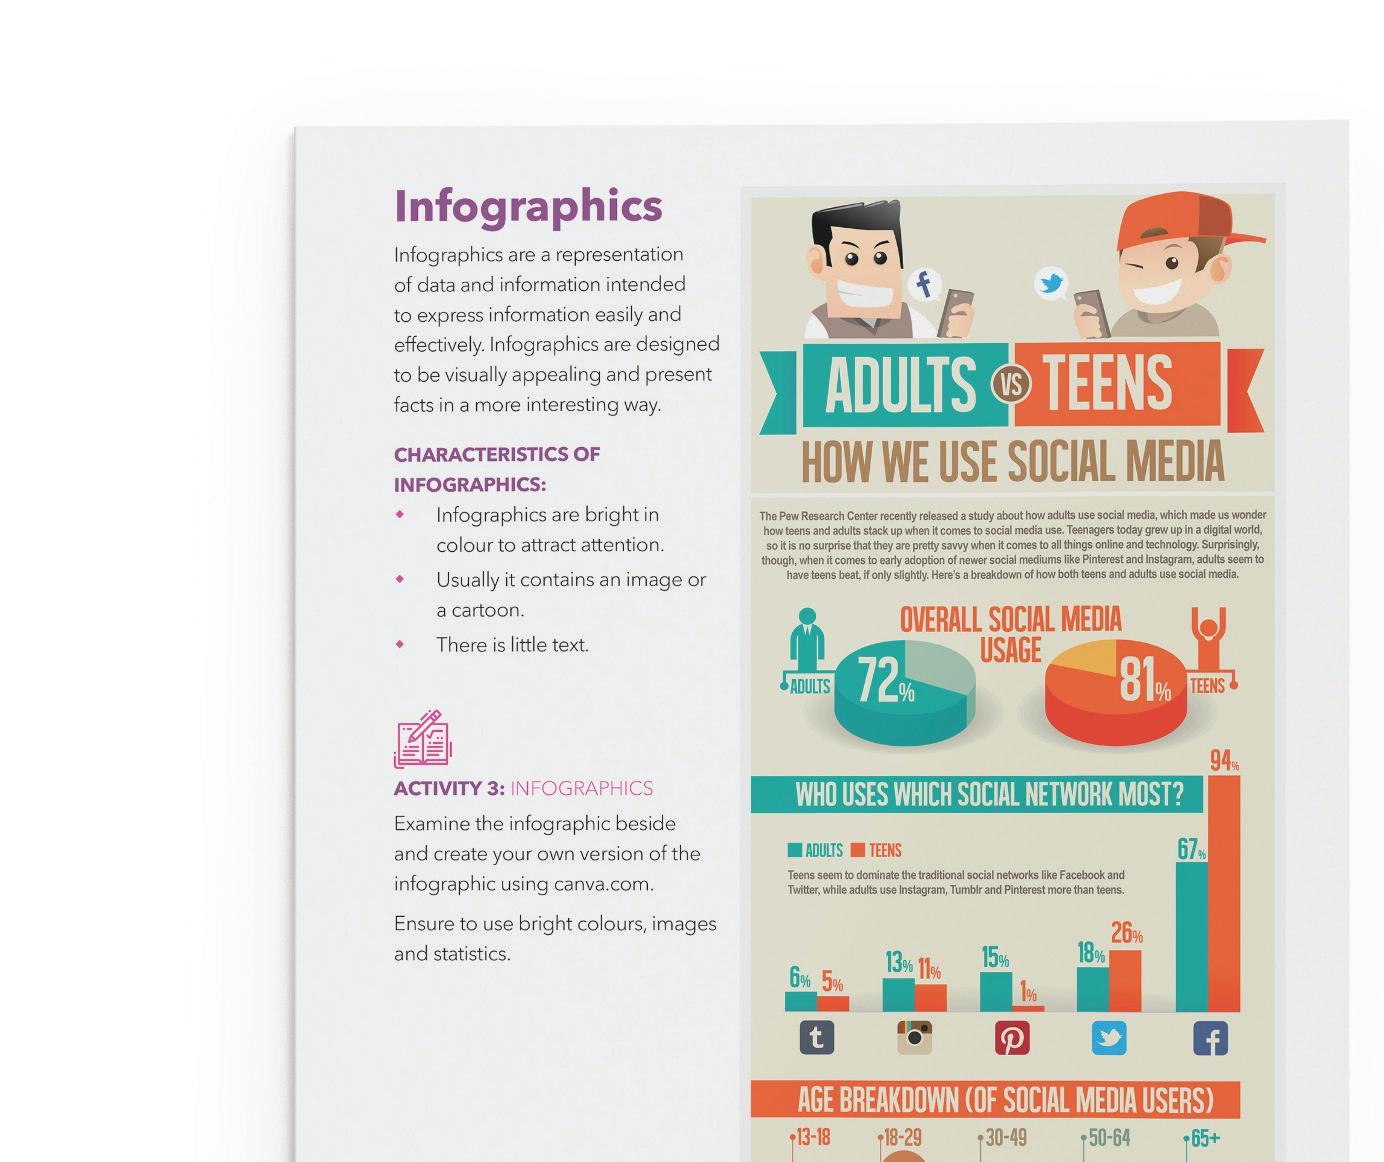
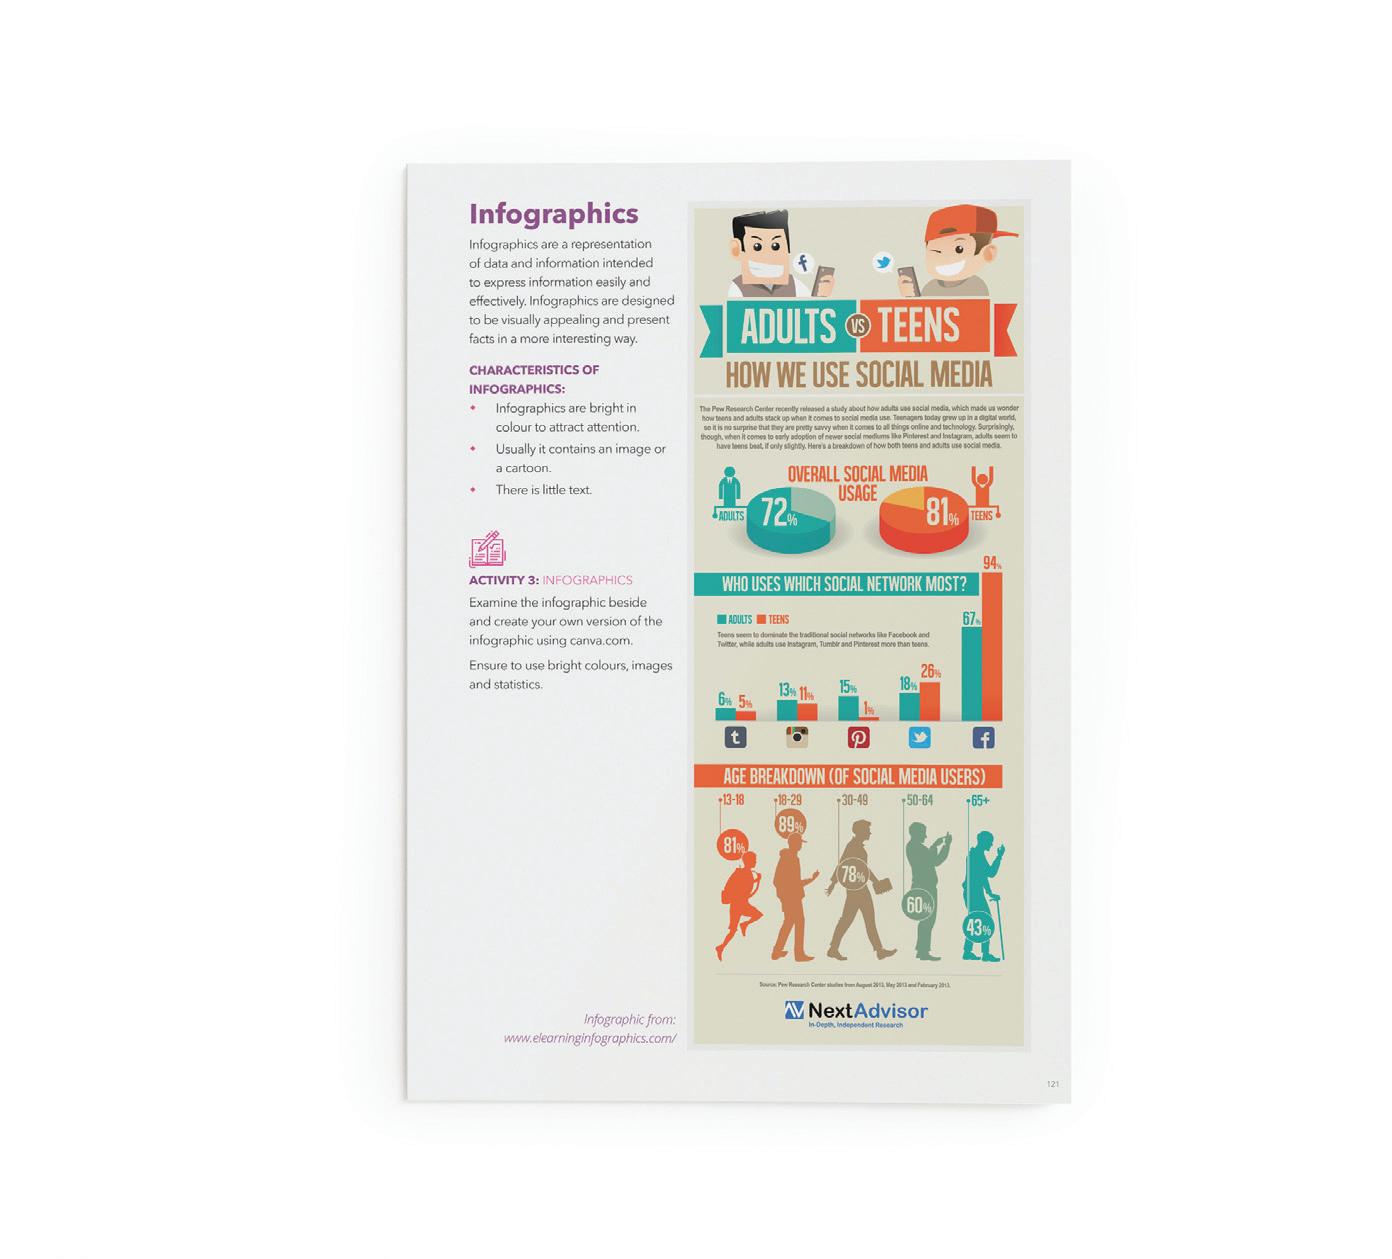
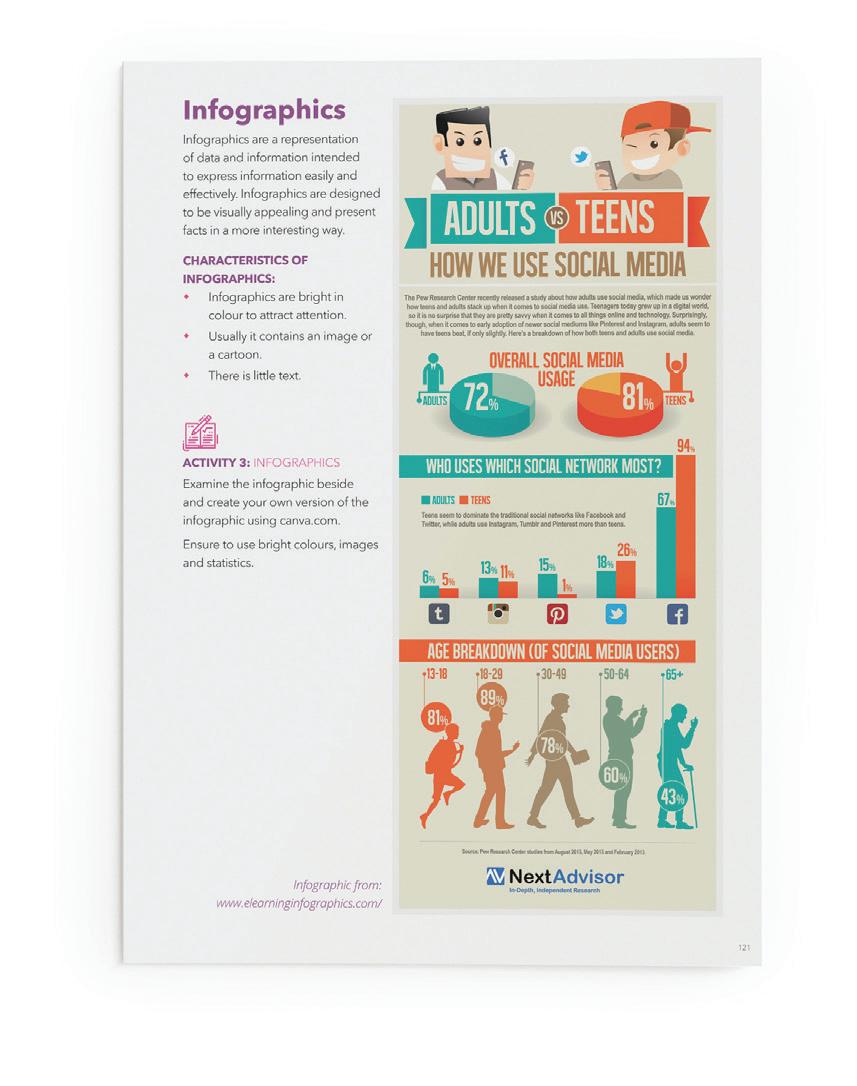
ACTIVITY 3: INFOGRAPHICS Students will examine the infographic and create their own version of the infographic using canva.com. Ensure they use bright colours, images and statistics. SAMPLE
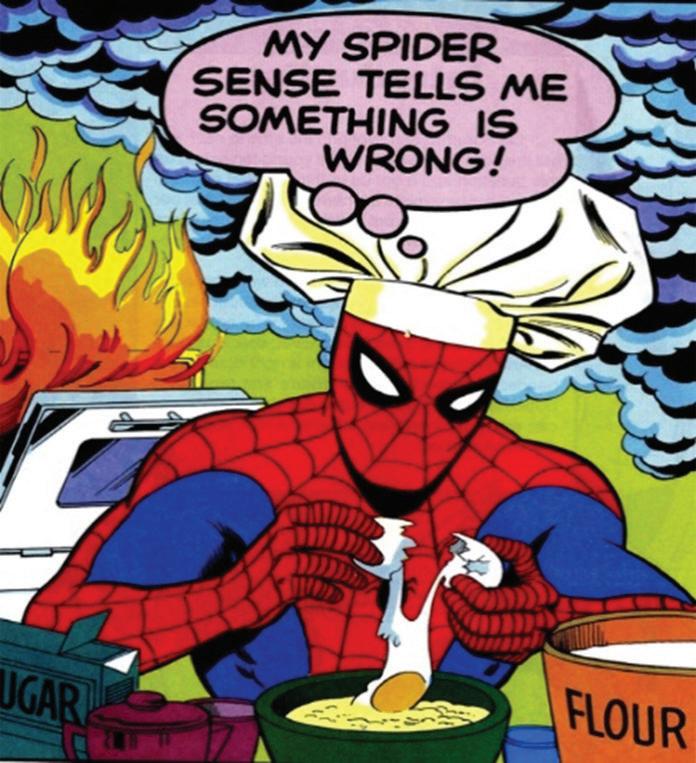
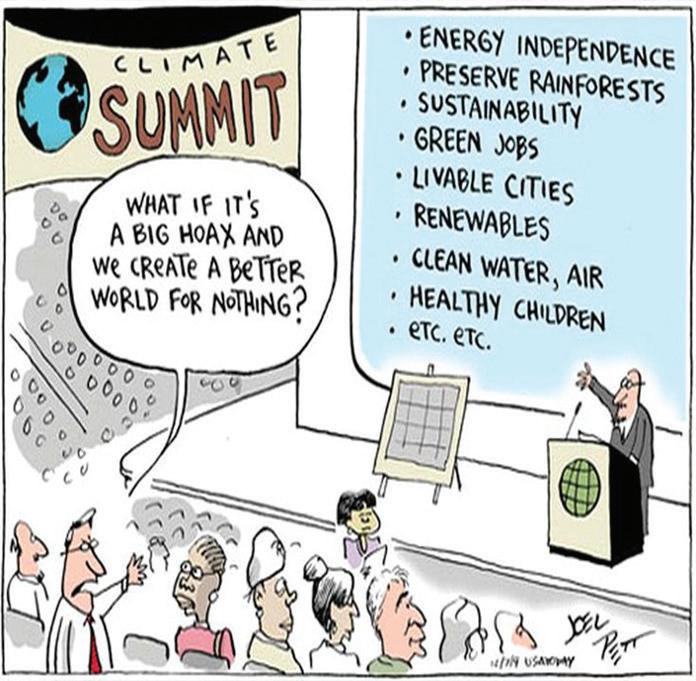
ACTIVITY 4: ANALYSIS In pairs, students will look at the cartoons beside and discuss the questions below.
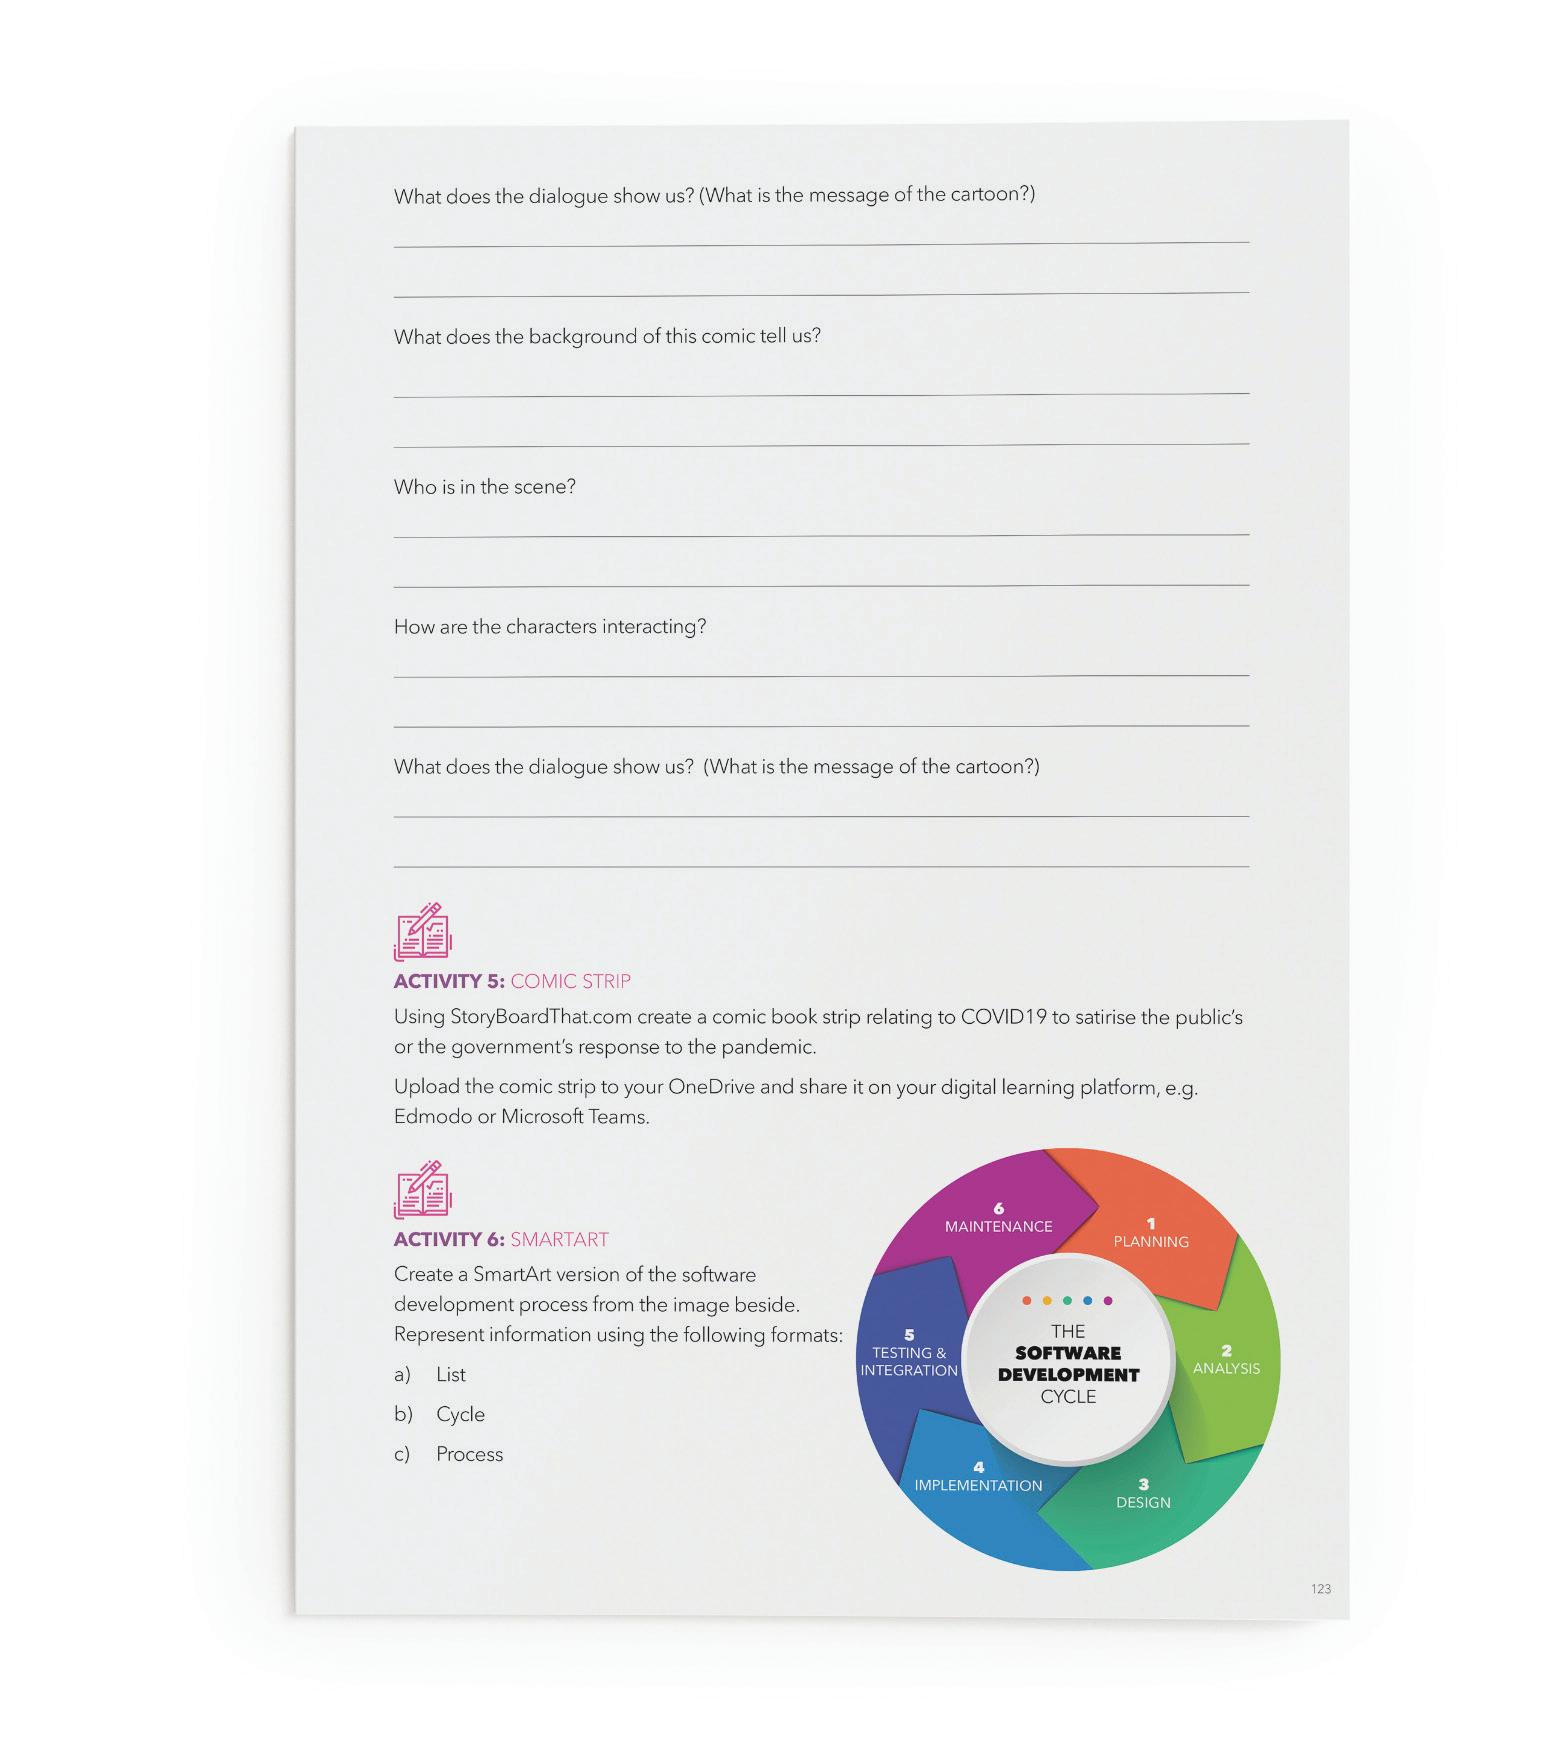
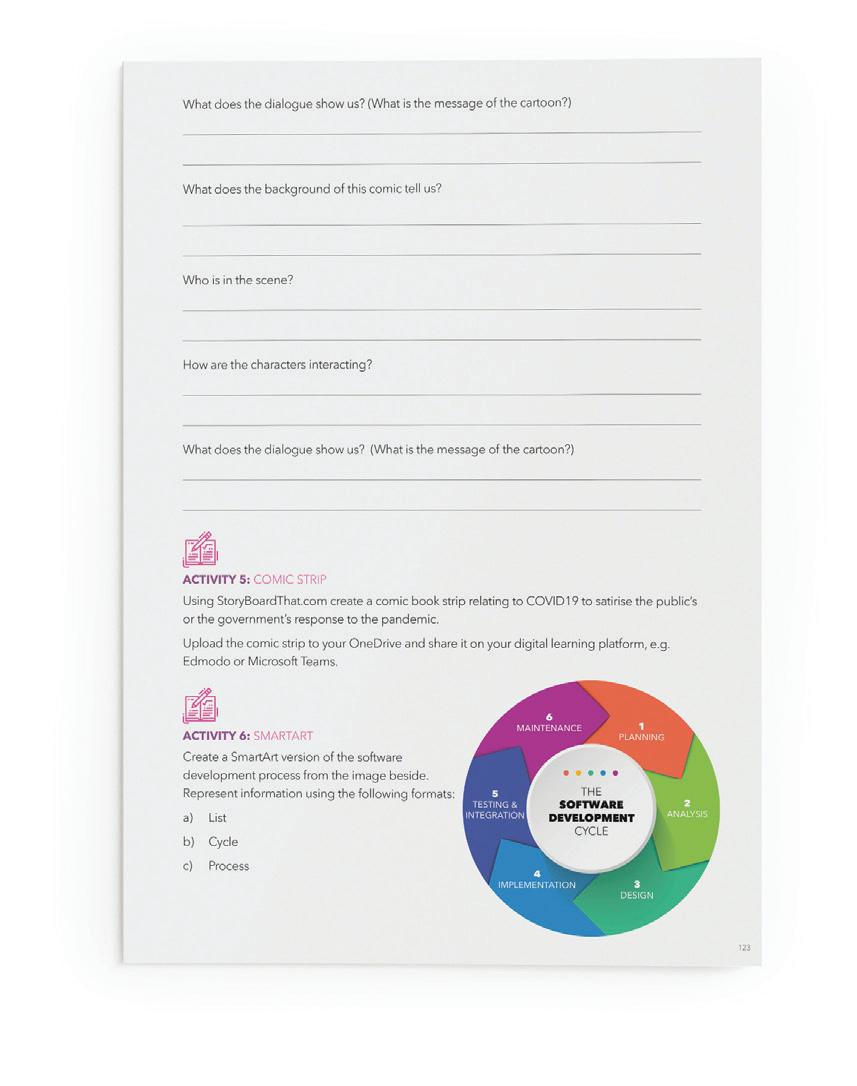
What does the background of this comic tell us? Who is in the scene? How is the character interacting with the scene? What does the dialogue show us? (What is the message of the cartoon?) What does the background of this comic tell us? Who is in the scene? How are the characters interacting? What does the dialogue tell us? (What is the message of the cartoon?)
ACTIVITY 5: COMIC STRIP Using StoryBoardThat.com, students will create a comic book strip relating to COVID19 to satirise the public’s or the government’s response to the pandemic. They will upload the comic strip to their OneDrive and share it on your digital learning platform, e.g. Edmodo or Microsoft Teams.
ACTIVITY 6: SMARTART Students will create a SmartArt version of the software development process from the image on the right here.
PAUSE & REFLECT In your reflection journal describe: SAMPLE Three things you learned in this section Two things you already knew One thing you would like to learn more about
SAMPLE

SECTION 3
SAMPLE