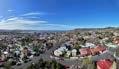
2025 Hobart Neighbourhood Greenways Study Climate Action & Transport Choice with
Safe, Accessible, Active Routes
Acknowledgement of Country
In recognition of the deep history and culture of nipaluna (Hobart), we acknowledge the palawa (Tasmanian Aboriginal people), their elders past and present as the Traditional Custodians of the skies, land, and waterways of lutruwita (Tasmania). We recognise that palawa have made journeys across lutruwita and nipaluna for many thousands of years. We acknowledge the determination and resilience of the palawa people who have survived invasion and dispossession and continue to maintain their identity, culture, and rights.
We also acknowledge all Aboriginal and Torres Strait Islander people who live on the country of the palawa, here in nipaluna (Hobart), lutruwita Tasmania.

Advance goals of climate action & transport choice
Climate Ready Hobart Strategy:
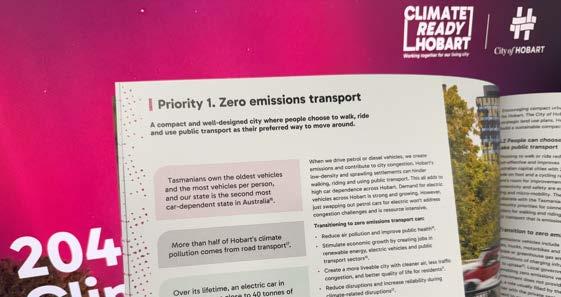
Goal 1. Zero emissions Hobart
“The Hobart community will achieve at least a 70% reduction in emissions across Hobart by 2030 (from a 2020 baseline) and zero emissions by 2040.”
Priority 1. Zero emissions transport
“Extend the cycling and walking network and prioritise connected, safe, and green corridors, guided by the Hobart Transport Strategy 2024.”
Hobart Transport Strategy:
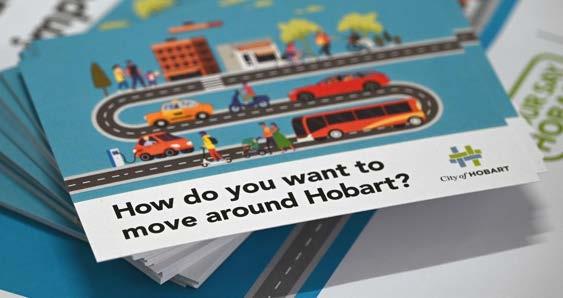
Choice in how we move
“Increasing the use of bike riding and micromobility as a mode of transport will support a healthy, sustainable, equitable, and inclusive city. More trips by bike will assist in reducing congestion on our roads and in turn support our climate change goals: reducing the transport sector’s carbon emissions.”
Build upon Hobart’s strategies and plans
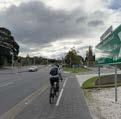
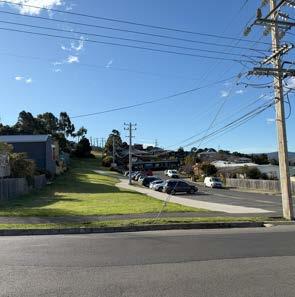
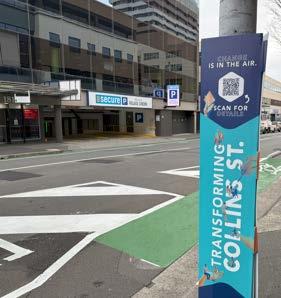
Since Gehl diagnosed an “incoherent cycling environment” in Hobart’s CBD that is “only for the brave,” the City of Hobart has made great progress in building out its Principal Bicycle Network, most recently with the Collins Street Transformation, Argyle and Campbell Street bike lanes, and hard-fought speed limit reductions. Now Hobart must invest in its finer grain network to connect people from where they live to local destinations— where small investments can drive the greatest impact. Therefore, the Neighbourhood Greenways Study synthesizes and furthers the cycling dimension of existing City documents:


Align with bike planning efforts beyond Hobart


Cycling is a key ingredient to shape a dense, liveable, and wellconnected capital city region. According to the 2023 Greater Hobart Household Travel Survey, two out of three trips within Hobart are less than five kilometers, yet 53% of these short trips are made by car. This study expands on the consensus established by the Greater Hobart Cycling Plan, which developed a framework to promote active transport. Now, the Neighbourhood Greenways Study coordinates with
and ongoing transport and climate


A cohesive system of routes meet the diverse needs of all cyclists
Tasmanian Cycling Scheme
The route hierarchy offers cycling street typologies that bring Hobart’s bike infrastructure into alignment with the Tasmanian Cycling Network Planning Guide, while composing a system of routes that is uniquely suited to Hobart’s urban fabric.
E-Rideable Routes are considered overlays, streets that have slopes steeper than 10% within any of the four route classes. These short and steep segments provide more direct links for people with e-rideable micromobility devices, such as e-bikes and e-scooters, or a desire to ride up steep hills.
All Ages & Abilities Cycling Network Route Classification
Primary Routes
Directness:
Secondary Routes
Directness:
Neighbourhood Routes
Directness:
Recreational Routes
Directness:
Capacity:
Capacity:
Capacity:
Capacity:
Function:
Connect to activity centers & regional destinations
Form: Off-road paths Protected bike lanes
Example: Intercity Cycleway
Function:
Connect to primary routes & city attractors
Form: Protected bike lanes Riding streets
Example: Forster & Giblin Streets
Function:
Connect to higher order routes & local destinations
Form: Riding streets Calm streets
Example: Fitzroy Place
Function:
Connect to scenic destinations & leisure experiences
Form: Calm streets Off-road paths/trails
Example: Clarence Foreshore Trail
Sources: Draft Tasmanian Cycling Network Planning Guide (2025)
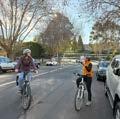
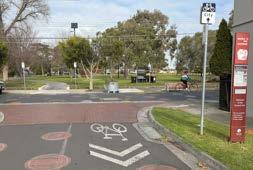
Prioritise people by reimagining streets as a neighbourhood greenway
Tactical Design Toolkit
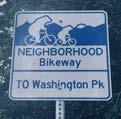
What are Neighbourhood Greenways?
• Existing, quiet, slow residential streets
• Routes that prioritise people of all ages and abilities cycling, rolling, and walking
• Safe links between neighbourhoods, schools, parks, and local businesses
A toolkit of tactical interventions, including wayfinding elements, safer crossings, green infrastructure, and traffic calming devices, can transform a designated neighbourhood route into a Neighbourhood Greenway.
While this study proposes Neighbourhood Greenways as the first step of the City of Hobart Bike Plan, what benefits cyclists also tends to improve conditions for pedestrians. Neighbourhood Greenways enable choice in how people cycle and walk, offering calmer routes to and from homes. Hence, Neighbourhood Greenways are not only for those who choose to cycle, they are about safer, accessible, active streets for all.
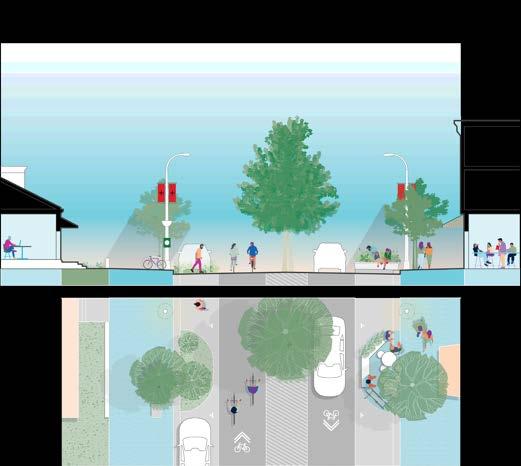
Parking Lane Footpath
Residential Yard Rain Gutter Sharrow Car Lane Median
Wayfinding Elements Safer Crossings Green Infrastructure Traffic Calming
Shifting short driving trips to cycling reduces Hobart's car dependency and CO2 emissions. On average, a cycling or micromobility trip saves 32–194× more CO2 emissions compared to a driving trip. Keeping Hobart Moving aims to increase Greater Hobart’s share of public transport trips to 10% by 2030, and double the number of people cycling, wheeling, and walking by 2033. With a much greater share of people using active transport than other Australian capital cities, Hobart must aim to exceed these targets, thereby preserving Tasmania’s cleanest air in the world.
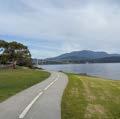
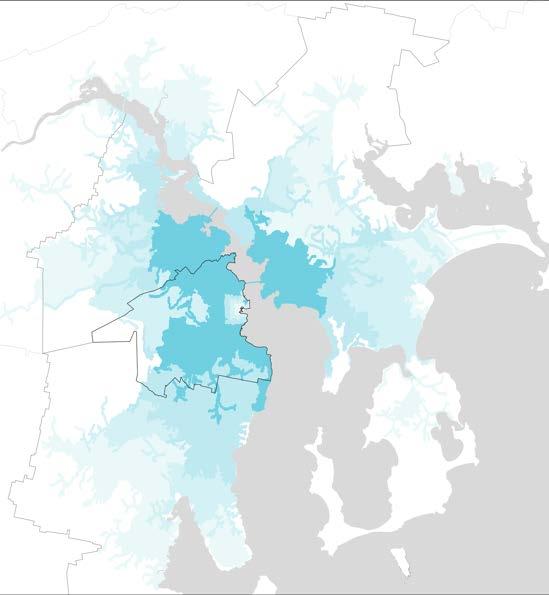
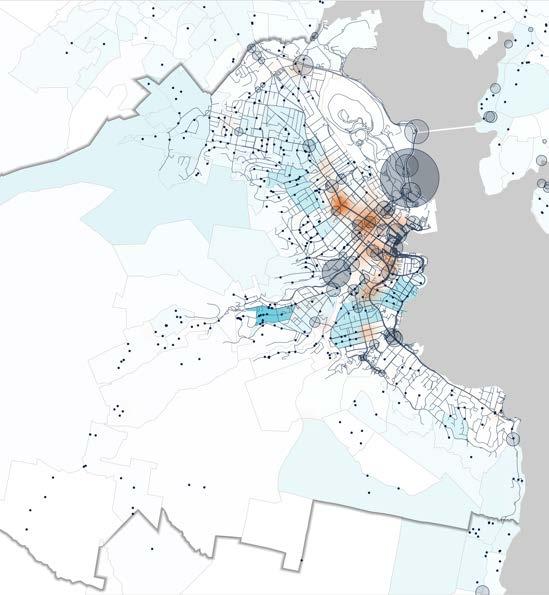
Bikeable streets serve the people of Greater Hobart
Regional Bikeshed Analysis
83% of Hobart,*
60% of Glenorchy, 44% of Clarence, & 6% of Kingborough
live within a bikeable distance of the CBD.
* (17% of Hobart lives within a walkable distance)
65% of Hobart workers commute from outside the City each day.
Bikeshed Distance and Suitable Mode
Sources: ABS Census (2021), Esri 0–0.5 km
Hobart
Orielton
Midway Point
Howrah Moonah
Taroona
Blackmans
Longley
Margate
Snug
Clifton Beach
Sandford
Lauderdale
Dodges Ferry
Sandy Bay Seven Mile Beach
Bellerive
Lindisfarne
Claremont Collinsvale
Sorell Glenorchy
Bikeability Analyses
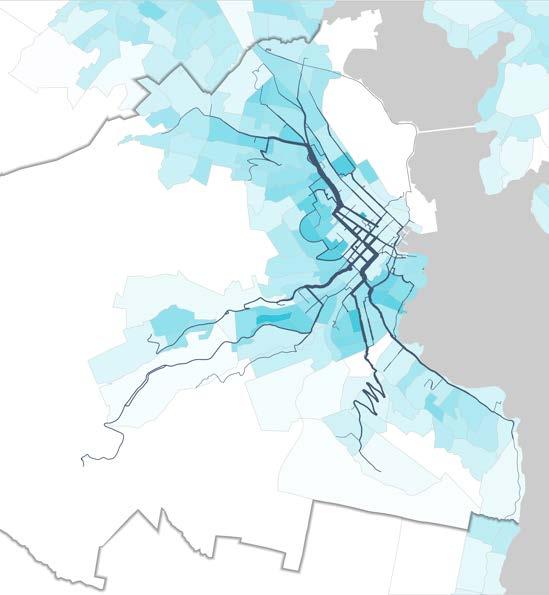
Source: Strava Metro Heatmap
Where are people currently cycling?
Bike Ridership Analysis
The Greater Hobart Household Travel Survey (2023) found only 31% of trips less than 5km are made by active transport, indicating many driving trips could be replaced by cycling trips if neighbourhood connections improve.
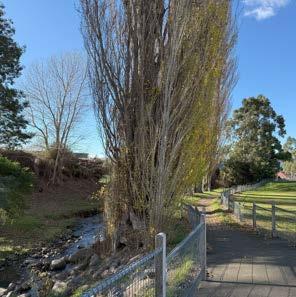
South Hobart resident cycle-to-work rates grew from 2% to 7% in 20 years (2001–21), thanks to investments in the Hobart Rivulet Track, which are expected to further increase in the 2026 Census due to new Collins Street bike lanes connecting to the CBD.
Hobart sees 900 micromobility trips each day, yielding 3 trips each day per 1,000 people, compared to 14 trips in Greater Melbourne.
Bike Ridership Indicators: Synthesizing Historic Data
Constant Daily Bike Counts (2025 avg)
Super Tuesday Bike Counts (2010–25 avg)
Bicycle Network Members
Bike Crashes (2020–24)
E-Scooter & E-Bike Trip Density (2021–25)
Bike Commuter Density (2011, 2016, 2021 avg)
Sources: ABS Census, City of Hobart, Bicycle Network, Ride Report, Esri
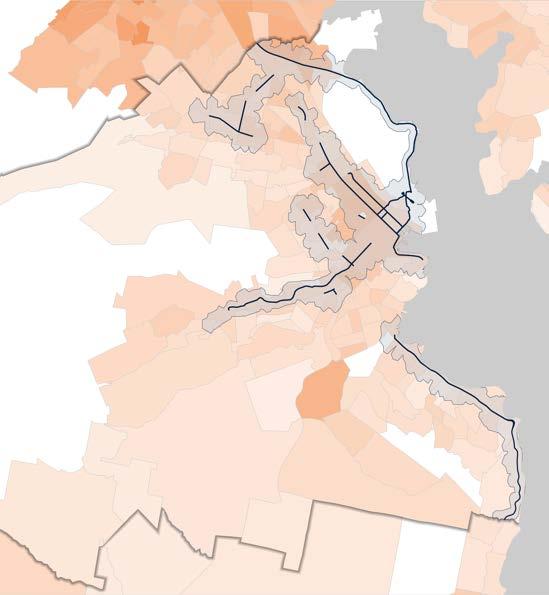
Where are streets best for cycling?
Suitability Analysis
83% of Hobart’s 373km street network has bike-friendly slopes under 10%, comfortable for cycling, while steeper streets serve as e-rideable routes.
+16% canopy cover of road assets would meet Hobart’s 40% target by 2046, a new progress metric for Hobart’s Urban Tree Strategy where Neighbourhood Greenways can drive urban heat mitigation.
Bike Suitability Indicators: Safety & Comfort
Street Slope (flat to steep, >10% )
Street Class (slow to fast)
Street Tree Planting Priority (high to low, <40%)
Sources: City of
Taroona
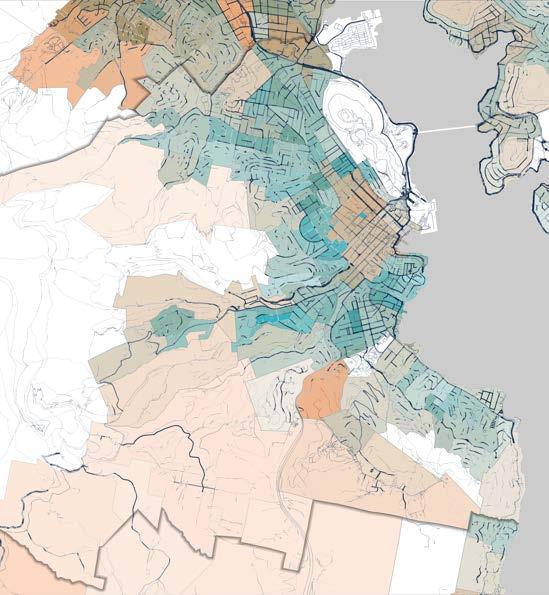
Where are people likely to shift from a car to cycling?
Bike Propensity Analysis
55% of Hobart lives in high propensity areas for ridership growth (75th+ percentile), even though only 3% of Hobart cycled to work on Census Day in 2021.
Bike Propensity Indicators: Journeys & Demographics
Potential Cycling Trips (most efficient routes)
Potential Cyclist Index (density, equal weight)
5–19)


Low Car Ownership (0–1 per Household)


Sources: ABS Census (2021), Bicycle Network, WSP, OSM, Esri
Taroona
Lower Sandy Bay
Where are people likely to face barriers to cycling?
Bike Equity Analysis
34% of Hobart lives within a 300m walk of a dedicated bikeway compared to 38% of Greater Melbourne (1st nationally) & 82% of Greater Copenhagen (1st globally) living near protected bikeways.
Bike Equity Indicators: Access & Disparity
300m Walkshed from a Dedicated Bikeway Socio-economic Disadvantage Index (%)
Low-income Population


Families with Unemployed Parents Low-rent Dwellings (<

Unemployed Population


Sources: ITDP Atlas of Sustainable Transport, ABS Census (2021), Esri
Taroona
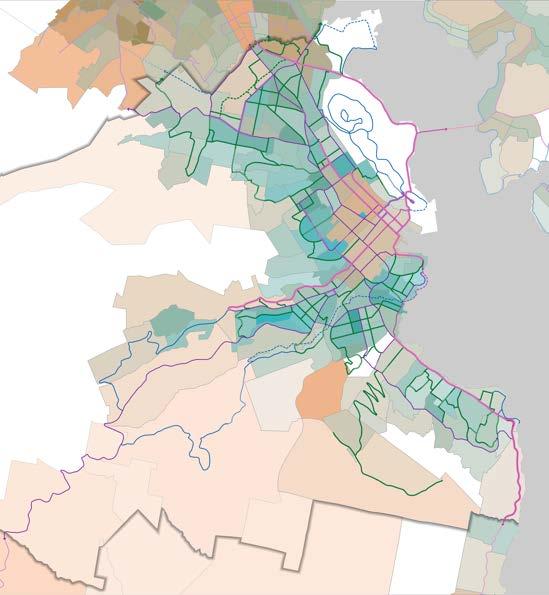
Bike suitability, propensity, and equity reveal the most bikeable streets and areas
Composite Bikeability
Synthesizing current cycling ridership data, along with spatially analysing the suitability of Hobart's streets for cycling, the proclivity of people to shift from car to cycling, and where people are more disadvantaged accessing cycling composes a full picture of bikeability. Since distinct lenses highlight different areas, planning must balance propensity and equity.
Given that Hobart City Council has a citywide representation system, translating the bikeability analyses to the neighbourhood scale builds a prioritisation framework that allows for greater neighbourhood-based considerations to ensure no neighbourhood is left behind.
Sources: ABS Census (2021), Bicycle Network, OSM, Esri
Taroona
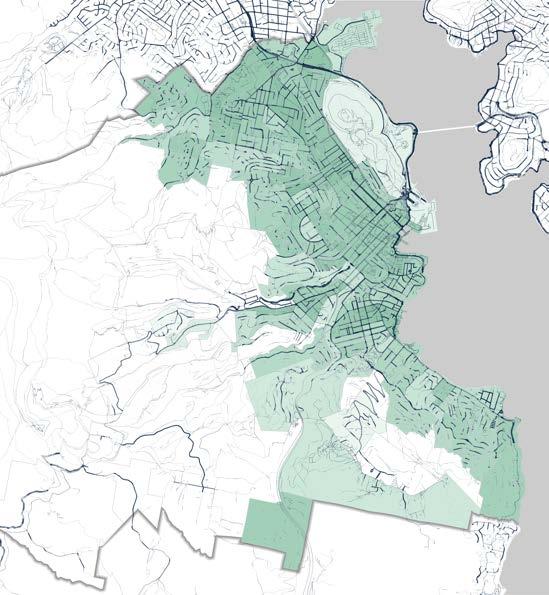
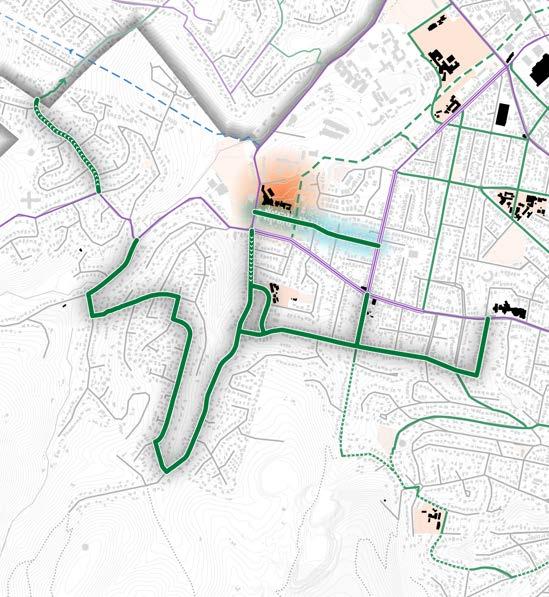
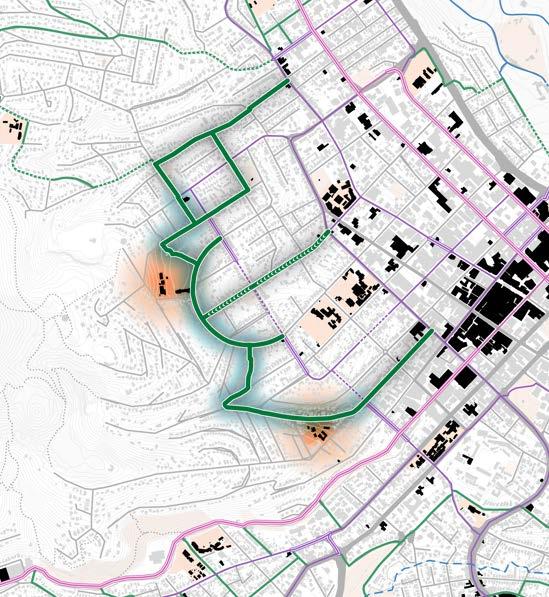
Bikeability analyses form a framework to prioritise 10 neighbourhood greenways
Route Prioritisation
Taroona
Cycling Routes
How do bikeable streets serve all Hobart's neighbourhoods?
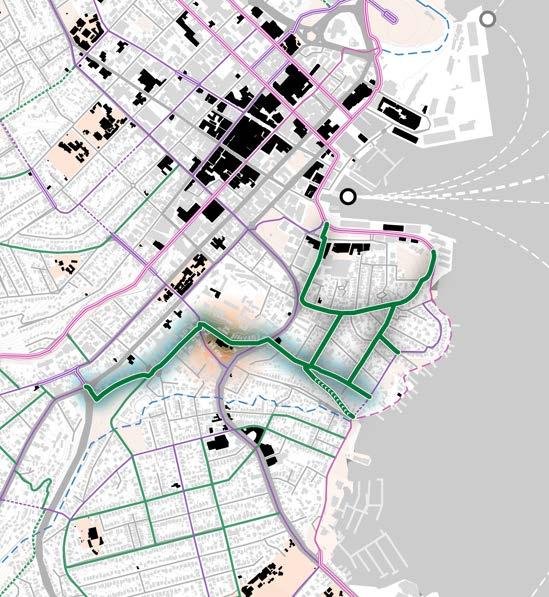
A comprehensive vision for safe, accessible, active routes through Hobart Bike Plan Network
Bikeability analyses inform where bike-friendly routes should be planned and implemented throughout the Hobart local government area. The resulting network forms the basis for a City of Hobart Bike Map, which can guide cyclists safely and efficiently from their neighbourhoods to a variety of destinations.
To ensure that all residents are well connected, each neighbourhood route was studied in detail with its own concept plan. All ten greenway plans propose where a tactical toolkit of recommendations can be best deployed by starting with priority schools and along priority corridors to activate existing residential streets as Neighbourhood Greenways for cycling, rolling, and walking.
Route Classification Route Overlays
Recreational Existing Treatment Proposed Study E-Rideable Hill (>10% Slope)
Sources: ABS Census (2021), City of Hobart, OSM, Esri
Hobart
Taroona
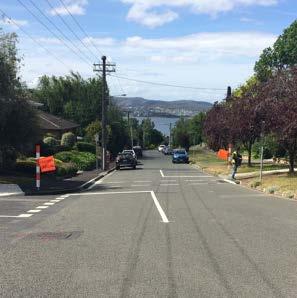
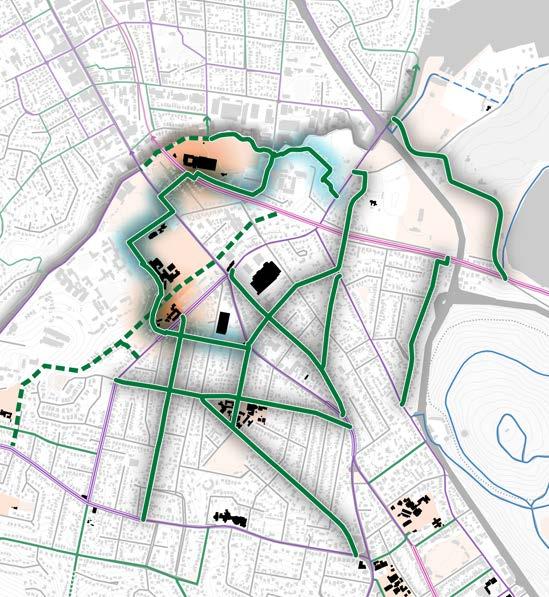
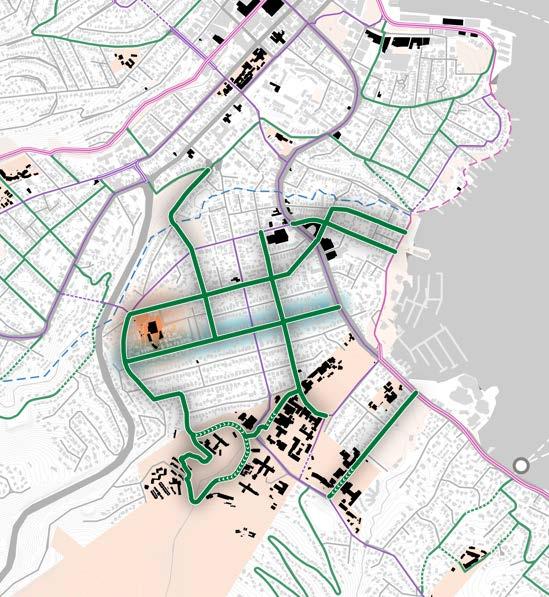
The Battery Point Neighbourhood Greenway connects residents to primary and secondary routes, Salamanca Place, and centers safe links to Albuera Street Primary School at its heart.
The Lenah Valley Neighbourhood Greenway connects residents to key secondary routes like Augusta Road, and prioritises access to Lenah Valley Primary School and local destinations.
Lower Sandy Bay
The Lower Sandy Bay Neighbourhood Greenway connects residents between Sandy Bay Road and Churchill Avenue, prioritising school access on the flattest streets of the hilly neighborhood.

Mount Nelson
Neighbourhood Greenway
2,749
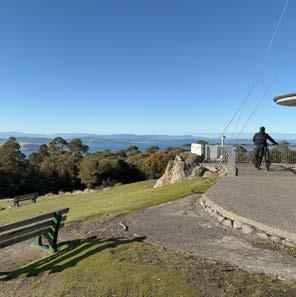
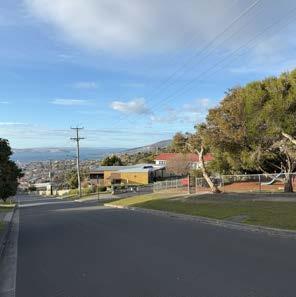
The Mount Nelson Neighbourhood Greenway connects residents from the hilltop safely up and down "The Bends" to Churchill Avenue, with a focus on Mount Nelson Primary School.
SouthernOutlet ProctorsRd
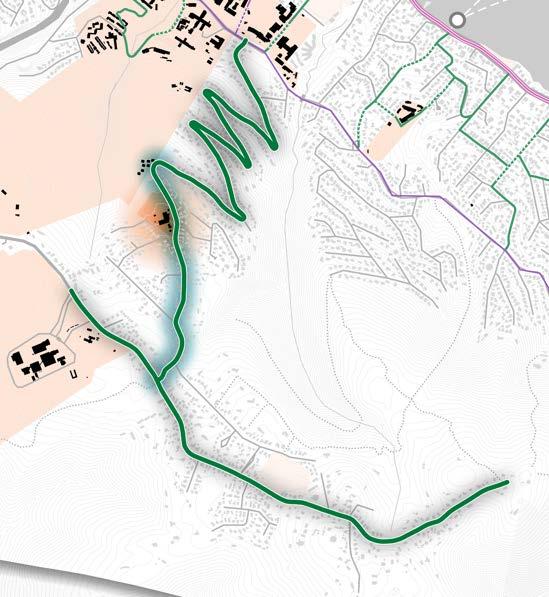
of Tasmania
Waimea Heights Primary School
The Hutchins School
Mount Nelson Primary School
Mount Nelson Signal Station
Hobart College
Nelson
Mount Stuart
Neighbourhood Greenway
The Mount Stuart Neighbourhood Greenway connects residents to Mount Stuart Primary School and secondary routes, offering safe links and less steep rides up and down the hill.
New Town
Neighbourhood Greenway
The New Town Neighbourhood Greenway connects residents to key secondary routes, the Intercity Cycleway primary route, and a variety of local schools and other destinations.
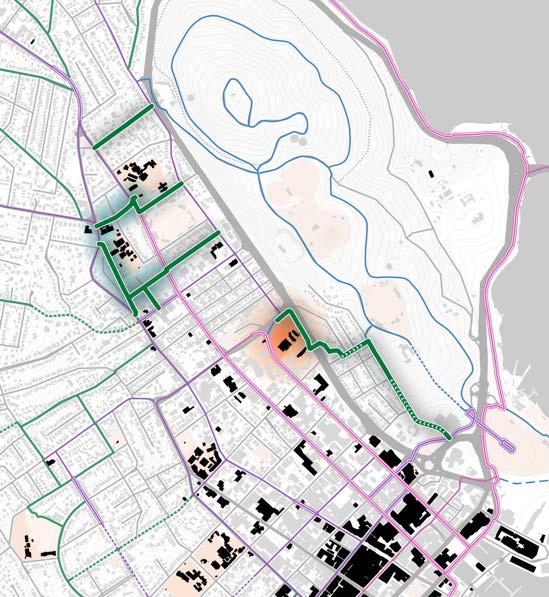
North Hobart
Neighbourhood Greenway
The North Hobart Neighbourhood Greenway connects residents to primary and secondary routes on low-stress streets for safe access to multiple schools, Glebe, and Queens Domain.
Greenway
The Sandy Bay Neighbourhood Greenway connects residents to primary and secondary routes, University of Tasmania, Princes Street Primary School, and other local destinations.
Sandy Bay Rivulet Study for Future Cycling Route
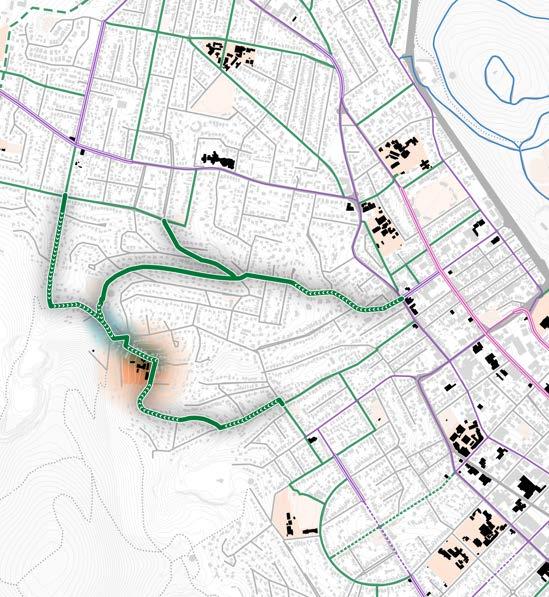
South Hobart
Neighbourhood Greenway
The South Hobart Neighbourhood Greenway connects residents to the Hobart Rivulet Track primary route and secondary routes, centered on safe travel to South Hobart Primary School.
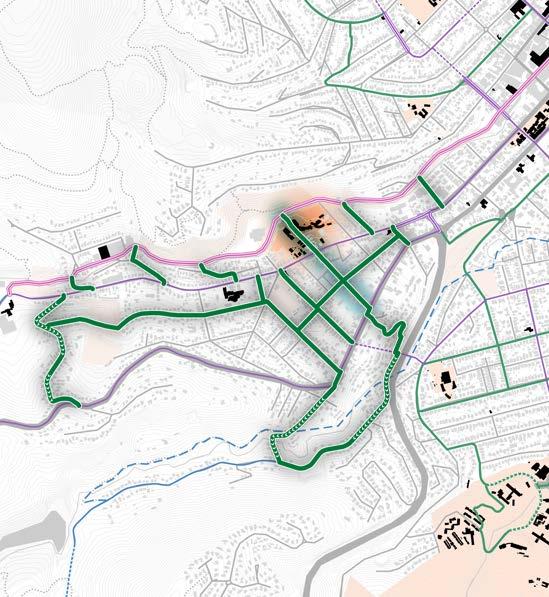
West Hobart
The West Hobart Neighbourhood Greenway connects residents to key secondary routes, prioritising safe travel to primary schools on low-stress streets that avoid the toughest hills.
Greenway Activation
How does Hobart start taking action?
Infrastructure Delivery Behaviour Change
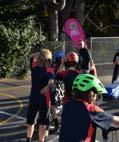
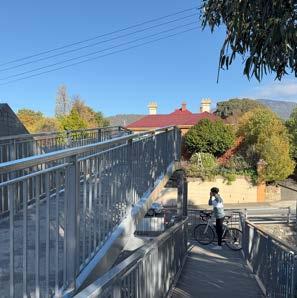
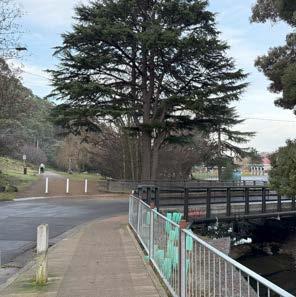
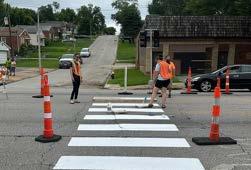
Source: Newdegate My Street event (Richard Howard)
Activate Greenways starting with priority schools and corridors
Tactical Action Plan
Mount Nelson Local Area Mobility Plan & School Access Travel Plan pilot phase
Meets Hobart Transport Strategy 2024 Action 7:
Trial a behaviour change event with one of our School Access Travel Plan partner schools.
School Open Street Expression of Interest
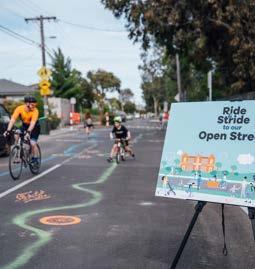
Merri-bek's Ride & Stride School Open Streets
School Case Study
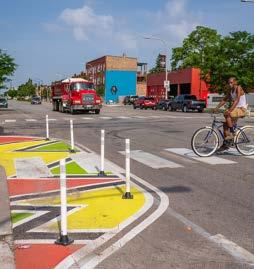
Chicago's Austin Neighbourhood Corridor
Corridor Case Study
Priority School Open Street
Priority Corridor Improvements
Promote cycling and active transport with an equity focus on youth and safety
Temporary Trial Permanent Install +
Demonstrate how the tactical toolkit can be deployed to increase ridership
Wayfinding Element
Green Infrastructure
Safer Crossing Traffic Calming
Foregrounding equity by creating safer streets for students to walk, ride, and scoot, Ride & Stride is a behaviour change program designed to get 80% of all Merri-bek students travelling sustainably to school by 2030. Letting engaged schools lead the way, Merri-bek City Council helps understand barriers to cycling and deliver tailored programming.
Foregrounding propensity by shifting development from mega-projects to micro-districts, INVEST South/West is a commercial corridor revitalization initiative focused on ten disinvested Chicago neighbourhoods. The initiative led with catalytic activations, including pedestrian and cycling infrastructure improvements, to enhance public life.
City
Source: INVEST South/West,
of Chicago, IL, US
Source: Ride & Stride Open Streets, City of Merri-bek, VIV, AU
Based on My Streets Events & Activations model
Put youth first to equitably design safer streets for all
Target investments on corridors with high propensity to mode shift
Activate Greenways with Wayfinding Elements Tactical Transformation
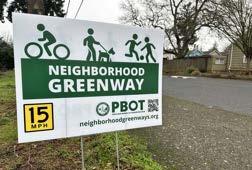
Free yard signs for residents who live on neighbourhood greenways
13% of people likely to cycle more asked for clear bicycle network signage in the 2023 Greater Hobart Household Travel Survey. Permanent Install Temporary Trial
Actions:
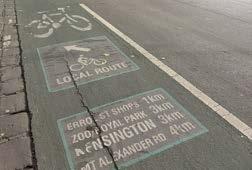
1. Develop a City of Hobart Cycling Map, messaging Neighbourhood Greenways.
2. Paint shared lane markings to guide cyclists along priority corridors within the routes.
3. Create a robust identity for Neighbourhood Greenways through custom street signs, yard signs, and/or public art as wayfinding.
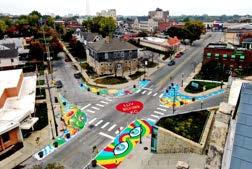
Quick Win Case Study
In Portland, thoughtful wayfinding and communication is reducing psychological barriers to cycling by inviting new users.
Source: BikePortland, Bike Loud PDX
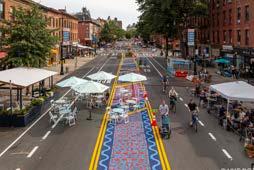
Slow Win Case Study
Merri-bek is implementing shared zones with new red asphalt, line markings, and art to deliver its Streets for People Plan.
Source: City of Merri-bek
Pop-up signage with guidance and engagement opportunities
Local artists invited to design shared zone pavement pattern
Directions to local destinations along neighbourhood routes
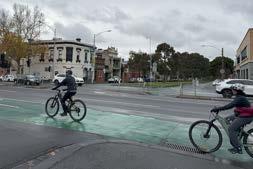
Melbourne, VIC, AU (Source: Oliver Oglesby)
Merri-bek, VIC, AU (Source: Oliver Oglesby)
Portland, OR, US (Source: City of Portland BOT)
Portland, OR, US (Source: Jonathan Maus/BikePortland)
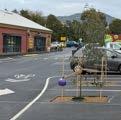
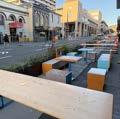
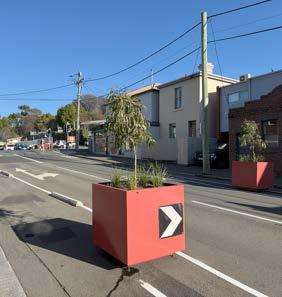
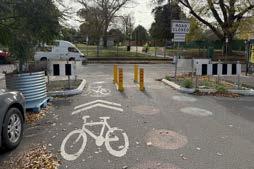
Activate Greenways with Green Infrastructure Tactical
Transformation
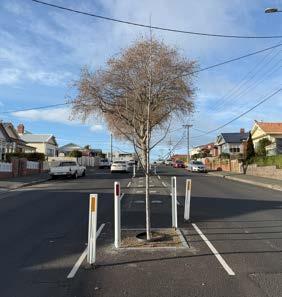
52% of Hobart's streets lack trees & 23% are fully paved, not managing stormwater, a challenge noted in Hobart's 2017 Street Tree Strategy.
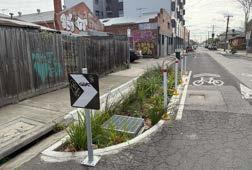
1. Integrate green infrastructure with traffic calming and safer crossings by de-paving medians, traffic circles, and kerb bumpouts.
2. Pilot bioretention tree pits to combine tree planting with stormwater management.
3. Focus tree planting on neighbourhood routes with low canopy coverage.
Quick Win Case Study
Leveraging street greening as traffic calming, Merri-bek integrates rain gardens into its "shimmy" routes.
Source: City of
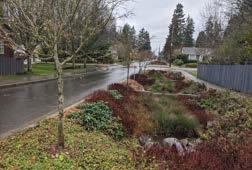
Slow Win Case Study
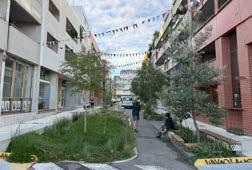
In Sydney, the Zetland neighbourhood's green infrastructure uses natural systems to manage rainfall and reduce runoff.
Curb extensions with integrated rain garden and tree pit design
De-paving of street ends lets rain gardens act as modal filters
Rain gardens in medians filter pollutants and detain floodwater
Terraced bioswales cleanse stormwater with native plants
Seattle, WA, US (Source: City of Seattle DOT)
Merri-bek, VIC, AU (Source: Oliver Oglesby)
Merri-bek, VIC, AU (Source: Oliver Oglesby) Sydney, NSW, AU (Source: Oliver Oglesby)
Merri-bek
Source: City of Sydney, Green Square Atlas of Water Stories
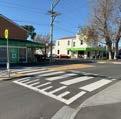
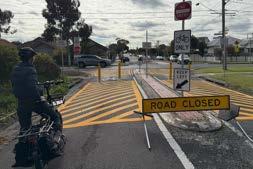
Activate Greenways with Safer Crossings Tactical Transformation +
12% of people likely to cycle more asked for cyclist priority at intersections in the 2023 Greater Hobart Household Travel Survey.
Actions:
1. Partner with schools to deliver pop-up interventions as a pathway to formal trials.
2. Expand refuge islands, raised footpaths, and kerb extensions at key intersections.
3. Prioritise safe routes to school through ongoing School Access Travel Plans for investments toward safer crossings.
One-day pop-up inspired mayor's commitment to permanent install
Quick Win Case Study
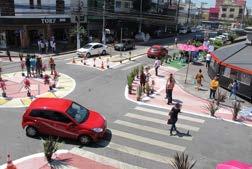
São Paulo's Reduced Speed Areas use pop-up street transformations alongside metrics collection to engage residents.
Global Designing Cities Initiative
Pass-throughs facilitate cyclist and pedestrian crossings while limiting car through-traffic
Slow Win Case Study
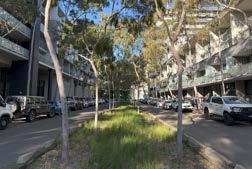
Portland's greenways, spanning 112+ km, developed since the 1980s by prioritising cycling and walking on residential streets.
City of Portland
Melbourne, VIC, AU (Source: Oliver Oglesby)
São Paulo, BR (Source: Global Designing Cities Initiative)
St. Louis, MO, US (Source: Interboro Partners)
Source:
Source:
Pop-up zebra crossing allows for immediate testing and engagement
Refuge islands protect cyclists at intersections
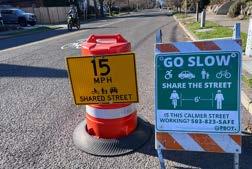
Activate Greenways with Traffic Calming Tactical Transformation
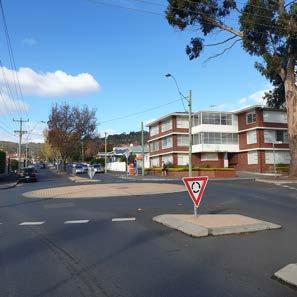
61+ pedestrians and cyclists have been in fatal or serious crashes on 40+ kph streets in Hobart since 2014, all involving high-speed car traffic.
Actions:
1. Engage schools in trialling traffic calming as play through priority Open Street events.
2. Collaborate with local artists and youth to co-create pavement designs that slow cars.
3. Make traffic calming devices multifunctional by integrating with wayfinding elements, green infrastructure, and safer crossings.
Traffic calming devices include street greening and public art
Install Temporary Trial
Quick Win Case Study
With a $25,000 Asphalt Art Initiative grant and a week's time, Kansas City employed artists and revived an unsafe intersection.
Source: Transportation Alternatives
Slow Win Case Study
Merri-bek's shared zones have been monitored as trials since 2021, which informed the permanent designs.
Source: City of Merri-bek
Colorful kerb extensions reduced speeds by 45%
Modal filter limits cars
Asphalt mural demarcates shared zone for cyclists
Kansas City, MO, US (Source: Bloomberg Philanthropies)
Merri-bek, VIC, AU (Source: Oliver Oglesby)
Merri-bek, VIC, AU (Source: Oliver Oglesby)
Brooklyn, NY, US (Source: NYC DOT)
Track progress of tactical cycling investments with people-centered metrics
Do you feel safer cycling and walking on the route? How do the tactical tools integrate with ongoing work? How impactful is the carbon footprint of the tactical tools? * How cost effective are the budgeted tactical tools? Is the route a propensity priority? Every neighbourhood has its own route to connect residents to Hobart's destinations. Is the route an equity priority? Can you access where you are going on the route? Have you seen more activity on the route? Mount Nelson Neighbourhood Route highlighted for
Conclusion
Deliver climate action & transport choice with safe, accessible, active Neighbourhood Greenways for all Summary
Principles & Call to Action
1. Decarbonise infrastructure with tactical toolkits.
2. Plan regionally for connections to and from Hobart.
Account for carbon and cut emissions with small yet impactful cycling investments. Long term, the most sustainable action will be to embrace Hobart's position as a capital city and densify land use.
Bikeability studies should not cut off analysis at the borders of local government areas. Beyond serving neighbourhoods, factor in the many more people who commute and see the capital city as a hub for public life.
3. Balance equity with propensity in decision-making.
4. Focus on youth to co-create better streets for all users.
Hobart Bike Plan
5. Shift behaviour through greenway activation designs.
6. Track progress using people-first data and metrics.
Bike planning tends to prioritise advantaged areas with the greatest access to cycling.
Integrating equity addresses health disparities, safety, and fair access to active transport for disadvantaged populations too.
Centering youth participation forms strong coalitions and generational change capacity. Always underscore how designing streets for walking and cycling with both children and caregivers in mind serves all of Hobart.
Recognise how infrastructure can function as communication and education.
Augment existing initiatives to build community enthusiasm and engagement by leveraging the tactical toolkits.
Concentrate on collecting relevant data to make the right moves and tell the right story.
User experience, demographics, and safety perceptions all matter along with mode shift targets for a liveable city.
Many thanks to everyone who has shared their knowledge of and love for cycling & Hobart Process & Acknowledgements
This study was completed during a ten-week fellowship with the City of Hobart as part of the Bloomberg Harvard City Leadership Initiative. The effort advances the City’s priorities of climate action and transport choice with a network of safe, accessible, active routes through Hobart. The fellowship was conceived around analysing and collecting data to help the City better understand where investments in the bike network can achieve the highest uptake of new bike trips. In promoting data-informed decision-making, the project aims to identify important changes to neighbourhood connections that can increase cycling for short trips—particularly for people who face transport inequity, such as youth. The final report delivers recommendations focused on developing a network of Neighbourhood Greenways, which will be further developed as part of the City of Hobart Bike Plan. Numerous individuals within and beyond the City of Hobart were invaluable to the research process, in addition to those noted at right.
All sources are cited on the relevant pages.
City of Hobart
Tasmania, Australia
Anna Reynolds
Lord Mayor & Councillor
City Transport Group
Stuart Baird
Allison Blazosky
Thiago Borges
Nigel Caldera
Owen Gervasoni
Shivani Jordan
Jason McLeod
Gokul Saji
Daniel Verdouw
Climate Change Team
Communications, Engagement, and Marketing Group
Open Space Group
Place Design, Sport, and Recreation Group
Stormwater and Waterways Group
Strategic Land Use Planning Group
Bloomberg Harvard City Leadership Initiative
Fernando Fernandez-Monge Fellowship Champion
Maurice Cox Faculty Advisor
Student Engagement Team
Willord Simmons
Pascha McTyson Within & Beyond Hobart
Oscar Hayes WSP
Alison Hetherington Bicycle Network
Mary McParland
Cycling South
Freya Grove
City of Sydney
Zoe McMasters
City of Merri-bek
t
e coh@hobartcity.com.au
w hobartcity.com.au