2 minute read
microtiter plates

from silk

undiluted E.coli with pUC19, 118 colonies appeared colonies, leading to the calculation of the viable competent cells 118(colonies) x 10ml= 1180 = 1.118 x 10 3 cells/ml. One dilution of E.coli, which took up the plasmid vector pUC19, presented 6 colonies and the viable competent cells are calculated as follows 6(colonies) x 10ml x 10 (dilution factor) = 600 = 6 x 10 2 cells/ml. The recombinant percentage of the selection was calculated as follows: recombinant percentage=white colonies x 100/ white +blue colonies= 190 x 100/ 191 = 99.4764%. The plates containing the rest of the dilutions did not show any colonies.
Serial dilutions of E.coli and B.subtilis biofilms, containing the competent cells and LB broth were produced in 96-well and 24-well microtiter plates and incubated for different periods of time. 100L volume of mixture was used for the 96-well plate and 1ml and 2ml volume for the 24-well plate. Biofilms were observed on the bottom of the wells, however 2ml volume of solution in the 24-well plate presented circular biofilms on the side of the well. Figure 6 illustrates examples of B.subtilis and E.coli biofilms on the bottom of well and on the side of the well in a 24-well microtiter plate. The working volume used was 2ml and the plate has been stained with 0.1% crystal violet solution and dried naturally.
Advertisement
Figure 6. Examples of B.subtilis biofilm (left) and E.coli biofilm (right) formation in 24-well microtiter plates

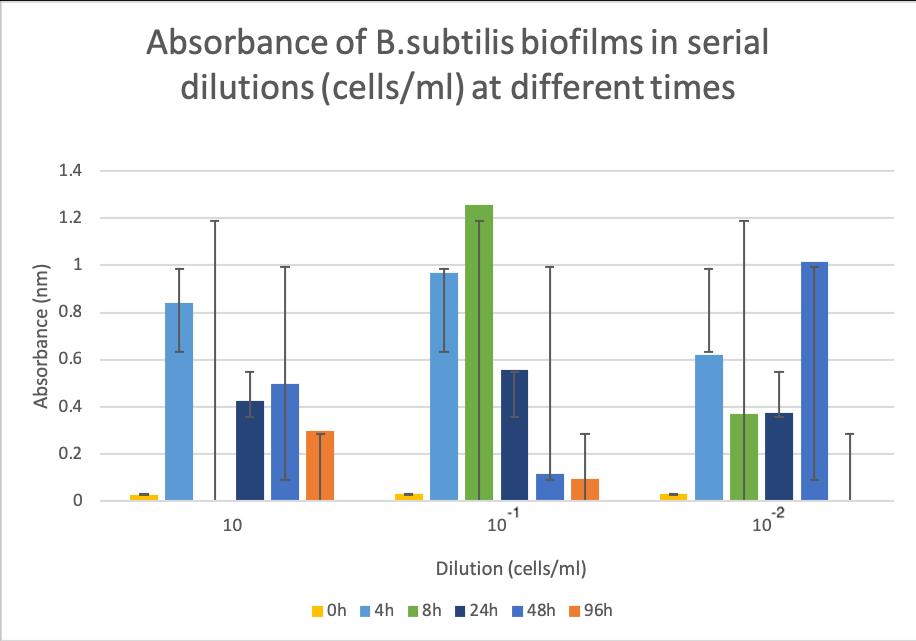
The competent E.coliand B.subtilis biofilms were incubated for 4 hours, 8 hours, 24 hours, 48 hours and 96 hours in order to determine the most beneficial conditions for biofilm creation. The biofilm solutions were produced by serial dilution technique (undiluted, 1 in 10 and 1 in 10 2 ) and the absorbance of each well and each microtiter plate was read using a plate reader at 595 nm. Figure 7 and Figure 8 show the absorbance readings at different incubation times for diluted and undiluted E.coliand respectively B.subtilis without the silk gene insert biofilms.
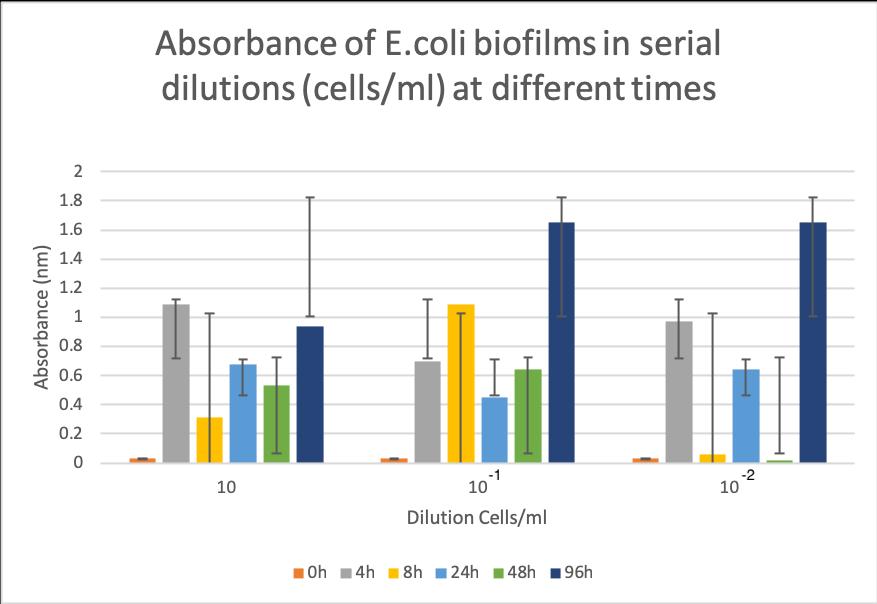
Figure 7. Statistical data presenting absorbance (595 nm) of E.coli biofilms in serial dilutions at different incubation times
Figure 8. Statistical data presenting absorbance (595 nm) of B.subtilis biofilms in serial dilutions at different incubation times