1 minute read
and B.subtilis biofilms at different times of incubation

from silk

According to Figure 7, undiluted E.coli biofilms tend to have relatively steady absorbance values, 4h and 96h incubations show absorbance of approximatively 1 nm. Samples diluted 1:10 indicate the highest absorbance at 96h incubation time with a difference of 0.5 nm between the absorbance of the 8h incubated samples. The samples diluted 1:100 present imbalanced absorbance values, the 96h incubation time representing the highest value.
Regarding Figure 8, the absorbance of undiluted B.subtilis biofilms vary significantly, as the 8h incubation showing a negative value and the 4h incubation the highest absorbance. The 1:10 diluted samples appear to have the highest absorbance values, the 8h incubation time being the most favourable one. The 1:100 dilution shows great absorbance at 48h incubation, however 96h incubation time indicates no absorbance.
Advertisement
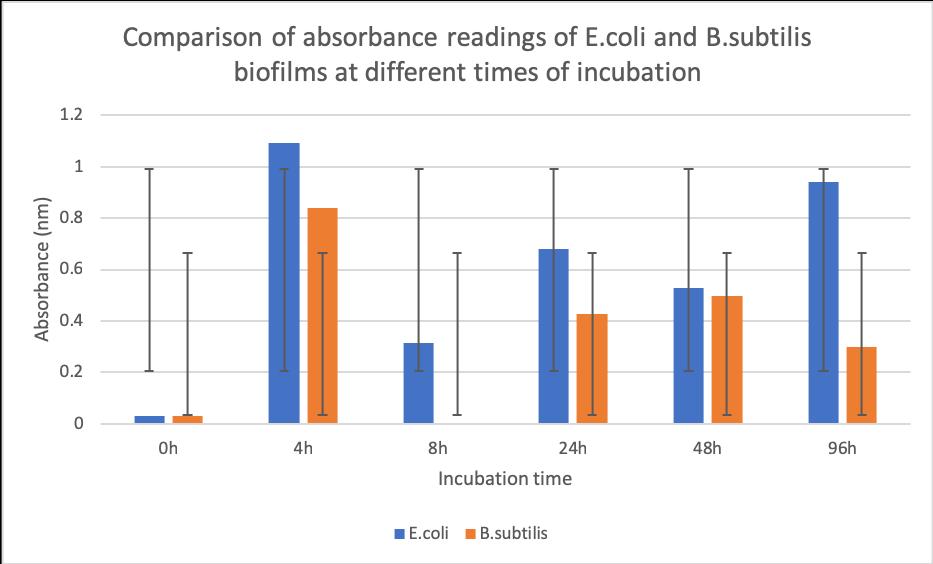
Figure 9. Comparison of absorbance readings (595 nm) of undiluted E.coli and B.subtilis biofilms at different times of incubation
A comparison of E.coliand B.subtilis biofilm growth is illustrated in Figure 9. E.coli biofilms show greater absorbance, the values being situated between 0.8 and 1.1 nm, whilst B.subtilis biofilms present no absorbance value at 8h incubation time and unsteady absorbance readings throughout all incubation times. Overall, 4h incubation time indicates a relatively high absorbance for both biofilms.
Figure 10 depicts the absorbance readings of diluted and undiluted E.colibiofilms with different inserts incubated for 4h.
Figure 10. Absorbance (595 nm) of E.coli with inserts in serial dilutions

The undiluted E.coli with pUC19 biofilm shows the highest absorbance reading (3.4 nm), whilst E.coli with pBluescript II SK (-) and without any plasmid show low values of absorbance situated between 0.5 and 1.5 nm. Diluted E.coli with pUC19 biofilm maintain constant values of absorbance throughout the serial dilutions.
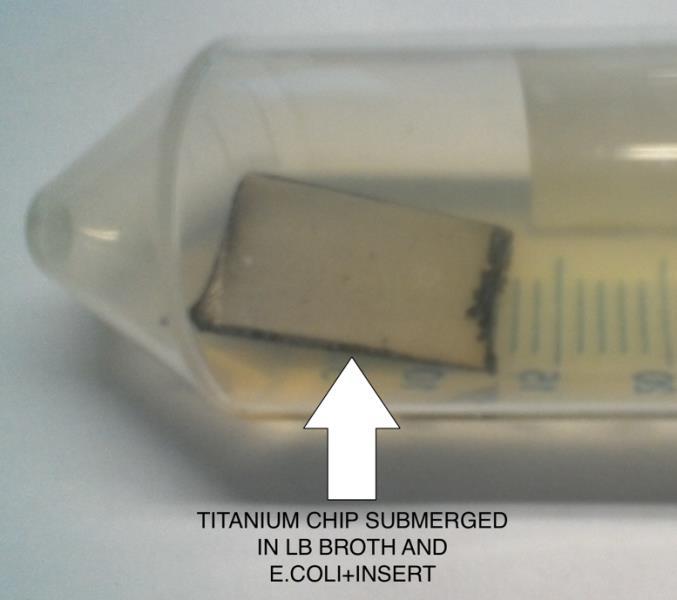
E.coliand B.subtilis biofilms were grown on titanium chips, which were submerged in LB broth and kept under observation. An example of submerged titanium is illustrated in Figure 11 .
Figure 11 . Example of titanium chip submerged in LB broth and host bacteria with insert
After 4h incubation, the titanium chips were washed and the absorbance of LB broth before and after the washing was measured at 595 nm. Table 3 depicts the absorbance values of LB broth before and after washing.


