
MARKET INTELLIGENCE . CONSULTING www.techsciresearch.com ASIA-PACIFIC UNDERSEA FIBER OPTIC CABLE MARKET FORECAST AND OPPORTUNITIES 2017 – 2027
S. No. Contents Page No. 1. Product Overview 2. Research Methodology 3. Executive Summary 4. Impact of COVID-19 on Asia-Pacific Undersea Fiber Optic Cable Market 5. Voice of Customer
6. Global Undersea Fiber Optic Cable Market Overview
Undersea Fiber Optic Cable Market
Contents
5.1. Brand Awareness 5.2. Factors Considered for Selecting Suppliers 5.3. Key Satisfaction Level 5.4. Challenges Faced Post Purchase
6.1. Market Size & Forecast 6.1.1. By Value 6.2. Market Share & Forecast 6.2.1. By Cable Design (Ribbon Tube, Loose Tube, Micro Loose Tube and Others) 6.2.2. By End-Use Industry (IT & Telecommunication, Energy & Power and Others) 6.2.3. By Insulation Type (Cross-Linked Polyethylene, Oil-Impregnated Paper, Resin-Impregnated Paper, Others) 6.2.4. By Region 6.3. Product Market Map 7. Asia-Pacific
Overview 7.1. Market Size & Forecast 7.1.1. By Value 7.2. Market Share & Forecast 7.2.1. By Cable Design Table of
7.2.2. By End-Use Industry
7.2.3. By Insulation Type
7.2.4. By Country 7.2.5. By Company (2021)
7.3. Product Market Map
7.4. Asia-Pacific: Country Analysis
7.4.1. China Undersea Fiber Optic Cable Market Overview
7.4.1.1. China Country Profile 7.4.1.2. Market Size & Forecast 7.4.1.2.1. By Value 7.4.1.3. Market Share & Forecast
7.4.1.3.1. By Cable Design 7.4.1.3.2. By End-Use Industry 7.4.1.3.3. By Insulation Type
7.4.2. Japan Undersea Fiber Optic Cable Market Overview
7.4.2.1. Japan Country Profile
7.4.2.2. Market Size & Forecast 7.4.2.2.1. By Value
7.4.2.3. Market Share & Forecast
7.4.2.3.1. By Cable Design
7.4.2.3.2. By End-Use Industry
7.4.2.3.3. By Insulation Type
S. No.
Page No.
Contents
Table of Contents
7.4.3. India Undersea Fiber Optic Cable Market Overview
7.4.3.1. India Country Profile
7.4.3.2. Market Size & Forecast 7.4.3.2.1. By Value 7.4.3.3. Market Share & Forecast 7.4.3.3.1. By Cable Design 7.4.3.3.2. By End-Use Industry 7.4.3.3.3. By Insulation Type
7.4.4. South Korea Undersea Fiber Optic Cable Market Overview
7.4.4.1. South Korea Country Profile 7.4.4.2. Market Size & Forecast 7.4.4.2.1. By Value 7.4.4.3. Market Share & Forecast 7.4.4.3.1. By Cable Design 7.4.4.3.2. By End-Use Industry 7.4.4.3.3. By Insulation Type
7.4.5. Australia Undersea Fiber Optic Cable Market Overview
7.4.5.1. Australia Country Profile
7.4.5.2. Market Size & Forecast
7.4.5.2.1. By Value 7.4.5.3. Market Share & Forecast
7.4.5.3.1. By Cable Design 7.4.5.3.2. By End-Use Industry 7.4.5.3.3. By Insulation Type
S. No.
Page No.
Contents
Table of Contents
Contents
7.4.6. Indonesia Undersea Fiber Optic Cable Market Overview
7.4.6.1. Indonesia Country Profile
7.4.6.2. Market Size & Forecast 7.4.6.2.1. By Value 7.4.6.3. Market Share & Forecast 7.4.6.3.1. By Cable Design 7.4.6.3.2. By End-Use Industry 7.4.6.3.3. By Insulation Type
7.4.7. Singapore Undersea Fiber Optic Cable Market Overview
7.4.7.1. Singapore Country Profile
7.4.7.2. Market Size & Forecast 7.4.7.2.1. By Value 7.4.7.3. Market Share & Forecast 7.4.7.3.1. By Cable Design 7.4.7.3.2. By End-Use Industry 7.4.7.3.3. By Insulation Type
7.4.8. Malaysia Undersea Fiber Optic Cable Market Overview
7.4.8.1. Malaysia Country Profile
7.4.8.2. Market Size & Forecast
7.4.8.2.1. By Value
7.4.8.3. Market Share & Forecast
7.4.8.3.1. By Cable Design 7.4.8.3.2. By End-Use Industry 7.4.8.3.3. By Insulation Type
S. No.
Page No.
Table of Contents
Contents
7.4.9. Thailand Undersea Fiber Optic Cable Market Overview
7.4.9.1 Thailand Country Profile
7.4.9.2. Market Size & Forecast 7.4.9.2.1. By Value 7.4.9.3. Market Share & Forecast 7.4.9.3.1. By Cable Design 7.4.9.3.2. By End-Use Industry 7.4.9.3.3. By Insulation Type
7.4.10. Vietnam Undersea Fiber Optic Cable Market Overview
7.4.10.1. Vietnam Country Profile 7.4.10.2. Market Size & Forecast 7.4.10.2.1. By Value 7.4.10.3. Market Share & Forecast 7.4.10.3.1. By Cable Design 7.4.10.3.2. By End-Use Industry 7.4.10.3.3. By Insulation Type
7.4.10.4. Statistics of Cable Routes in Vietnam 7.4.10.5. Growth of Vietnam Undersea Fiber Optic Cable Capacity 7.4.10.6. Demand of Foreign Partners for Connecting to Vietnam
7.4.11. Philippines Undersea Fiber Optic Cable Market Overview
7.4.11.1. Philippines Country Profile 7.4.11.2. Market Size & Forecast 7.4.11.2.1. By Value 7.4.11.3. Market Share & Forecast 7.4.11.3.1. By Cable Design 7.4.11.3.2. By End-Use Industry
7.4.11.3.3. By Insulation Type
S. No.
Page No.
Table of Contents
S. No. Contents Page No. 7.4.12. Taiwan Undersea Fiber Optic Cable Market Outlook
Taiwan Country Profile
Market Size & Forecast
By Value
Share & Forecast
By Cable Design
End-Use Industry
Insulation Type 8. Market Dynamics 8.1. Drivers 8.2. Challenges 9. Market Trends and Developments 10. Statistics of Cable Routes in Asia-Pacific 11. Upcoming Cables Routes in Asia-Pacific 12. Connecting Hubs in Asia Pacific 13. Case Study Analysis 13.1. Case Study 1 (The Asia Direct Cable (ADC) Consortium and NEC Corporation) 13.2. Case Study 2 (Australia Japan Cable (AJC) and Infinera Corporation) 14. Company Profiles 14.1. NEC Corporation 14.2. Fujitsu Limited Table of Contents
7.4.12.1.
7.4.12.2.
7.4.12.2.1.
7.4.12.3. Market
7.4.12.3.1.
7.4.12.3.2. By
7.4.12.3.3. By
14.3. SubCom, LLC.
14.4. Alcatel Submarine Networks
14.5. Huawei Marine Networks Technologies Co., Limited
14.6. Communication Cable Systems Indonesia
14.7. Ciena Corporation
14.8. Norddeutsche Seekabelwerke GmbH
14.9. Ocean Cables
14.10. Xtera
14.11. S. B. Submarine Systems Co., Ltd.
Table of Contents S. No.
Page No.
Contents
Recommendations
About Us & Disclaimer
14.12. Orange Marine 15. Strategic
16.
List of Figures
Figure No. Title Page
Figure 1: Global Undersea Fiber Optic Cable Market Size, By Value (USD Million), 2017-2027F
Figure 2: Global Undersea Fiber Optic Cable Market Share, By Cable Design, By Value, 2017-2027F
Figure 3: Global Undersea Fiber Optic Cable Market Share, By End-Use Industry, By Value, 2017-2027F
Figure 4: Global Undersea Fiber Optic Cable Market Share, By Insulation Type, By Value, 2017-2027F
Figure 5: Global Undersea Fiber Optic Cable Market Share, By Region, By Value, 2017-2027F
Figure 6: Global Undersea Fiber Optic Cable Market Map, By Cable Design, Market Size (USD Million) & Growth Rate (%), 2021
Figure 7: Global Undersea Fiber Optic Cable Market Map, By End-Use Industry, Market Size (USD Million) & Growth Rate (%), 2021
Figure 8: Global Undersea Fiber Optic Cable Market Map, By Insulation Type, Market Size (USD Million) & Growth Rate (%), 2021
Figure 9: Global Undersea Fiber Optic Cable Market Map, By Region, Market Size (USD Million) & Growth Rate (%), 2021
Figure 10: Asia-Pacific Undersea Fiber Optic Cable Market Size, By Value (USD Million), 2017-2027F
Figure 11: Asia-Pacific Undersea Fiber Optic Cable Market Share, By Cable Design, By Value, 2017-2027F
Figure 12: Asia-Pacific Undersea Fiber Optic Cable Market Share, By End-Use Industry, By Value, 2017-2027F
Figure 13: Asia-Pacific Undersea Fiber Optic Cable Market Share, By Insulation Type, By Value, 2017-2027F
Figure 14: Asia-Pacific Undersea Fiber Optic Cable Market Share, By Country, By Value, 2017-2027F
Figure 15: Asia-Pacific Undersea Fiber Optic Cable Market Share, By Company, By Value, 2021
Figure 16: Asia-Pacific Undersea Fiber Optic Cable Market Map, By Cable Design, Market Size (USD Million) & Growth Rate (%), 2021
Figure 17: Asia-Pacific Undersea Fiber Optic Cable Market Map, By End-Use Industry, Market Size (USD Million) & Growth Rate (%), 2021
Figure 18: Asia-Pacific Undersea Fiber Optic Cable Market Map, By Insulation Type, Market Size (USD Million) & Growth Rate (%), 2021
Figure 19: China Undersea Fiber Optic Cable Market Size, By Value (USD Million), 2017-2027F
Figure 20: China Internet Users (Million), 2017-2021
Figure 21: China Undersea Fiber Optic Cable Market Share, By Cable Design, By Value, 2017-2027F
Figure 22: China Undersea Fiber Optic Cable Market Share, By End-Use Industry, By Value, 2017-2027F
No.
List of Figures
Figure No. Title Page No.
Figure 23: China Undersea Fiber Optic Cable Market Share, By Insulation Type, By Value, 2017-2027F
Figure 24: Japan Undersea Fiber Optic Cable Market Size, By Value (USD Million), 2017-2027F
Figure 25: Japan Internet Users (Million), 2017-2021
Figure 26: Japan Undersea Fiber Optic Cable Market Share, By Cable Design, By Value, 2017-2027F
Figure 27: Japan Undersea Fiber Optic Cable Market Share, By End-Use Industry, By Value, 2017-2027F
Figure 28: Japan Undersea Fiber Optic Cable Market Share, By Insulation Type, By Value, 2017-2027F
Figure 29: India Undersea Fiber Optic Cable Market Size, By Value (USD Million), 2017-2027F
Figure 30: India Internet Users (Million), 2017-2021
Figure 31: India Undersea Fiber Optic Cable Market Share, By Cable Design, By Value, 2017-2027F
Figure 32: India Undersea Fiber Optic Cable Market Share, By End-Use Industry, By Value, 2017-2027F
Figure 33: India Undersea Fiber Optic Cable Market Share, By Insulation Type, By Value, 2017-2027F
Figure 34: South Korea Undersea Fiber Optic Cable Market Size, By Value (USD Million), 2017-2027F
Figure 35: South Korea Internet Users (Million), 2017-2021
Figure 36: South Korea Undersea Fiber Optic Cable Market Share, By Cable Design, By Value, 2017-2027F
Figure 37: South Korea Undersea Fiber Optic Cable Market Share, By End-Use Industry, By Value, 2017-2027F
Figure 38: South Korea Undersea Fiber Optic Cable Market Share, By Insulation Type, By Value, 2017-2027F
Figure 39: Australia Undersea Fiber Optic Cable Market Size, By Value (USD Million), 2017-2027F
Figure 40: Australia Internet Users (Million), 2017-2021
Figure 41: Australia Undersea Fiber Optic Cable Market Share, By Cable Design, By Value, 2017-2027F
Figure 42: Australia Undersea Fiber Optic Cable Market Share, By End-Use Industry, By Value, 2017-2027F
Figure 43: Australia Undersea Fiber Optic Cable Market Share, By Insulation Type, By Value, 2017-2027F
Figure 44: Indonesia Undersea Fiber Optic Cable Market Size, By Value (USD Million), 2017-2027F
Figure 45: Indonesia Internet Users (Million), 2017-2021
Figure 46: Indonesia Undersea Fiber Optic Cable Market Share, By Cable Design, By Value, 2017-2027F
List of Figures
Figure No. Title Page No.
Figure 47: Indonesia Undersea Fiber Optic Cable Market Share, By End-Use Industry, By Value, 2017-2027F
Figure 48: Indonesia Undersea Fiber Optic Cable Market Share, By Insulation Type, By Value, 2017-2027F
Figure 49: Singapore Undersea Fiber Optic Cable Market Size, By Value (USD Million), 2017-2027F
Figure 50: Singapore Internet Users (Million), 2017-2021
Figure 51: Singapore Undersea Fiber Optic Cable Market Share, By Cable Design, By Value, 2017-2027F
Figure 52: Singapore Undersea Fiber Optic Cable Market Share, By End-Use Industry, By Value, 2017-2027F
Figure 53: Singapore Undersea Fiber Optic Cable Market Share, By Insulation Type, By Value, 2017-2027F
Figure 54: Malaysia Undersea Fiber Optic Cable Market Size, By Value (USD Million), 2017-2027F
Figure 55: Malaysia Internet Users (Million), 2017-2021
Figure 56: Malaysia Undersea Fiber Optic Cable Market Share, By Cable Design, By Value, 2017-2027F
Figure 57: Malaysia Undersea Fiber Optic Cable Market Share, By End-Use Industry, By Value, 2017-2027F
Figure 58: Malaysia Undersea Fiber Optic Cable Market Share, By Insulation Type, By Value, 2017-2027F
Figure 59: Thailand Undersea Fiber Optic Cable Market Size, By Value (USD Million), 2017-2027F
Figure 60: Thailand Internet Users (Million), 2017-2021
Figure 61: Thailand Undersea Fiber Optic Cable Market Share, By Cable Design, By Value, 2017-2027F
Figure 62: Thailand Undersea Fiber Optic Cable Market Share, By End-Use Industry, By Value, 2017-2027F
Figure 63: Thailand Undersea Fiber Optic Cable Market Share, By Insulation Type, By Value, 2017-2027F
Figure 64: Vietnam Undersea Fiber Optic Cable Market Size, By Value (USD Million), 2017-2027F
Figure 65: Vietnam Internet Users (Million), 2017-2021
Figure 66: Vietnam Undersea Fiber Optic Cable Market Share, By Cable Design, By Value, 2017-2027F
Figure 67: Vietnam Undersea Fiber Optic Cable Market Share, By End-Use Industry, By Value, 2017-2027F
Figure 68: Vietnam Undersea Fiber Optic Cable Market Share, By Insulation Type, By Value, 2017-2027F
Figure 69: Philippines Undersea Fiber Optic Cable Market Size, By Value (USD Million), 2017-2027F
Figure 70: Philippines Internet Users (Million), 2017-2021
List of Figures
Figure No. Title Page
Figure 71: Philippines Undersea Fiber Optic Cable Market Share, By Cable Design, By Value, 2017-2027F
Figure 72: Philippines Undersea Fiber Optic Cable Market Share, By End-Use Industry, By Value, 2017-2027F
Figure 73: Philippines Undersea Fiber Optic Cable Market Share, By Insulation Type, By Value, 2017-2027F
Figure 74: Taiwan Undersea Fiber Optic Cable Market Size, By Value (USD Million), 2017-2027F
Figure 75: Taiwan Internet Users (Million), 2017-2021
Figure 76: Taiwan Undersea Fiber Optic Cable Market Share, By Cable Design, By Value, 2017-2027F
Figure 77: Taiwan Undersea Fiber Optic Cable Market Share, By End-Use Industry, By Value, 2017-2027F
Figure 78: Taiwan Undersea Fiber Optic Cable Market Share, By Insulation Type, By Value, 2017-2027F
No.
Product Overview
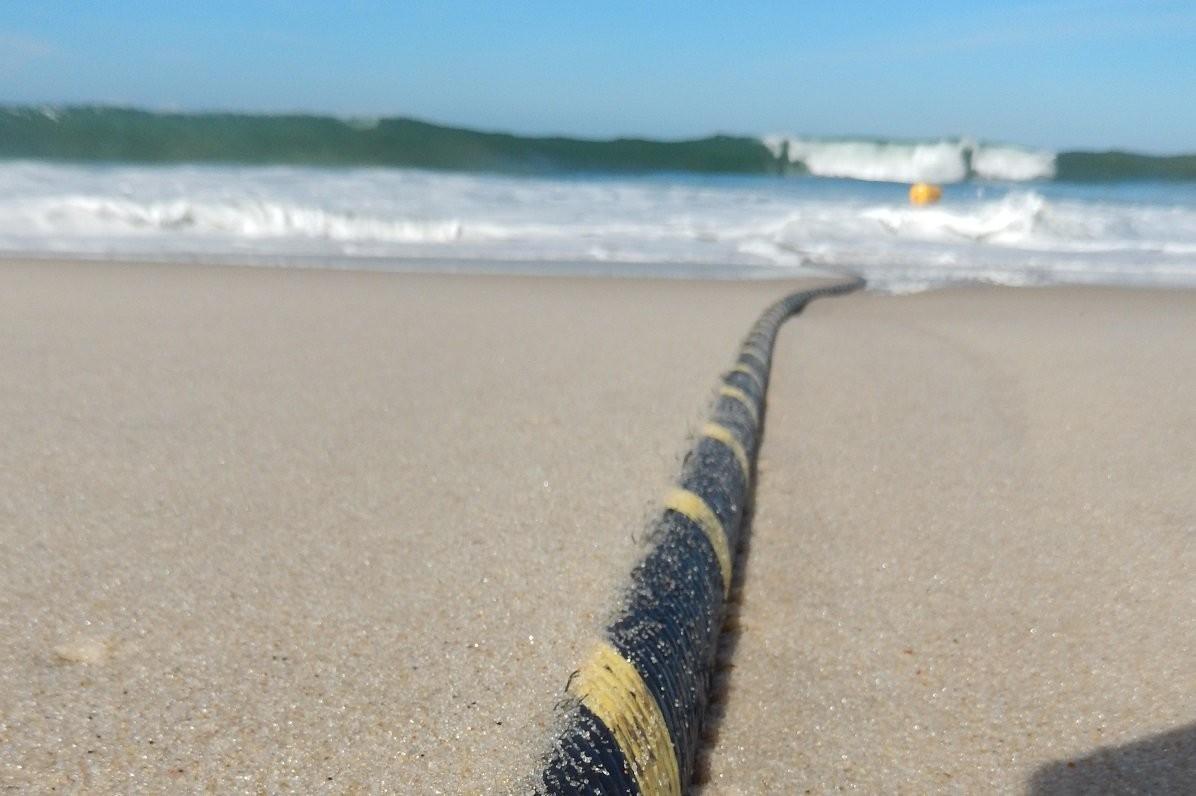
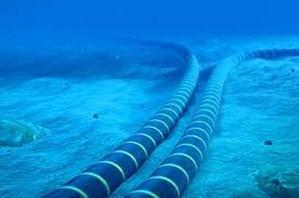
Product Overview Product of Interest: Undersea Fiber Optic Cable Review Period 2017 – 2020 Base Year 2021 Estimated Year 2022 Forecast Period 2023-2027 Year Range ASIA-PACIFIC UNDERSEA FIBER OPTIC CABLE MARKET BY CABLE DESIGN • Ribbon Tube • Loose Tube • Micro Loose Tube • Others BY COUNTRY • China • India • Japan • South Korea • Australia • Vietnam • Taiwan • Philippines • Thailand • Malaysia • Singapore • Indonesia • Undersea Fiber Optic Cable operates under submarine cable systems that consist of a communication cable laid on the sea-bed between cable landing stations (CLS) on the land to carry telecommunication signals across stretches of the ocean. Undersea Fiber optic cables are used to transfer secured data through international traffic. • The cables offer highly secure, reliable and very high-capacity telecommunication links between numerous countries across the globe. The transmission quality of an undersea fiber optic cable is significantly better than the one offered through the satellite. Undersea fiber optic cables are only a few inches thick and carry only a few optical fibers. Yet they have transmission capacities of terabits per second (Tbps). Market Segmentation BY END-USE INDUSTRY • IT & Telecommunication • Energy & Power • Others BY INSULATION TYPE • Cross-Linked Polyethylene • Oil-Impregnated Paper • Resin-Impregnated Paper • Others
Product Overview
Product of Interest: Undersea Fiber Optic Cable
• Loose Tube: The loose-tube cables are mostly used cables which are specifically designed for harsh outdoor environments. They protect the fiber core, cladding, and coating by enclosing everything within semi-rigid protective sleeves or tubes. In loose-tube, cables that hold more than one optical fiber, each individually sleeved core is bundled loosely within an all-encompassing outer jacket.
• Ribbon Tube: The ribbon fiber optic cable is generally a ribbon of optical fibers, which is formed into a flat strip. This is done by manufacturing a series of individual optical fibers and laying them flat and bonding them to each other. Using this technology as many as 24 optical fibers can be put together. The fibers are typically placed side by side forming a flat ribbon. Ribbon cable has been around for so many decades, however, the use case for it is becoming more widely accepted and adopted.

• Micro Loose Tube: The micro loose tube cables were firstly manufactured in Europe as the innovative approach for installing numerous optical networks for the congested duct environments. These miniaturized micro loose tube cables, with increased fiber counts per cross-sectional areas, could be installed with less cost and disruption than a rip-and-replace solution. Micro loose tube cables can act as a bridge option for lower fiber counts (from 12 to 288 fibers) that can scale up in the future with minimal installation cost.
• Others
Product Overview
Product of Interest: Undersea Fiber Optic Cable
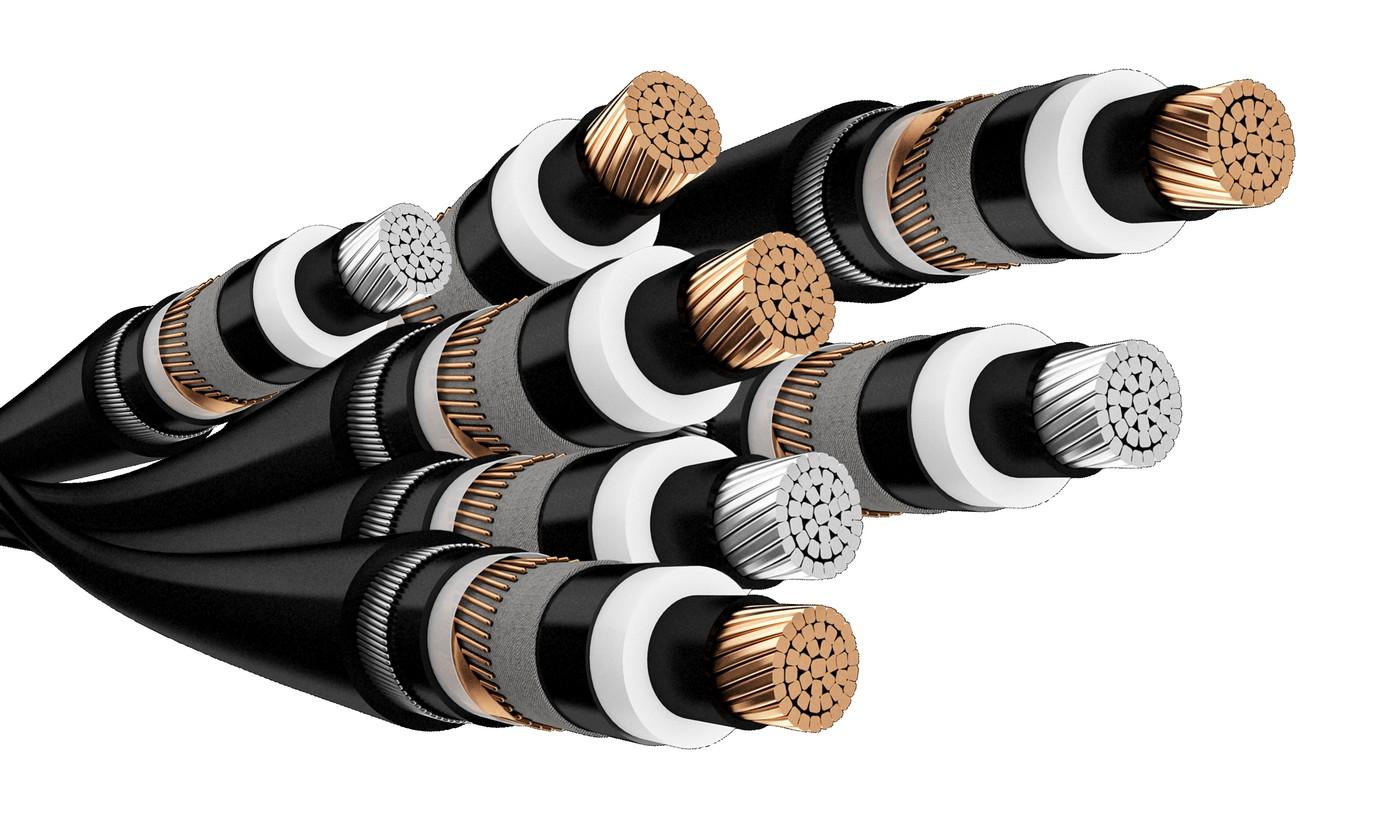
• Cross-Linked Polyethylene: The cross-linked polyethylene insulation is a better barrier than uncross-linked polyethylene of similar crystallinity. The insulation is a thermosetting resin with three types of cross-linking: peroxide cross-linking, radiation cross-linking, and silane cross-linking. The polymer can be effectively recycled if only the cross-linking points are decomposed. From peroxide cross-linked polyethylene, the cross-links are selectively removed by using supercritical water without severe decomposition of the backbone chains.
• Oil-Impregnated Paper: The oil-impregnated insulation paper has been widely used in transformers because of its low cost and desirable physical and electrical properties. The insulation paper is made up of natural cellulose and can be operated in the high-voltage environment. To give the insulator the adequate dielectric strength, the condenser insulation is saturated (impregnated) with oil. The type of oil used is almost always mineral oil (the same oil that is used for power transformers and switchgear).
• Resin-Impregnated Paper: The resin impregnated paper (RIP) is a term used for dry bushings in which the main insulation consists of a core wound from crepe paper, which is then impregnated with a curable resin. The outer insulation is a composite insulator with silicone sheds or a porcelain insulator. The RIP insulator type is a type of insulating material that has been used in high voltage bushings and other equipment since 1960. The insulator has resin-rich and void-free structure which leads to extremely superior voltage withstand characteristics.
• Others: Others include silicon gel, buffering plastic, etc.
Research Methodology

In-depth secondary research was conducted to determine overall market size, segmental market size and leading companies in AsiaPacific Undersea Fiber Optic Cable Market.
In order to conduct industry experts’ interviews, TechSci formulated a detailed discussion guide.
List of leading companies and industry specialists was developed.
TechSci conducted interviews with industry experts and leading companies for data collection and verification.
Data obtained as a result of primary and secondary research was validated through rigorous triangulation.
The data was scrutinized using MS-Excel, statistical tools and internal proprietary database to obtain qualitative and quantitative insights about AsiaPacific Undersea Fiber Optic Cable Market.
Research Methodology Identifying Key Opinion Leaders Questionnaire Design In-depth
Interviews
Data Collectio n Developing List of Respondents
e
Data
Formulating Questionnair
Market Profiling
Validatio n Data Analysis
Data Collection Data Filter & Analysis Research & Intelligence Actionable Insights Business Solution Primary Research Desk Research Company Analysis Recent Developments Market Changing Aspects/Dynamics Government Policies Conclusion Market Participants Key Strengths LinkedIn TechSci Internal Database LinkedIn TechSci Internal Database Factiva Hoovers EMIS Factiva Hoovers EMIS Paid Sources Paid Sources Company Websites Company Annual Reports White Paper Study Financial Reports Investor Presentations Regulatory Body Company Websites Company Annual Reports White Paper Study Financial Reports Investor Presentations Regulatory Body Secondary Research Secondary Research Primary Research Primary Research Source: XXXXX Note: These are dummy figures; please purchase our report for actual data
Research Methodology
Baseline Methodology
Our dedicated team of industry experts has monitored and analyzed various aspects of the Asia-Pacific Undersea Fiber Optic Cable Market. The team has analyzed the outlook of various segments of this market, while considering the major influencing factors such as increasing demand for interconnected data centers, growing internet traffic, rise in offshore wind power capacity, and increasing use of 5G in developing countries, among others. The study includes market forecasting, which would enable our clients to take better decisions while planning their strategy to achieve sustainability in the Asia-Pacific Undersea Fiber Optic Cable Market.
Methodology Followed for Calculation of Market Size:
Market Size by Value: Market size, in terms of value, for the 2021 was calculated based on information collected through exhaustive secondary research and primary surveys, with various key opinion leaders/stakeholders and industry experts. Company revenues for historical and base year were also considered while evaluating the market size. The team interviewed more than 30 companies, 50 industry experts and other stakeholders in the Asia-Pacific Undersea Fiber Optic Cable Market to obtain the overall market size during 2017-2021, which was validated by the Delphi technique.
Source: XXXXX
Note: These are dummy figures; please purchase our report for actual data
Research Methodology
Respondents were asked about the current and future market growth rates, as well as market shares by cable design, by end use industry, by insulation type, by country, and by company. Removing the outlier response, the geometric mean of growth estimates and provider wise revenue shares generated across various segments were considered, to arrive at the final revenue shares. Revenue shares generated across various segments were further triangulated from other stakeholders depending upon the segments.
Methodology Followed for Calculation of Market Shares:
Market shares by cable design, by end use industry, by insulation type, by country, and by company were calculated based on the responses received through primary surveys with industry experts, in which the respondents were asked about the market shares of the leading companies in Asia-Pacific Undersea Fiber Optic Cable Market. The final shares were calculated by taking the geometric mean of the responses gathered from key opinion leaders after eliminating the outliers. Moreover, respondents were asked about the leading companies operating in the Asia-Pacific Undersea Fiber Optic Cable Market.
Methodology Followed for Forecasting:
TechSci Research performed periodical checks on data collected through the surveys with logical checks and analyzed the survey results.
Source: XXXXX
Note: These are dummy figures; please purchase our report for actual data
Research Methodology
Data triangulation techniques were applied to fill the gaps and to present a more meaningful picture of the market. To forecast the Asia-Pacific Undersea Fiber Optic Cable Market, TechSci Research used various forecast techniques such as Moving Average, Time Series Analysis, Regression Analysis, Econometric and Judgmental Analysis.
TechSci Research also used the impact analysis during short, medium and long-term period to estimate and analyze market demand scenario.
Partial List of Companies Interviewed
NEC Corporation, Fujitsu Limited, SubCom, LLC, Alcatel Submarine Networks, Huawei Marine Networks Technologies Co., Limited, Communication Cable Systems Indonesia, Ciena Corporation, Norddeutsche Seekabelwerke GmbH, Ocean Cables, Xtera, S. B. Submarine Systems Co., Ltd., and Orange Marine among others
Partial List of Secondary Sources
Company Annual Reports, Press Releases, Industry Magazines, Industry Reports, Company Websites, TechSci Research Proprietary Database & Knowledge Repository, The Fiber Optic Association, Inc., Fiber Broadband Association, Asian-Pacific Optical Fiber & Cable Industry Association (APC), Internet and Mobile Association of India (IAMAI), Telecom Regulatory Authority of India, Cellular Operators Association of India (COAI), Cyber Security Association of India, Optical Association of India (OAI), among others.
Note: Sum of some shares may not be 100% due to round off till two decimal places.
Source: XXXXX
Note: These are dummy figures; please purchase our report for actual data
Industry Brief
Growing demands for high-speed internet speed, focus on cloud-based facilities, increasing the role of artificial intelligence in submarine telecom cable systems, are expected to drive the growth of the Asia-Pacific Fiber Optic Cable Market in during the forecast period. According to TechSci Research report, “Asia-Pacific Undersea Fiber Optic Cable Market - By Country, Competition Forecast & Opportunities, 20172027,” Saudi Arabia undersea fiber optic cable market is expected to grow at CAGR of 15.04% to reach USD 10,102.87 million by 2027. Rising demand for high bandwidth, growing use of fiber cable in the digital content sector, growing 5G deployment, and the rising emergence of industry 4.0 are expected to propel the Asia-Pacific Undersea Fiber Optic Cable Market during the forecast period. Growing adoption of cloud services, increasing digitalization, big data & IoT adoption, 5G deployments, and growth in the inland and undersea activities in APAC are some of the main reasons for the increased number of hyperscalers, which directly affect the market of undersea fiber optic cables because undersea fiber optic cables are the backbone of the internet, carrying 95% of all telecommunications traffic for personal and business use. Moreover, Philippines is poised to be next hyperscaler hub in APAC because too many opportunities for investments and partnerships await the hyperscaler and data center firms who want to invest in the country, which ultimately increases the demand for undersea fiber optic cables in APAC. In APAC, India holds around 15% of Facebook’s global consumer base and is the largest market for Facebook globally. For a country of a billion people with around 400 million users on Facebook, the demand for data center capacity increases. As a result, in order to meet the exponential capacity demand, as well as to interconnect data centers with the lowest latency, the demand for undersea fiber optic cables increases. Asia-Pacific undersea fiber optic cable market is segmented on the basis of cable type, insulation type, end use industry, by country, and by company. Based on cable type, the market is further fragmented into loose tube, ribbon tube, micro loose tube, and others. Loose Tube is the dominating cable design in the Asia-Pacific Undersea Fiber Optic Cable Market, accounting for a share of 48.05% in 2021 and growing at a CAGR of 17.01% during the forecast period.
The loose tube cables are proven to be the best solution for harsh environmental conditions outdoors because they offer the best protection for the fibers under high pulling tensions and can be easily protected from moisture with water-blocking gel or tapes. Additionally, the central loose tube offers labor reduction in cable installation and is eco-friendly. Furthermore, the fast access technology used in loose tube cables can reduce cable access times by up to 60%, allowing the customer to remove the thin film with an easy-to-access ripcord easily.
Based on insulation type, the market is further segmented into cross-linked polyethylene, oil-impregnated paper, resin-impregnated paper, and others. Cross-Linked Polyethylene is the dominating insulation type in the Asia-Pacific Undersea Fiber Optic Cable Market, accounting for a share of 75.92% in 2021 and growing at a CAGR of 16.76% during the forecast period. Cross-linking can solve plumbing problems at a lower cost and is sometimes easier to install. It is more cost-effective than traditional solutions. Due to increased construction and infrastructure activities, the number of telecommunication companies is rapidly growing, increasing the demand for cross-Linked Polyethylene for insulation. Key market players in the Asia-Pacific undersea fiber optic cable market include NEC Corporation, Fujitsu Limited, SubCom, LLC., Alcatel Submarine Networks, Huawei Marine Networks Technologies Co., Limited, Communication Cable Systems Indonesia, Ciena Corporation, Norddeutsche Seekabelwerke GmbH, Ocean Cables, Xtera, S. B. Submarine Systems Co., Ltd., Orange Marine “China is the dominating country in the Asia-Pacific Undersea Fiber Optic Cable Market, accounting for a share of 40.57% in 2021 and growing at a CAGR of 15.21% during the forecast period. China has initiated a five-year plan for the information and communication industry to develop a competitive international capability in constructing and maintaining undersea fiber optic cables. Furthermore, in the "Made in China 2025" plan, the Chinese government outlined a specific road map aimed at capturing 60% of the global fiber optic market within the next four years, which will positively impact the Asia-Pacific Undersea Fiber Optic Cable Market. Chinese telecommunication state-owned enterprises (SOEs) have begun taking part in major international consortia to build submarine cables, which will likely increase the demand for underwater fiber optic cables in Asia-Pacific.” said Mr. Karan Chechi, Research Director with TechSci Research, a research based global management consulting firm.
Sample Data - Snapshot 2017 2018 2019 2020 2021 2022E 2023F 2024F 2025F 2026F 2027F Asia-Pacific Undersea Fiber Optic Cable Market Size, By Value (USD Million), 2017-2027F CAGR 2017-2021 By Value: XXX CAGR 2022E-2027F By Value: XXX China Undersea Fiber Optic Cable Market Share, By Cable Design, By Value, 2017-2027F 2017 2018 2019 2020 2021 2022E 2023F 2024F 2025F 2026F 2027F Singapore Undersea Fiber Optic Cable Market Share, By End-Use Industry, By Value, 2017-2027F 2017 2018 2019 2020 2021 2022E 2023F 2024F 2025F 2026F 2027F

Report Ordering 4 Report Name: ASIA-PACIFIC UNDERSEA FIBER OPTIC CABLE MARKET FORECAST AND OPPORTUNITIES 2017 – 2027 To View Sample OR Purchase Report License Type Price Single User License $4900 Multi-User License $5900 Custom Research License $8900
About Us & Disclaimer
TechSci Research is a global market research and consulting company with offices in the US, UK and India. TechSci Research provides market research reports in number of areas to organizations. The company uses innovative business models that focus on improving productivity, while ensuring creation of high-quality reports. The proprietary forecasting models use various analyses of both industry-specific and macroeconomic variables on a state-by-state basis to produce a unique ‘bottom-up’ model of a country, regional and global industry prospects. Combined with the detailed analysis of company activity and industry trends, the result is a uniquely rich evaluation of the opportunities available in the market.
Related Reports
• Microduct Cable Market - Global Industry Size, Share, Trends, Opportunity, and Forecast, 2017-2027 By Installation Environment (Direct Buried, Duct/Direct Install, Aerial, Indoor), By Type (Smoothwall, Corrugated, Ribbed), By Duct Type (Thick-Walled Ducts, Tight Protected Ducts), By Diameter (Up to 5mm, 5-10mm, 10-15mm, Above 15mm), By Material (PVC, HDPE, Nylon, Others), By Application (Electrification, Transmission Network Development, Telecoms, Automotive, Construction, Others), By Region
• Asia-Pacific Wi-Fi Analytics Market By Component (Solutions and Services), By Deployment Type (On-Premise and Cloud), By Location (Indoor and Outdoor), By Application, By Industry, By Country, Competition Forecast & Opportunities, 2013-2023
TechSci Research – North America 708 Third Avenue, Manhattan, New York, United States
Tel: +1- 646- 360- 1656
Email: sales@techsciresearch.com www.techsciresearch.com Disclaimer
TechSci Research – Europe 54, Old brook, Bretton, Peterborough, United Kingdom Email: sales@techsciresearch.com www.techsciresearch.com
TechSci Research – Asia-Pacific B – 44, Sector – 57, Noida, National Capital Region, U.P. - India Tel: +91-120-4523900 Email: sales@techsciresearch.com www.techsciresearch.com
The contents of this report are based on information generally available to the public from sources believed to be reliable. No representation is made that it is timely, accurate or complete. TechSci Research has taken due care and caution in compilation of data as this has been obtained from various sources including which it considers reliable and firsthand. However, TechSci Research does not guarantee the accuracy, adequacy or completeness of any information and it is not responsible for any errors or omissions or for the results obtained from the use of such information and especially states that it has no financial liability whatsoever to the subscribers / users of this report. The information herein, together with all estimates and forecasts, can change without notice. All the figures provided in this document are indicative of relative market size and are strictly for client’s internal consumption. Usage of the same for purpose other than internal will require prior approval of TechSci Research.