TEXAS ECOSYSTEM SERVICES: A STATEWIDE ASSESSMENT


OCTOBER 2022


Putman, A., R. Lopez, L. Smith, J. Uzquiano, A. Lund, D. Anderson, J. Gan, C. Ellis, J. Roberts, C. Kneuper, L. Ziehr and C. Ross. 2022. Texas ecosystem services: A statewide assessment Texas A&M Natural Resources Institute, Research Report Number 2022 1 College Station, Texas, USA

Alison Lund; alison lund@ag tamu edu
The diverse landscapes in Texas are comprised of many ecosystems providing vital goods, services, and public benefits. These commodities of nature, defined as ecosystem services, are the set of functions or products benefitting human wellbeing, encompassing many life sustaining products such as climate regulation, air purification, and pollination Many ecosystem services are traditionally considered free to society For example, everyone enjoys clean air, clean water, and flood control provided by healthy forests, rangelands, and wetland ecosystems Although an important component of natural landscapes, ecosystem services typically lack formal market structures, and their associated
benefits are difficult to quantify or appropriately value. As a result, the contributions and importance of ecosystem services are often overlooked by the general public, government leaders, and those involved in land use decision making. With an increasing global demand for natural resources, the Millennium Ecosystem Assessment (MEA), initiated in 2001 by the United Nations, assessed the consequences of ecosystem disruption and the associated goods and services they provided to communities The MEA report categorized ecosystem services into four groups defined as provisioning, regulating, cultural, and supporting services.
Claudia "Lady Bird" JohnsonThe environment is where we all meet, where we all have a mutual interest; it is the one thing all of us share...
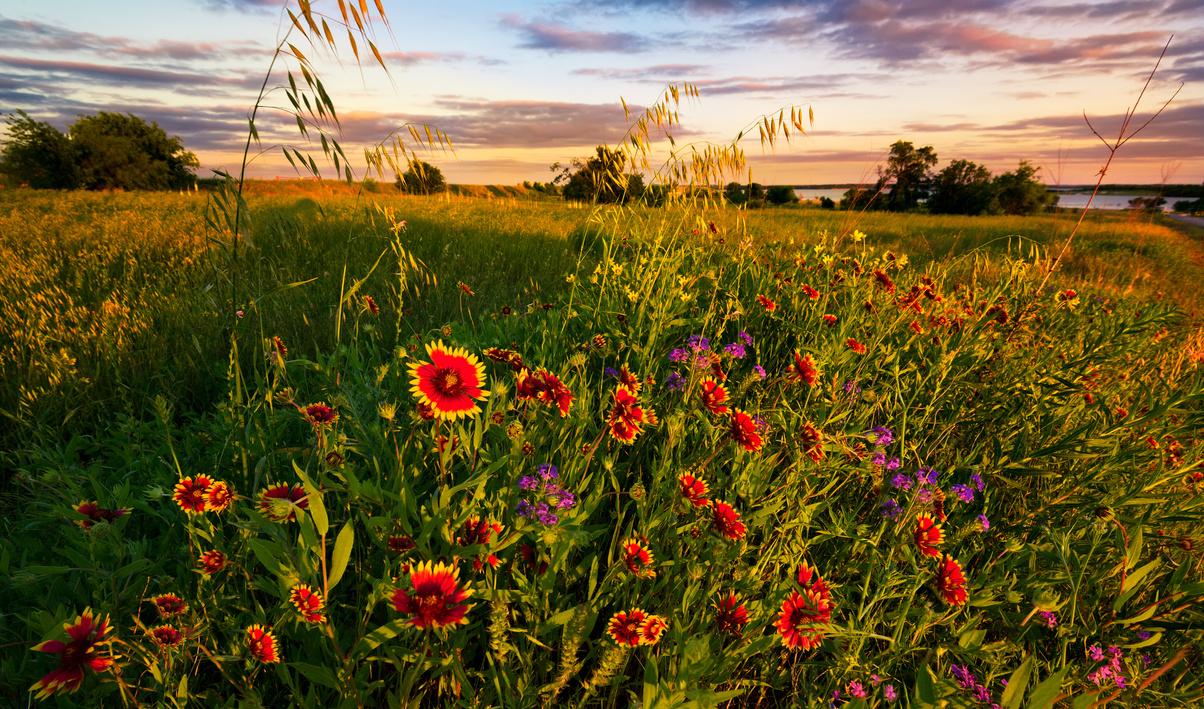
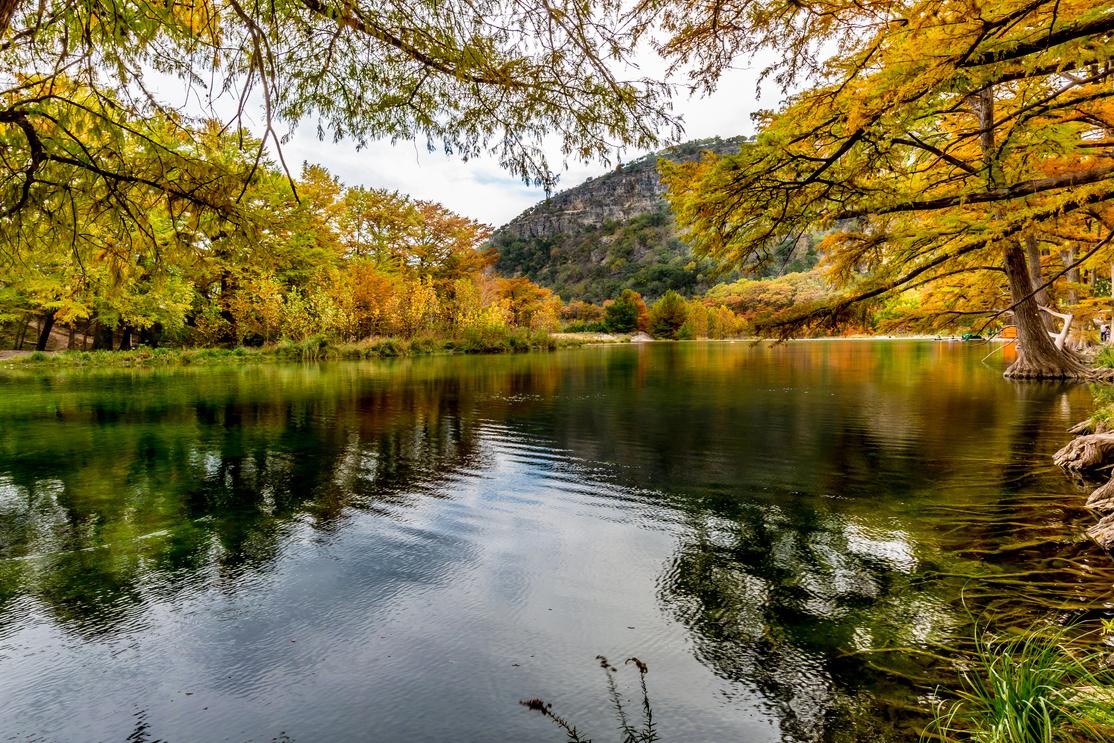
Promoting the long term sustainability and stewardship of natural resources begins with a basic understanding of ecosystem services and their public benefits and, ideally, the ability to assign monetary value can illustrate the importance of contributions to society This information can serve to support land conservation strategies and policies to promote the conservation of open spaces and natural resources In this report, we describe open spaces as working lands, or privately owned farms, ranches, and forests that produce food and fiber, support rural economies, and provide wildlife habitat, clean air and water, and recreational opportunities These lands constitute the majority of the undeveloped, rural land mass in Texas
Provisioning services
Tangible goods that society extracts from nature, such as food, fuel, fiber, and biomass, and serve as vital contributors to local and regional economies These services often possess well developed markets and valuation systems
Benefits obtained from the regulation of ecosystem processes to include the improvement of water quality, air pollution removal, flood mitigation, and erosion control. Regulating services are much harder to value, as they are less tangible and difficult to quantify or measure.
Cultural services These services are difficult to quantify and assign market values, and typically include non material benefits obtained from nature such as recreation, spiritual enrichment, tourism, and aesthetic experiences This category of services emphasizes the significance and importance of nature to human well being and experiences
Important ecological functions such as soil formation, nutrient cycling, and photosynthesis, which collectively form the foundation for provisioning, regulating, and cultural services.
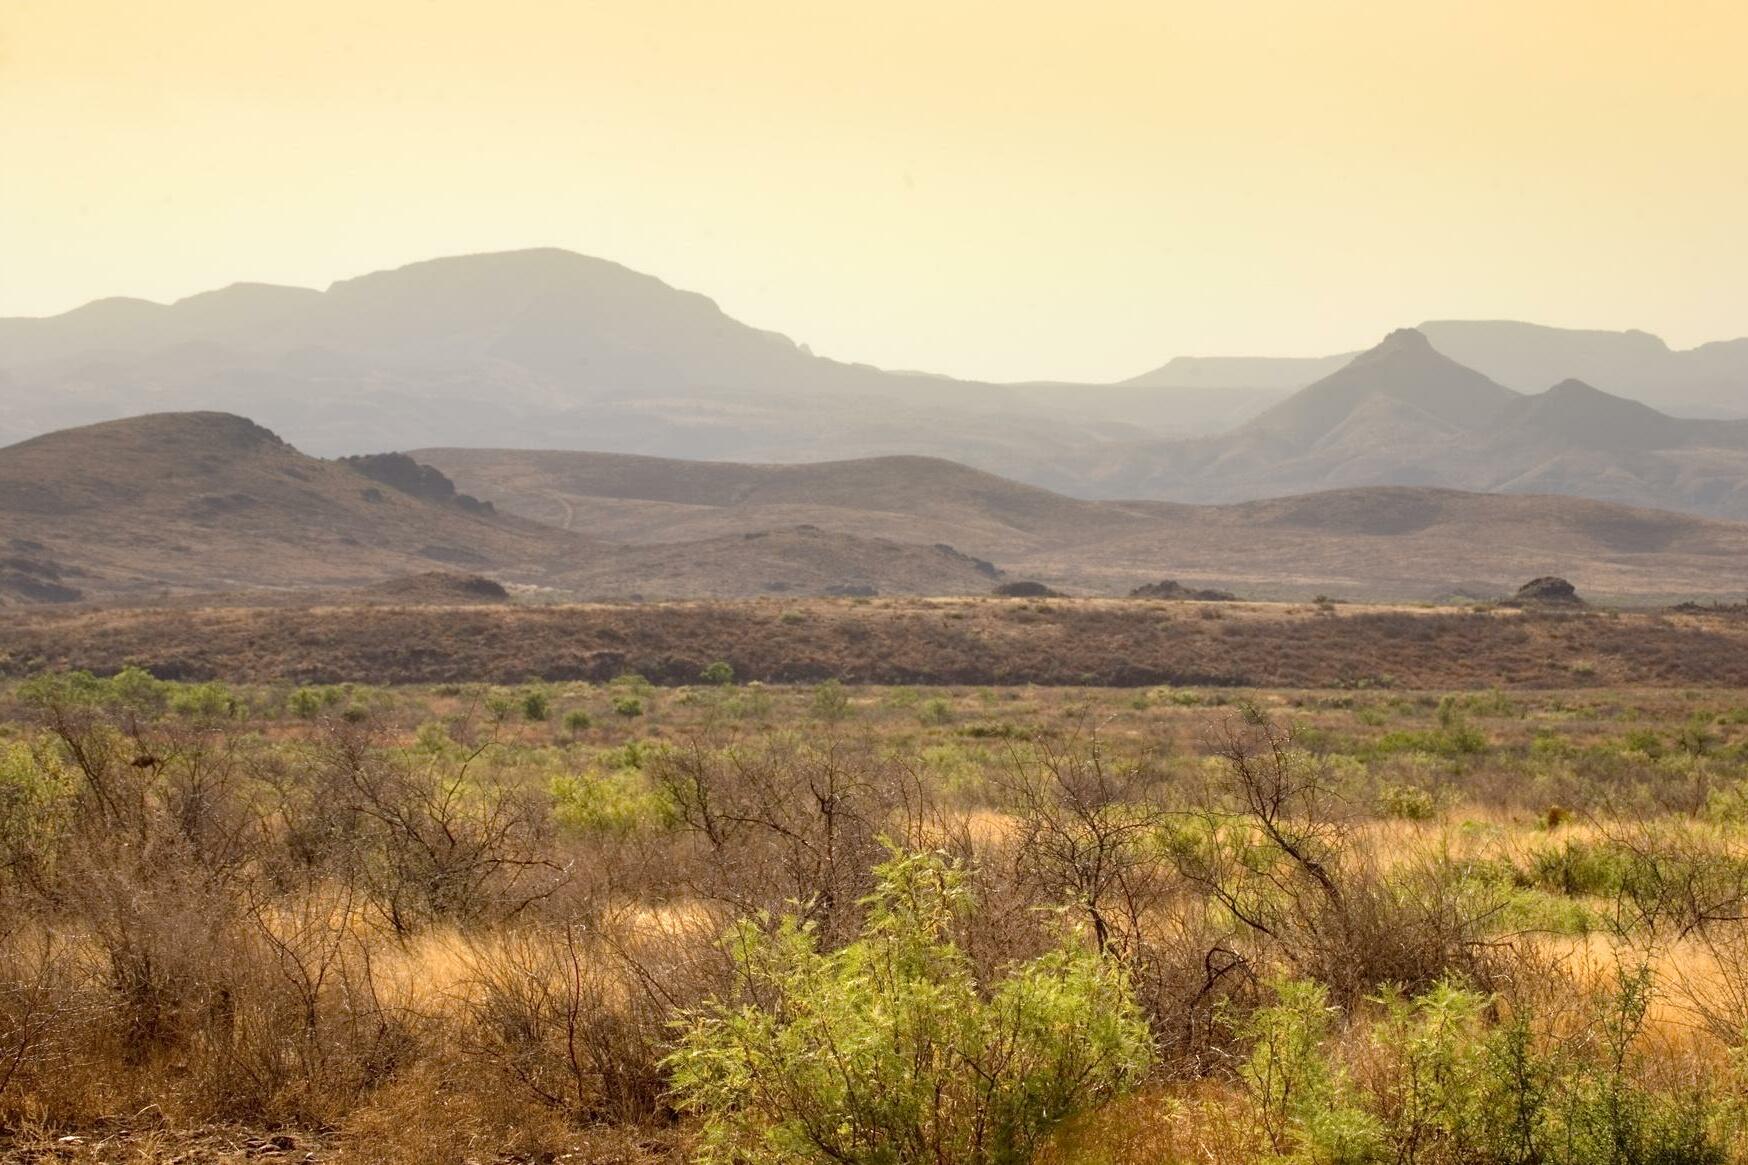
Texas has a rich history of land stewardship across generations that contributes to the ongoing production and conservation of ecosystem goods and services for the 30+ million citizens within the state While 82% of the state’s entire land area is classified as privately owned rural land, or working land (i e , 141 million acres of farms, ranches, and forests), Texas is also home to seven of the top 15 most rapidly growing cities in the nation. Rapid population growth, suburbanization, and rural development have increased the
demand for working lands and their associated benefits Working land loss across the state over the last 20 years has garnered attention for increased efforts to protect the vital natural resources and land infrastructure of Texas, however, not without considerable challenge The total economic value of Texas working lands is difficult to define. Thus, the objectives of this report are to (1) provide examples of broad ecosystem services, and (2) estimate their relative economic value or level of current investments.
We identified 11 ecosystem services through extensive literature review on approaches to estimating ecosystem services at state or region wide scales. Traditionally, a benefits transfer method is used to estimate ecosystem service values by transferring available information or values from original, similar studies. Applying a benefits transfer approach for this study was not possible for all selected metrics due to data limitations and/or lack of availability. Instead, we used market based estimates from the Texas Comptroller of Public Accounts and the Texas Water Development Board (TWDB) where appropriate, and willingness to pay estimates from established federal field scale or operation level conservation programs through the Natural Resources Conservation Service (Table 1)
5 6 7 8
Table 1 Eleven Texas ecosystem services by category, data source and valuation method
Food and Fiber Production Provisioning Texas Comptroller of Public Accounts
Water Quantity (Replacement) Supporting Texas Water Development Board
Market-based
Recreation (Consumptive Hunting) Cultural Texas Comptroller of Public Accounts
Water Quantity (Improvement) Supporting Natural Resources Conservation Service
Water Quality Supporting Natural Resources Conservation Service
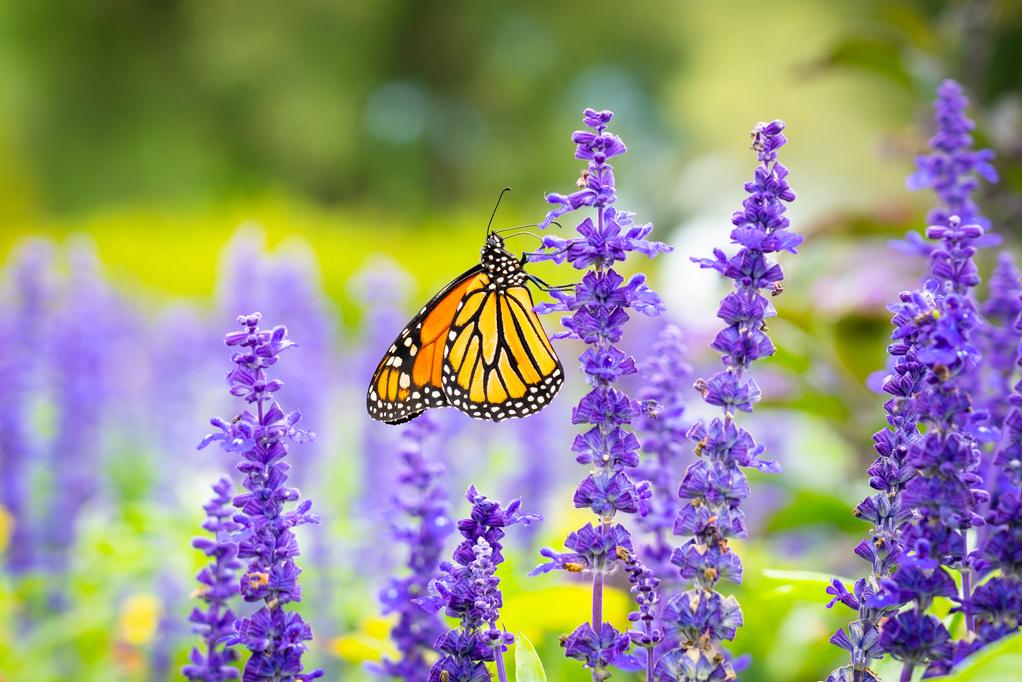
Wildlife Habitat and Biodiversity Supporting Natural Resources Conservation Service
Erosion Control Regulating Natural Resources Conservation Service
Flood Mitigation Regulating Natural Resources Conservation Service
Air Quality and Air Pollution Removal Regulating Natural Resources Conservation Service
Willingnessto pay
Carbon Storage and Sequestration Regulating Natural Resources Conservation Service
Recreation (Non Consumptive) Cultural Natural Resources Conservation Service
Market based estimates utilize current financial mechanisms to calculate the market value of an ecosystem service. For example, food and fiber production are tangible products that are already included in a traditional market system where people regularly come to buy and sell these goods and services. Existing data can tell us how much a crop is worth and what it contributes to our market economy. Market based estimates utilize this existing data what we know we already pay to assign values to ecosystem services
In contrast, a willingness to pay model utilizes the maximum value a consumer is willing to pay for a given good or service For the purposes of this study, we used government payments to federal landowner incentive programs to determine the level of investment of federal government programs to conserve or protect previously identified ecosystem services in Texas
Food and Fiber Production Food and fiber production as a provisioning service are the goods provided by Texas working lands that already have accessible economic value These are simple services that many Texans are already very familiar with foods such as crops and livestock, and fibers such as cotton, timber, and wool/mohair They are the tangible products we use from working lands that can be readily extrapolated to show their economic value and benefit to our state
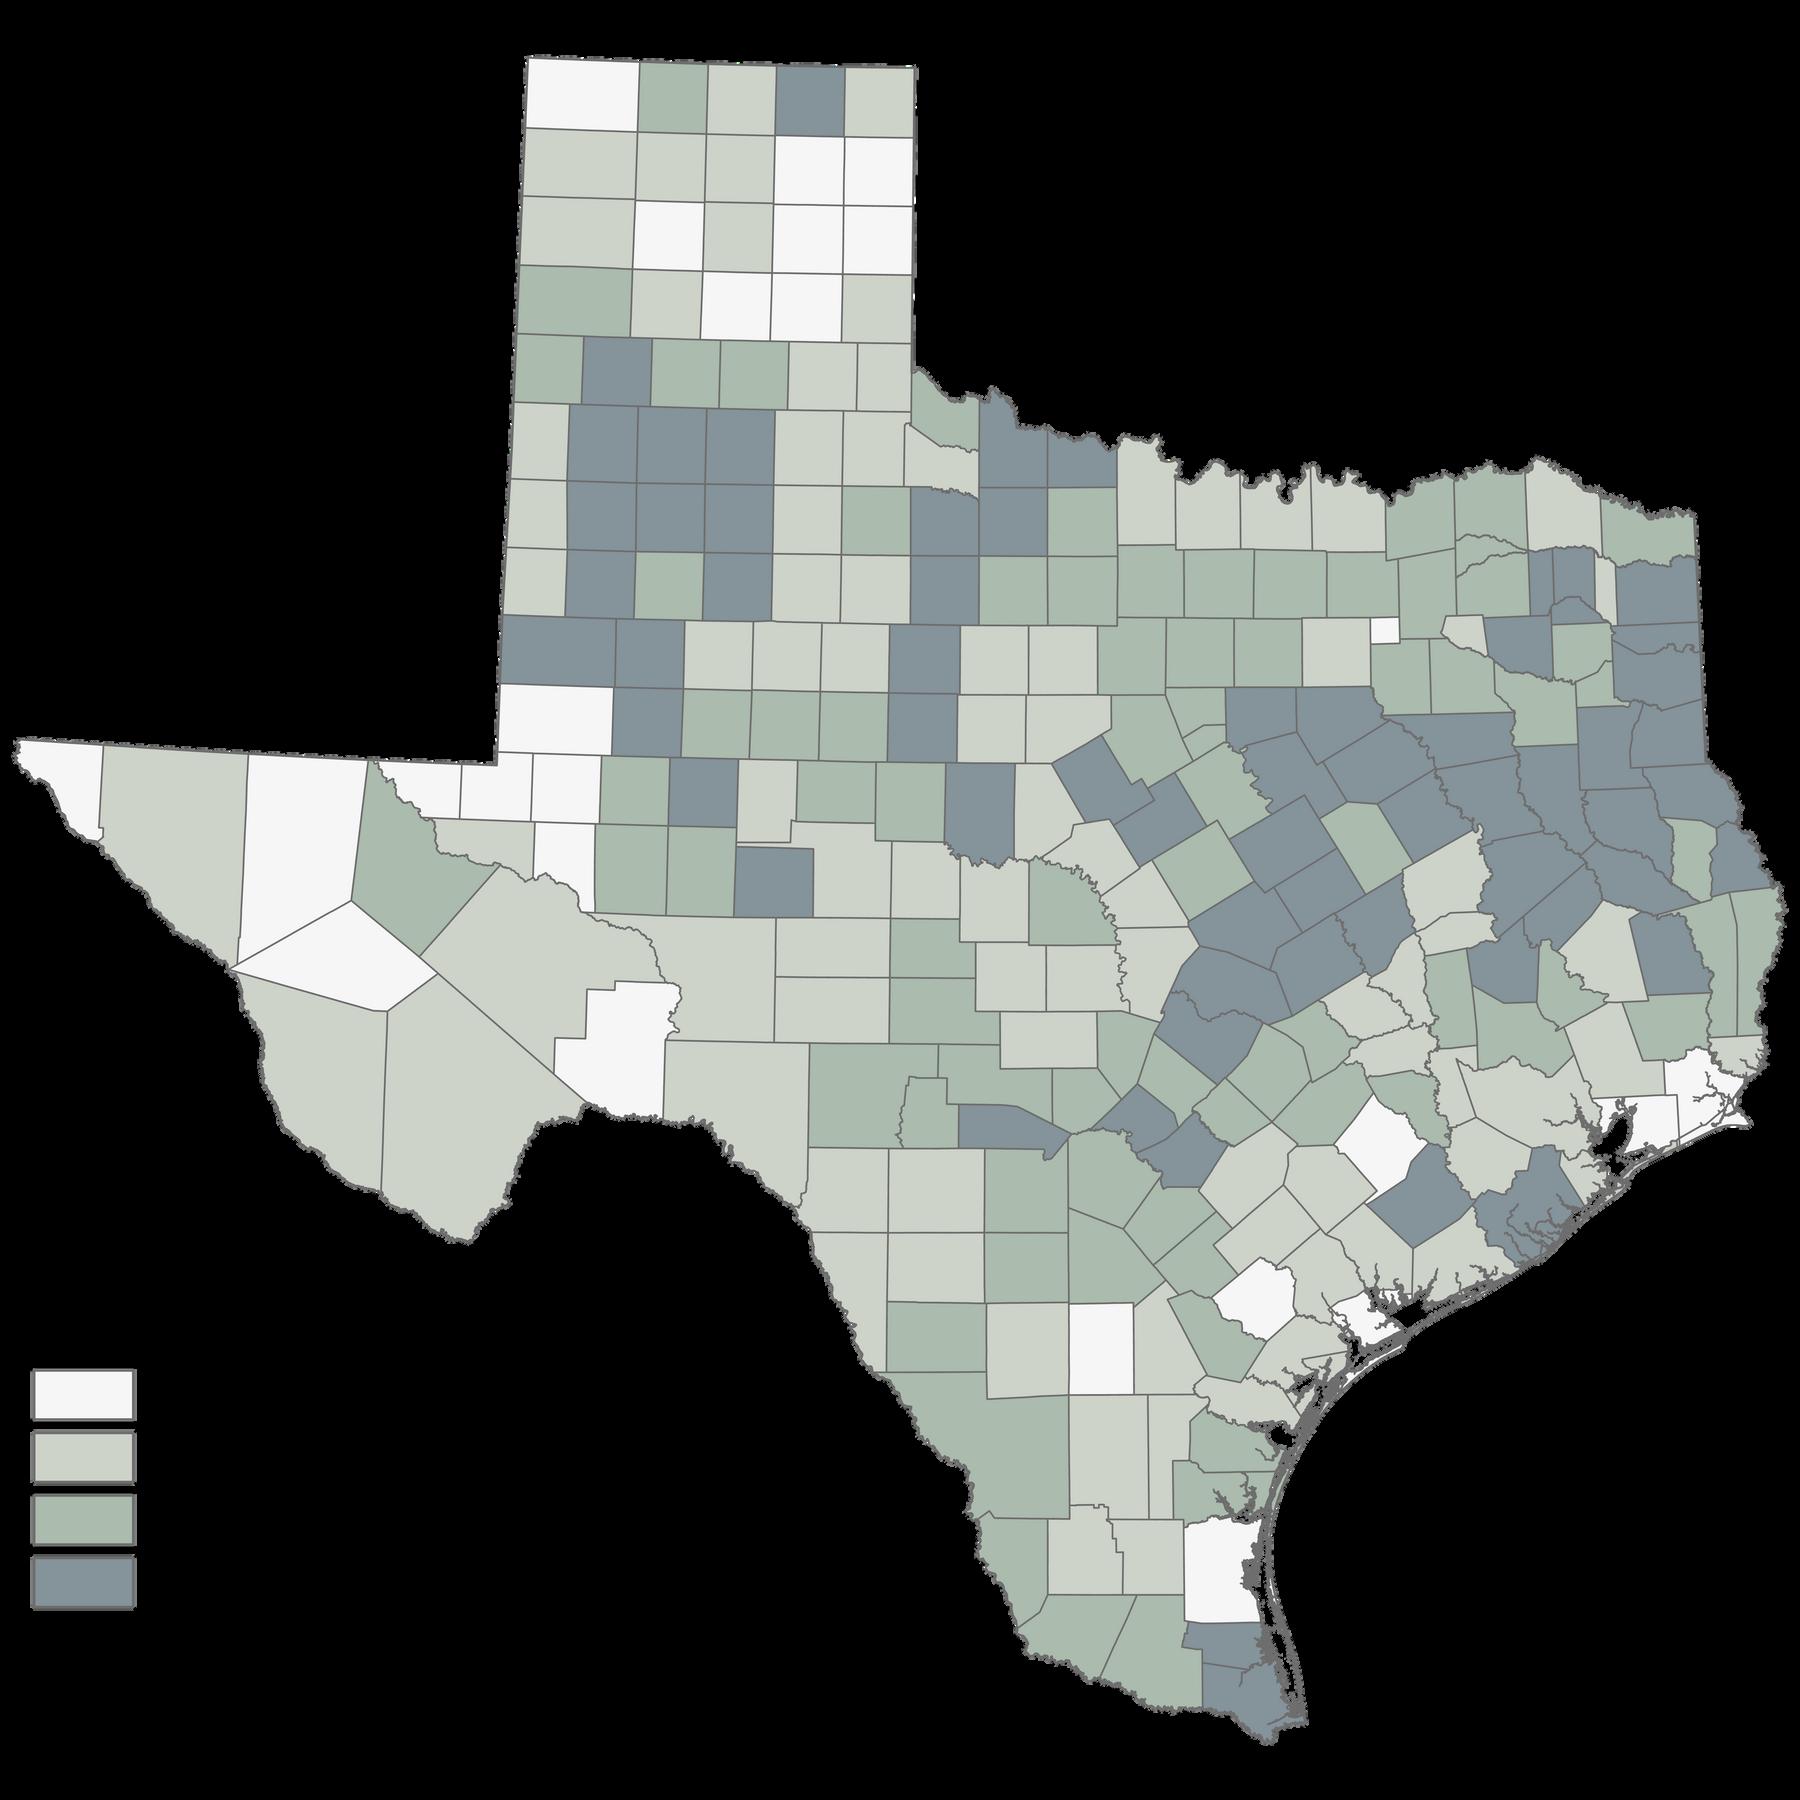
The Texas Comptroller of Public Accounts maintains yearly estimates of market and production values ($/acre) for all open space lands classified as 1 D and 1 D 1 agricultural land use appraisal. County appraisers account for only those factors associated with the land’s capacity to produce marketable agricultural products in their productivity value assessments This process requires a modified income approach that converts an estimate of the property’s income into an estimate of the property’s value using net income divided by a standard capitalization rate
9, 10, 11
Food and
Production (continued) Net incomes are based on a five year period preceding the year before the year of appraisal For example, an appraisal in 2018 was based on income from 2016 (two years before the appraisal), 2015, 2014, 2013, and 2012 (five year period preceding) A similar approach, including average annual timber prices, growth, and costs, is used for timber land productivity values Through using this dataset, we can capture the value of food and fiber production ($/acre/year) as a representative measure for the most common and productive provisioning services on working lands in Texas
Water
(Replacement) Texas working lands provide undeveloped, permeable surfaces to capture rainfall, reduce water runoff, and increase groundwater recharge. With current population projections, the latest Texas State Water Plan (2022) by the Texas Water Development Board (TWDB) emphasizes that the state will be in a nearly 6.9M acre feet water deficit by 2070. To address this shortage, $80B in water management strategies have been proposed and developed by the TWDB We used these estimates to calculate the cost of replacing potential captured water on 1 acre of working land by Texas county We summarized average annual rainfall by county and used a 50% water infiltration rate to calculate potential water capture on 1 acre of working land We then calculated the relative replacement cost of those water resources if that acre were to be developed, according to the 2022 Texas State Water Plan We divided the cost of implementing targeted water management strategies for a given region ($) by the projected yield for those strategies (acre feet) The resulting value ($/acre feet) was multiplied by the potential captured water (Ac Ft) to determine the final water replacement cost ($/acre/year) of captured water on 1 acre of working land
Recreation (Consumptive-Hunting)
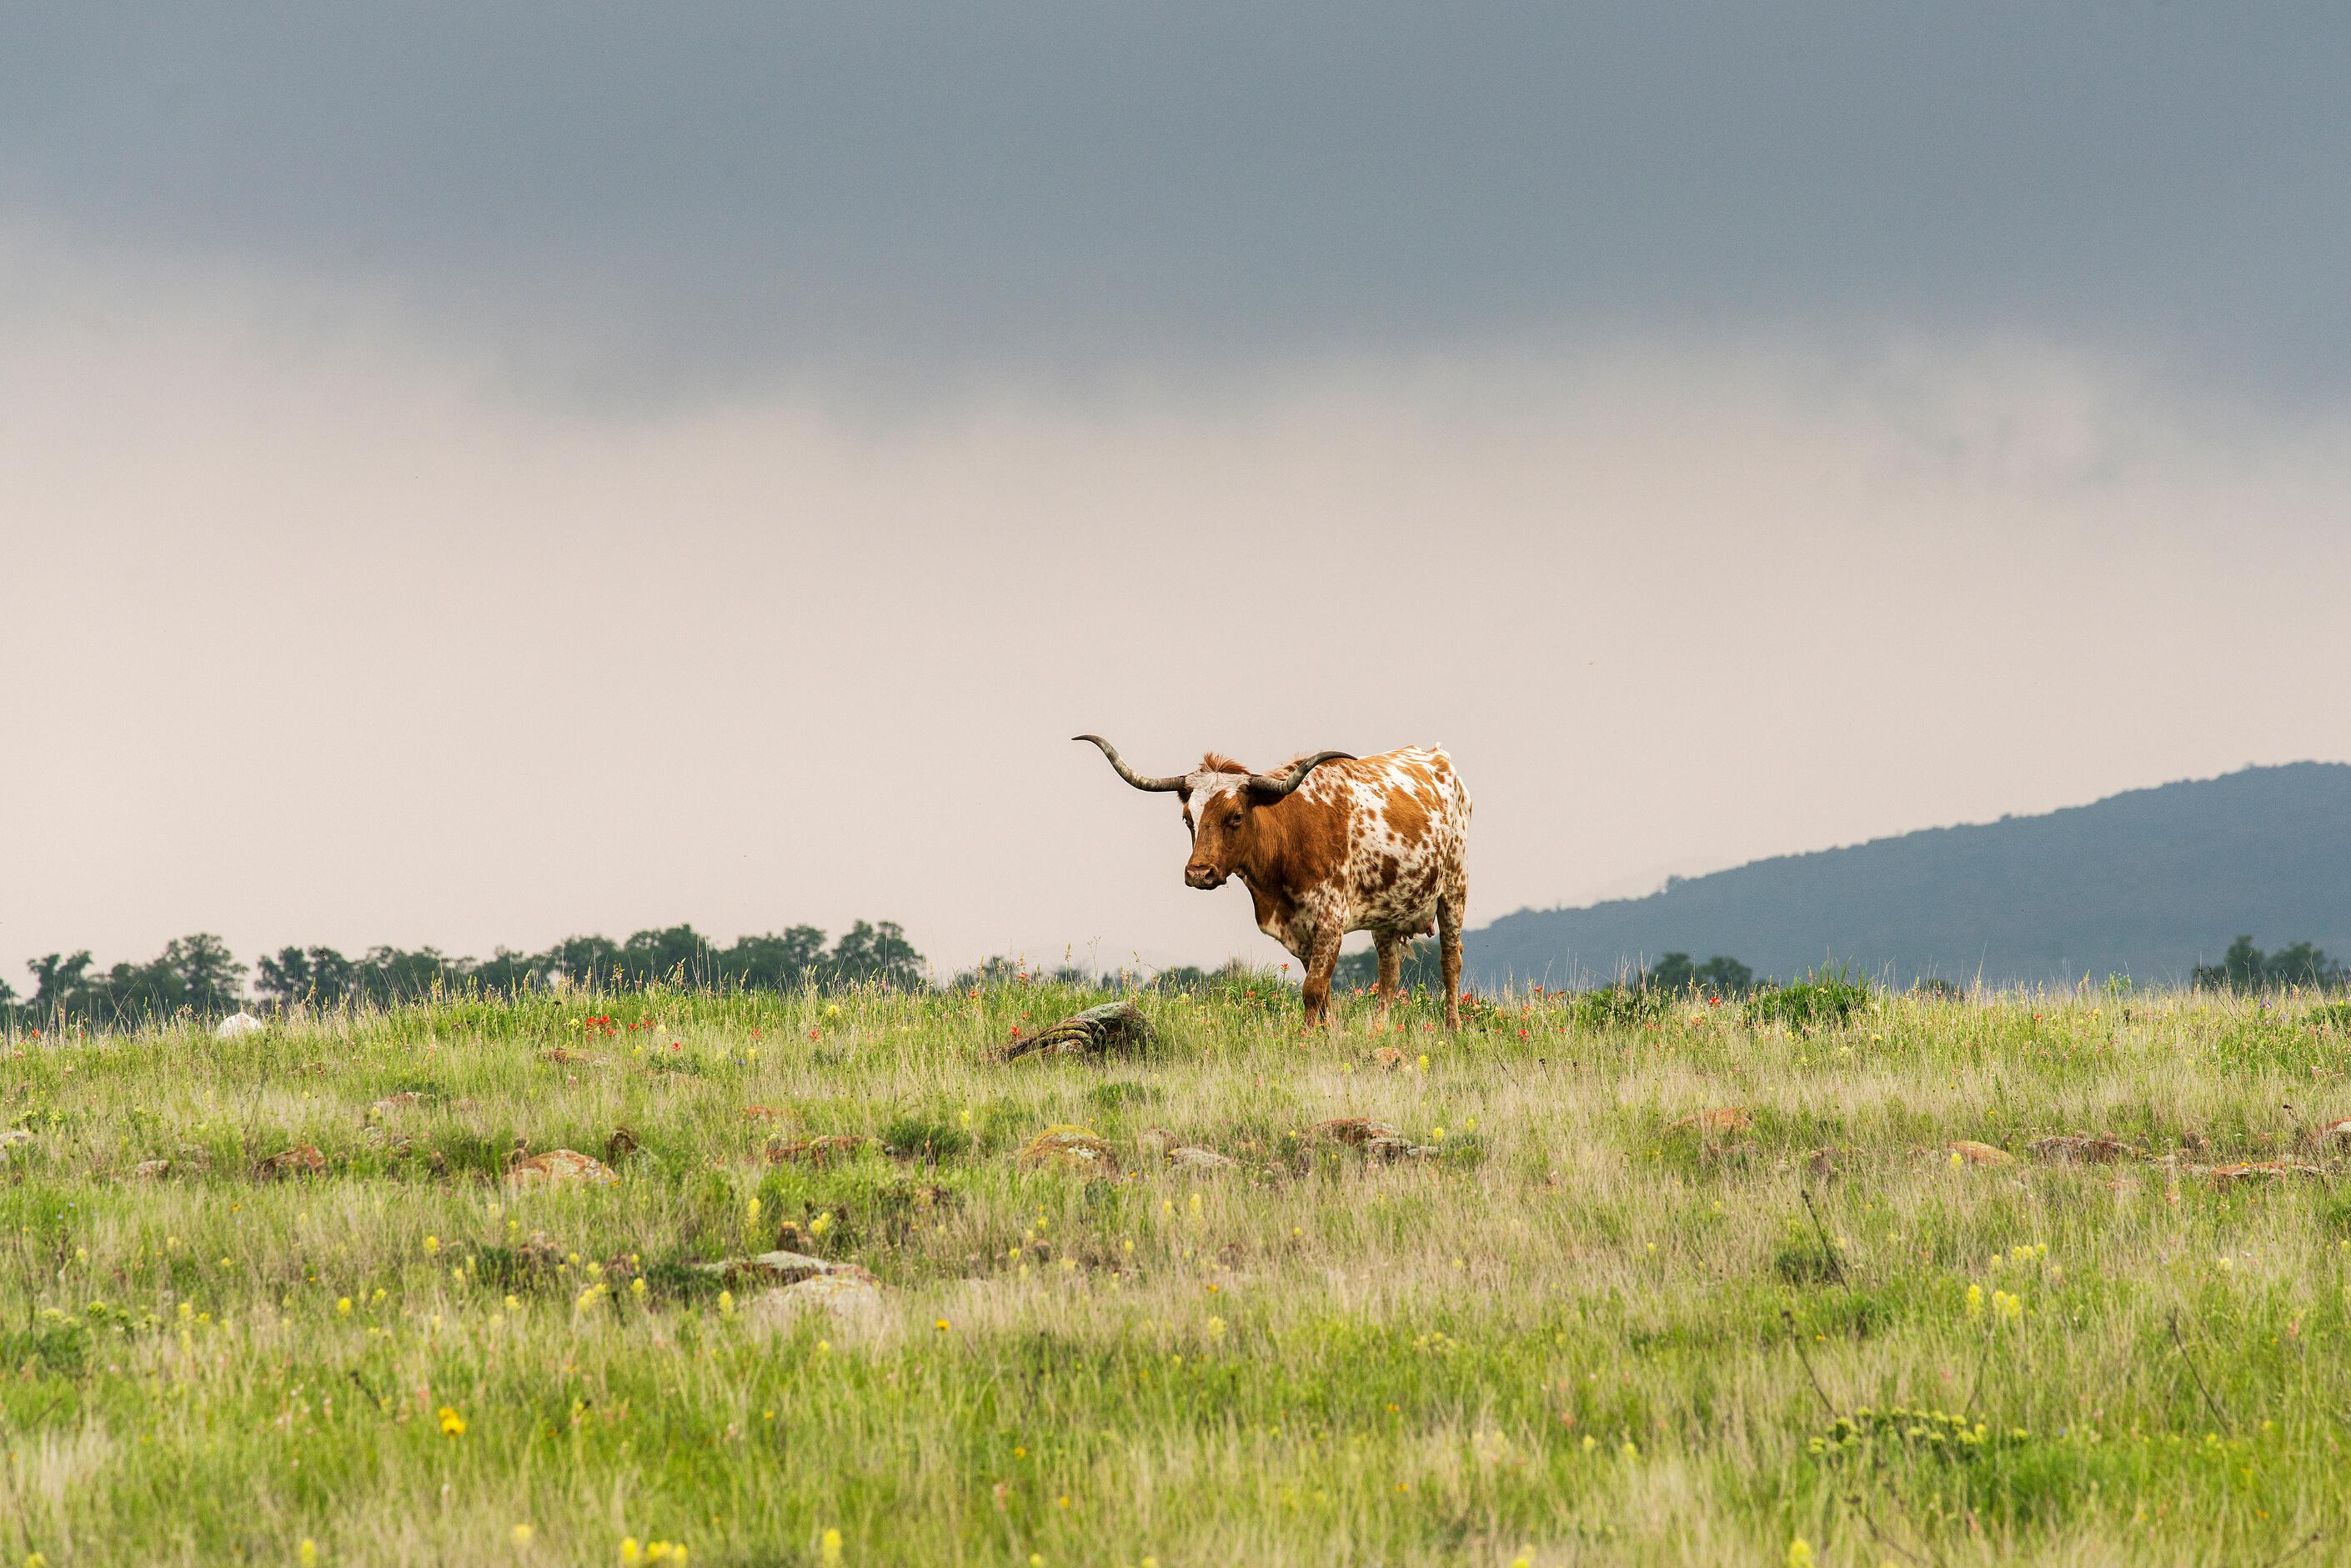
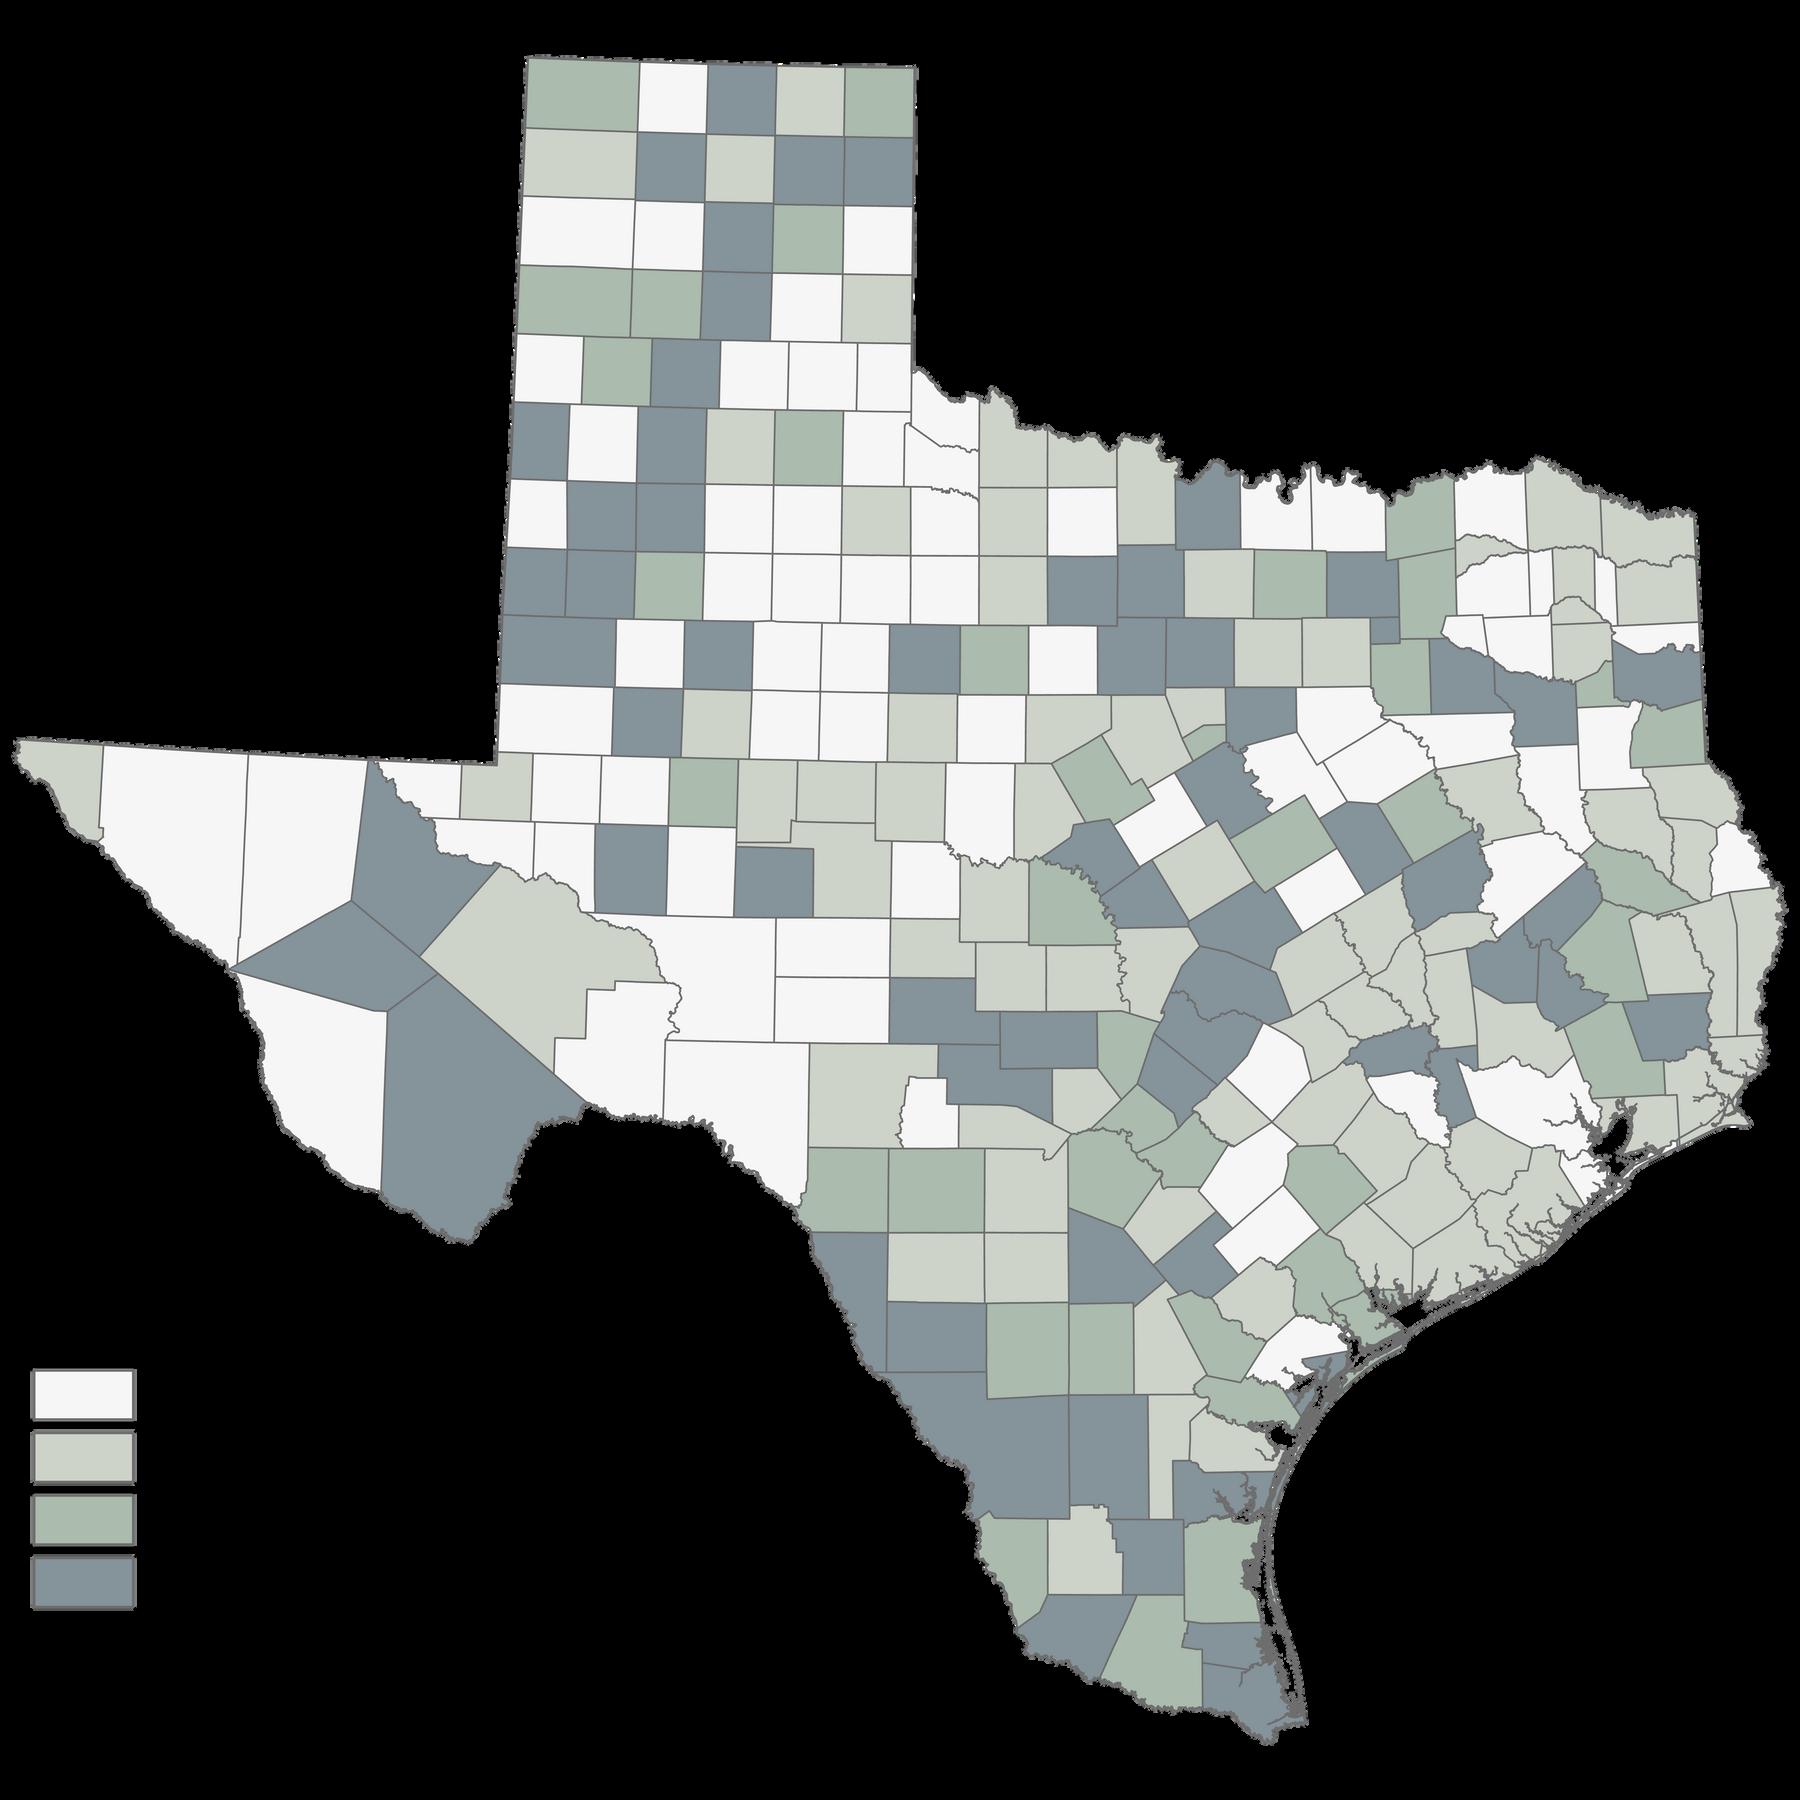
Recreational hunting and wildlife management play an important role in both the state’s economy and ecological well being. Access to hunting opportunities in the state are market based, varying by region and species hunted. The Texas Comptroller maintains data on hunting lease prices across the state (2014 2018). We used the geometric mean of hunting lease prices ($/acre) across the latest five years for each county in Texas For counties without any lease data, we used the 2018 Texas Parks and Wildlife district average This dataset provides a market based estimate of the value ($/acre/year) of hunting for each county in Texas
Willingness to pay estimates were derived from the USDA Natural Resources Conservation Service’s (NRCS) expenditures on landowner incentive programs including the Conservation Stewardship Program (CSP), Environmental Quality Incentives Program (EQIP), and the Regional Conservation Partnership Program (RCPP) from funding years 2014 and 2018 The database maintained by NRCS includes contract payments (made from 2015 2020) for 94 different conservation and land management practices to maintain, enhance, or conserve valuable ecosystem services. Leaders from NRCS regional offices weighted each conservation practice according to its relative benefit to our eight selected ecosystem services (Table 1). Conservation practice payments were divided by either the acreage it was applied to or the entire contract acreage ($/acre), depending on data availability. This value was then multiplied by the NRCS provided weight per ecosystem service to represent the value of federal program dollars spent on improving or maintaining a given ecosystem service The final calculations included an average $/acre/year value for each county for each of the eight ecosystem services listed in Table 1
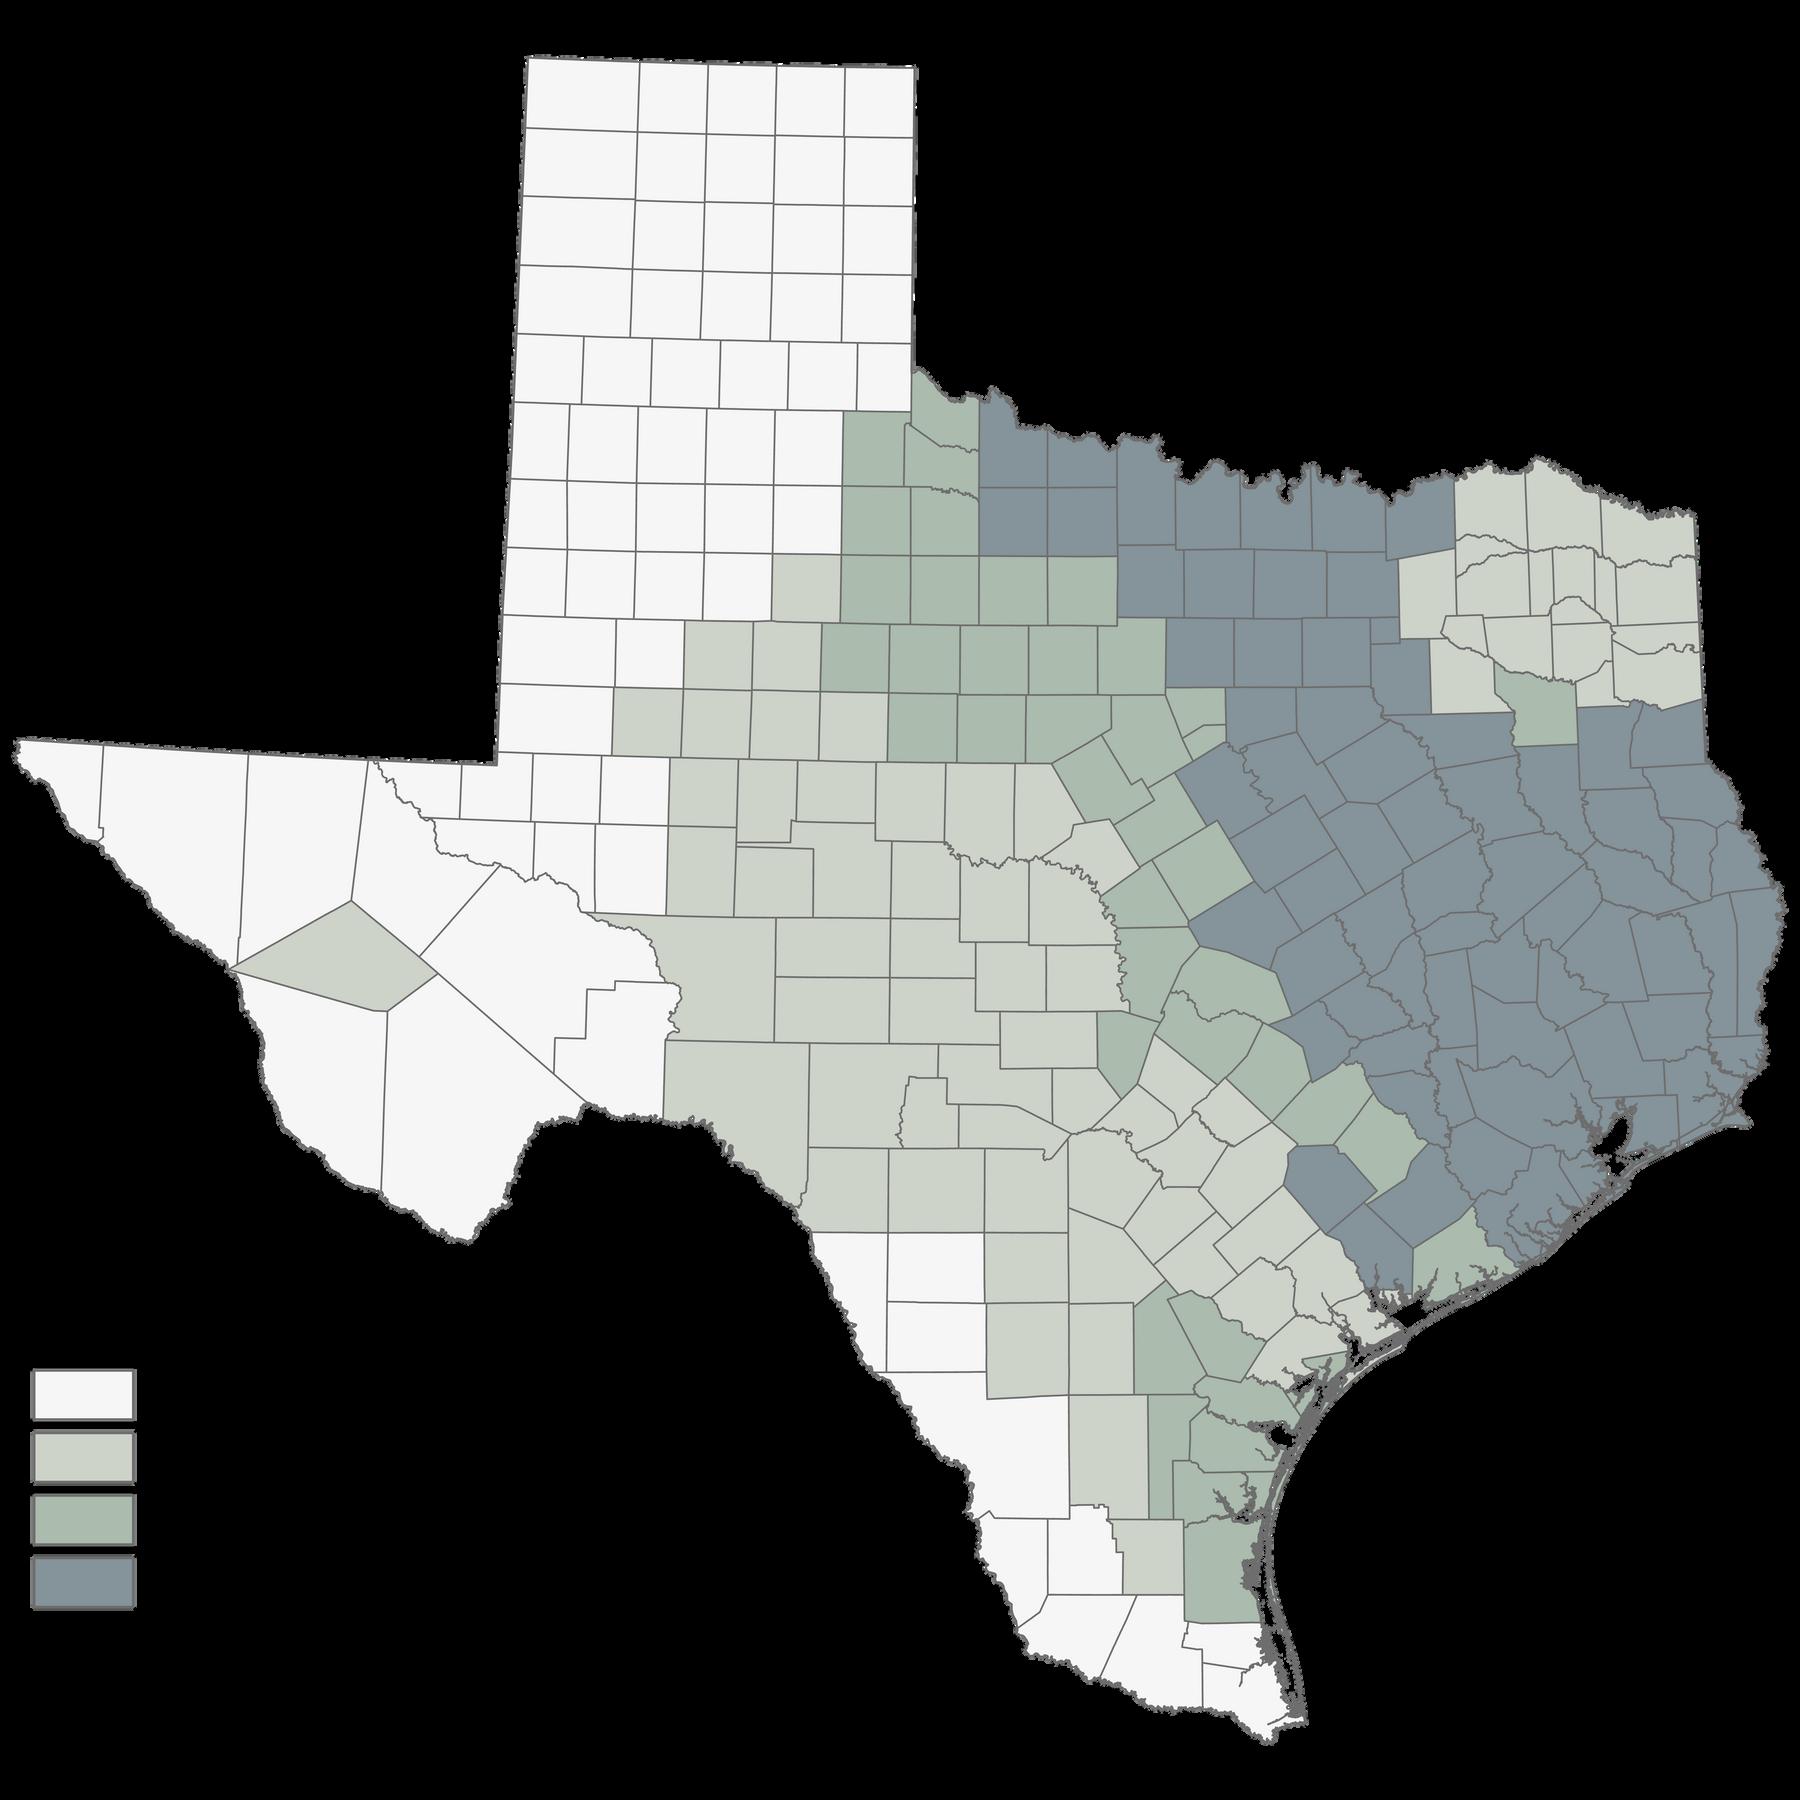
Statewide averages for each ecosystem service and category (provisioning, cultural, regulating, and supporting) are presented in Table 2 We summarized all calculated ecosystem service values to get one total ecosystem service value for Texas The following maps depict results for Texas counties for each ecosystem service calculation
Table 2 Statewide averages for each ecosystem service and category on an annual per acre basis
Provisioning Total: $103
Food and Fiber Production $103
Erosion Control $27
Flood Mitigation $22
Regulating Total: $81 Cultural Total: $22
Air Quality and Air Pollution Removal $19
Carbon Storage and Sequestration $13
Recreation (Consumptive Hunting) $9
Recreation (Non Consumptive) $12
Water Quantity (Replacement) $348
Water Quantity (Improvement) $29
Supporting Total: $423
Water Quality $30
Wildlife Habitat and Biodiversity $16
Total Ecosystem Services Value $629/acre/year
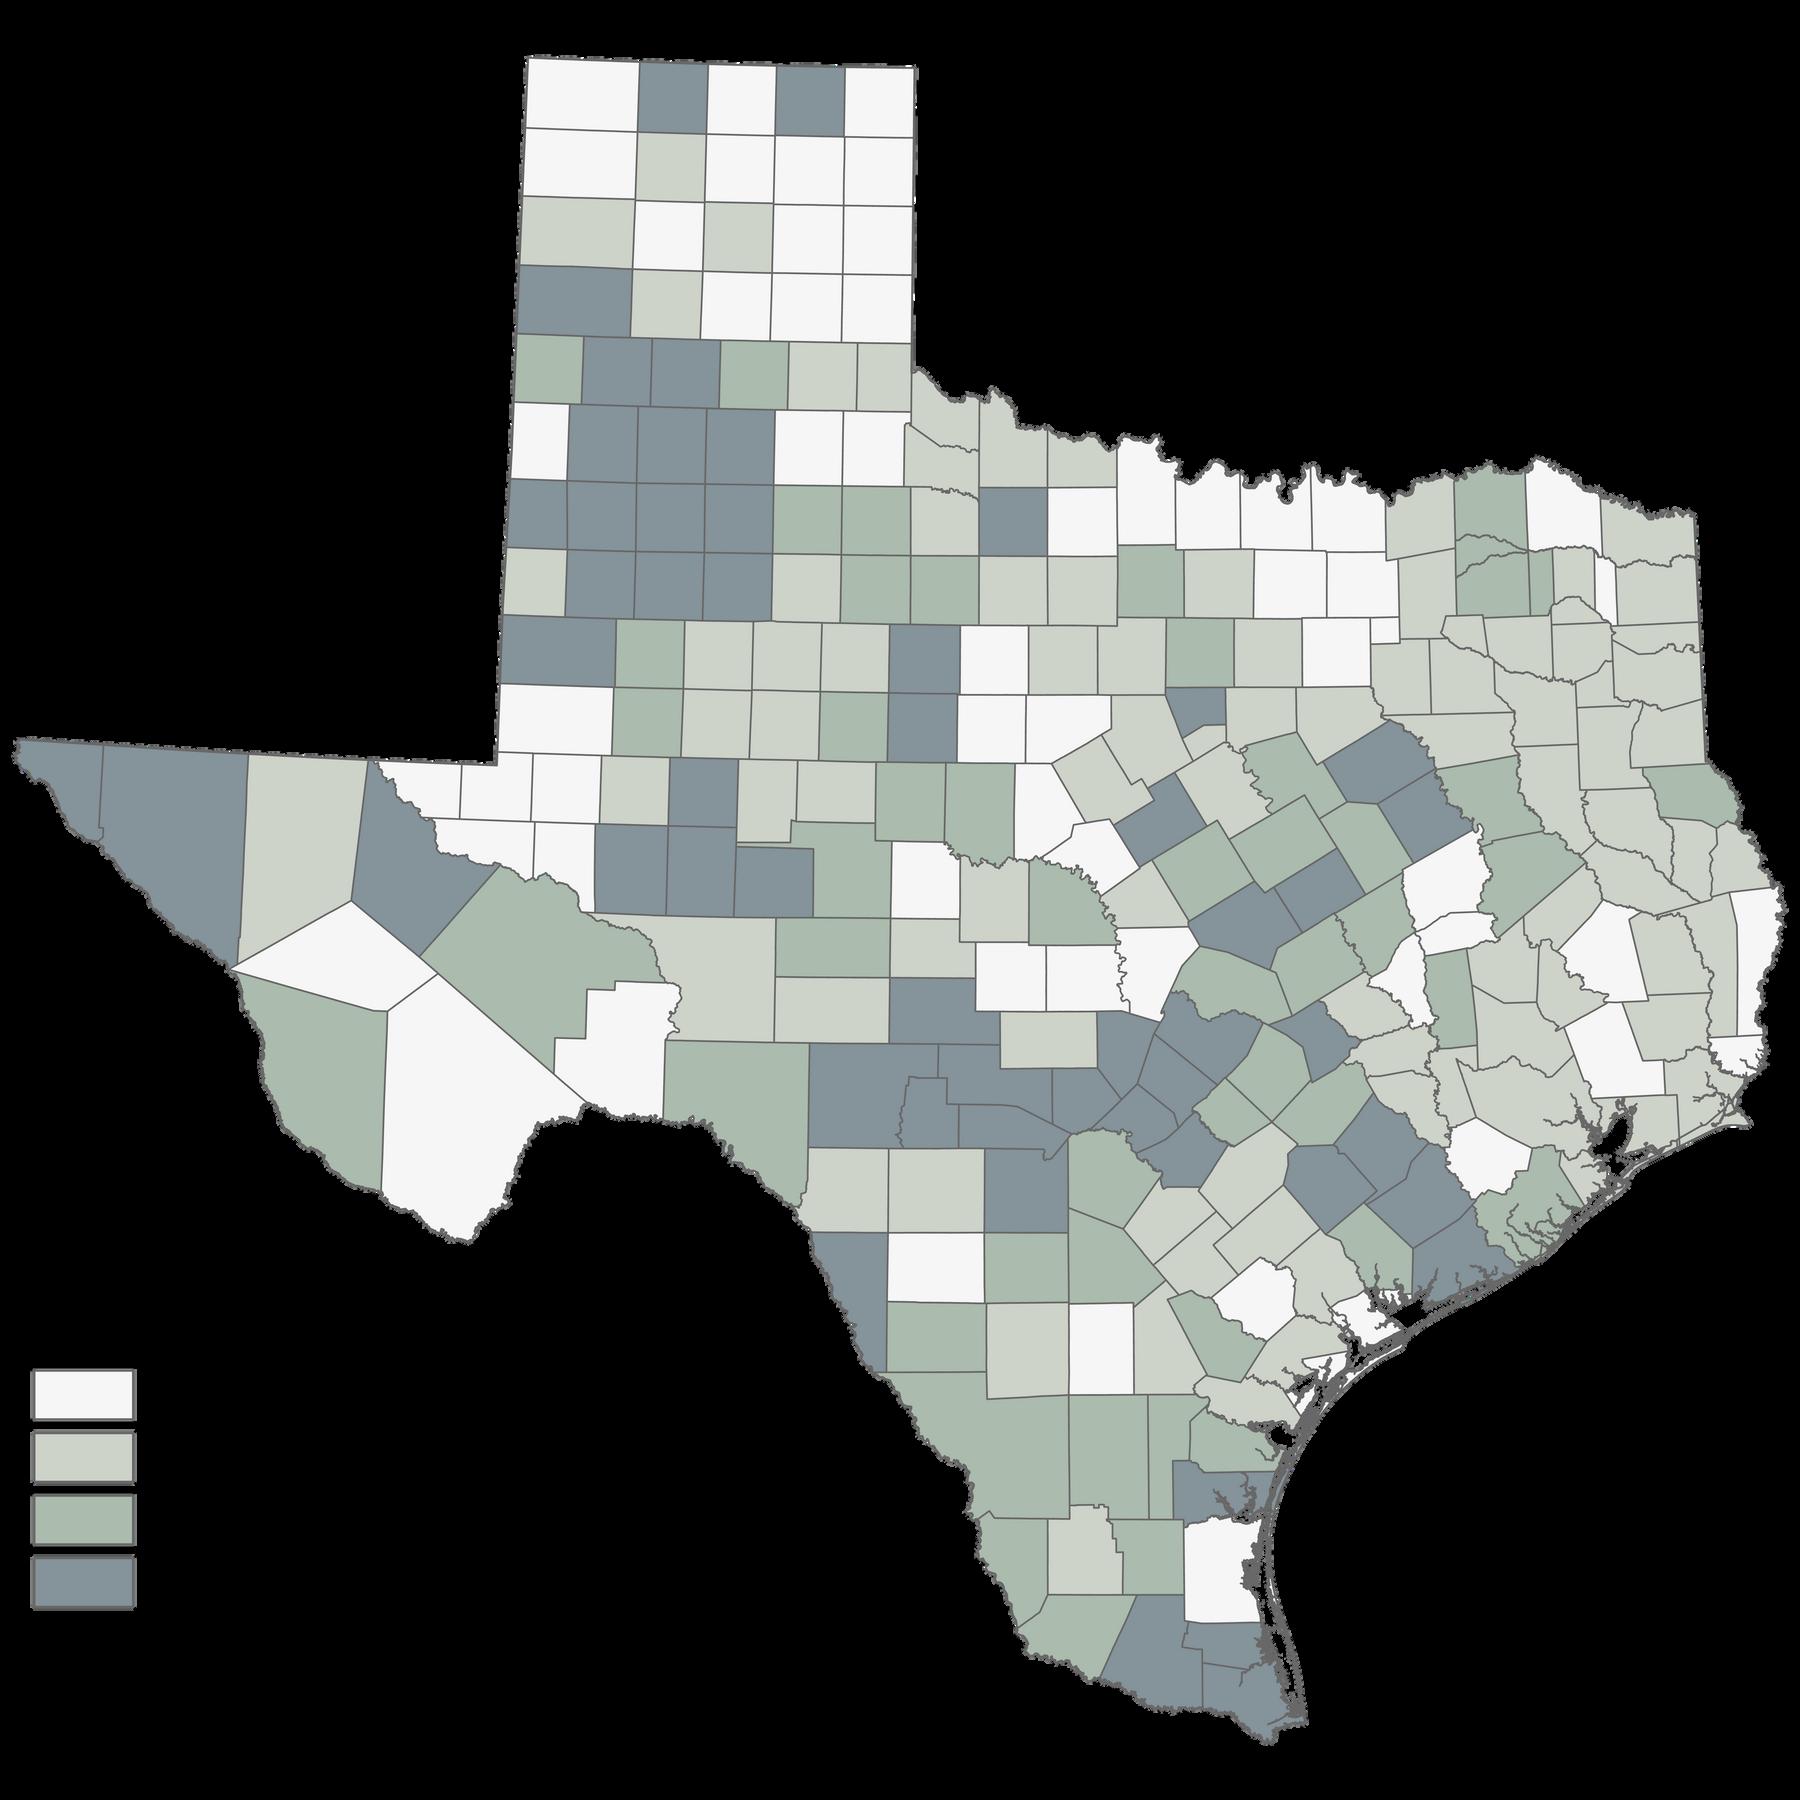
Total annual ecosystem service value ($/acre/year) by Texas county.
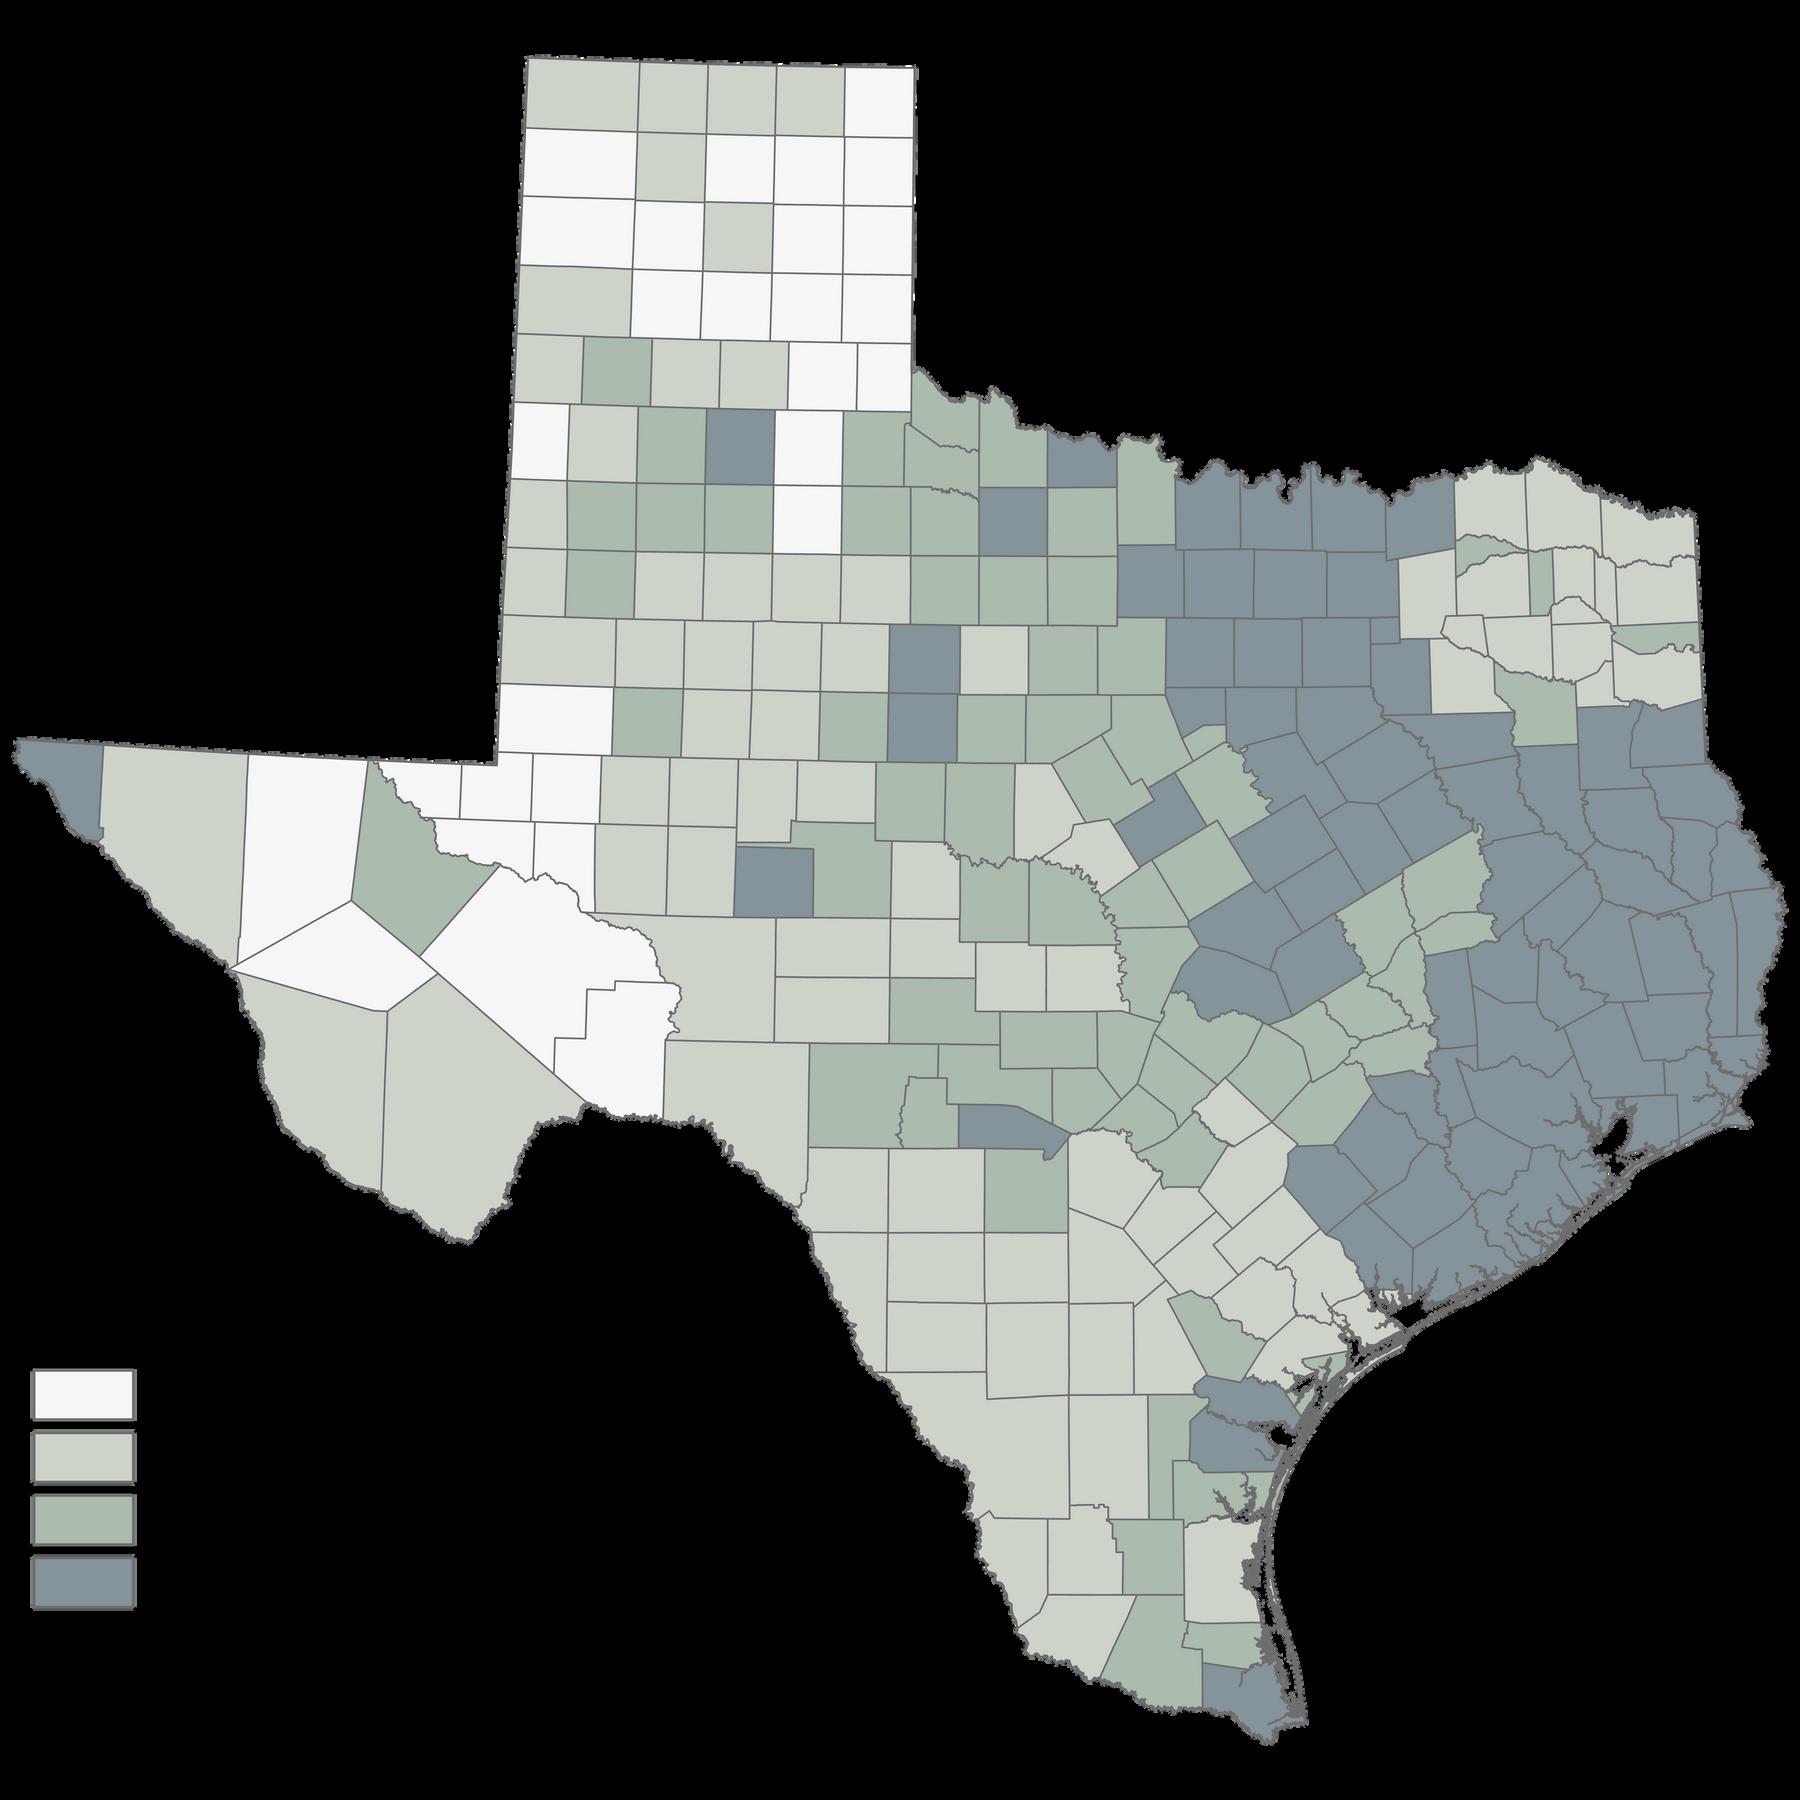
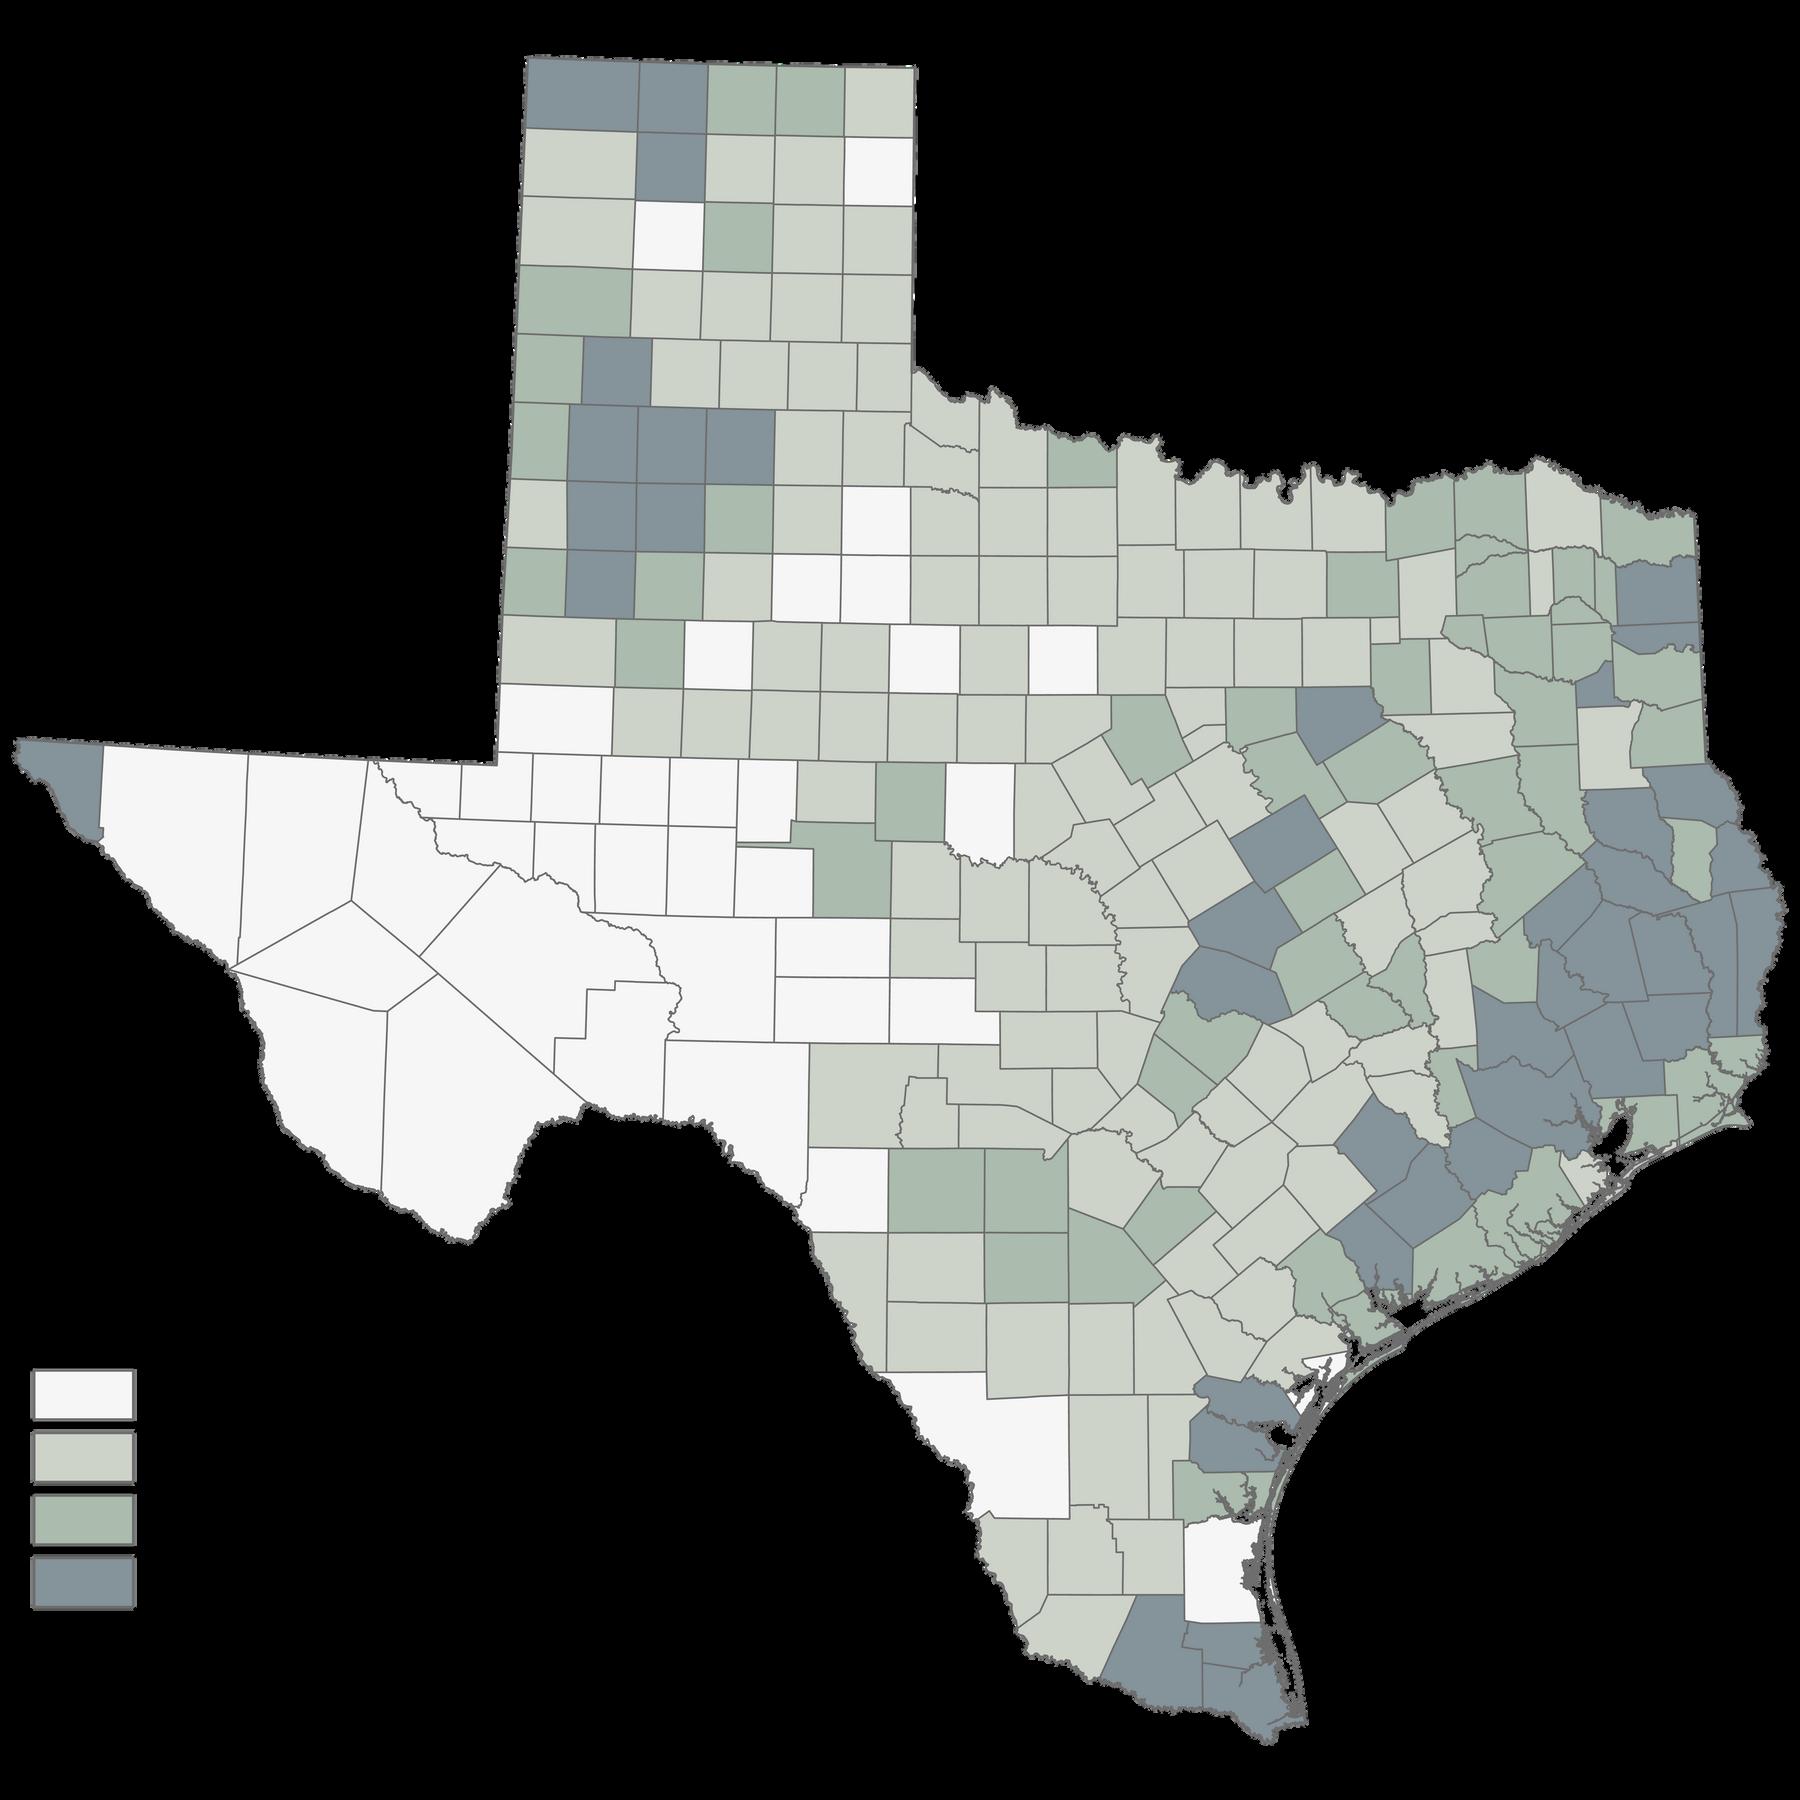
Average annual agricultural productivity value ($/acre/year) for food and fiber production by Texas county, 2017
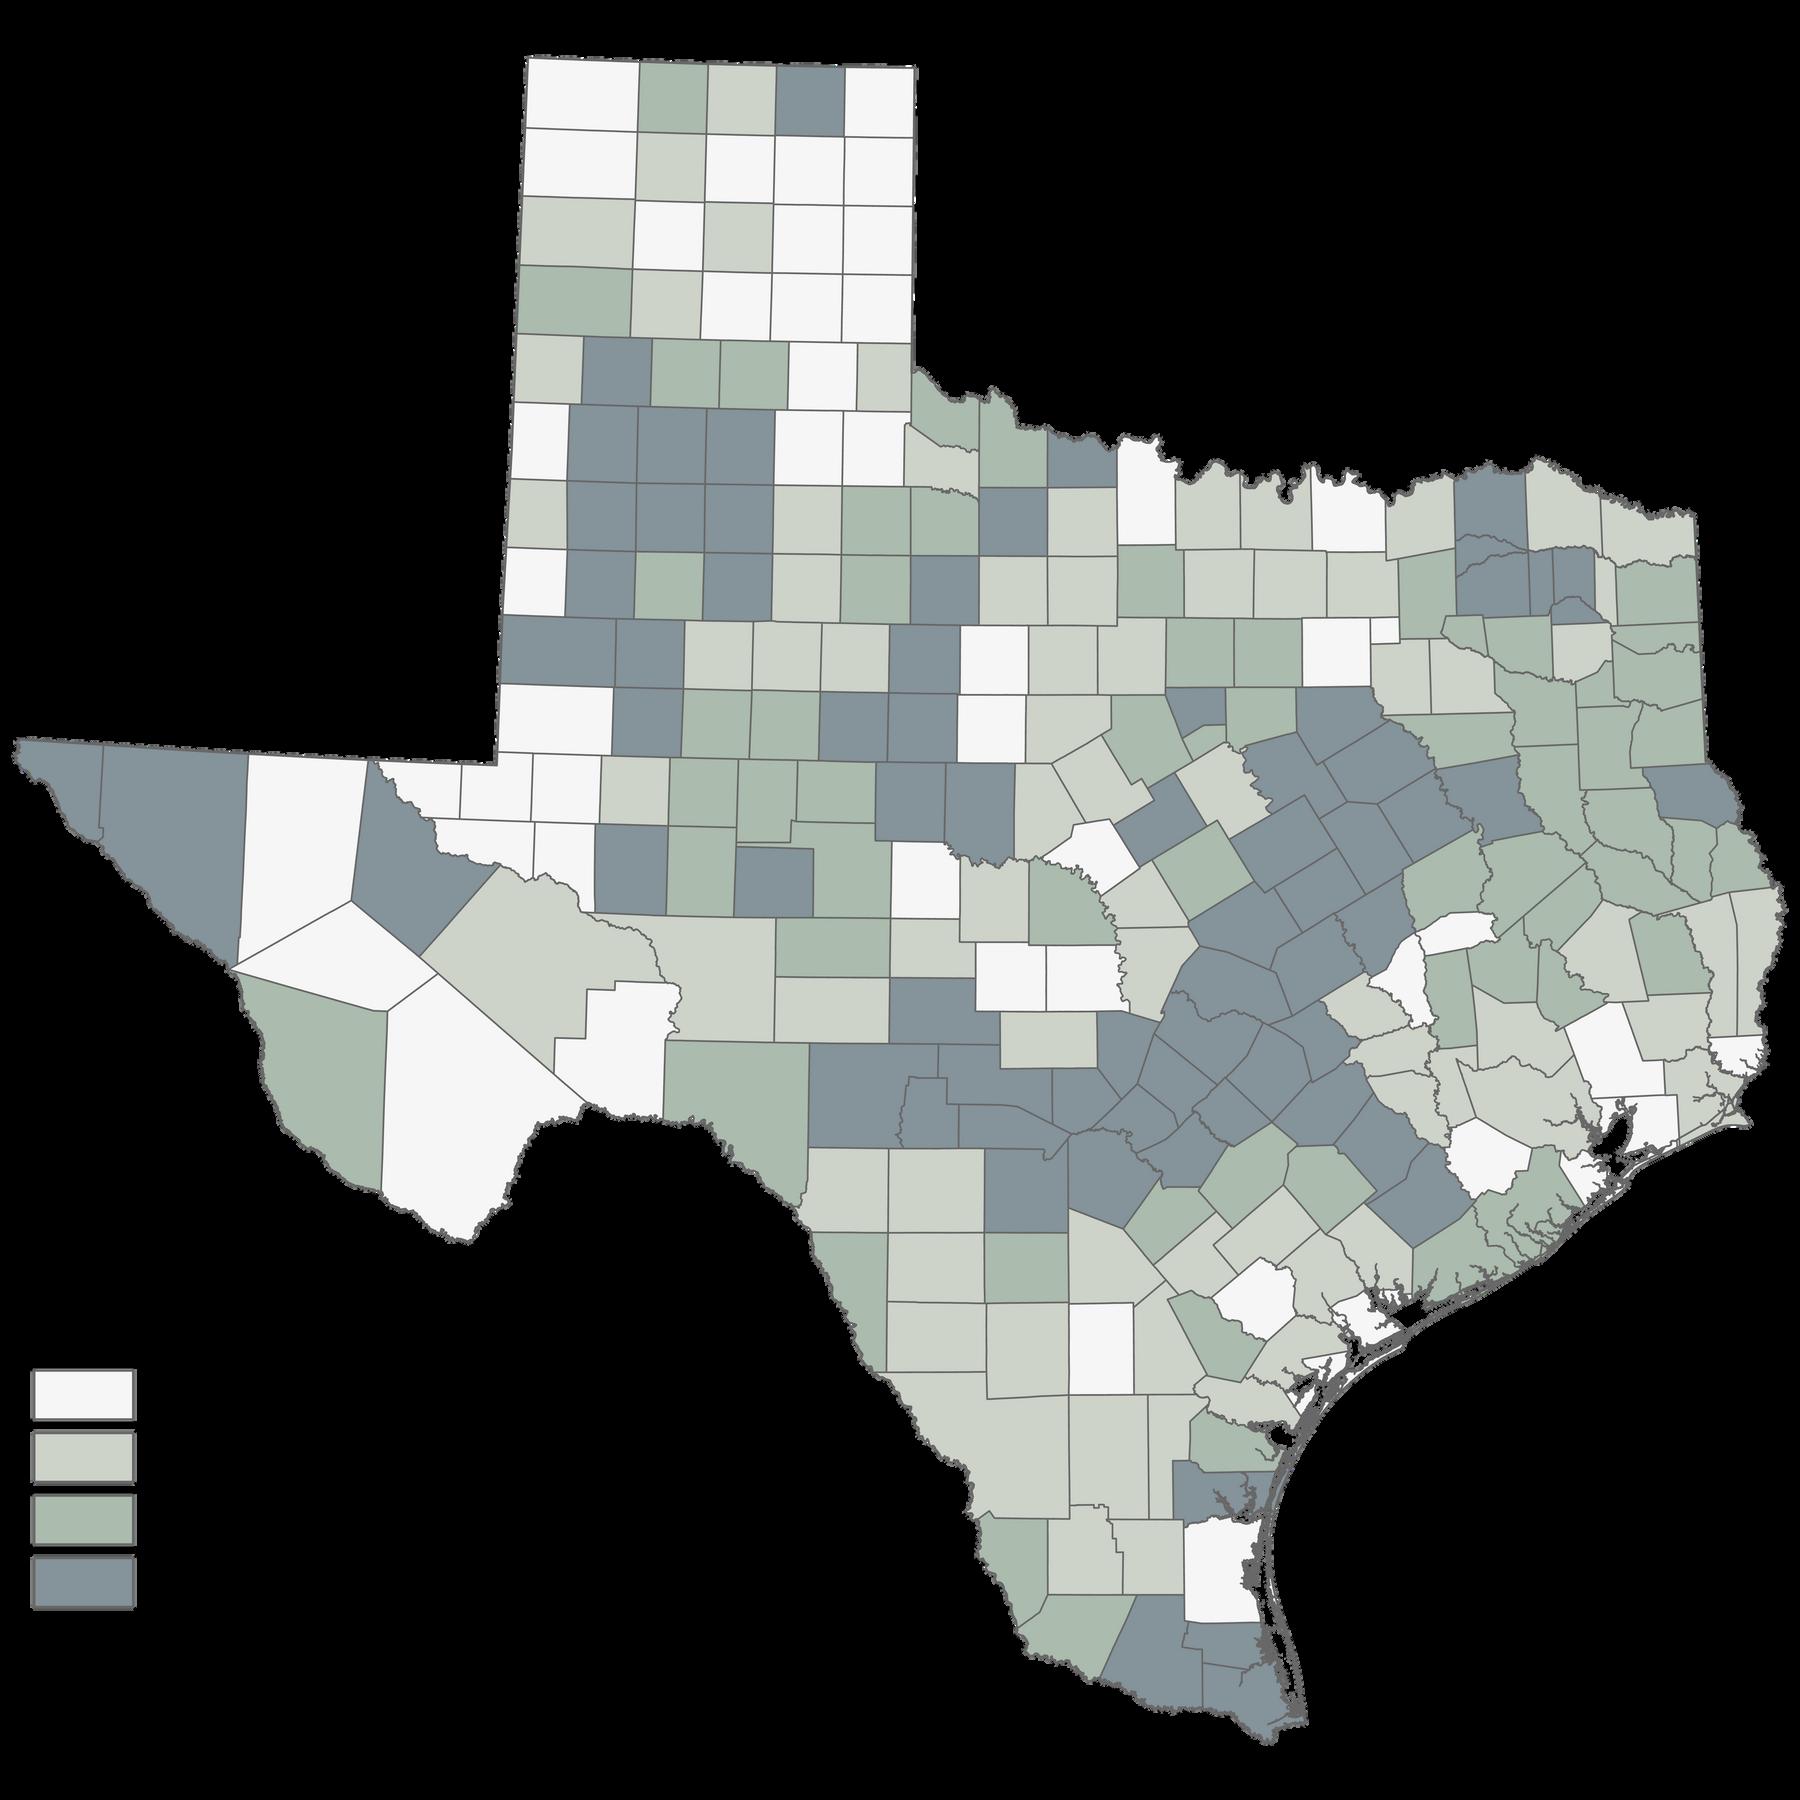
Average annual payments ($/acre/year) made to improve, maintain, or conserve erosion control measures from NRCS conservation practices implemented in Texas from 2015 to 2020
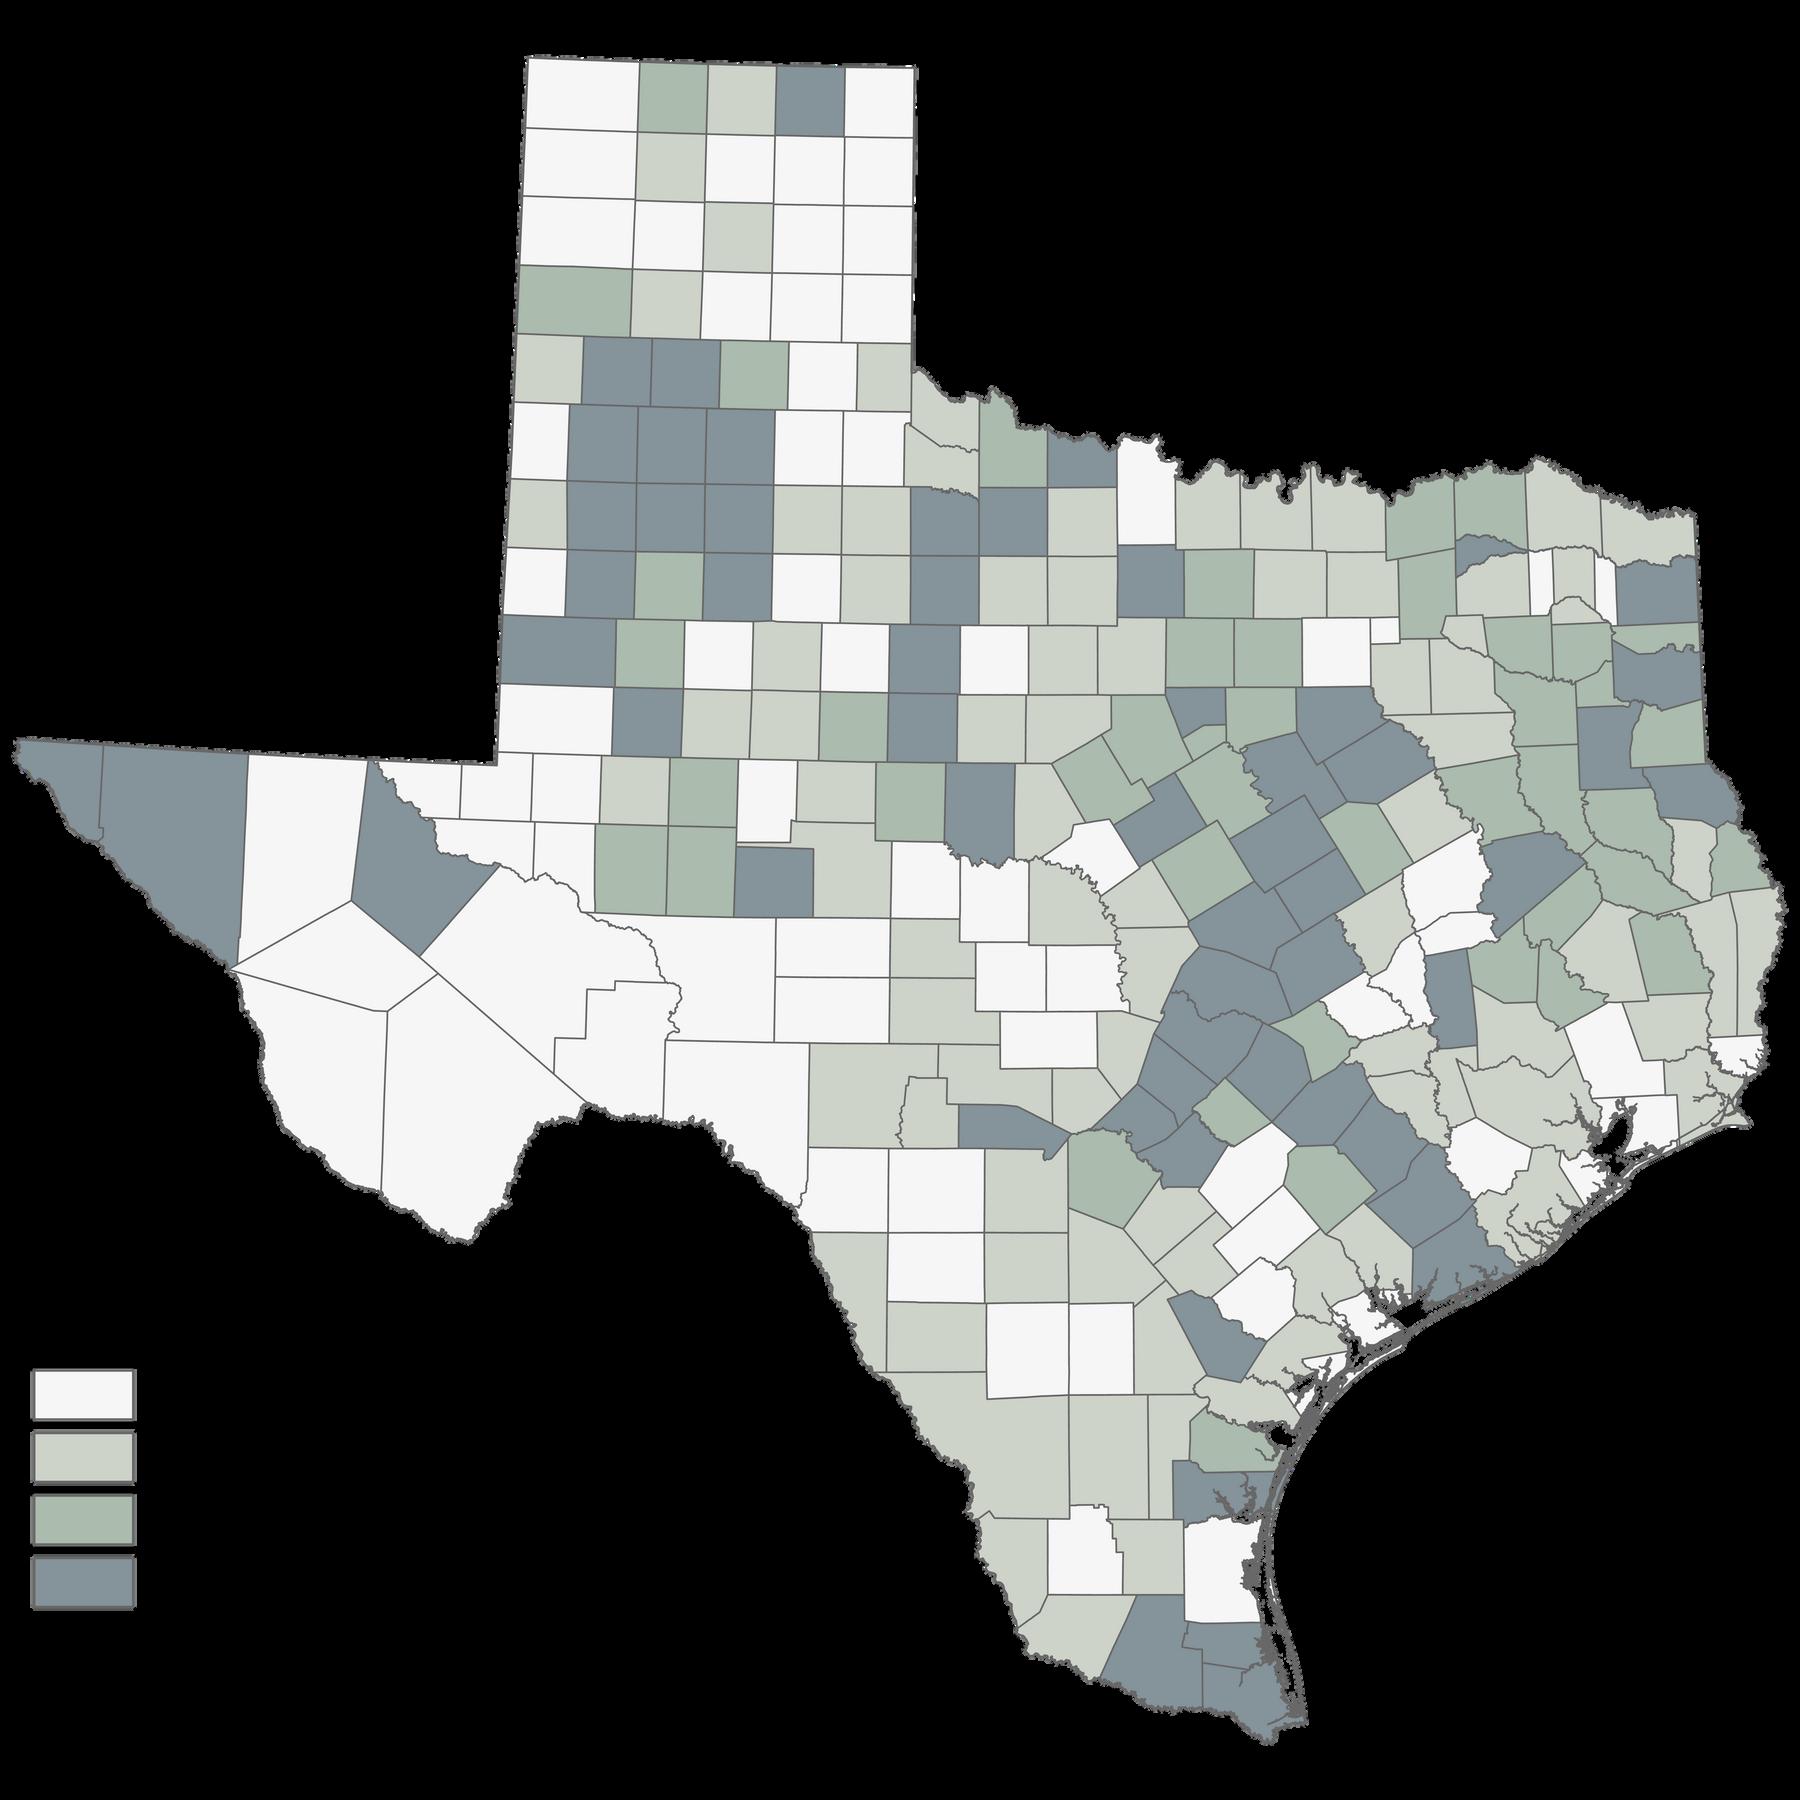
Average annual payments ($/acre/year) made to improve, maintain, or conserve flood mitigation efforts from NRCS conservation practices implemented in Texas from 2015 to 2020
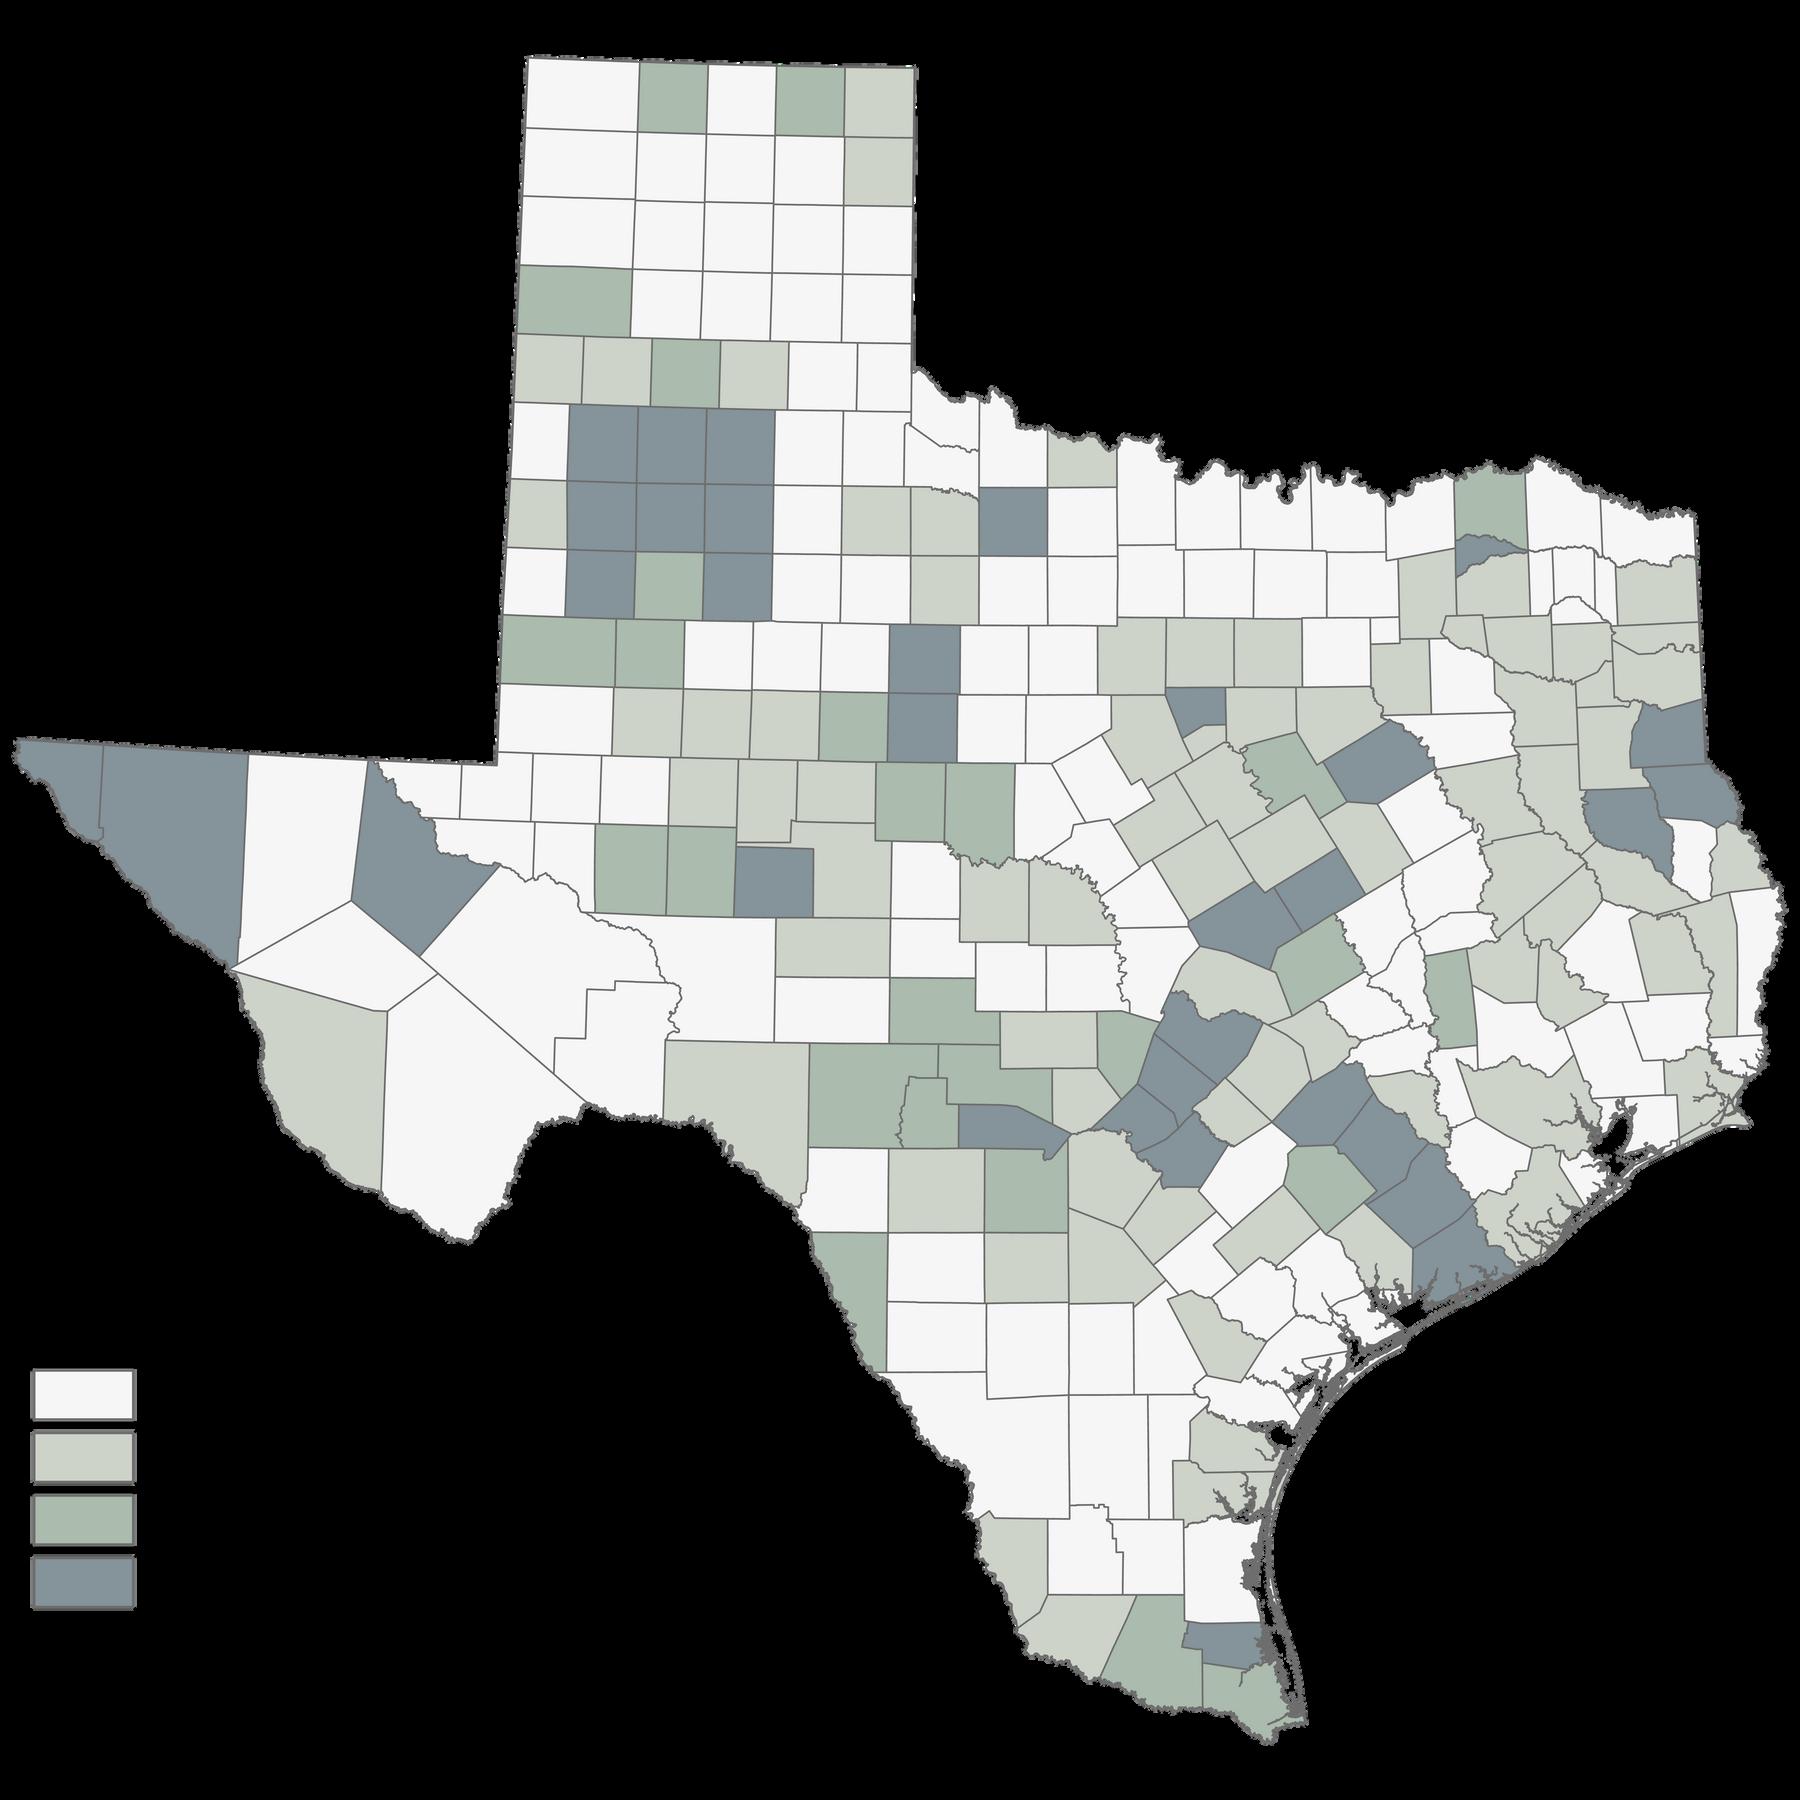
Average annual payments ($/acre/year) made to improve, maintain, or conserve air quality and air pollution removal from NRCS conservation practices implemented in Texas from 2015 to 2020
Average annual payments ($/acre/year) made to improve, maintain, or conserve carbon storage and sequestration from NRCS conservation practices implemented in Texas from 2015 to 2020

Average (geometric mean) annual hunting lease price ($/acre/year) by Texas county from 2014 to 2018
Average annual payments ($/acre/year) made to improve, maintain, or conserve non consumptive recreation from NRCS conservation practices implemented in Texas from 2015 to 2020
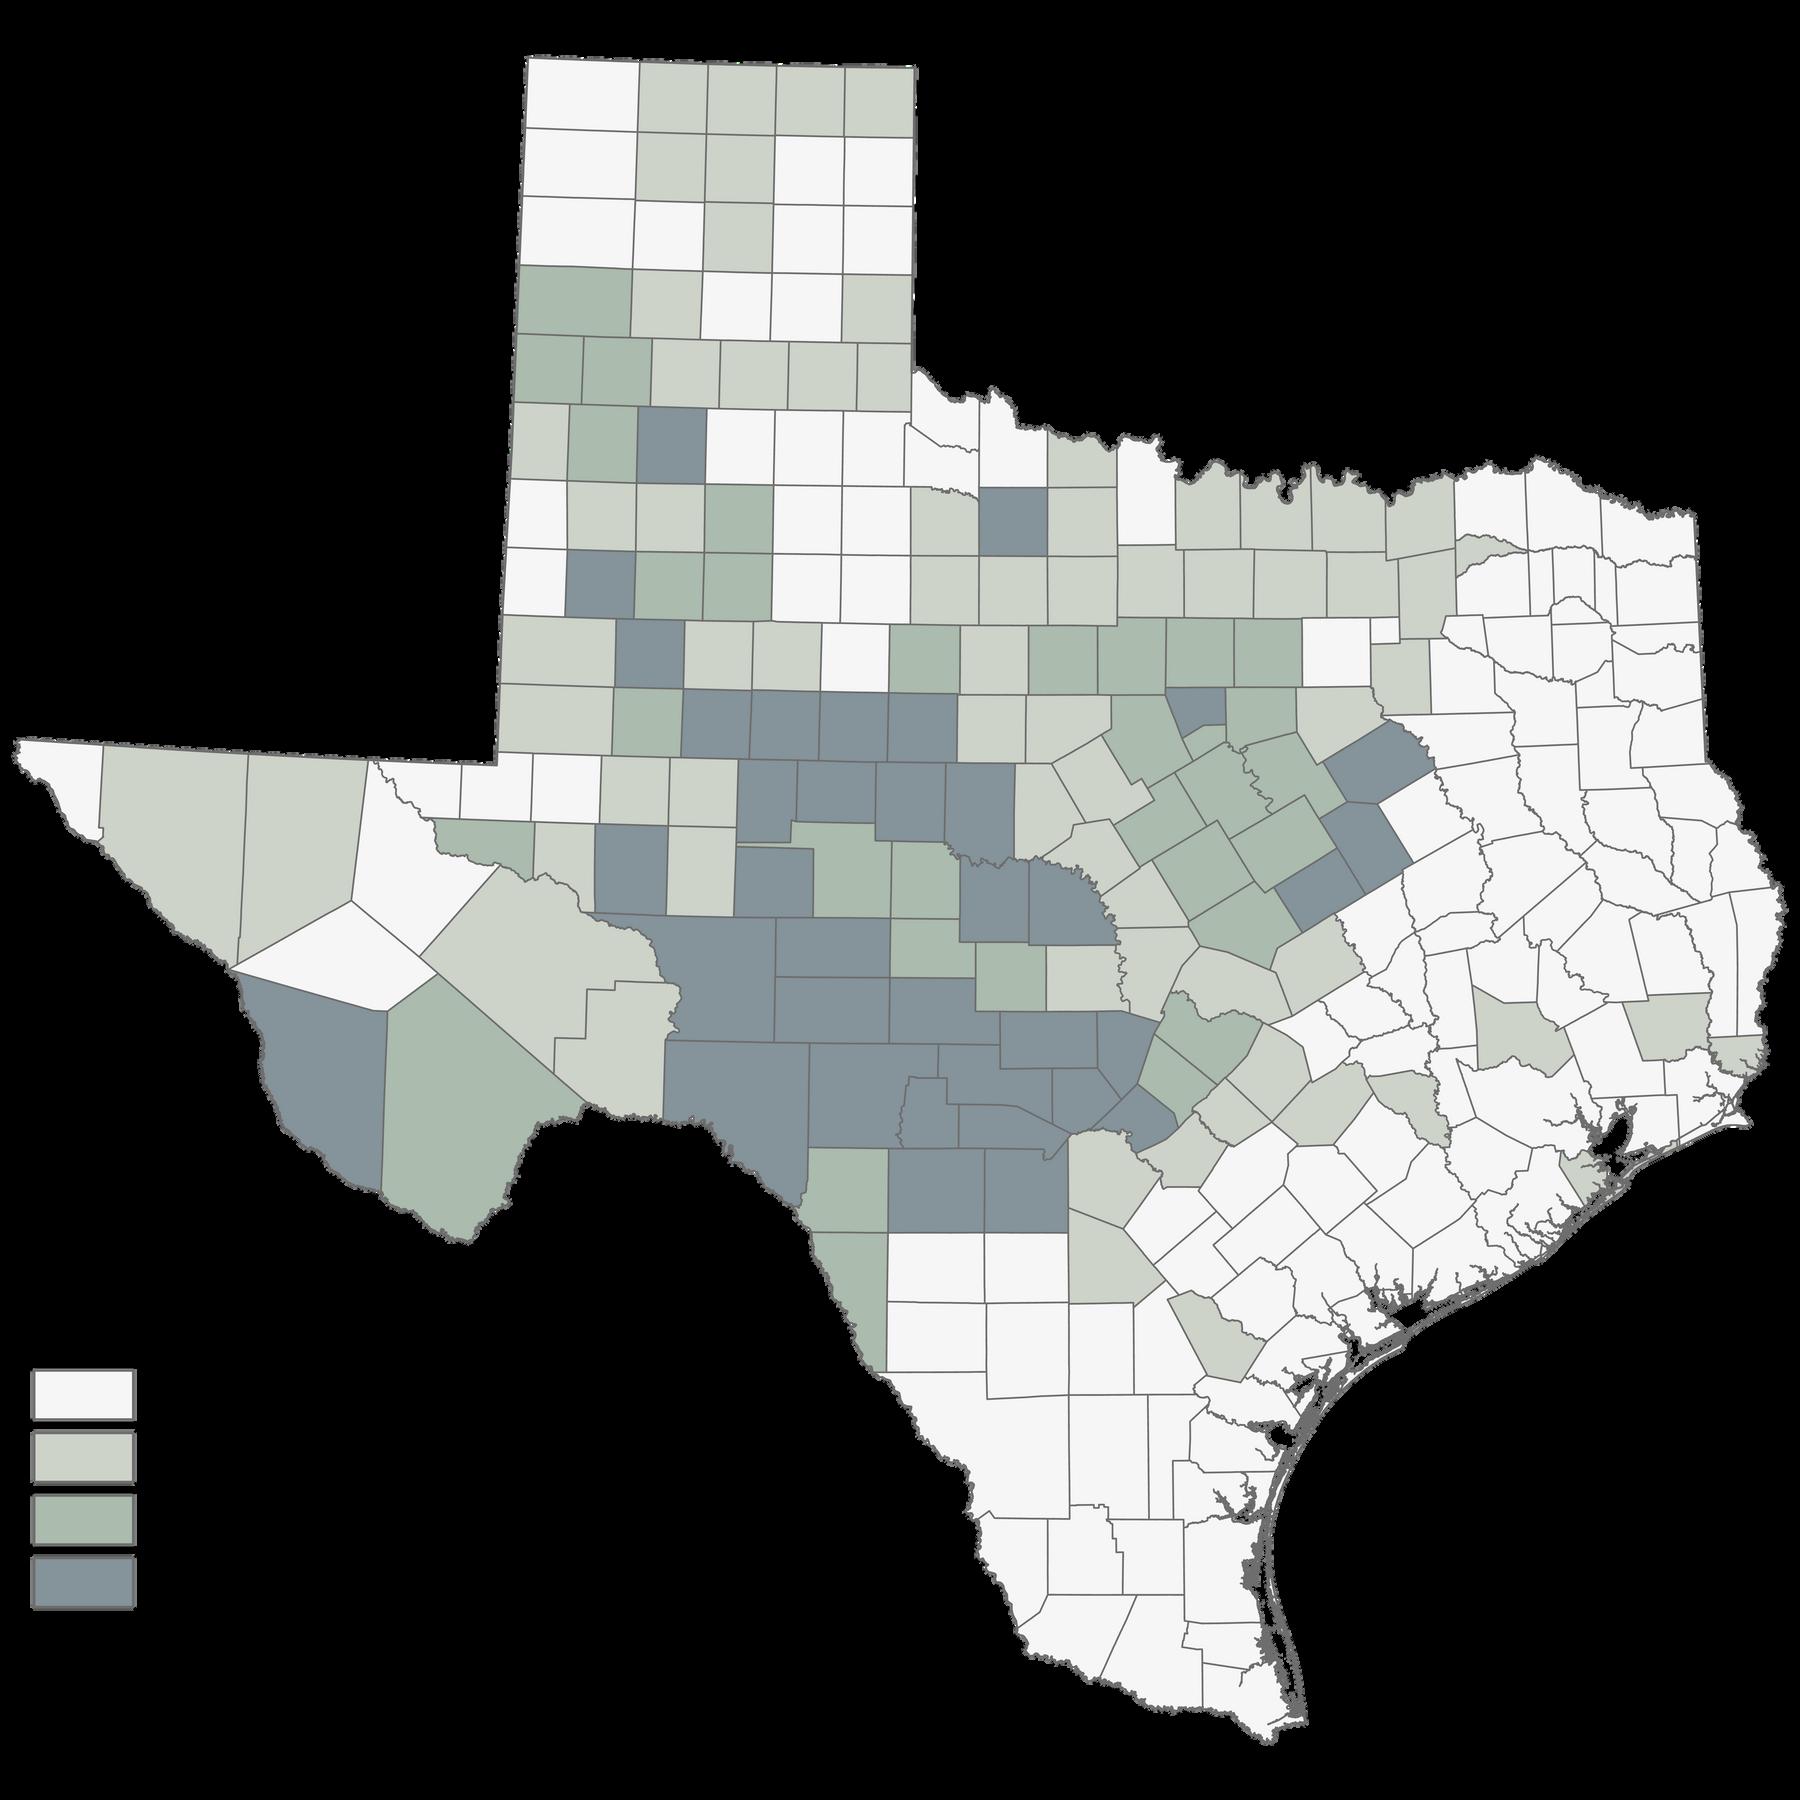
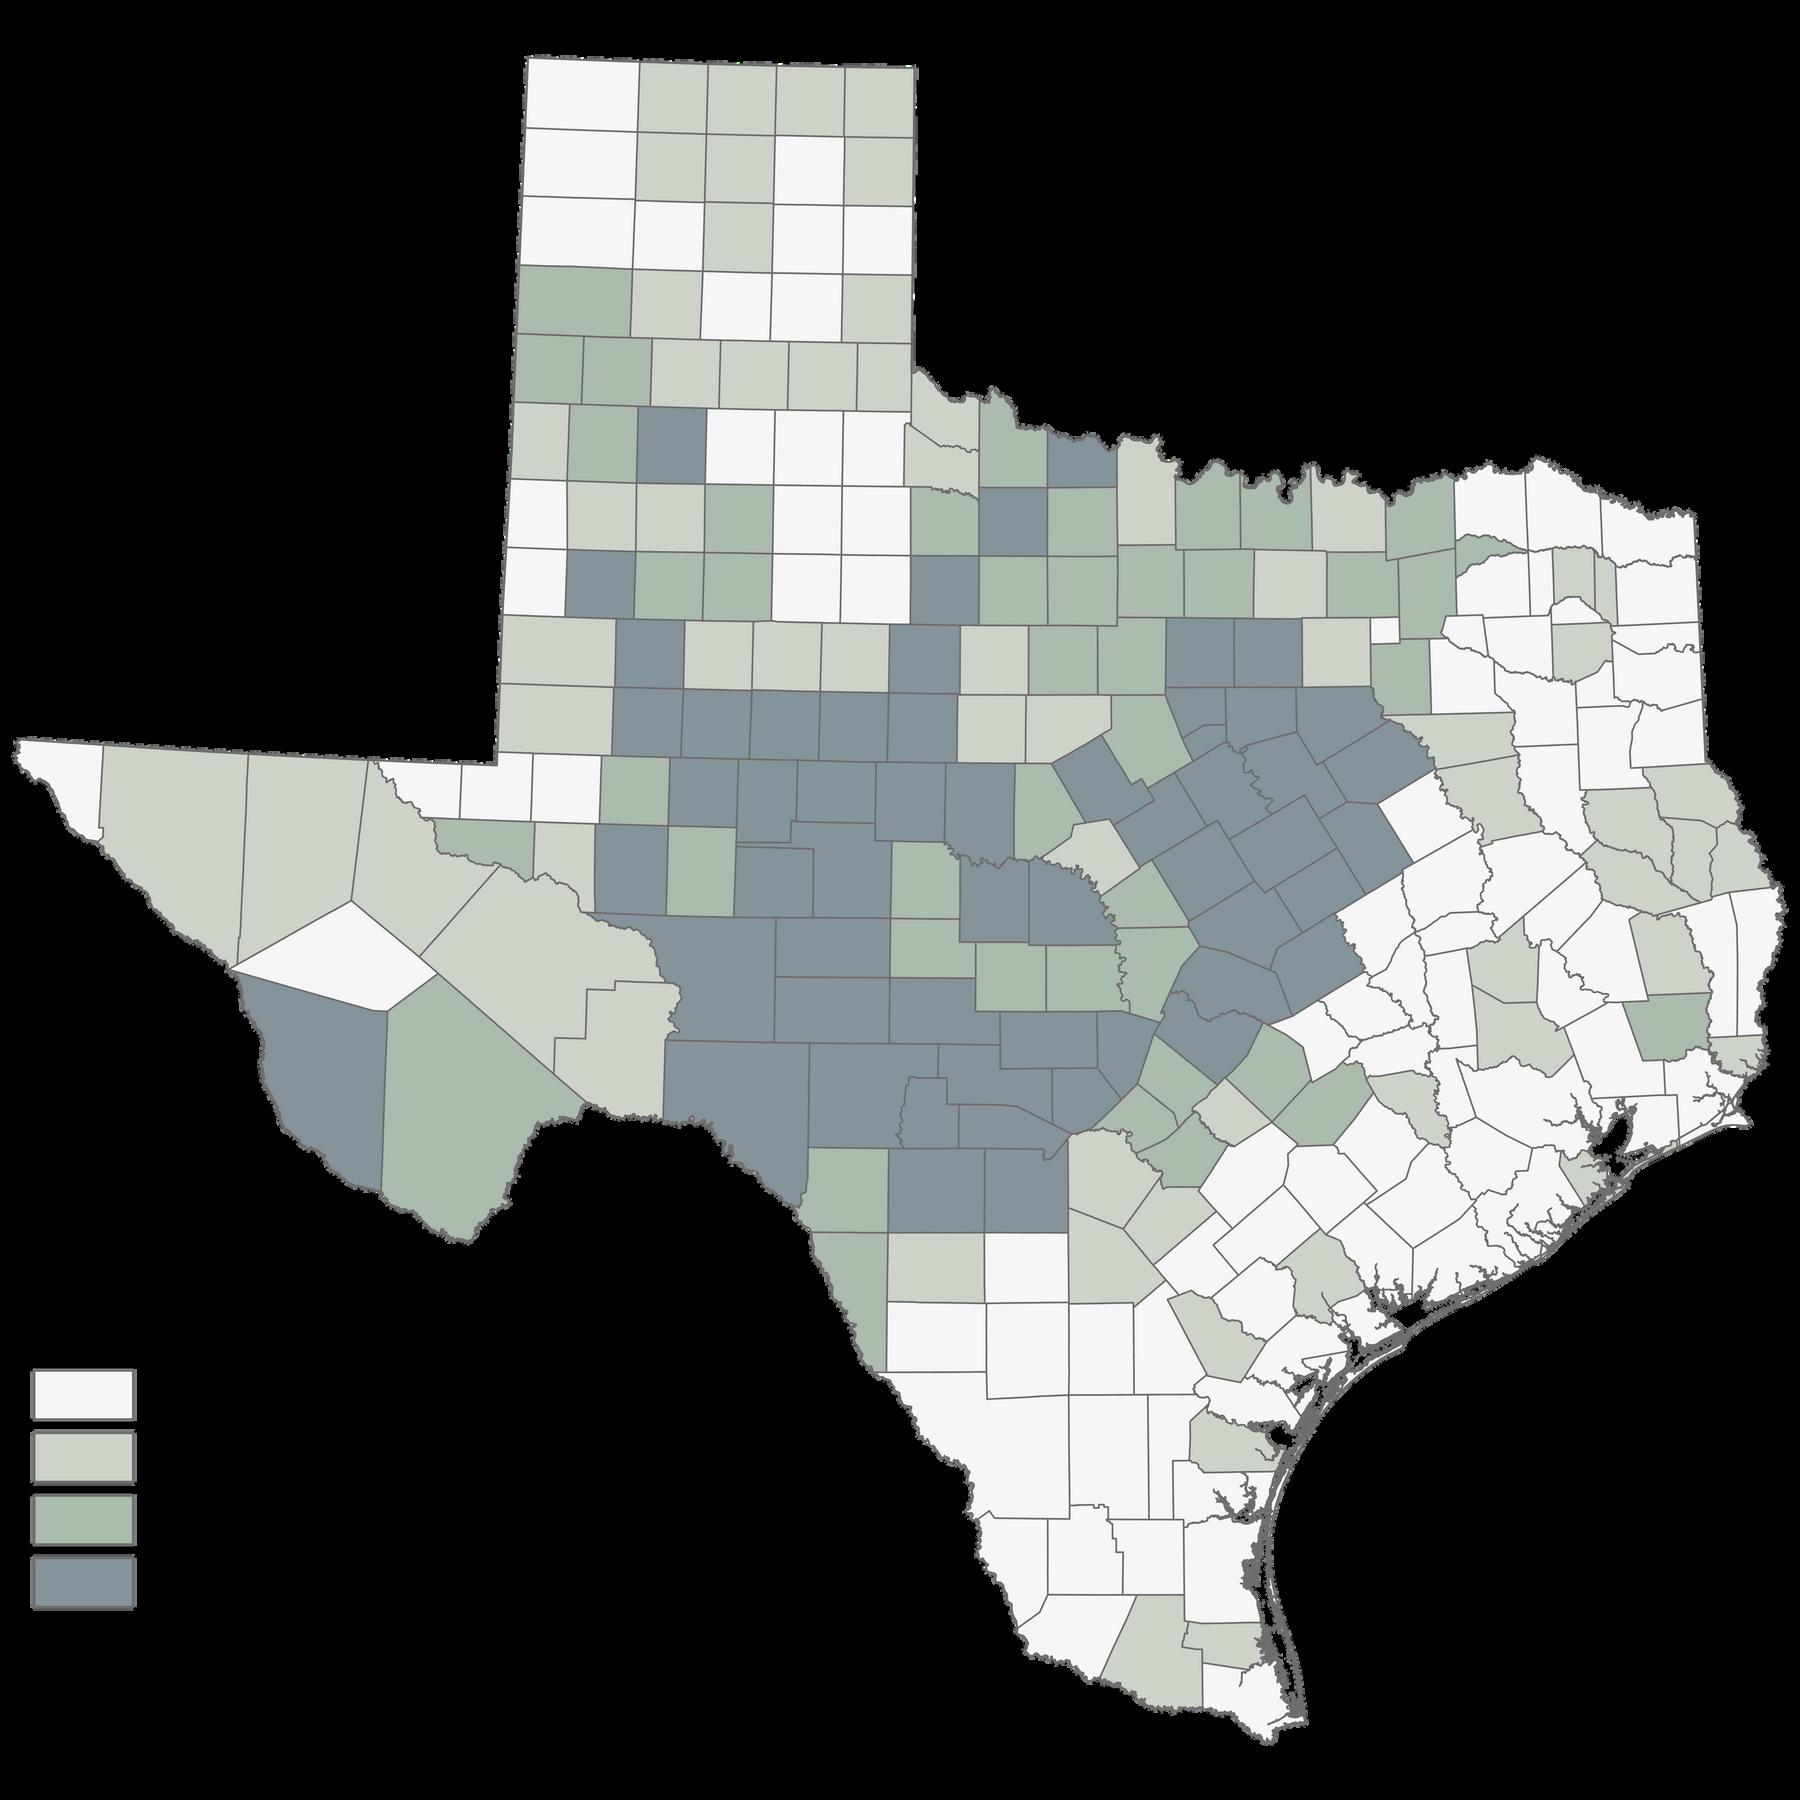
Annual replacement cost ($/acre/year) of captured water on 1 acre of working land by Texas county based on the Texas Water Development Board's Texas State Water Plan, 2022
Average annual payments ($/acre/year) made to improve, maintain, or conserve water quantity from NRCS conservation practices implemented in Texas from 2015 to 2020
Average annual payments ($/acre/year) made to improve, maintain, or conserve water quality from NRCS conservation practices implemented in Texas from 2015 to 2020
Average annual payments ($/acre/year) made to improve, maintain, or conserve wildlife habitat and biodiversity from NRCS conservation practices implemented in Texas from 2015 to 2020
Texas working lands provide various ecosystem services benefiting not only our state and local economies, but also supporting critical ecological functions that protect and enhance communities We identified 11 ecosystem services in this assessment, some of which have been historically overlooked and not readily recognized by the public for their societal benefits or values Using a benefits transfer methodology was not feasible, as data were not widely available for Texas ecosystems and products Instead, we approached our report using both market based and willingness to pay models to calculate general estimates for ecosystem services across the state. A better understanding of these services, and a more thorough method for measuring their benefits will further refine the efforts in this study, and ultimately, result in better integration with our current market based financial mechanisms.
It is important to note that our willingness to pay estimates are a measure of federal program investments spent across Texas on supporting or enhancing rural working lands at a field based or operation level for a number of conservation goals. These estimates may not reflect the full or complete value for each ecosystem service, but instead serve to illustrate a portion of dollars already spent in restoration or conservation practices of current working lands.
Values presented here are likely conservative and, in many cases, underestimated for some services Many landowner programs, such as those offered by NRCS, require a cost share that, for example, is not captured in this study. Furthermore, these estimates are limited in scope as they only account for participants in NRCS landowner programs and exclude values for non participating rural lands. We used the willingness to pay model as a proxy to ecosystem service value and provide, at a minimum, an average and conservative estimate of investments made in ecosystem services Additional research in this area should continue to better capture and quantify the value of ecosystem services
Our results illustrate a wide diversity in ecosystem services and their values, mirroring the diversity found across Texas landscapes To summarize these findings for the state as a whole, our working lands provide roughly $629/acre/year in ecosystem services. Assuming an average of $629/acre, the annual ecosystem services across our 141M acres of working lands in the state would total a conservative estimate of over $89B annually. These estimates provide some insight to serve policy makers, conservation organizations, and land managers with a better grasp of the full economic and ecological benefit Texas receives from these vital lands
1 United States Department of Agriculture (USDA), United States Forest Service (USFS) 2016 Valuing Ecosystem Services: Frequently Asked Questions Accessed June 16, 2022 https://www fs usda gov/ecosystemservices/About ES/faq shtml
2 MEA (Millennium Ecosystem Assessment) 2005 Ecosystems and human well being: synthesis Island Press Washington DC USA https://www millenniumassessment org/documents/document 356 aspx pdf
3 Food and Agriculture Organization of the United Nations (FAO) 2021 Background: Ecosystem services and biodiversity Retrieved June 23, 2021, from http://www fao org/ecosystem services biodiversity/background/en/
4 Smith L A R R Lopez A A Lund B N Wegner J C Cathey A Lopez R E Anderson G W Powers K L Skow, M.A. Crawford. 2019. Status Update and Trends of Texas Working Lands. Texas A&M Natural Resources Institute (NRI), College Station, TX, USA https://txlandtrends org/media/qzpblz2j/texas land trends status update and trends of tx working lands pdf
5 Kaval, P , 2011 Ecosystem service valuation of the Colorado River basin: a literature review and assessment of the total economic value of the Colorado River basin The Nature Conservancy, Washington DC https://www conservationgateway org/Files/Pages/ecosystem service valuati aspx
6 De Groot, R , L Brander, S van der Ploeg, R Costanza, F Bernard and L Braat 2012 Global estimates of the value of ecosystems and their services in monetary units Ecosystem Services https://www sciencedirect com/science/article/pii/S2212041612000101
7 Trust for Public Land 2016 Virginia’s return on investment in land conservation accessed on December 7 2020 https://www tpl org/virginias return investment land conservation
8 Johnsen, L., V. Butsic and L Huntsinger, L. 2020. Evaluating ecosystem services: values and return on investment of conservation easements held by the California Rangeland Trust https://rangelandtrust org/ecosystem service study/
9 Kroeger, T and Casey, F , 2007 An assessment of market based approaches to providing ecosystem services on agricultural lands Ecological economics, 64(2), pp 321 332 https://www sciencedirect com/science/article/pii/S0921800907004156
10 Nielsen Pincus, M , Sussman, P , Bennett, D E , Gosnell, H and Parker, R , 2017 The influence of place on the willingness to pay for ecosystem services Society & Natural Resources, 30(12), pp 1423 1441 https://andrewsforest oregonstate edu/sites/default/files/lter/pubs/pdf/pub5031 pdf
11 Castro, A J , Vaughn, C C , García Llorente, M , Julian, J P and Atkinson, C L , 2016 Willingness to pay for ecosystem services among stakeholder groups in a South Central US watershed with regional conflict Journal of Water Resources Planning and Management 142(9) p 05016006 https://ascelibrary org/doi/10 1061/%28ASCE%29WR 1943 5452 0000671
12 Texas Water Development Board 2022 Water for Texas 2022 State Water Plan http://www twdb texas gov/waterplanning/swp/2022/
13 Lund A G Powers R Lopez L Smith L Olson and L Gregory 2020 Texas Farm and Ranch Lands Conservation Program: 2020 Evaluation report Texas A&M Natural Resources Institute Research Report Number 2020 1. College Station, Texas, USA. https://nri tamu edu/media/3025/tfrlcp2020evaluationreport pdf