NORTHERN TERRITORY
6
6 3.0 2.5
4
4
2.0
3
3 2
3
1.5 1.0 0.5
2017-18
2016-17
2014-15
2015-16
2012-13
1 2011-12
2009-10
2007-08
2008-09
1 2006-07
2004-05
0
1
2010-11
1
3
2
2013-14
2
19%
Rate (per 100,000 pop.)
5
2005-06
Number (n)
5
32% 6%
32% Boating
3% 7%
0.0
Boating Swimming/Wading Attempting a Rescue Jump Fall Land-based Fishing Other Unknown
13%
10% 10%
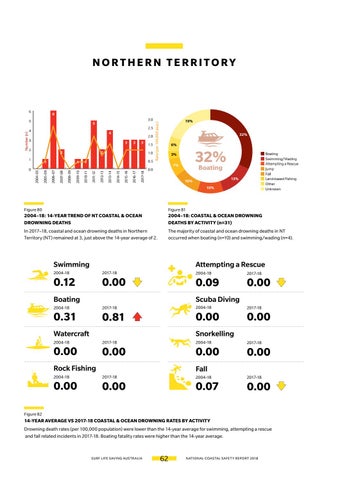
Figure 80
Figure 81
2004–18: 14-YEAR TREND OF NT COASTAL & OCEAN DROWNING DEATHS
2004–18: COASTAL & OCEAN DROWNING DEATHS BY ACTIVITY (n=31)
In 2017–18, coastal and ocean drowning deaths in Northern Territory (NT) remained at 3, just above the 14-year average of 2.
The majority of coastal and ocean drowning deaths in NT occurred when boating (n=10) and swimming/wading (n=4).
Swimming
Attempting a Rescue
2004-18
2017-18
0.12
0.00
Boating
2004-18
2017-18
0.09
0.00
Scuba Diving
2004-18
2017-18
0.31
0.81
Watercraft
2004-18
2017-18
0.00
0.00
Snorkelling
2004-18
2017-18
2004-18
0.00
2017-18
0.00
0.00
0.00
Rock Fishing
Fall
2004-18
2017-18
0.00
2004-18
0.00
2017-18
0.07
0.00
Figure 82
14-YEAR AVERAGE VS 2017-18 COASTAL & OCEAN DROWNING RATES BY ACTIVITY Drowning death rates (per 100,000 population) were lower than the 14-year average for swimming, attempting a rescue and fall related incidents in 2017-18. Boating fatality rates were higher than the 14-year average.
SURF LIFE SAVING AUSTR ALIA
62
NATIONAL COASTAL SAFET Y REPORT 2018