NATIONAL COASTAL SAFETY REPORT 2025
INTRODUCTION
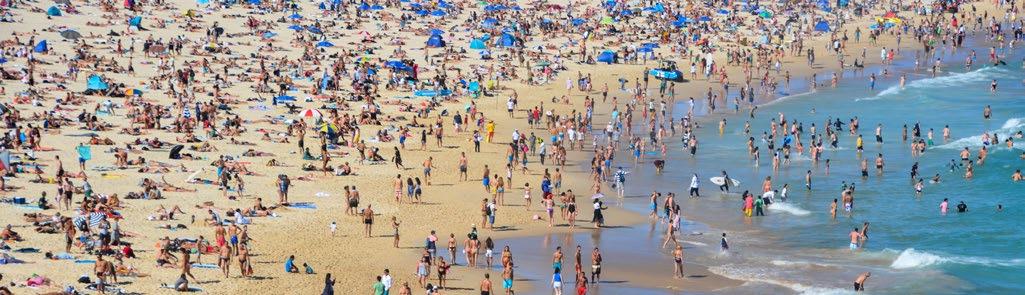
Australia’s coastline is a national treasure – an iconic part of our identity and an everyday place to recreate, relax, and connect with our community and environment. With 87% of Australians now living within 50km of the coast, it is perhaps not surprising that more than 16 million Australian residents (aged 16+ years) made over 630 million individual visitations to the coast last year, 88% of which were to our incredible beaches. Of the people who visit our coast, swimming remains the most popular coastal activity (57%), followed by boating (16%), then watercraft (13%; i.e. kayaks, canoes and other paddlecraft).
While a source of joy for most, the dynamic and uncontrolled nature of coastal environments means there are also many inherent risks and dangers. The National Coastal Safety Report 2025 reveals a sobering reality: 239 lives were lost in coastal environments. This number includes 154 drowning deaths, the highest ever recorded, representing a 3% increase from 2023/24 numbers and 21% above the 10-year average for coastal drowning. All coastal drowning deaths occurred outside of the red and yellow flags or patrol times. Surf Life Saving is responding, but the challenge is immense and growing – without further resourcing to support the demands of unpatrolled and remote locations.
Behind these numbers are families, friends, and communities forever changed. Comprehensive analysis highlighted that 87% of drowning decedents were male
and that older Australians remained disproportionately at risk, with those aged 55 years and over accounting for 55% of drowning deaths –emphasising the importance of inclusive community programs such as Silver Salties.
Beaches continue to be the leading drowning location (53%), with three in four incidents occurring greater than one kilometre from Surf Life Saving services, all outside of patrol times or at unpatrolled areas. Rip currents remain the leading coastal hazard, contributing to more than one in three beach drowning deaths, while swimming and wading remain the most common activities prior to drowning.
These numbers, while tragic, would have been inevitably much higher
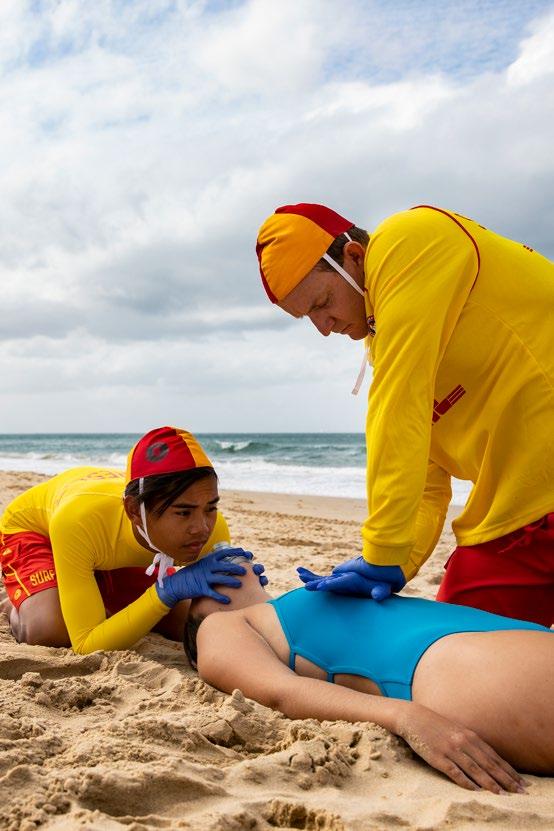
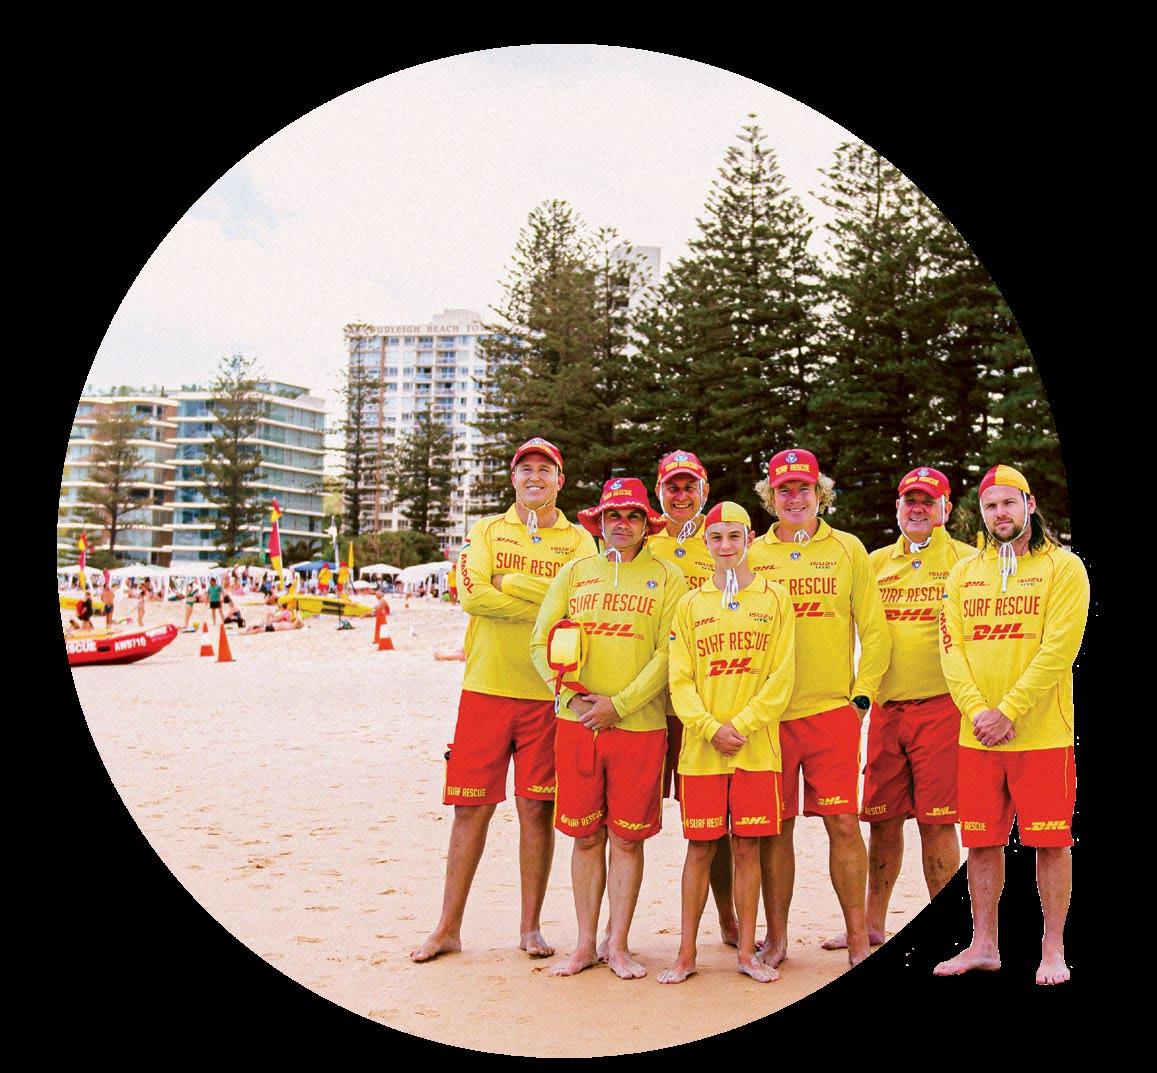
without the enormous efforts of Surf Life Saving (SLS). Our incredible workforce, which includes more than 200,000 members from 316 SLS clubs, has never been more critical— or more impactful. In 2024/25, our volunteer and professional lifeguard services delivered 8,207 rescues, 2.19+ million preventative actions, and 65,942 first aid treatments, providing an estimated $9 billion in value to the community. These achievements are a testament to the dedication, skill and courage of our surf lifesavers and lifeguards, who stand as the first line of defence at many of our beaches. Without the interventions of our surf lifesavers and lifeguards, there would have been at least an additional 1,500 coastal drowning deaths last year alone. That’s the scale of impact of the services we provide.
This report also highlights the importance of innovation and education in reducing risk. Initiatives such as Public Rescue Equipment, Lifesaving CPR training, the Beach Blackspot Drowning Reduction Program and the Beach Passport, as well as the integration of emerging technologies, are transforming our approach to prevention and response. Equally, campaigns such as Stop, Look, Stay Alive and programs targeting high-risk groups, including rural or multicultural communities and older Australians, are essential to building everyday water safety skills and awareness.
SLSA’s vision of zero preventable deaths in Australian waters is aspirational but is intended to drive impactful collaboration across the water safety sector. Meaningful reductions are achievable – but only if we work together. Government, industry, communities and individuals all have a role to play. This report is more than a collection of statistics - it is a call to action in memoriam of the 239 people who did not return home to their loved ones. Any life lost is one too many, and every intervention that prevents tragedy is invaluable.
This report is a wake-up call. It shows us where the risk is shifting, and where our collective effort must go next. We need every water safety organisation, every level of government, and the support of the community to push harder. Together with the support of the Federal Government, we need to step up our efforts in empowering communities to stay safe, future-proof lifesaving infrastructure and resource surf lifesavers to go further. We know what we need to do, backed by research and evidence. We have to act because the scale of the challenge demands it.
As you read this report, I encourage you to reflect on the collective responsibility we share in making our coastline safer. We have a plan, we know where the risks are. We know that with the right support, we can turn the tide on coastal drowning. Together, with additional support and through education, innovation and collaboration, we can ensure that every trip to the coast ends with a safe return home.

Adam Weir Chief Executive Officer Surf Life Saving Australia
UNDERSTANDING DROWNING
WHAT IS DROWNING?
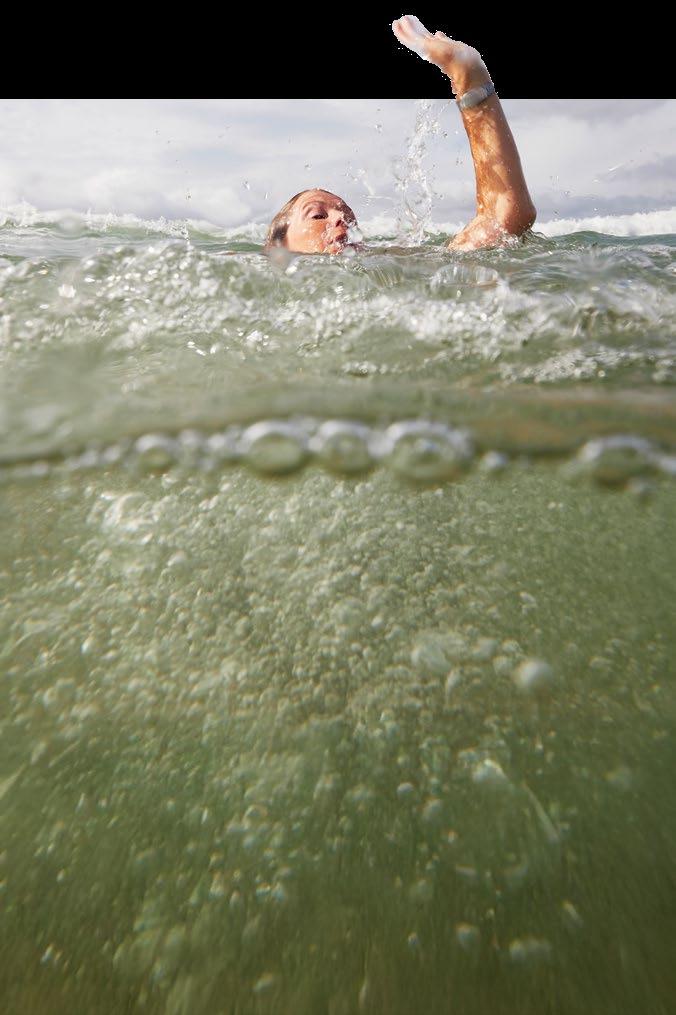
The globally accepted definition of drowning is: ‘The process of experiencing respiratory impairment from submersion or immersion in liquid’. Importantly, there are three outcomes for a person who experiences drowning:
• death,
• survival with morbidity, or
• survival with no morbidity.
Please note: terms such as ‘near drowning,’ ‘secondary drowning,’ and ‘wet/dry drowning’ are incorrect and are no longer used.
COASTAL DROWNING
Coastal drowning refers collectively to fatal or non-fatal drowning incidents that occur in coastal (up to 3 nautical miles) and ocean (3-12 nautical miles) environments, including beaches, estuaries, river mouths, oceans/ harbours, rocks, and coastal rock pools, up to and including 12 nautical miles from shore. Specific definitions can be found in the glossary.
FATAL AND NON-FATAL DROWNING
This report includes information on fatal drowning only, that is people who die from submersion or immersion in water. However, the burden of drowning is not limited to these deaths alone.
Each year, hundreds of non-fatal drowning events occur which have a range of outcomes. Sometimes the person who drowns and survives might only need to visit a clinic or
hospital for a clinical assessment. In other instances, non-fatal drowning events result in permanent, life-altering neurological disability that severely impacts the person who drowns, their family, friends and community.
Preliminary analyses suggest that for every fatal beach drowning, another nonfatal beach drowning incident occurs*, while at other water bodies that ratio grows to three non-fatal incidents**. The exact number of non-fatal drowning incidents is difficult to report with precision, which is why improving data systems for non-fatal drowning is a priority identified in the Australian Water Safety Strategy 2030.
HOW DO WE MEASURE DROWNING?
The coastal mortality section in this report (Section 3) includes counts, proportions, and rates. When analysing drowning data, counts, proportions and rates are presented to offer different perspectives of the data. Each of these measures are useful but serve a distinct purpose.
Counts represent the number of drowning events that occur within a given time frame, geographic location, and/ or subgroup. These are useful for understanding the scope of the problem, communication about the burden, and for determining the required capacity and scale of services or programs. Under some circumstances, when counts are too small to be interpreted meaningfully, multiple years of data are combined.
Proportions refer to the part of a whole, expressed as a fraction or percentage, that represents a specific group of drowning incidents relative to the total number of drowning events. Percentages are often easier to understand and communicate in context, and they allow for simple comparisons between different groups that vary in the number of cases.
Drowning rates (presented here as crude fatal drowning rates per 100,000 residents) take into consideration the size of the population that are at risk of drowning. By using rates, we can compare the drowning burden across populations that vary in size, allowing us to identify groups that are disproportionately affected by drowning and should therefore be considered priority groups for prevention efforts.
• Population-based rates: crude population-based rates estimate the risk at the population level, grouping exposed and unexposed populations together (i.e. both people who do, and do not, visit the coast). This can underestimate drowning risk by including people who are not actually at risk of drowning.
• Age and Sex-specific rates: these are population rates that specifically use only the relevant population groups, i.e. calculating male rates using the number of male drowning deaths as the numerator and the population of males as the denominator. It is more specific than using the whole population but remains an underestimate for the same reason.
• Exposure-based rates: exposure-based drowning rates only consider people actually at risk of drowning (i.e. the proportion of the population who visit the coast and are exposed to coastal drowning risks). This allows for more accurate estimates of drowning risk, which can be further refined by extending calculations beyond the exposed populations (i.e. coastal visitors), to include frequency (i.e. how many times they visit the coast), and duration (i.e. the time spent during each visit). This can be reported as time-exposed (i.e. one incident per number of hours spent each year actively participating) or person-exposed (i.e. one drowning death per 100,000 rock fishers).
For more detailed information please refer to the methodology described in the reference pages.
* Surf Life Saving Australia (2018). National Coastal Safety Report 2018. SLSA: Sydney.
** Peden AE, Mahony AJ, Barnsley PD, Scarr JP (2018). Understanding the full burden of drowning: a retrospective, cross-sectional analysis of fatal and non-fatal drowning in Australia. BMJ Open 2018;8:e024868. doi:10.1136/ bmjopen-2018-024868
THE DROWNING PREVENTION CHAIN
The Drowning Prevention Chain visualises a recognised framework to reduce drowning (International Life Saving Federation 2015). It identifies four causal factors that can lead to death or injury by drowning, visualised in the outer circle of this chain and corresponding mitigation and control strategies that can prevent or reduce drowning.
Figure 01 THE DROWNING PREVENTION CHAIN (International Life Saving Federation 2015)
SLSA’S DROWNING REDUCTION AND PREVENTION FRAMEWORK
SLSA's Drowning Reduction and Prevention Framework (Figure 02) is a holistic approach to reduce drowning and improve coastal risk management. By employing a data-driven approach to reduce coastal and drowning risks, this Framework guides targeted interventions and informs strategic direction to reduce coastal drowning in Australia.
In partnership with stakeholders, SLSA integrates multiple data sources with an iterative, evidenced based approach to analyse and address national coastal safety issues, aiding with establishing national priorities and blackspot locations.
This Drowning Reduction and Prevention Framework outlines an integrative process that supports the delivery of education, prevention and response strategies to safeguard the community. Continuous monitoring, evaluation and engagement ensures delivery remains responsive to emerging risks and community needs. This process facilitates feedback and guides practical interventions such as lifesaving and response services, communication campaigns, and blackspot reduction programs to turn the tide on coastal drowning and improve safety outcomes.
NOITACINUMMOC & C ONSULTATION
Drowning data (fatal and non-fatal)
DATA INPUTS
Operational data Population/ visitation data
RISK ASSESSMENT
Behaviour data
Risk identification | Incident tracking | Coastal risk assessments
Community risk perception and behaviours | High risk locations/populations
RISK ANALYSIS
Epidemiology | Critical incident analysis | Spatial analysis | Case studies
EVALUATION & REPORTING
Incident and mortality report | National safety agenda | Coastal safety briefs
Blackspot identification | National coastal safety risk prioritisation
Surf lifesaving and support services INTERVENTION
Public education and training
Communication campaigns Emergency response Blackspot reduction program
Early warning systems
ONGOING MON I TO R I N G & NOITAULAVE
NATIONAL PRIORITY AREAS
The issues identified through the Drowning Reduction and Prevention Framework form SLSA’s Priority Areas, highlighting high-risk groups, locations and causal factors for coastal drowning. The National Priority Areas inform drowning prevention education, mitigation strategies and communication campaigns.
This Drowning Reduction and Prevention Strategy provides evidence to allocate assets, resources and lifesaving services to areas of need and to develop appropriate public education programs and mitigation strategies to address the coastal safety issues within known blackspots or groups at risk of drowning.
NATIONAL PRIORITY AREAS
Figure 02
SLSA’S DROWNING REDUCTION AND PREVENTION FRAMEWORK
Visualising the cyclical risk management process employed to reduce and prevent drowning and injury along the Australian coast.
SECTION 1 COMMUNITY
16.0
13.4
4.0
AUSTRALIAN ADULTS* VISITED THE COAST IN 2024/25
COASTAL ACTIVITY PARTICIPANTS IN 2024/25
* for the purposes of this section adults include Australian residents aged 16+ years.
AUSTRALIAN ADULTS* HAVE EVER BEEN UNINTENTIONALLY CAUGHT IN A RIP
AUSTRALIAN POPULATION
VISITATION & PARTICIPATION
Figure 03
AUSTRALIAN POPULATION DENSITY PER LOCAL GOVERNMENT AREA (LGA)
This heat map shows the estimated Australian population density per LGA at June 2025. The majority of LGAs with a population density greater than 100 persons per square kilometre are located on Australia’s extensive coastline. The National Coastal Safety Survey 2025 (NCSS2025) collected data on coastal visitation, frequency and activity participation for each state which are also presented here.
1.7M Coastal visitors 3.4 Visits per month 2.1 Hours per visit 1.4M Coastal activity participants 1.2M Summer activity participants
<0.1 persons per km2
0.1 - 1 persons per km2
1 - 10 persons per km2
10 - 100 persons per km2
>100 persons per km2
NT
0.15M Coastal visitors
3.9 Visits per month
1.9 Hours per visit
0.1M Coastal activity participants
0.1M Summer activity participants
QLD
3.4M Coastal visitors
3.7 Visits per month
2.5 Hours per visit
2.8M Coastal activity participants
2.3M Summer activity participants
SA
1.2M Coastal visitors
3.0 Visits per month
2.4 Hours per visit
0.9M Coastal activity participants
0.8M Summer activity participants
NSW
5.4M Coastal visitors
3.7 Visits per month
2.6 Hours per visit
4.6M Coastal activity participants
3.9M Summer activity participants
Summer activity participants
COASTAL VISITATION & PARTICIPATION
NATIONAL TRENDS
NCSS2025: COASTAL VISITATION & PARTICIPATION SUMMARY
Australians love the coast, with approximately 87% of the population living within 50km of the coast. The annual National Coastal Safety Survey (NCSS) explores coastal visitation, activity participation, behaviour, and perceptions of Australian adults (16 years and above) to explore trends around how Australians use our extensive coast. Over the past 12 months, 16 million Australian adults visited the coast 3.3 times each month, spending 2.5 hours on a typical visit. This equates to more than 630 million individual visitations to our coast last year. Males and females visited the coast equally, however males visited more frequently (3.6 visits per month) than females (2.9 visits per month), and participated in coastal activities more, with 7 million participants compared with 6.4 million females.
COASTAL VISITATION

Figure 04
NCSS2025: VISITATION FREQUENCY BY RESIDENCE DISTANCE FROM THE COAST
Australians who live closer to the coast, visit more frequently, with 71% of residents who live less than 10km from the coast visiting at least monthly, compared to only 12% of those who live over 50km from the coast. Furthermore, 32% of residents who live less than 10km from the coast visit three days per week or more.
AUSTRALIAN ADULTS VISITED THE COAST IN 2024/25
2.5 HOURS/VISIT
3.3 VISITS/MONTH 13.4M
COASTAL ACTIVITY PARTICIPANTS 11.1M SUMMER AC TIVITY PARTICIPANTS
8.1M COASTAL VISITORS 3.6 VISITS / MONTH 2.5 HOURS / VISIT 7M
COASTAL ACTIVITY PARTICIPANTS 5.7M
SUMMER A CTIVITY PARTICIPANTS
Figure 05
NCSS2025: WATER ENTRY FREQUENCY
One in seven Australian adults always enter the water when they visit the coast (15%), with a further 27% entering the water most of the time.
7.9M COASTAL VISITORS 2.9 VISITS / MONTH 2.4 HOURS / VISIT 6.4M
COASTAL ACTIVITY PARTICIPANTS 5.4M
SUMMER AC TIVITY PARTICIPANTS
Figure 06
NCSS2025: COASTAL LOCATIONS VISITED
Nine in ten coastal visits were to beaches, with 12% to other coastal areas such as rock platforms or cliffs.
Figure 07
NCSS2025: LAST TEN COASTAL VISITS BY LOCATION
Coastal visitation patterns vary nationally. For NSW residents, 50% of their last ten visits were to a patrolled beach, similar to 46% of QLD residents and 37% of Victorian residents. In contrast, the past ten coastal visits for residents in the Northern Territory, Tasmania, South Australia, and Western Australia were predominantly to unpatrolled locations, either unpatrolled beaches or patrolled beaches outside of patrol hours. One in four visits to the coast by Northern Territory residents were to locations other than a beach, such as rocky areas.
Figure 08
NCSS2025: COASTAL ACTIVITY PARTICIPATION
Participation in and frequency of engaging in coastal activities varies by activity. 57% of Australian adults participated in swimming/wading on the coast in the past year, followed by 16% for boating and 13% for other watercraft, e.g. stand-up paddleboarding, wind surfing, and other paddle craft.
ACTIVITY PARTICIPATION
NCSS2025: DEMOGRAPHICS & FREQUENCY OF PARTICIPATION
Coastal participation varies by activity, sex, age and state/territory. These pages show the number of annual activity participants, the frequency of participation, as well as the proportion of participants by sex, age group, and state/territory. Frequent participants are those who engage in the activity at least once a month, while occasional participation is considered as less than once per month.
4.7M
FREQUENT SWIMMERS 6.8M
OCCASIONAL SWIMMERS
OCCASIONAL SURFERS
1.9M 0.9M FREQUENT PADDLERS 1.7M OCCASIONAL PADDLERS
2.6M
ROCK FISHING
LAND-BASED FISHING
FISHERS 0.75K
OCCASIONAL FISHERS
1.5M
FISHERS
FREQUENT BOATERS 2.3M
OCCASIONAL BOATERS
SNORKELLING
SCUBA DIVING
SEX AGE (YEARS) STATE PARTICIPATION
0.4M FREQUENT RIDERS 0.7M
OCCASIONAL RIDERS
1.1M 0.6M FREQUENT SNORKELLERS 1.9M
OCCASIONAL SNORKELLERS
2.5M 0.2M FREQUENT DIVERS 0.4M OCCASIONAL DIVERS TOTAL 0.6M
COASTAL ACTIVITY PARTICIPANTS
RISK TAKING & SAFETY BEHAVIOURS
2 in 5 female participants feel experienced enough to take risks, compared to 1 in 2 males
Figure 09
NCSS2025: RISK TAKING VS. FOLLOWING SAFETY PRACTICES BY PARTICIPATION FREQUENCY
Overall, female coastal activity participants are more likely to follow safety practices, and less likely to take risks. In contrast, male coastal activity participants are more likely to take risks, and to follow safety practices less often.
Figure 10
NCSS2025: FOLLOWING SAFETY PRACTICES VS. EXPERIENCED ENOUGH TO TAKE RISKS
This play safe index matrix represents risk for coastal activities by participation frequency (frequent - at least once per month; or occasional - less than once per month). It visualises the proportion of participants who feel experienced enough to take risks, against the frequency with which they follow safety practices for each activity. Icons in the upper right hand corner represent the higher risk activity populations, i.e. they take more risk and follow safety practices less often. These include frequent rock fishers and land-based fishers. Icons in the bottom left represent the lower risk activity populations, including occasional boaters, scuba divers, PWC riders, surfers and swimmers/waders.
COASTAL SAFETY
SWIMMING ABILITY
Being able to swim is an important factor in reducing drowning risk. However, ability to swim in a pool or other controlled environments does not directly translate across to more dynamic, open environments such as beaches, rivers or in the ocean. Similarly, cost of living pressures and differing demographics influence the prioritisation of participating in formal swimming lessons. Programs such as nippers or rippers provide excellent opportunities to learn about safe swimming and recreating in these natural waterways.
24% Australian-born residents have had open water swim lessons, yet only 16% of residents born overseas.
Figure 11
NCSS2025: ABILITY TO SWIM 50M IN THE OCEAN
Younger residents and those born in Australia are more likely to have had swimming lessons, especially in open environments such as oceans and rivers, compared with older residents.
Figure 12
NCSS2025: SELF-REPORTED ABILITY TO SWIM 50M IN THE OCEAN
Two fifths of Australian adults (40%) believe they can swim 50 metres in open water environments without touching the bottom, but only 28% have done so within the past 18 months. Confidence in ocean swimming ability decreases with age and is also lower in females. Adults of Asian and European backgrounds are the least likely to be able to swim 50 metres and to have done so in the past 18 months.
Figure 13
NCSS2025: HAZARD PERCEPTION OF THE COAST & BEACHES
The coast is perceived as very hazardous by one in four Australians (28%), compared to only 14% for the beach. However, unpatrolled beaches are considered very hazardous by 57% of Australian adults, due to the lack of lifeguards and supervision, rip currents and unsafe or unpredictable water or weather conditions.
Figure 14
NCSS2025: SWIMMING ABILITY BY MOST RECENT SWIMMING LOCATION
Most recent beach visits were to patrolled beaches. Even so, more competent swimmers were more likely to swim at unpatrolled beaches, while less competent swimmers went more to patrolled beaches.
Figure 15
NCSS2025: PERCEIVED RISK OF COMMON COASTAL ACTIVITIES, LOCATIONS & HAZARDS
Rip currents remain the number one coastal hazard for 82% of Australians adults, with fewer considering waves (44%) and surfing (27%) as hazardous. This indicates the varied risk perceptions of similar hazards, and the need to educate coastal visitors about risks associated with different environments, features and activities. N.B. arrows indicate change in perception from last year.
HIGH RISK LOCATIONS
UNPATROLLED BEACHES
57%
Australian adults think unpatrolled beaches are very hazardous
1 in 7
Figure 16
NCSS2025: PERCEPTIONS AND VISITATION OF UNPATROLLED BEACHES
Eastern states have lower unpatrolled beach visitation, more patrolled beaches and a higher proportion of residents that consider unpatrolled beaches to be very hazardous. In contrast, western states/territories and Tasmania have higher unpatrolled beach visitation, fewer patrolled beaches and are less likely to consider unpatrolled beaches as hazardous.
Have experienced difficulty in the water at an unpatrolled beach - 1 in 4 aged 16-24 years
3 in 10
Last coastal visits were to an unpatrolled beach
Figure 17
NCSS2025: REASONS WHY SWIMMERS CHOOSE TO GO TO AN UNPATROLLED BEACH
Swimmers primarily choose to swim at unpatrolled beaches as they perceive the risk as low and are confident or familiar with the location. Reasons to visit unpatrolled beaches differs by population group. Males and confident swimmers are typically more confident in their ability, while females and weaker swimmers do not plan to go deep into the water. Convenience is more important to younger swimmers and weekly visitors, while monthly visitors consider mobile phone signal and the presence of public rescue equipment more important than other groups.
MARINE STINGERS
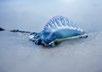
Marine stingers, especially those found in tropical waters, are consistently rated as the second highest coastal hazard after rip currents. This is perhaps not surprising when one in five Australian adults have been stung by a marine stinger, mostly by bluebottles and while swimming.
Since 2014/15, surf lifesavers and ALS lifeguards have treated more than 440 thousand stings at the beach, with many more being selftreated or even requiring emergency care. SLSA has two significant marine stinger research projects looking to mitigate community marine stinger risk.
The BluebottleWatch project (with UNSW Sydney) is developing a predictive model to identify days that are likely to have a high-risk of bluebottle presence. This is possible because bluebottle movements are driven largely by wind and, to some degree, ocean currents.
The Australian Box Jellyfish First Aid Research Project is a collaborative project (led by SLS with James Cook University, and the University of Hawaii) seeking to clarify national jellyfish first aid guidelines to improve consistency, and to optimise tropical marine sting management.
2ND HIGHEST-RATED COASTAL HAZARD 1 in 5
AUSTRALIANS HAVE BEEN STUNG BY A MARINE STINGER
39% ARE VERY/EXTREMELY CONCERNED ABOUT BEING STUNG BY A JELLYFISH
66%
WERE STUNG BY A BLUEBOTTLE 10%
WERE STUNG BY POTENTIALLY LIFE-THREATENING CUBOZOAN JELLYFISH


Figure 18
NCSS2025: STUNG BY WHICH MARINE STINGER? Bluebottles were responsible for 66% of the marine stings reported, followed by blubbers (10%) and jimbles (6%). Potentially life-threatening marine stingers (Irukandji-syndrome and box-jellyfish species) were also reported.
Figure 19
NCSS2025: ACTIVITY WHEN STUNG Most adults were swimming (64%) and wading (16%) at the time they were stung.
1 IN 3 RECEIVED TREATMENT
Figure 20
NCSS2025: STING TREATMENT PROVIDER
Of the one in three stings that received treatment, almost half (47%) were treated by lifesaving services, while 26% required treatment from emergency care providers (ambulance, doctor or hospital).
Figure 21
2015-25: ANNUAL MARINE STINGS TREATED BY SLS & ALS
Lifesaving statistics have revealed SLS services have treated 441,517 since 2014/15. This is an annual average of 40,138 marine stings treated, with significant interannual variability observed.
26%
AMBULANCE/DOCTOR/HOSPITAL
FRIEND/FAMILY MEMBER 25% 47% SURF LIFESAVERS/LIFEGUARDS
19% SELF TREATED
Figure 22
NCSS2025: CHANGES IN HAZARD PERCEPTION OF MARINE STINGERS Community perception of marine stingers as a coastal hazard has increased since 2015.
RIP CURRENTS
KNOWLEDGE, BEHAVIOURS & SKILLS
1 in 5
AUSTRALIAN ADULTS HAVE BEEN UNINTENTIONALLY CAUGHT IN A RIP CURRENT
1 in 2
ADULTS ARE NOT CONFIDENT TO IDENTIFY A RIP CURRENT 49% ARE VERY/EXTREMELY CONCERNED ABOUT GETTING CAUGHT IN A RIP CURRENT
RIP-RELATED DROWNING DEATHS IN 2024/25
82%
CONSIDER RIP CURRENTS VERY/ EXTREMELY HAZARDOUS 30
Prevalence of getting unintentionally caught in a rip current differed by swimming ability, where more competent swimmers were more likely to have been caught compared to weaker swimmers. This risk is likely due to different exposure to the rip current hazard.
Figure 24
NCSS2025: RIP CURRENT ESCAPE METHODS
Most Australian adults who have been unintentionally caught in a rip current managed to self-rescue (66%), while 30% required assistance from a surf lifesaver, lifeguard or a bystander to return to shore.
Figure 25
NCSS2025: CONFIDENCE & ABILITY TO IDENTIFY RIP CURRENTS
Of the 46% of Australian adults who are confident they can spot a rip current, less than half (45%) were able to correctly identify a rip current when tested using the marked up images.
IDENTIFYING RIP CURRENTS
The NCSS2025 trialled a new method to test rip current identification skills. Respondents were divided into two groups, one group were asked to identify a rip current by highlighting anywhere on an image of a beach, while the other group was given four marked potential rip current locations. For the first group with no marked prompts to suggest where a rip current could be, rip current identification ability was lower and varied substantially, with only 6% correctly identifying the rip current in both images, while 36% of respondents in the second group correctly identified the rip current in both images. These results revealed the concerningly low level of rip current understanding/literacy among Australian adults, reinforcing the need for stronger rip current education and drowning prevention strategies. This result also reaffirms the relevance of existing swim between the flags messaging, highlighting the important role beach lifesaving services play and that swimming between the red and yellow flags is the safest place on the beach.
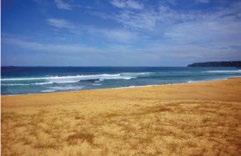
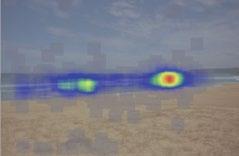
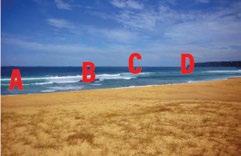
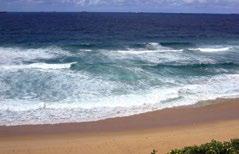
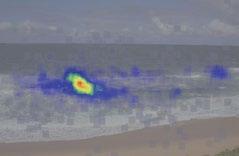
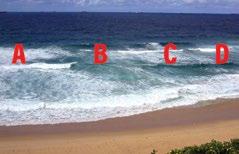
Figure 26
NCSS2025: RIP CURRENT IDENTIFICATION METHODOLOGIES
Participants tested using the new method were less likely to correctly identify the rip in both images, with only 6% able to do so, compared with the original question style for which 36% of respondents succeeded. Additionally, a greater proportion of respondents to the new method were not sure (25%) compared to 12% with the original method.
27
NCSS2025: CORRECT IDENTIFICATION BY RIP CURRENT KNOWLEDGE, EXPERIENCE & SWIMMING ABILITY
Australian adults who have been unintentionally caught in a rip current, are confident to identify a rip current, or consider themselves competent ocean swimmers were better at accurately identifying rip currents than average. This shows that rip current identification skills are improved with greater exposure and experiences with rip currents.
Figure
New testing method
New testing method (response)
Original testing method
SECTION 2 CAPABILITY
316 SURF LIFE SAVING CLUBS
49,750 PROFICIENT MEMBERS
1,469,465 VOLUNTEER PATROL HOURS
8,207 RESCUES PERFORMED
238 AUSTRALIAN LIFEGUARD SERVICES
9 WESTPAC LIFESAVER RESCUE HELICOPTER SERVICES
VALUE TO COMMUNITY
$9,000,003,752
CAPABILITY
CORE SERVICES & OPERATIONAL OVERVIEW
Surf Life Saving’s (SLS) position as Australia’s leading coastal safety authority is based on the national delivery of its essential services. SLS provides these core services through Surf Life Saving Clubs (SLSCs), Support Operations, and the Australian Lifeguard Service (ALS), who are responsible for coastal patrols, surveillance, and search and rescue (SAR) operations. The ability of SLS to carry out these vital functions, including its support in SAR operations, after-hours incidents, and natural disasters, is well-regarded by emergency services and disaster response agencies. The community and partner organisations are safeguarded through our dedication to high-quality training, with 41,707 Bronze Medallion and 8,043 Surf Rescue Certificate holders across 316 Surf Life Saving Clubs.
VOLUNTEER SURF LIFESAVERS
Surf Life Saving Australia's (SLSA) success stems from our robust volunteer base, comprising over 207,000 members, making it one of the largest volunteer organisations globally. This diverse and skilled volunteer workforce is vital to SLSA’s achievements. In the past year, 46,307 volunteers contributed 1,469,465 hours of service through patrols. During these patrols, volunteers performed 5,371 rescues, undertook 508,079 preventative actions, and provided 34,394 first aid treatments.
Surf lifesavers are equipped with specialised gear and equipment and trained to use it effectively in various conditions. Rescue boards and tubes are primary tools for surf lifesavers on patrol, complemented by 1,199 inflatable rescue boats (IRBs) that enhance our service reach and capabilities. IRBs enable swift navigation through inshore surf, allowing surf lifesavers to cover greater distances for extended periods. Rescue boards are the most frequently used equipment for rescues (see Figure 34). Land-based roving patrols enhance our aquatic services and are a crucial part of SLSA’s drowning prevention strategy. A fleet of 417 side-byside (SSV) vehicles and 231 4WD vehicles support patrols to monitor coastal locations beyond supervised patrolled areas. Aerial surveillance is facilitated by Unmanned Aerial Vehicles (UAVs; Figure 37), broadening our reach and effectiveness. SLSA’s capabilities extend beyond the iconic red and yellow flags, with 226 rescue watercraft (RWCs) and two jet rescue boats (JRBs) allowing for prompt responses in challenging coastal conditions. The organisation also operates four offshore rescue boats (ORBs) and five rigid-hull inflatable boats (RIBs) for offshore rescues and extended surveillance and SAR
operations.
AUSTRALIAN LIFEGUARD SERVICE
The Australian Lifeguard Service (ALS), a division of SLSA, is the largest professional lifeguard provider in Australia, operating 238 services at beaches and pools. With over 1,350 lifeguards employed on full-time, part-time, and casual contracts, the ALS complements SLSA’s volunteer services to provide comprehensive, year-round safety, including 365-day coverage. The ALS logged 483,020 service hours, performed 2,836 rescues, executed 1,686,625 preventative actions, and administered 31,548 first aid treatments. The ALS delivers value by avoiding duplication of assets and efficiently sharing resources with SLSC's. ALS lifeguards are equipped with specialised gear and trained to use it effectively in various conditions. RWCs serve as a primary lifesaving tool in aquatic environments. Their operations are supported by 69 vehicles and 49 RWCs. Lifeguard services managed internally by local governments are not included in this report.
FLOOD & SWIFTWATER RESCUE
In addition to our core coastal safety role, SLSA provides valuable support to communities and emergency services during major flood events. Building on members’ expertise in rescue boat operations, first aid, communications, and community engagement, lifesavers can be trained and equipped to assist in flood response. SLSA’s contribution is focused on surge capacity and support functions, including assisting with evacuations, conducting welfare checks, supporting supply drops, and working alongside lead emergency agencies during disasters. This role is underpinned by nationally consistent training and equipment standards developed through the Centre of Excellence for Flood and Swiftwater Rescue.
Importantly, SLS does not operate as a primary flood rescue agency, but as a trusted partner that can bolster existing emergency response systems. This collaboration ensures a stronger, more coordinated approach when large-scale flood events place significant demand on emergency services.
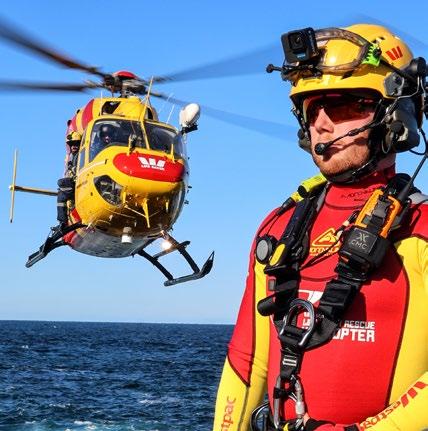
WESTPAC LIFESAVER RESCUE SERVICES
The nine Westpac Lifesaver Rescue Helicopters and one Offshore Rescue Boat that operate around Australia under the banner of SLS continue to extend capability, response, and reach, providing essential services to more locations in times of need.
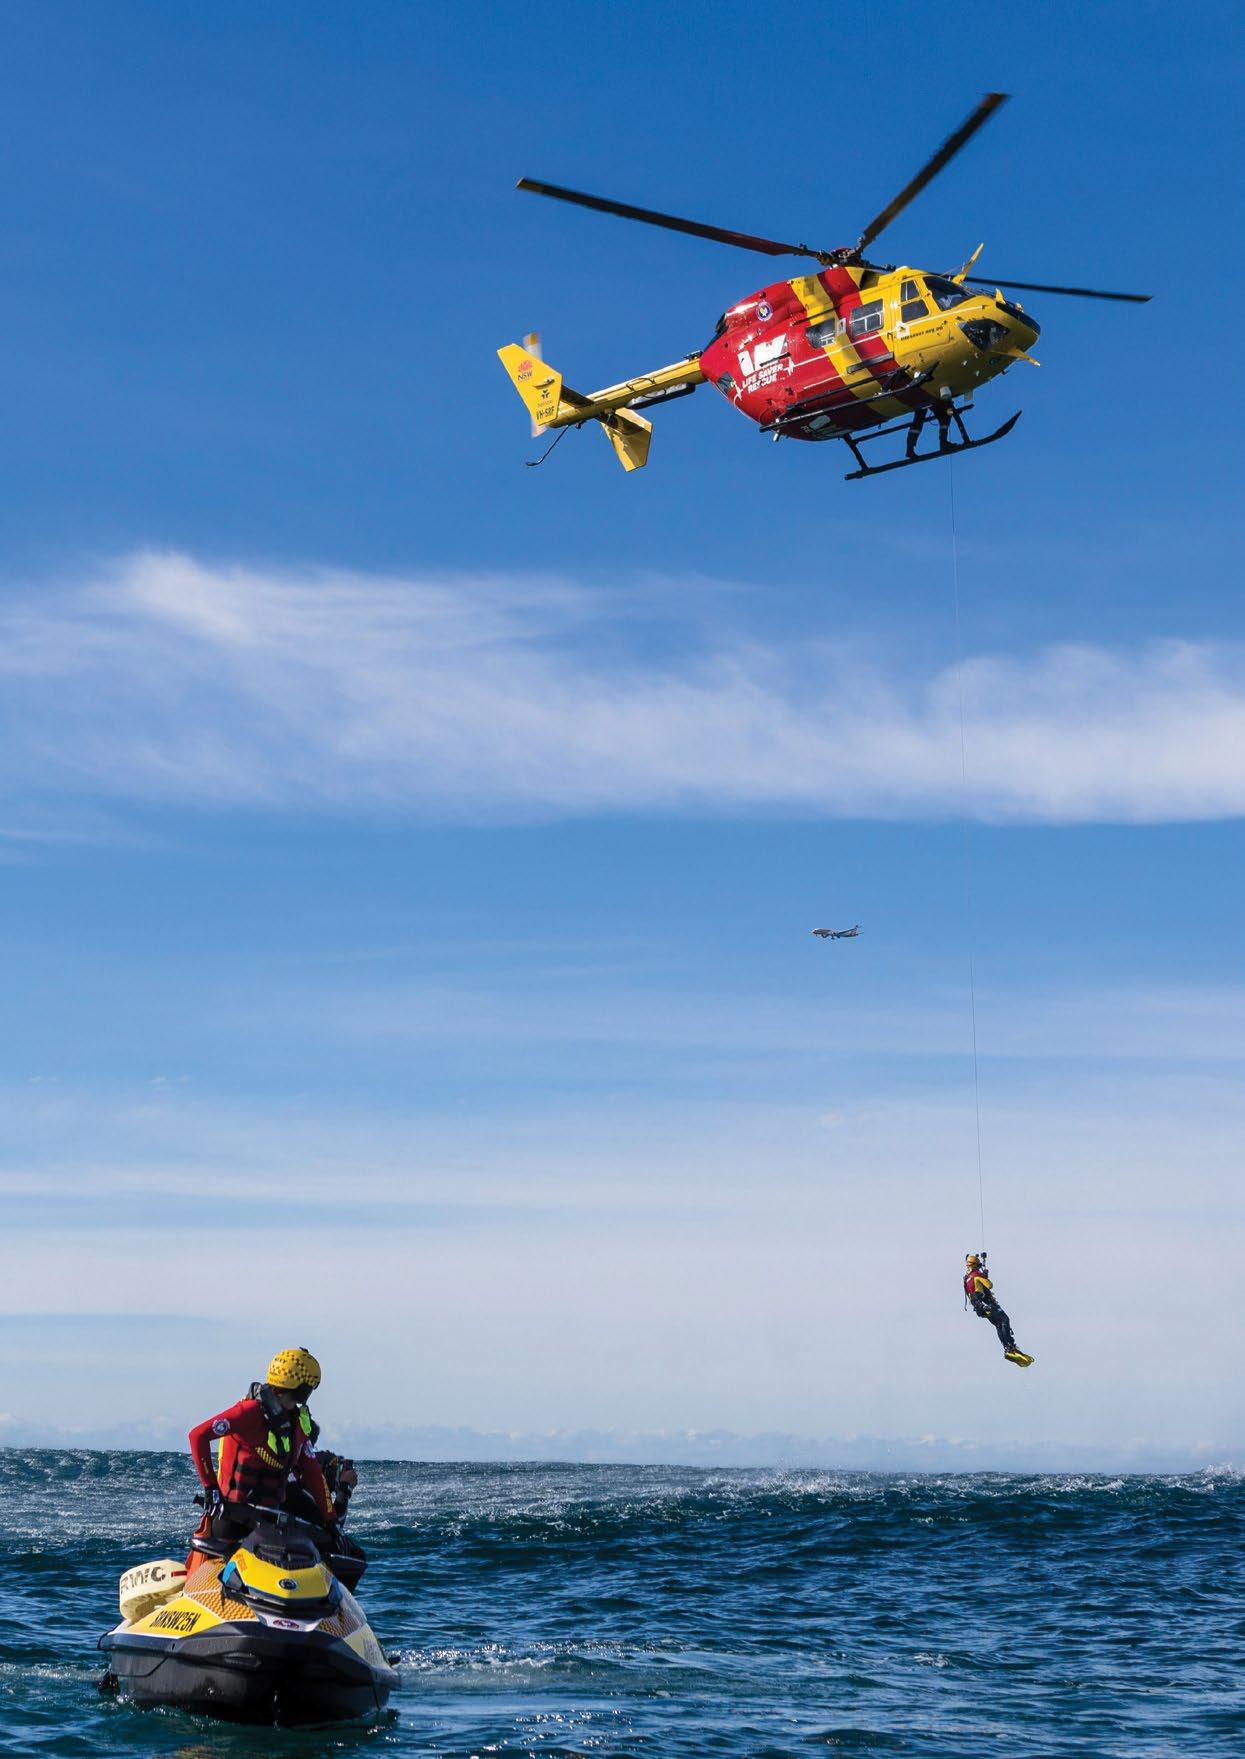
The aircraft enable rapid response to areas that would otherwise take several hours to reach by road or water. When lives are on the line, minutes matter and seconds count. This is where the Westpac Lifesaver Rescue Helicopters make a difference arriving in a short period of time and commencing actions to reduce injury and loss of life. In many situations, the helicopters also reduce the risks that members using vehicles or Rescue watercraft (IRBs/RWCs) might otherwise be exposed to.
In the past twelve months, the helicopters have performed more than 2,000 flights, with over 500 of these being Search and Rescue (SAR) missions. Close to 70 flights were undertaken in response to shark detections, either to mitigate risks to water users or to provide assistance where an encounter had occurred. Natural disasters, such as floods, have also been part of the mission tasking. Almost 4,000 preventative actions were undertaken, nearly 200 rescues performed, and a further 214 people treated for first aid, ranging from minor injuries through to CPR. In addition, the Westpac Offshore Rescue Boat was tasked for more than 150 hours including 11 search and rescue missions, six search and rescue exercises with external agencies and water safety for five major community events. Over the past 51 years, the Westpac Lifesaver Rescue services have become an essential component supporting the work of SLS across the country.
SURF LIFE SAVING SERVICES
2024/25: SURF LIFE SAVING SERVICES
SLSA supports 557 services around Australia. There are 316 SLSCs and three affiliated marine rescue services, with 129 in New South Wales, 58 in Queensland, 57 in Victoria, 31 in Western Australia, 23 in South Australia, 15 in Tasmania and three in the Northern Territory. The ALS provides 238 lifeguard services around Australia, with 96 in New South Wales, 70 in Queensland, 42 in Victoria, 18 in Western Australia, nine in the Northern Territory, two in Tasmania and one in South Australia.
2,194,704
VALUE TO COMMUNITY
65,942
1,381,776
8,207 RESCUES
9,000,003,752
483,020
1,952,485
87,689
RESCUES
Figure 30
2024/25: RESCUES PER LOCAL GOVERNMENT AREA
SLS lifesavers, lifeguards and lifesaving services performed 8,207 rescues across 117 local government areas around Australia.
Key to Rescues per LGA

< 14 Rescues

15 - 49 Rescues

50 - 149 Rescues

150 - 399 Rescues

> 400 Rescues
1,072
58 170
2,355
3,494
1,011
47
PREVENTATIVE ACTIONS
Figure 31
2024/25: PREVENTATIVE ACTIONS PER LOCAL GOVERNMENT AREA
SLS lifesavers, lifeguards and lifesaving services performed 2,194,704 preventative actions across 117 local government areas around Australia.
Key to Preventative Actions per LGA
< 1,499 Actions
1,500 - 4,999 Actions
5,000 - 19,999 Actions
20,000 - 99,999 Actions
> 100,000 Actions
10,579
113,724
6,855
617,666
356,236
1,087,710
1,934
FIRST AID
32
2024/25: FIRST AID PER LOCAL GOVERNMENT AREA
SLS lifesavers, lifeguards and lifesaving services performed 65,942 first aid treatments across 117 local government areas around Australia.
Key to First Aid Incidents per LGA
< 49 Incidents
50 - 349 Incidents
350 - 649 Incidents
650 - 2,999 Incidents
> 3,000 Incidents
3,007
233
35,142
851
24,944
1,621
144
RESOURCE CAPACITY
SLS has 49,750 proficient members, 41,707 members are Bronze Medallion holders and 8,043 members hold Surf Rescue Certificates (see below). There were a total of 46,307 members who performed a patrol. Of these patrolling members, 60.4% were male, 39.5% were female and 36 members identified with a non-binary gender (<1%; see above). Members also hold other lifesaving awards, equating to 72,430 additional lifesaving qualifications (See Figure 33). This highlights the extent of training our surf lifesavers undertake to ensure they are highly skilled first responders.
49,750
41,707
BRONZE MEDALLION
8,043 SURF RESCUE CERTIFICATE
* Totals include member holders of multiple similar awards.
Figure 34
2024/25: EQUIPMENT USED IN RESCUES
Rescue boards were used in 39% of rescues, followed by rescue tubes (19%) and rescue watercraft (RWCs; 18%).
EMERGENCY FLOOD DEPLOYMENTS
337 SLS personnel trained for flood and disaster response
Figure 35
75 PERSONS RESCUED/ EVACUATED
10,947 HOURS DEPLOYED

SLS PERSONNEL DEPLOYED
2024/25: SLS EMERGENCY DISASTER RESPONSE
SLS conducted 24 emergency flood deployments across key regions including Northern Rivers, Coffs Harbour, Port Macquarie, Taree (NSW), Townsville/Ingham (QLD), Barwon (VIC), and multiple locations in Tasmania. A total of 296 SLS personnel contributed over 10,947 hours to disaster response operations, resulting in the rescue or evacuation of 75 people. To strengthen capability, 337 members were trained specifically for flood and disaster response operations in the 2024/25 season.
ASSET CAPABILITY
2024/25: SLS MAJOR ASSET LOCATIONS & SERVICE RANGE
Key to Asset Location
Rescue Water Craft (RWC)
Jet Rescue Boat (JRB)
Rigid-hull Inflatable Boat (RIB)
Offshore Rescue Boat (ORB)
Westpac Lifesaver Rescue Helicopter
SLS maintains a fleet of 275 rescue watercraft (RWC), two jet rescue boats (JRB), five rigid-hull inflatable boats (RIB), four offshore rescue boats (ORB), and nine rescue helicopters. Their locations and service ranges are depicted on this map. 50
AVIATION SERVICES
UNMANNED AERIAL VEHICLE OPERATIONS
Figure 37
2024/25: UAV CAPACITY
SLS UAV operations are a critical asset to lifesaving, with 39,065 flights conducted, 36,128 dedicated to shark surveillance, and the remainder supporting beach surveillance, search and rescue, and disaster response. Covering more than 164,586km, these operations are delivered by 761 nationally accredited pilots, operating within State UAV services as well as 95 clubs across the country.
39,065
NUMBER OF FLIGHTS
164,586 KMS FLOWN
761
36,128
SHARK SURVEILLANCE
AVIATION CAPABILITY
WESTPAC LIFESAVER RESCUE HELICOPTER
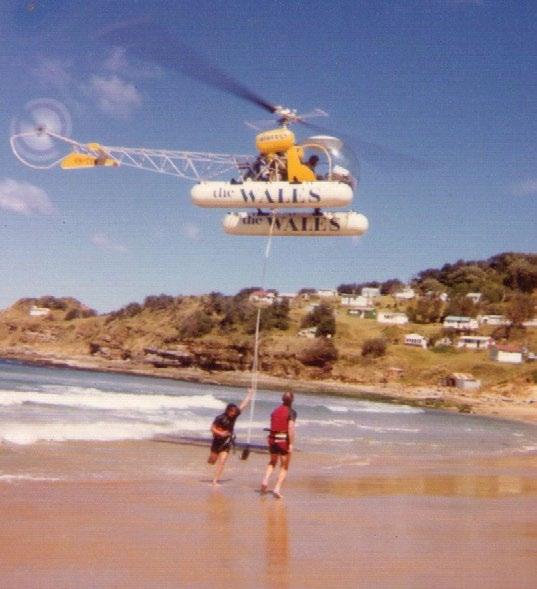
The Westpac Lifesaver Rescue Helicopters are recognised not only across Australia but also internationally. Initially founded in 1973 by SLSA, the service has celebrated over 50 years of operations and performed more than 100,000 missions in this time. Importantly, every mission undertaken by services under SLS have been provided at no cost to those we have rescued or assisted.
From humble beginnings, the service first began on 29 September 1973 at Maroubra. This initiative began with Ian Badham and a group of SLS members exploring how rescues could be more time effective and able to be delivered in large seas. With the support of the Wales Bank (later Westpac) and a $25,000 donation, the service launched a trial which, due to the success, quickly evolved and expanded.
Westpac has been with us since the beginning. Thanks to this partnership, there are now nine Westpac Lifesaver Rescue Helicopters across Australia and one Westpac Lifesaver Offshore Rescue Boat in the Northen Territory. Additionally, there are another six Westpac Rescue Helicopters aligned to Ambulance and Police operations in Northern NSW and Tasmania.
Behind every service is a dedicated team ensuring the Westpac Lifesaver Rescue Helicopters are always ready when needed. From pilots, air and rescue crew, through to engineers and administration and support staff and volunteers, it is a team effort that keeps the helicopters flying. While various state governments provide some support, donations and fundraising remain critical to keeping the services in the air and ensuring that no one ever has to pay to be rescued or assisted.
Westpac Lifesaver Rescue Helicopter services around the country have attended numerous major events including but not limited to;
• Granville train disaster
• Milperra bikie massacre
• Thredbo landslide – Stuart Diver
• Sydney to Hobart tragedy –6 lives lost
• NSW & Queensland floods (over several years)
• NSW bushfires
• Shark attacks across South Australia, Western Australia, New South Wales and, Queensland.
SEASON 2024/25 SUMMARY
2,096
TOTAL NUMBER OF MISSIONS
839 SHARK SIGHTINGS
1,372 COASTAL PATROL FLIGHTS
519 SAR (SEARCH & RESCUE)
29 NATIONAL DISASTER FLIGHTS (FLOODS)
194 RESCUES/RECOVERY
214 FIRST AID
3,903 PREVENTATIVE ACTIONS
Each day the services across the country attend to many varied incidents, helping those in need. From wayward surfers, swimmers caught in rips, to rock fishers swept into the ocean, capsized vessels and coastal hazards identification (such as rip currents and shark sightings) –there is always something happening along our coast. Some services go even further, responding to flood events, assisting communities in times of need, searching for missing people in bushland, mountains and alpine regions.
The Westpac Lifesaver Rescue Helicopters support not only surf lifesavers and lifeguards on the beach, but also a wide range of agencies including the Police, Ambulance, AMSA (Australian Maritime Safety Authority), State Emergency Services (SES), National Parks, Marine Rescue, Rural Fire Services, Fire and Rescue, and more. When it comes to saving lives, it is essential we all work together.
INNOVATION DAY
BRIDGING LOCAL EXPERTISE WITH GLOBAL TECHNOLOGY IN LIFESAVING
Stretching thousands of kilometres, Australia’s coastline demands both resilience and adaptability. As beach conditions shift and coastal communities expand, SLS must evolve its existing systems to remain responsive and effective. The SLS Innovation Day 2024 held at Wanda SLSC, brought together lifesaving experts from around the country, technical specialists, and emergency service leaders to examine how emerging technologies can support and enhance rescue capabilities through practical testing, observation, and critical feedback.
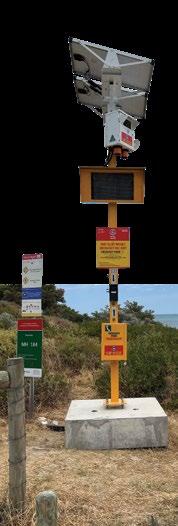
A diverse range of technologies were showcased, spanning from wearable automatic flotation technology to autonomous surveillance solutions. Motorised rescue equipment and personal GPS trackers focused on enhancing visibility, safety, and real-time location tracking for lifesaving personnel. Shore-based infrastructure, including emergency response beacons, were also demonstrated to support communication and rapid incident response in unpatrolled locations.
Autonomous and remote controlled innovations also featured prominently. These included innovative unmanned aerial vehicles for coastal surveillance, AI-powered shoreline monitoring systems, and remote rescue craft capable of assisting during complex incidents. Sustainable transport options such as electric powered bikes and motors were introduced as lower emission alternatives for patrol and beyond the flag’s response.
extend not replace the capability of skilled personnel. Human oversight, adaptability, and robust training remain essential.
Sustainability emerged as a strategic priority across several demonstrations. The introduction of electric motors suggested the potential for operational and environmental gains. However, practical considerations such as charging infrastructure, maintenance, and deployment logistics were identified as necessary areas for further development.
Innovation Day reinforced the value of iterative learning, collaboration, and field-based refinement.
A key insight from the day’s activities was the critical role of operational context. Technologies must be shaped by the practical needs of those using them. Lifesaving experts participating in trials identified both strengths and limitations in the innovations presented, particularly around durability in harsh marine conditions, integration with existing workflows, and battery performance.
Some emerging systems, such as AI detection platforms and remote rescue craft, demonstrated real potential to assist with mass rescue and surveillance operations. However, participants emphasised that technology must
Rather than focusing on any single breakthrough, the Innovation Day reinforced the value of iterative learning, collaboration, and field-based refinement. The event highlighted that effective innovation stems from collaboration between the manufacturers present and lifesaving personnel, and that successful solutions must be tailored to meet the varied demands of real-world coastal environments. The outcomes of this collaboration were presented at AFAC2025, and its success was highly commended for building connections.
By combining lifesaving personnel with emerging global technologies, the lifesaving sector can strengthen its ability to prevent, respond to, and adapt to coastal risks. As SLS works toward reducing coastal drowning deaths, fostering this culture of innovation will remain critical to building a safer, more responsive future for all beachgoers.
MOST NOTABLE INNOVATIONS INCLUDED:
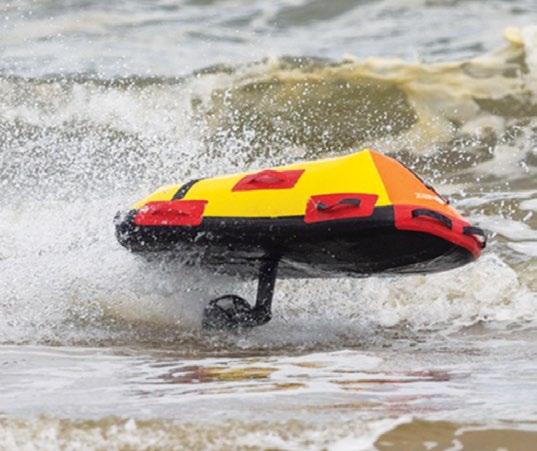
ROBODUCKY
Remote controlled rescue craft
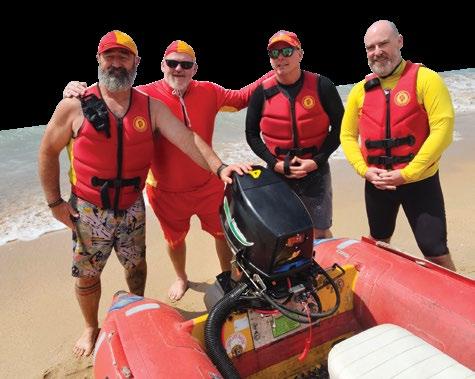
ELECTRIC OUTBOARDS
Surveillance technology
ENABLERS OF PROGRESS
• sector-wide and multidisciplinary collaboration
• robust trial and testing approaches
• accessible pathways for user feedback
LIFESAVING CPR
A TARGETED EDUCATIONAL PROGRAM TO IMPROVE CPR DELIVERY IN SURF LIFE SAVING
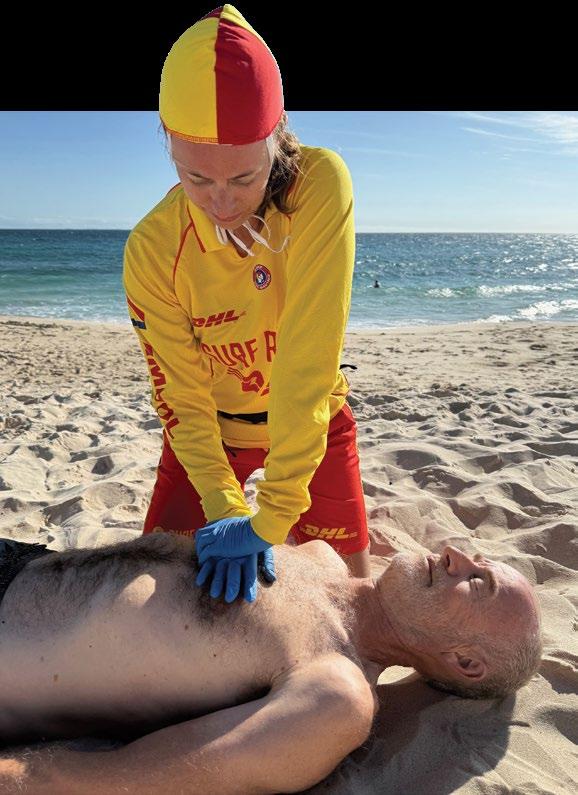
Lifesaving CPR is an evidence-based, standardised, and simplified approach designed to improve survival rates from cardiac arrest, both on and off the beach.
BACKGROUND
Each year, ~26,000 out-of-hospital cardiac arrests (OHCA) occur in Australia, with only 13% of patients surviving to return home. Survival rates vary based on factors like early provision of cardiopulmonary resuscitation (CPR) by bystanders, AED use, and ambulance response times.
On average, SLSA members respond to 65 cardiac arrests each year while on duty and often also act as first responders in community settings, with many patients requiring CPR. Recognising its broad reach and lifesaving mission, SLSA developed a CPR quality improvement program aimed at increasing survival outcomes.
APPROACH
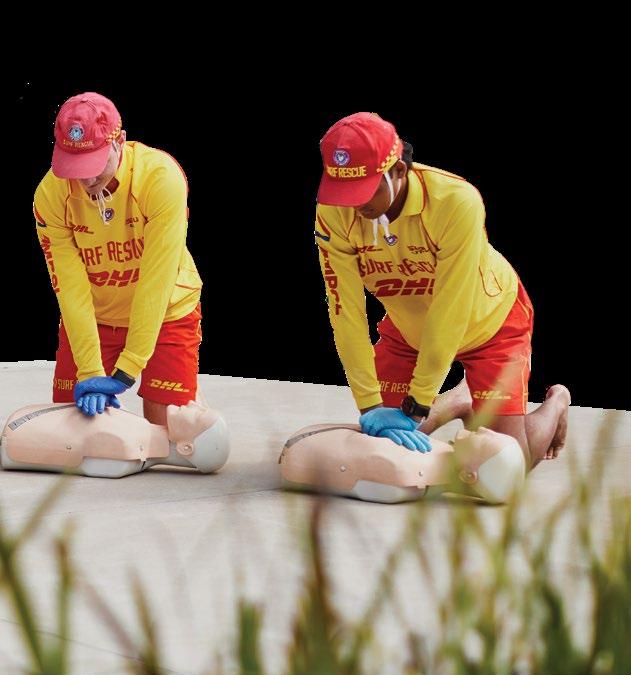
A pilot study was conducted with qualified volunteer surf lifesavers. Participants underwent a tailored educational intervention based on the Resuscitation Academy’s HighPerformance CPR model, adapted for the Australian surf lifesaving context and branded “Lifesaving CPR.” The educational intervention included theory and practical elements of CPR. The practical element focused on key measurements of improvement, including team-based working, structured approach to CPR, and a focus on technical aspects of skills and individuals. The intervention included:
A 2-MINUTE CPR PERFORMANCE ASSESSMENT (PRE-TRAINING)
THEORY AND PRACTICAL TRAINING
A REPEAT 2-MINUTE CPR ASSESSMENT (POST-TRAINING)
RESULTS
From 159 total participants, 58% completed both the quiz and face-to-face training (n=93) and were included in analysis. Post-training assessments showed statistically significant improvements in CPR performance, including:
INCREASED CHEST COMPRESSION FRACTION
IMPROVED COMPRESSION RATE
REDUCED TOTAL PAUSE TIME AND LONGEST PAUSE
LIFESAVING CPR
KEY AIMS OF LIFESAVING CPR
DISCUSSION
This study showed that targeted training programs can improve CPR metrics, which in turn support better outcomes for OHCA patients on our beaches and within our community. These results prompted broad adoption of Lifesaving CPR across SLS, with all SLS states and territory incorporating the updated techniques into their 2025/26 season Skills Maintenance programs and into new courses.
SLSA training resources for CPR have been updated for Lifesaving CPR, including the Public Safety Aquatic Rescue Training Manual, the Bronze Medallion and Surf Rescue Certificate CPR assessment tasks and online learning.
Footnote:
Adapted from: Reid D, Dixon KM, Equid L, Jacobson C, Lawes J, Hare-Boyd T, Chubb A, Murphy M, Treloar K, Simon P, Douglas N. (2025) Lifesaving Cardiopulmonary Resuscitation: A Pilot Evaluation of a Targeted Educational Intervention to Improve Cardiopulmonary Resuscitation Provision in Volunteer Surf Lifesavers. https://www.sciencedirect.com/science/article/pii/ S0736467925001738
SECTION 3 COASTAL MORTALITY
154 DROWNING DEATHS
COASTAL MORTALITY
2024/25: YEAR IN REVIEW
Figure 38
2024/25: COASTAL DEATH OVERVIEW
Overall, 239 coastal deaths were recorded in 2024/25, with a mortality rate of 0.87/100,000 pop.
Drowning deaths in coastal environments (n=154) accounted for 43% of the national drowning burden (n=357). These numbers are the highest ever recorded, with coastal drowning deaths 3% above last year and 21% above the ten-year average. In addition to the 154 coastal drowning deaths, 85 other coastal fatalities were recorded, 58% of which were unintentional.
The Australian coastline claimed 239 lives in 2024/25, a 7% decrease from 2023/24 (n=258), and a 1% increase from the ten-year average (n=236).
Males remained a high-risk demographic (87%), 6.8 times more likely to drown compared to females. Older Australians have again emerged as the highest risk cohort, with one in four coastal drowning decedents aged 60-69 years (25%) and 55+year olds comprising 55% of the coastal drowning burden.
Beaches claimed 82 lives, all occurring outside patrol times or at unpatrolled beaches away from services. Swimming/wading was the most common activity prior to drowning (32%), followed by boating/PWC (14%), then equally by snorkelling and falls (9% each).
These numbers may have been far worse if not for the incredible efforts of SLS members who are often on duty to protect beachgoers. This section explores these deaths to inform operations and better understand the mortality burden our members and community face.
Figure 39
2024/25: COASTAL MORTALITY BY STATE
NSW recorded the highest number of coastal deaths (n=89; 58% due to drowning) , followed by WA (n=46; 59% due to drowning), then QLD (n=43; 72% due to drowning). WA also recorded the highest mortality rate (1.53/100,000 pop.), followed by SA (1.27/100,000 pop.). Unintentional drowning was the most prevalent coastal death type (64%, n=154).
Coastal drowning
Coastal fatality
Coastal drowning or fatality
27:19
2
18:6
31:12
52:37
20:9
6
40
2024/25: COASTAL DEATH LOCATIONS
Red and yellow numbers indicate the number of drowning deaths and fatalities respectively for each state. For states with small numbers, black numbers indicate combined drowning deaths and other fatality numbers.
2024/25: LOCAL GOVERNMENT AREA BLACKSPOTS
A blackspot is an area where a concentration of incidents are recorded and have a high probability or risk of reoccurrence. These LGAs below recorded the highest number of fatal coastal incidents (both drowning deaths and other fatalities) in 2024/25.
NSW: Northern Beaches, Central Coast, Kiama, Woollahra, Port Macquarie-Hastings, Randwick, Wollongong
QLD: Gold Coast, Queensland Parks and Wildlife Service, Great Barrier Reef Marine Park Authority, Moreton Bay, Mackay, Sunshine Coast, Brisbane
VIC: Parks Victoria, Greater Geelong, Mornington Peninsula, Bayside, Kingston
WA : Department of Biodiversity, Conservation & Attractions, Stirling, Cockburn, Carnarvon, Joondalup, Wanneroo
TAS: Clarence, Glamorgan-Spring Bay
SA : Kangaroo Island, Streaky Bay
NT: Palmerston, East Arnhem
Figure
COASTAL DROWNING
2024/25: YEAR IN REVIEW
The following pages present a deeper analysis of coastal drowning deaths that occurred this year. These descriptive analyses help to understand circumstances around incidents and guide the development of education and awareness programs, initiatives and actions to reduce coastal incidents into the future.
KEY DEMOGRAPHICS
COASTAL DROWNING DEATHS
DROWNING RATE/100,000 POP. 0.56
55% 55+ YEAR OLDS 1 in 4 60-69 YEARS OLD 13%
Males drowned at a rate 6.8x higher than females
Coastal drowning risk was 3.3x higher on public holidays and long weekends
Figure 41
2024/25: COASTAL DROWNING BY AGE & SEX
The highest number of coastal drowning deaths were recorded among 60-69 year olds (25%, n=38), with 55% aged 55+ years (n=85). The highest age-specific drowning rate was among 65-69 year olds (1.53/100,000 pop.), followed by 75-79 year olds (1.21/100,000 pop.). Males were 6.8 times more likely to drown than females (0.99/100,000 males vs. 0.14/100,000 females), representing 87% of drowning deaths (n=134). Medical co-morbidities were reported in at least 23% of coastal drowning deaths (n=35), which could be higher with COD unknown for 69% of cases.
DEMOGRAPHICS HIGHLIGHT
32% SWIMMING/WADING
Figure 42
RIP CURRENTS 53% BEACH 71% >1KM FROM SLS 9% ALCOHOL/DRUGS
33% MEDICAL CO-MORBIDITY
2024/25: 55+ YEAR OLD DROWNING
In 2024/25, 85 drowning decedents were aged 55 years or older, an increase of 29% from last year (n=66) and 70% from the 10-year average (n=50). Most decedents were male (88%), one third were alone when they drowned and at least 33% involved medical co-morbidities.

Figure 43
2024/25: DROWNING DISTANCE TO SURF LIFE SAVING SERVICE
Almost three in four drowning deaths occurred more than 1km from a Surf Life Saving service (73%, n=112). All incidents occurred outside of the red and yellow flags, patrol times, or at unpatrolled locations.
Figure 44
2024/25: DROWNING BY ACTIVITY
Swimming and wading recorded the most drowning deaths (32%, n=50), followed by boating/PWC (14%, n=21), then by snorkelling and falls (9%, n=14 each). Swimming and wading drowning deaths increased by 22% compared to the 10-year average.
1 in 3 beach drowning deaths were due to rip currents
Figure 45
2024/25: REMOTENESS CLASSIFICATION OF DROWNING LOCATION
Almost two in three incidents occurred in regional/remote areas (57%, n=88), 40% in major cities, and 3% offshore. The remoteness classification of an incident location was coded to the Australian Statistical Geographical Standard of Remoteness Areas.
Figure 46
2024/25: DROWNING BY LOCATION & RIP CURRENT DROWNING AT BEACHES Beaches were the leading location for coastal drowning deaths (53%, n=82), followed by rock/cliff (20%, n=31), then offshore (15%, n=23). Rip currents were known to contribute to more than one in three beach drowning deaths (37%, n=30), however, this may be higher as rip involvement remains unknown for 40% of beach cases (n=33).
Figure 47
2024/25: RESIDENCE DISTANCE TO DROWNING LOCATION
Most decedents lived locally to the drowning location (23%, n=35), followed by those who were intrastate visitors (20%, n=32).

47%
OCCURRED IN THE AFTERNOON (12-6PM)
Figure 48
2024/25: DROWNING BY DAY
Two in five drowning deaths occurred on a weekend (37%, n=54), with weekend drowning rates 1.35 times greater than during the week. Four in five drowning deaths occurred between 6am and 6pm (84%, n=129), most commonly in the afternoon (12-6pm; 47%, n=57).
Figure 49
2024/25: DROWNING BY MONTH
Most coastal drowning occurred during summer (40%, n=62), 20% above average. December (17%, n=26) and April (16%, n=25) recorded the highest number of drowning deaths, 127% and 53% above average respectively.
COASTAL DROWNING LOCATIONS
2015-25: TEN-YEAR ANALYSIS
Figure 50
2015-25: COASTAL DROWNING TRENDS (N=1,301)
Annual coastal drowning trends are illustrated above. Tragically, 154 coastal drowning deaths were recorded in 2024/25, 21% above the 10-year average and the highest number since our records began in 2004/05. The 2024/25 coastal drowning rate (0.56/100,000 pop.) was above average (0.50/100,000 pop.), but below 2015/16 (0.58/100,000 pop.).
2015-25: KEY DEMOGRAPHICS
AVERAGE DROWNING DEATHS
DROWNING RATE/100,000 POP.
16% 20-29 YEARS OLD
17% 60-69 YEARS OLD
Figure 51
2015-25: DROWNING ACTIVITY COMPARED TO 2024/25
Drowning incidence varies by activity and over time. Since 2015, swimming and wading has recorded the most drowning deaths (32%, n=418), followed by boating and PWC (19%, n=247), then snorkelling (9%, n=121).
Figure 52
37% of beach drowning was due to rip currents
2015-25: DROWNING DISTANCE FROM A SURF LIFE SAVING SERVICE
Three in four drowning deaths (73%, n=953) occurred greater than 1km from a Surf Life Saving service.
Figure 53
2015-25: DROWNING BY LOCATION
Beaches remain the leading drowning location (49%, n=644), followed by offshore (21%, n=269), then rock/cliff locations (17%, n=221). One in three beach drowning deaths are due to rip currents (37%, n=232), although this is likely higher with 34% of cases unknown (n=217) .
Figure 54
2015-25: REMOTENESS CLASSIFICATION OF COASTAL DROWNING
One in two drowning deaths occurred in a regional/remote area (55%, n=722), followed by major cities (39%, n=503), then offshore waters (6%, n=79). The remoteness classification of an incident location was coded to the Australian Statistical Geographical Standard of Remoteness Areas.
Figure 55
2015-25: RESIDENCE DISTANCE TO DROWNING LOCATION
Most decedents were intrastate visitors to the drowning location (n=383), followed by local (n=346) and nearby residents (n=301).
UNITED STATES OF AMERICA
Figure 56
2015-25: VISITOR CATEGORY OF DECEDENT
Most decedents were Australian residents (n=923) followed by short term visitors (n=82) and international students (n= 42).
COUNTRIES OF OVERSEAS-BORN DECEDENTS
Figure 57
2015-25: BIRTH CONTINENT OF DECEDENT
Birth continent is known for 87% of coastal drowning deaths (n=1,126), of these 46% of decedents were born in Australia (n=595), 20% were born in Asia (n=266), and 12% born in Europe (n=162).
58
2015-25: DROWNING BY TIME
Most coastal drowning deaths occurred in the afternoon (45%, n=583), followed by the morning (30%, n=393). The highest density have occurred between 10am and 5pm (52%, n=681; shaded area). Incident time was unknown for 5% of cases (n=71), which were excluded from analyses.
38% OCCURRED ON THE WEEKEND 41% OCCURRED IN SUMMER
59
2015-25: DROWNING BY MONTH & DAY
Most coastal drowning deaths occurred during summer (41%, n=529; Dec-Feb), followed by autumn (25%, n=327; Mar-May). By month, January has recorded the highest number (16%, n=202), then December (14%, n=186). A disproportionate number of coastal drowning deaths occurred on weekend days (38%; n=489), with drowning risk 1.5 times greater on the weekend.
Figure
Figure
COASTAL DROWNING LOCATIONS
18
89
273
469
UNINTENTIONAL COASTAL FATALITIES
2015-25: TEN-YEAR ANALYSIS
Figure 60
2015-25: COASTAL FATALITY TRENDS (N=571)
Annual unintentional coastal fatality trends are illustrated above. The 2024/25 coastal fatality total (n=49) and rate (0.18/100,000 pop.) were below the 10-year average.
2015-25: KEY DEMOGRAPHICS
AVERAGE COASTAL FATALITIES 59 FATALITY RATE/100,000 POP.
22% 55-64 YEARS OLD
21% 65-74 YEARS OLD
Figure 61
2015-25: COASTAL FATALITY ACTIVITY
COMPARED TO 2024/25
Coastal fatalities vary by activity and over time. Since 2015, boating/PWC has recorded the most unintentional fatalities (22%, n=134), followed by falls (12%, n=69) and non-aquatic transport (11%, n=66).
Figure 62
2015-25: FATALITY DISTANCE FROM A SURF LIFE SAVING SERVICE
Three in four coastal fatalities (77%, n=441) occurred greater than 1km from a Surf Life Saving service.
Figure 63
2015-25: COASTAL FATALITY BY LOCATION
Beaches are the leading fatality location (n=276), followed by offshore (n=116), then rock/cliff locations (n=82).
Figure 64
2015-25: REMOTENESS CLASSIFICATION OF FATALITY LOCATIONS
One in two unintentional fatalities occurred in regional/remote areas (57%, n=325), followed by major cities (34%, n=196). The remoteness classification of an incident location was coded to the Australian Statistical Geographical Standard of Remoteness Areas.
Figure 65
2015-25: RESIDENCE DISTANCE TO FATALITY LOCATION
Most decedents lived locally to the fatality location (n=172), followed by intrastate visitors (n=129), then nearby resident (n=113).
SOUTH AFRICA
COUNTRIES
Figure 66
2015-25: VISITOR CATEGORY OF DECEDENT
Most decedents were Australian residents (n=362), followed by short term visitors (n=45). Visitor status was unknown for 27% of cases (n=157).
Figure 67
2015-25: BIRTH CONTINENT OF DECEDENT
Birth continent is known for 75% of coastal fatalities (n=571), of these 49% were Australian-born (n=279), 13% were born in Europe (n=76), and 6% were born in Asia (n=35).
68
2015-25: FATALITY BY TIME
Most unintentional fatalities occurred in the afternoon (38%, n=215), followed by the morning (33%, n=189). The highest density have occurred between 10am and 5pm (48%, n=276; shaded area). Incident time was unknown for 11% of cases (n=60), which were excluded from analyses.
36% OCCURRED ON THE WEEKEND 37% OCCURRED IN SUMMER
69
2015-25: FATALITY BY MONTH & DAY
Most coastal fatalities occurred during summer (37%, n=214; Dec-Feb), followed by spring (25%, n=140; Sep-Nov). By month, January has recorded the highest number (15%, n=88), then December (12%, n=71). A disproportionate number of coastal fatalities occurred on weekend days (36%; n=206), with fatality risk 1.4 times greater on the weekend.
Figure
Figure
COASTAL FATALITY LOCATIONS
2015-25: TEN-YEAR ANALYSIS
19 122
39 50
199
22
COASTAL DROWNING
2004-25: 21-YEAR ANALYSES OF DROWNING
Figure 70
2004-25: PROGRESS AREAS
Rates allow for comparisons relative to the number of people in the popluation. Comparing three-year average rates/100,000 from 2004-07 to 2023-25 we have seen notable decreases in drowning rates for 18-34 year olds, especially with rip-related drowning. Similar decreases have been observed in rock fishing, boating and offshore drowning rates.
DROWNING RATES (PER 100,000 POPULATION)
Figure 71
2004-25: PRIORITY FOCUS AREAS
While progress has certainly been observed in some groups, there are some emerging key areas requiring stronger drowning prevention efforts. Reducing coastal drowning related to falls, older adults (55+ years) and at beaches are crucial to see meaningful decreases.
DROWNING RATES (PER 100,000 POPULATION)
2004-25: DROWNING NUMBERS VS. DROWNING RATES
This feature presents an overview of changes in coastal drowning since 2004/05. Using drowning number and rates, the below information highlights areas of progress but also those that require more attention. Coastal drowning, rip-related drowning, and drowning at rock platform and in regional/remote locations have seen an increase in numbers, but no change when we consider these changes in relation to the population. Drowning deaths involving boating, offshore waters, rock fishing and 18-34 year olds has seen reductions in numbers and rates/100,000 pop. Male drowning, and rip related drowning of two target populations (males and 18-34 year olds) have seen reduced drowning rates, despite increasing numbers. For more information about measuring drowning please refer to page 2-3.
Decreasing rate and numbers, keep going! Some progress, decreasing rate but numbers increasing. Some progress, but needs more work. Increasing rate and numbers needs attention!
BOATING OFFSHORE 18-34 YEAR OLDS

NEW SOUTH WALES
2024/25: VISITATION & CAPABILITY
In the last twelve months, 5.4 million New South Wales residents (16 years and above) visited the coast on average 3.7 times each month. This equates to approximately 20 million individual visitations to the coast.
5.4M COASTAL VISITORS 3.7
3,494 RESCUES 1,087,710 PREVENTATIV E ACTIONS
CAPABILITY $4,315,065,767 VALUE TO COMMUNITY 2.6 HOURS/VISIT
4.6M COASTAL ACTIVITY PARTICIPANTS
163 Searches 236 Shark alarms 557 Lost
COASTAL DROWNING
2024/25: YEAR IN REVIEW
New South Wales recorded 52 drowning deaths in coastal waters, comprising 42% of NSW’s total drowning burden (n=129). This is a 15% decrease from last year (n=61), and 13% above the ten-year average (n=46).
Males were overrepresented, accounting for 88% of drowning deaths. High-risk age groups include 50-59 (25%) and 15-24 year olds (17%), with decedents aged 55 years and above comprising 44% of New South Wales coastal drowning deaths.
Swimming/wading, rock fishing, and falls recorded 40%, 19% and 12% of coastal drowning deaths respectively. Most coastal drowning deaths occurred at beaches (48%), with a further 37% in rock/cliff locations.
0.63/100,000POP. DROWNING RATE
NB: Arrow indicates change from 10-year average
Figure 72
Regional and remote areas, which are harder to access and often have limited resources, recorded 44% of coastal drowning deaths, and 63% occurred more than 1km from a Surf Life Saving service. All coastal drowning deaths occurred at unpatrolled locations, outside of patrol times, or away from the red and yellow patrol flags. 52 COASTAL DROWNING DEATHS
2024/25: COASTAL DROWNING DEATHS
NSW recorded 52 coastal drowning deaths (drowning rate of 0.63/100,000 pop.), above the 10-year average (n=46).
ROCK/CLIFF
REGIONAL/REMOTE 37%
44%
NEW SOUTH WALES
2015-25: TEN-YEAR COASTAL DROWNING TRENDS
Figure 73
2015-25: COASTAL DROWNING DEATH TRENDS
Annual NSW coastal drowning deaths and rates are illustrated above. Coastal drowning deaths and rates in 2024/25 (n=52; rate:0.61/100,000) were above the 10-year average.
2015-25: KEY DEMOGRAPHICS
Figure 74
2015-25: DROWNING DEATHS BY ACTIVITY
Drowning prevalence varies. Since 2015, swimming and wading has recorded the most coastal drowning deaths (35%, n=165) in NSW, followed by rock fishing (17%, n=82), then boating/PWC (11%, n=53).
CAUSAL FACTORS
2015-25: COASTAL DROWNING DEATH NUMBERS & RATES BY BRANCH
(n=39, AVERAGE RATE = 1.87/100,000) FAR NORTH COAST
(n=46, AVERAGE RATE = 2.95/100,000) NORTH COAST
(n=25, AVERAGE RATE = 2.17/100,000) MID NORTH COAST
(n=18, AVERAGE RATE = 1.89/100,000) LOWER NORTH COAST
(n=36, AVERAGE RATE = 0.80/100,000) HUNTER
(n=34, AVERAGE RATE = 0.99/100,000) CENTRAL COAST
(n=38, AVERAGE RATE = 1.42/100,000) NORTHERN BEACHES
(n=101, AVERAGE RATE = 1.12/100,000) SYDNEY
(n=32, AVERAGE RATE = 1.49/100,000) ILLAWARRA
(n=50, AVERAGE RATE = 2.46/100,000) SOUTH COAST
(n=34, AVERAGE RATE = 4.55/100,000) FAR SOUTH COAST
Figure 75 2015-25: BIRTH CONTINENT OF DECEDENT
Almost one in two decedents were born overseas (46%).
BEACH TO BUSH
SLSNSW’s flagship educational program, Beach to Bush, saw a host of volunteer lifesavers heading inland to promote surf safety to primary school students across regional and rural NSW for a 31st year in 2024.
More than 11,000 students were engaged face-to-face and nearly 100 schools were visited over three huge weeks in November.
A major milestone was also achieved this time around, with volunteer lifesavers having now educated more than 300,000 students since the program’s inception in 1994 - a testament to the organisation’s commitment to educating diverse communities across NSW.
For many, the Beach to Bush program is their first interaction with the iconic red and yellow surf lifesavers, with children from regional and remote areas often at higher risk of drowning than those from coastal locations because they are less familiar with the beach and unaware of potential surf dangers.
Students attending the program learn about the role of surf lifesavers, why they should always swim between the red and yellow flags, how to spot a rip current, what to do if they get into trouble at the beach and the different types of marine life along the coast. Surf lifesavers also talk about the hazards of inland waterways.
Feedback received from students and educators alike were extremely favourable, with many impressed by the highly interactive sessions and the knowledge of the volunteers, with the practical sessions proving fun, engaging and, above all, educational.
B2B SCHOOLS
Inland waterways such as Lake Parramatta and Penrith Beach have become increasingly popular destinations for families, swimmers, and water sports enthusiasts. These locations offer a more controlled and accessible alternative to coastal beaches, attracting a diverse range of visitors looking to cool off, exercise, or simply enjoy nature.
However, while these environments may seem safer than coastal locations, they come with their own unique risks. Drowning and water-related incidents continue to occur in lakes and rivers due to factors such as hidden hazards, unpredictable water conditions, limited skillsets and limited public awareness of the dangers. This is where professional lifeguard services play a crucial role in ensuring visitor safety.
This season at both Lake Parramatta and Penrith Beach, the Australian Lifeguard Service NSW provided a flagged service which included many of the same operational offerings as coastal services, including active surveillance, responding to emergencies, and educating the public on water safety. The ALS’ presence not only reduced the risk of drowning, but also offered peace of mind to families and recreational users, allowing them to enjoy the water with confidence.
While ocean lifeguarding is the bread and butter of the ALS, inland waterway lifeguarding presents a distinct set of new challenges that require specialised attention, training and equipment. Unlike coastal beaches, where waves and rip currents are primary hazards, inland water locations come with risks that are often less visible but just as dangerous.
WESTERN SYDNEY LIFEGUARDS
PATROLLING INLAND WATERWAYS
Some key challenges that the ALS team has had to overcome include:
• Submerged objects & uneven depths
• Water quality & visibility issues
• Temperature changes & cold shock
• Limited escape options
• High visitor numbers & unsupervised areas
• Lack of visitor swimming ability and aquatic awareness
To address these challenges, lifeguards at these locations undergo specialised inductions and training that include inland water rescue techniques, first aid response for drowning and injuries, and public education strategies to raise awareness of hidden risks at inland waterways.
As the popularity of these locations continues to grow, so too does the responsibility to maintain high safety standards. Working alongside land managers, investment in lifeguard training, safety infrastructure, and technological innovations will be crucial in keeping visitors safe while they enjoy these beautiful aquatic locations.
Lake Parramatta Penrith Beach
74,002
VISITORS
59,336
104
67
RESCUES
79 FIRST AID TREATMENTS
8,720
8 PREVENTATIVE ACTIONS
6,322
In the last twelve months, 3.4 million Queenslanders (16 years and above) visited the coast on average 3.7 times each month (NCSS2025). This equates to approximately 150 million individual visitations to the coast.
$$$$$ QUEENSLAND
2024/25: VISITATION & CAPABILITY 2,355 RESCUES 617,666 PREVENTATIV E ACTIONS
3.4M
3.7
2.5
2.8M
$2,561,715,805 VALUE TO COMMUNITY
83 Searches 92 Shark alarms
74 Lost children 35,142 FIRS T AID TREATMENTS
19,375 Marine stings
14,649 Cuts/Abrasions
9
COASTAL DROWNING
2024/25: YEAR IN REVIEW
Queensland recorded 31 drowning deaths in coastal waters, comprising 34% of QLD’s total drowning burden (n=90). This is a 35% increase from last year (n=23), and 15% above the tenyear average (n=27).
Males were overrepresented, accounting for 87% of drowning deaths. High-risk age groups include 60-69 (29%) and 40-49 (26%) year olds, with decedents aged 55 years and above comprising 65% of Queensland coastal drowning deaths. Swimming/wading, snorkelling, and equally boating & attempting a rescue accounted for 39%, 19% and 6% of coastal drowning deaths, respectively. Most coastal drowning deaths occurred at beaches (68%), with a further 10% in offshore waters.
Regional and remote areas, which are harder to access and often have limited resources, recorded 55% of coastal drowning deaths, and 71% occurred more than 1km from a Surf Life Saving service. All coastal drowning deaths occurred at unpatrolled locations, outside of patrol times, or away from the red and yellow patrol flags.
0.55/100,000POP. DROWNING RATE COASTAL DROWNING DEATHS
NB: Arrow indicates change from 10-year average
Figure 76
2024/25: COASTAL DROWNING DEATHS
31 coastal drowning deaths were recorded (drowning rate of 0.55/100,000 pop.), above the 10-year average.
YEAR OLDS
MEDICAL INJURY
QUEENSLAND
2015-25: TEN-YEAR COASTAL DROWNING TRENDS
77
2015-25: COASTAL DROWNING DEATHS
Annual QLD coastal drowning deaths and drowning rates are illustrated above. Coastal drowning deaths and rates recorded in 2024/25 (n=31; rate:0.55/100,000) were above the 10-year average.
2015-25: KEY DEMOGRAPHICS
Figure 78
2015-25: DROWNING DEATHS BY ACTIVITY
Drowning prevalence varies by activity and over time. Since 2015, swimming and wading has recorded the most coastal drowning deaths (32%, n=90), followed by boating/PWC (25%, n=71), then snorkelling (16%, n=45).
CAUSAL FACTORS
Figure
2015-25: COASTAL DROWNING DEATH NUMBERS & RATES BY REGION
(n=5, AVERAGE RATE = 8.35/100,000 POP.) FAR NORTH QUEENSLAND
NORTH QUEENSLAND (n=27, AVERAGE RATE = 1.28/100,000 POP.)
NORTH BARRIER (n=23, AVERAGE RATE = 0.50/100,000 POP.)
WIDE BAY CAPRICORN (n=53, AVERAGE RATE = 1.70/100,000 POP.)
(n=47, AVERAGE RATE = 1.06/100,000 POP.) SUNSHINE COAST (n=31, AVERAGE RATE = 0.10/100,000 POP.) BRISBANE (n=48, AVERAGE RATE = 0.77/100,000 POP.) GOLD COAST
Figure 79
2015-25: BIRTH CONTINENT OF DECEDENT Two fifths of decedents were born overseas (41%).
BEACH INCIDENTS
BEACH-RELATED DROWNING DEATHS & RESCUES
1 IN 4 RESCUES WERE CHILDREN AGED <12 YEARS
Figure 80
2024/25: BEACH RESCUES
Over 2024/25, 2,355 rescues were performed at Queensland beaches. Of these, 40% of rescues were of people aged under 18 years (n=948), 41% were female (n=968), and one in three were born overseas (28%). Males were again a high-risk demographic, 1.4 times more likely to be rescued, comprising 58% of beach rescues (n=1,387) .
MALE 25% 20-29 YEAR OLDS 18% 60-69 YEAR OLDS 50% AUSTRALIAN BORN
87% AUSTRALIAN RESIDENTS 33% OVERSEAS-BORN 29% RIP CURRENT
Figure 81
2020-25: FIVE-YEAR BEACH DROWNING DEATHS OVERVIEW
QLD beach drowning deaths are illustrated. In 2024/25, Queensland recorded 21 beach drowning deaths, a 168% increase from 2023/24 and 62% from the 10-year average. Males were overrepresented, accounting for 90% of beach drowning deaths. The average decedent age was 54 years old, with half (52%) being over the age of 50. Nine in ten (87%) were Australian residents, 33% of which were born overseas. Rip currents contributed to one in three beach drowning deaths (29%).
2015-25: TEN-YEAR
BEACH DROWNING DEMOGRAPHICS
BEACH DROWNING DEATHS
FAR NORTH QUEENSLAND REGION (N=4, AVERAGE RATE=1.46/100,000 POP.) NORTH QUEENSLAND REGION (N=14, AVERAGE RATE=0.61/100,000 POP.) NORTH BARRIER REGION (N=6, AVERAGE RATE=0.13/100,000 POP.)
Figure 82
2015-25: BEACH DROWNING DEATHS BY REGION AND LOCAL GOVERNMENT AREA
Since 2015/16, the highest number of beach drowning deaths occurred within Gold and Sunshine Coast regions and Local Government Areas (LGAs), while the highest drowning rates were in the Far North Queensland region, specifically Mornington and Cook LGAs.
In the last twelve months, 3.8 million Victorians (16 years and above) visited the coast on average 2.2 times per month (NCSS2025). This equates to over 100 million individual visitations to the coast.
3.8M

2024/25: VISITATION & CAPABILITY 1,011 RESCUES 356,236 PREVENTATIV E ACTIONS 56 Searches
2.2
2.5
3.3M
CAPABILITY
$1,373,196,845 VALUE TO COMMUNITY
38 Lost children 1,621 FIRS T AID TREATMENTS 345
31 Shark alarms
29 Spinal injuries
COASTAL DROWNING
2024/25: YEAR IN REVIEW
Victoria recorded 20 coastal drowning deaths in 2024/25, comprising 47% of the total drowning burden (n=43). This is a 23% decrease from last year (n=26), and 5% above the ten-year average (n=19).
Males were overrepresented, accounting for 85% of drowning deaths. High-risk age groups include 40-49 (30%) and 55-64 (20%) year olds, with decedents aged 55 years and above comprising 40% of Victorian coastal drowning deaths.
Swimming/wading, falls, then snorkelling and watercraft (equally), recorded 30%, 20% and 10% of coastal drowning deaths, respectively. Most coastal drowning deaths occurred at beaches (60%), with a further 25% at rock/cliff locations.
Regional and remote areas, which are harder to access and often have limited resources, recorded 55% of coastal drowning deaths, and 75% occurred more than 1km from a Surf Life Saving service. All coastal drowning deaths occurred at unpatrolled locations, outside of patrol times, or away from the red and yellow patrol flags.
0.29/100,000POP. DROWNING RATE COASTAL DROWNING DEATHS
NB: Arrow indicates change from 10-year average
Figure 83
2024/25: COASTAL DROWNING DEATHS
20 coastal drowning deaths were recorded (drowning rate of 0.29/100,000 pop.), above the 10-year average.
VICTORIA
2015-25: TEN-YEAR COASTAL DROWNING TRENDS
Figure 84
2015-25: COASTAL DROWNING DEATHS
Annual Victorian coastal drowning deaths and drowning rates are illustrated above. Coastal drowning deaths (n=20) were above the 10-year average, while the 2024/25 drowning rate was equal to average (0.29/100,000 pop.).
2015-25: KEY DEMOGRAPHICS
Figure 85
2015-25: DROWNING DEATHS BY ACTIVITY
Drowning prevalence varies by activity and over time. Since 2015, swimming/wading has recorded the most coastal drowning deaths (38%, n=72), followed by boating/PWC (15%, n=29), then snorkelling (11%, n=20).
CAUSAL FACTORS
NORTH WEST METRO
(n=12, AVERAGE RATE = 0.32/100,000 POP.)
BARWON SOUTH WEST (n=56, AVERAGE RATE = 1.38/100,000 POP.)
2015-25: COASTAL DROWNING DEATH NUMBERS & RATES BY EMERGENCY MANAGEMENT REGION
SOUTHERN METRO (n=79, AVERAGE RATE = 0.93/100,000 POP.)
GIPPSLAND (n=42, AVERAGE RATE = 2.62/100,000 POP.)
Figure 86
2015-25: BIRTH CONTINENT OF DECEDENT
One third of decedents were born overseas (37%).
PUBLIC RESCUE EQUIPMENT STATIONS SAVE LIVES DAYS AFTER LAUNCH
The installation of Public Rescue Equipment (PRE) stations along the hazardous coastline of Venus Bay in Victoria’s southeast is an initiative born from community advocacy following a tragic bystander drowning in January 2021.
This incident underscored the sombre reality that bystanders often attempt rescues without access to appropriate resources and equipment, putting themselves at risk. The project aims to assess community awareness of coastal waterway risks and the impact of emergency PRE stations in the short term, while ultimately reducing drowning incidents in Gippsland and serving as a model for similar initiatives across the state.
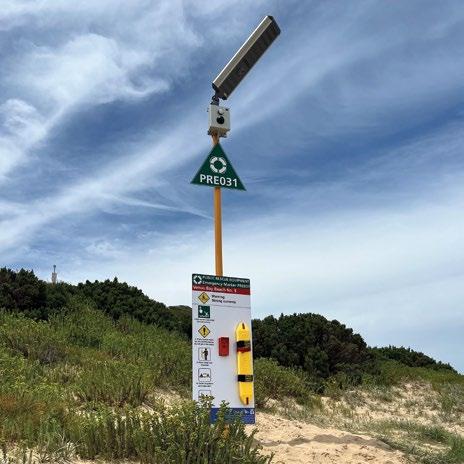
Venus Bay Surf Life Saving Club and Life Saving Victoria (LSV) partnered on this project, working closely with local community members, groups, land manager and council, to lead the development of a scalable, evidencebased solution.
Not only are the PRE stations the first of their kind in Victoria, the approach and design are novel, integrating emergency management partnerships, community co-design, a public awareness campaign, and education and training, underpinned by rigorous evaluation. They were developed through a multi-phase research process, including risk assessments; literature reviews; several rounds of stakeholder and community consultation; prototyping; monitoring, maintenance, and inspection; surveys, interviews, focus groups, and observations; and emerging incident and response data.
The stations are designed to empower bystanders to respond safely in emergencies while awaiting professional assistance, and contain:
• Dual signage (long-range and instructional)
• Official emergency marker
• Two-way call button to Triple Zero with loudspeaker and dual sim support
• Standard rescue tube with dual Velcro straps (220kg capacity)
• Solar and strobe technology
• QR code for language support and additional resources
• 12-pile, non-concrete footings for environmental sustainability
• High-grade materials to withstand exposure.
Since five PRE stations were installed at Venus Bay beach entrances in December 2024, significant outcomes have been delivered. Six lives were saved within eight days of launch; four on Christmas Day and two on New Year’s Eve, involving club members, bystanders and emergency services, demonstrating their effectiveness. Moreover, the call button was activated by someone on another occasion who chose not to enter the water at this high-risk location. While the person identified to be in distress ultimately did not require rescue by others, the bystander’s actions to prioritise their own safety demonstrates a positive outcome that reflects the rigorous research and awareness-raising actions underpinning the initiative.
The paid public awareness campaign and media strategy have reached almost 500,000 people, and organic media exposure far exceeds this. Over 200 people have participated in consultation and evaluation activities to date and satisfaction scores consistently exceed 4.7/5.
The stakeholder-centric model has ensured effective collaboration with the land manager and other key parties throughout every project phase, proving essential for success. The Australian Government, through SLSA, provided core funding through the Beach Drowning Blackspot Reduction Program. The education, promotion and the public awareness campaign, including translations into multiple languages, were also supported by the Andrews Foundation. The vast array of acknowledgements in addition to the club and community include CartGIS Pty Ltd, Parks Victoria, Surf Life Saving New South Wales, Surf Life Saving New Zealand, Rescue Tube Foundation, Inc., Worcester Polytechnic Institute, and LSV departments.
The PRE has also strengthened community cohesion and empowered residents, holidaymakers and club members. Utilising co-design has embedded ownership and resilience within community, ensuring sustainability beyond the trial. Their passion and involvement are central to this, like through visual inspections regularly conducted, ensuring the PRE stations are operating as required.
The project’s impact has been transformative, with residents and visitors having increased comfort when recreating at the beach: “Now when I go for a walk, I don’t have to worry about what I should do if someone is in the water and needs help. I know I can just push the button.”
The PRE stations are pivotal for water safety in high-risk areas. The success of this trial to date underscores the important role PRE plays in drowning prevention and serves as a critical model for installing PRE at high-risk waterways across the state.
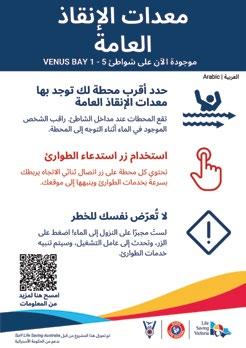
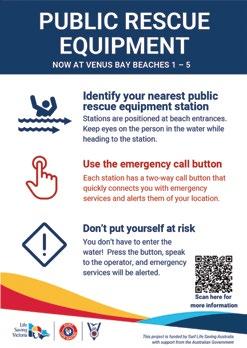
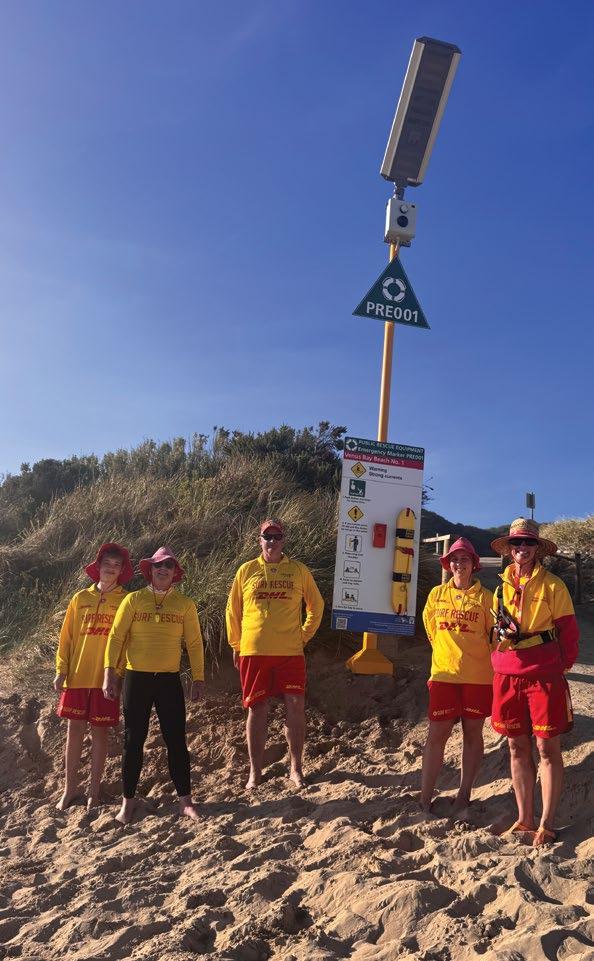
In the last twelve months, 1.7 million Western Australians (16 years and above) visited the coast on average 3.4 times each month (NCSS25). This equates to approximately 69 million individual visitations to the coast. CAPABILITY

2024/25: VISITATION & CAPABILITY 1,072 RESCUES 113,724 PREVENTATIV E ACTIONS
1.7M
3.4
2.1
1.4M
$663,346,292 VALUE TO COMMUNITY
62 Fractures/Dislocations
34 Searches 121 Shark alarms 88 Lost children 3,007 FIRS T AID TREATMENTS
6
COASTAL DROWNING
2024/25: YEAR IN REVIEW
Western Australia recorded 27 drowning deaths in coastal waters, comprising 55% of WA’s total drowning burden (n=49). This is a 35% increase from last year (n=20), and 37% above the ten-year average (n=19).
Males were overrepresented, accounting for 81% of drowning deaths. High-risk age groups include 40-49 (26%) and 60-69 (26%) year olds, with decedents aged 55 years and above comprising 59% of Western Australian coastal drowning deaths.
Swimming/wading, boating and scuba diving accounted for 30%, 19% and 15% of coastal drowning deaths, respectively. Most coastal drowning deaths occurred at beaches (56%), with a further 37% in offshore waters.
Regional and remote areas, which are harder to access and often have limited resources, recorded 63% of coastal drowning deaths, and 78% occurred more than 1km from a Surf Life Saving service. All coastal drowning deaths occurred at unpatrolled locations, outside of patrol times, or away from the red and yellow patrol flags.
YEAR OLDS
YEAR OLDS
0.9/100,000POP. DROWNING RATE COASTAL DROWNING DEATHS
NB: Arrow indicates change from 10-year average
Figure 87
2024/25: COASTAL DROWNING DEATHS
WA recorded 27 coastal drowning deaths (drowning rate of 0.9/100,000pop.), above the 10-year average.
63% REGIONAL/REMOTE
WESTERN AUSTRALIA
2015-25: TEN-YEAR COASTAL DROWNING TRENDS
Figure 88
2015-25: COASTAL DROWNING DEATHS
Annual WA coastal drowning deaths and drowning rates are illustrated above. Coastal drowning deaths and rates in 2024/25 (n=27; rate:0.9/100,000) were above the 10-year average.
2015-25: KEY DEMOGRAPHICS
Figure 89
2015-25: DROWNING DEATHS BY ACTIVITY
Drowning prevalence varies by activity and over time. Since 2015, boating/PWC has recorded the most coastal drowning deaths (25%, n=51), followed by swimming/wading (24%, n=48), then snorkelling (13%, n=26).
CAUSAL FACTORS
2015-25: COASTAL DROWNING DEATH NUMBERS & RATES BY REGION
KIMBERLEY (n=6, AVERAGE RATE = 1.76/100,000 POP.)
PILBARA (n=8, AVERAGE RATE = 1.33/100,000 POP.)
GASCOYNE (n=21, AVERAGE RATE = 16.07/100,000)
MID WEST
(n=8, AVERAGE RATE = 1.68/100,000 POP.)
WHEATBELT (n=4, AVERAGE RATE = 4.39/100,000 POP.)
PERTH
(n=59, AVERAGE RATE = 0.58/100,000 POP.)
SOUTH WEST
(n=41, AVERAGE RATE = 1.32/100,000 POP.)
GOLDFIELDS-ESPERANCE (n=9, AVERAGE RATE = 5.92/100,000 POP.)
Figure 90
2015-25: BIRTH CONTINENT OF DECEDENT
Two fifths of decedents were born overseas (38%).
ABALONE FISHING PATROLS
Western Australia has one of the few remaining sustainable abalone fisheries in the world. To manage abalone supplies, the Western Australian State Government implemented legislative controls including licensing and restricting fishing sessions to a total of four one-hour sessions across the months of December, January and February.
Unpredictable ocean conditions and hazardous reef structures coupled with short, high-intensity fishing windows and low swimming abilities has resulted in six abalone fishers drowning in Western Australia since 2012. Per head of population, it is one of Australia’s most dangerous coastal activities.
To reduce drowning incidents during these abalone fishing sessions, Surf Life Saving Western Australia (SLSWA) leads a multifaceted, collaborative program to provide volunteer surf lifesaving patrols supported by partner agencies.
This approach involves prevention, education, awareness and a coordinated and collaborative emergency response supported by external agencies including the Local and State Governments, RecFish West, Volunteer Marine and Rescue (VMR), St John Ambulance, Fishing and Aquatic support retailers, Tourism centres, and CaLD organisations.
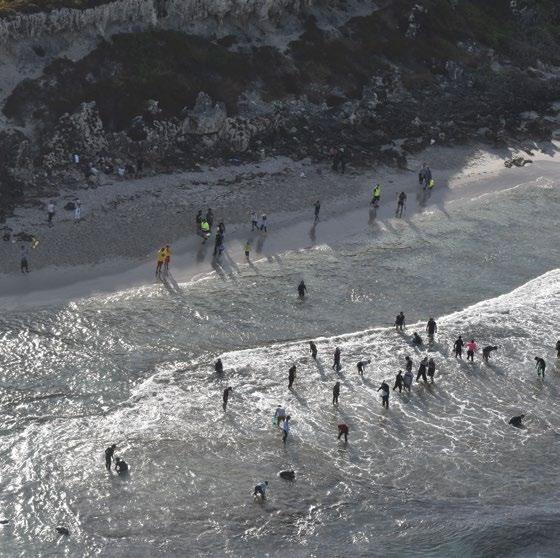
Patrols are held at seven designated zones from Yanchep to Halls Head in the south. Multi-agency meetings are held before, during and after every abalone session, hazardous surf prediction modeling is undertaken, and the development and implementation of the Regional and Local Operating Plan is facilitated.
Since 2015, SLSWA and 16 affiliated clubs have performed 565 rescues, 14,307 preventative actions and provided 802 first aid treatments (Figure 91). Considerable resources are required to provide these lifesaving services, from volunteer patrol hours to equipment and time from external agencies. The presence of volunteer surf lifesaving patrols during the abalone sessions are critical to reduce fisher drowning, making the single biggest difference to ensure fishers return home safe to their families.
Figure 91
2015-25: ABALONE PATROL STATISTICS
815
HOURS PER ABALONE SESSION
3,224
PREVENTATIVE ACTIONS
16
AFFILIATED SLSCS
Figure 92
606
PATROLLING SURF LIFESAVERS
11
UAV UNITS AND OPERATORS
118
RESCUES
47
66
118 SPINAL BOARDS
69
413 DEFIBRILLATORS
RESCUE TUBES
36 FIRST AID TREATMENTS
POWERCRAFT USED (IRB & RWC)
2024/25: LIFESAVING STATISTICS FROM 2024/25 ABALONE PATROL SEASON
ZONE COORDINATORS
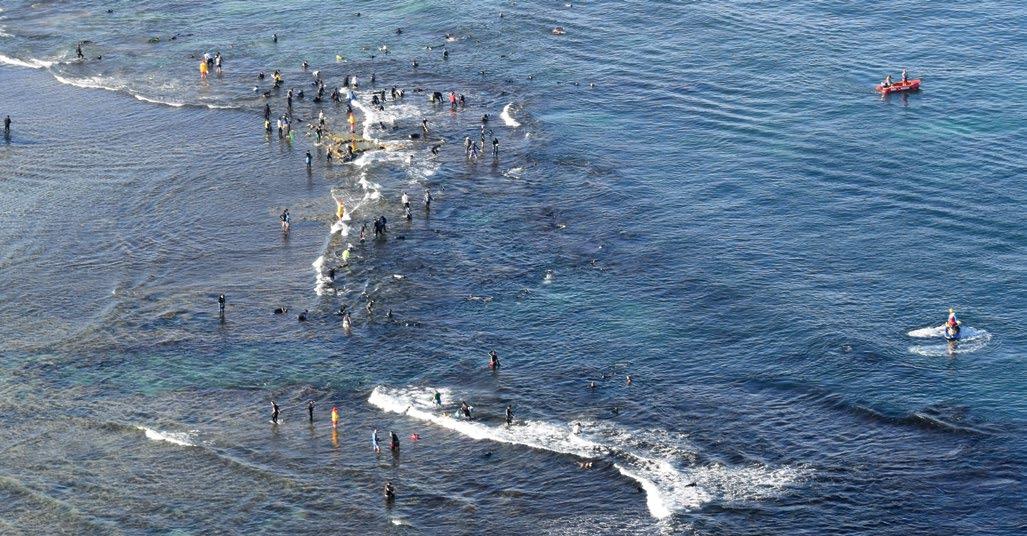
2024/25: VISITATION & CAPABILITY
In the last twelve months, 1.2 million South Australians (16 years and above) visited the coast on average three times each month (NCSS2025). This equates to approximately 43 million individual visitations to the coast. CAPABILITY
1.2M
3.0
2.4
900K
$71,627,011 VALUE TO COMMUNITY
170 RESCUES 6,855 PREVENTATIV E ACTIONS
70 Shark alarms
521 Marine stings
32 Searches
338 Minor wounds
19 Lost children 851 FIRS T AID TREATMENTS
12 Fractures/Dislocations
COASTAL DROWNING
2024/25: YEAR IN REVIEW
South Australia recorded 18 drowning deaths in coastal waters, comprising 75% of SA’s total drowning burden (n=24). This is a 125% increase from last year (n=8) and the ten-year average (n=8).
Males were overrepresented, accounting for 89% of drowning deaths. High-risk age groups include 60-69 (44%) and 70-79 year olds (17%), with decedents aged 55 years and above comprising 72% of South Australian coastal drowning deaths.
Boating accounted for 33% of coastal drowning deaths, followed by falls (17%), and swimming/wading (11%). Most coastal drowning deaths occurred at beaches (39%), with a further 28% in offshore waters.
Regional and remote areas, which are harder to access and often have limited resources, recorded 78% of coastal drowning deaths, and 94% occurred more than 1km from a Surf Life Saving service. All coastal drowning deaths occurred at unpatrolled locations, outside of patrol times, or away from the red and yellow patrol flags.
INCREASE FROM 10-YEAR AVERAGE
0.95/100,000POP. DROWNING RATE COASTAL DROWNING DEATHS
NB: Arrow indicates change from 10-year average
Figure 93
2024/25: COASTAL DROWNING DEATHS
SA recorded 18 coastal drowning deaths (drowning rate of 0.95/100,000 pop.), above the 10-year average.
44% 60-69 YEAR OLDS
29%
17%
70-79 YEAR OLDS
39% BEACH
28% OFFSHORE
94% >1KM FROM SLS
78% REGIONAL/REMOTE/OFFSHORE
SOUTH AUSTRALIA
2015-25: TEN-YEAR COASTAL DROWNING TRENDS
Figure 94
2015-25: COASTAL DROWNING DEATHS
Annual SA coastal drowning deaths and drowning rates are illustrated above. Coastal drowning deaths and rates recorded in 2024/25 (n=18; rate:0.55/100,000 pop.) were above the 10-year average.
2015-25: KEY DEMOGRAPHICS
Figure 95
2015-25: DROWNING DEATHS BY ACTIVITY
Drowning prevalence varies by activity and over time. Since 2015, swimming/wading has recorded the most coastal drowning deaths (31%, n=28), followed by boating (25%, n=22), then attempting a rescue (8%, n=7).
11% ROCK/CLIFF
CAUSAL FACTORS
2015-25: COASTAL DROWNING DEATH NUMBERS & RATES BY REGION
FAR WEST COAST (n=0, AVERAGE RATE = 0.00/100,000 POP.)
EYRE PENINSULA (n=15, AVERAGE RATE = 4.48/100,000 POP.)
SPENCER GULF (n=10, AVERAGE RATE = 0.17/100,000 POP.)
YORKE PENINSULA (n=9, AVERAGE RATE = 3.06/100,000 POP.)
GULF ST VINCENT (n=20, AVERAGE RATE = 0.28/100,000 POP.)
KANGAROO ISLAND (n=4, AVERAGE RATE = 8.07/100,000 POP.)
FLEURIEU PENINSULA (n=18, AVERAGE RATE = 0.80/100,000 POP.)
SOUTH EAST COAST (n=12, AVERAGE RATE = 3.96/100,000 POP.)
Figure 96 2015-25: BIRTH CONTINENT OF DECEDENT Two fifths of decedents were born overseas (38%). 6%
REGIONAL WATER SAFETY
STREAKY BAY LEADS THE WAY IN COASTAL SAFETY
South Australia’s regional coastal communities are setting a new benchmark in public safety, with Streaky Bay emerging as a standout example of innovative, communityfocused initiatives. As part of a government-funded project led by Surf Life Saving South Australia (SLSSA), high-risk coastal areas are receiving a suite of targeted safety enhancements to better protect locals and visitors alike.
will soon be following Streaky Bay’s lead with the implementation of tailored safety measures. In addition, SLSSA has already started engaging other priority coastal locations, ensuring a wider network of regional communities benefit from these initiatives.
The project’s first phase, successfully completed nearby Granites, introduced practical safety measures including advanced shark awareness signage, community-managed shark-sighting boards, and strategically positioned trauma kits, stocked with specialist equipment for critical incidents. These resources empower the community, encouraging locals and visitors to play an active role in maintaining safety.
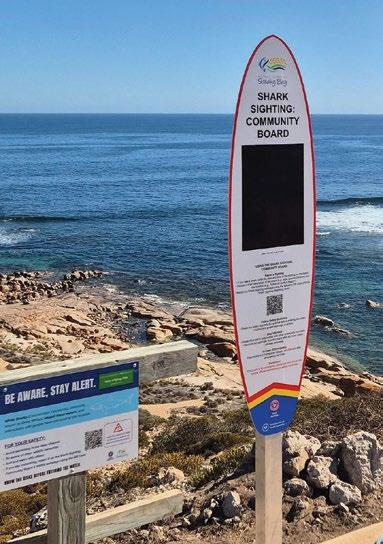
At the heart of this initiative is a commitment to evidence-based interventions. Streaky Bay, identified as a priority site due to its exposure and history of aquatic incidents, has benefited from a comprehensive Coastal Risk Assessment (CRA). Elliston and Lower Yorke Peninsula have also completed their CRAs and
Beyond infrastructure, SLSSA is delivering interactive water safety education programs to regional schools, fostering awareness from a young age. Students learn about shark safety, emergency response, and responsible beach behaviour, equipping them with the knowledge to enjoy South Australia’s pristine coastal environments safely.
This initiative also includes the establishment of regional drone surveillance hubs, operated by trained local volunteers to support rapid response and strengthen community confidence.
Streaky Bay’s proactive approach, alongside Elliston, Lower Yorke
Peninsula, and other emerging priority sites, demonstrates the power of collaboration between SLSSA, local councils, and the State Government. By combining education, infrastructure, and community engagement, the project reduces risk while fostering a culture of shared responsibility along South Australia’s regional coasts.
This story is just the beginning. Over the coming months, SLSSA will continue rolling out interventions across priority regions, ensuring more communities benefit from these innovative safety measures. For Streaky Bay and its neighbouring coastal towns, the message is
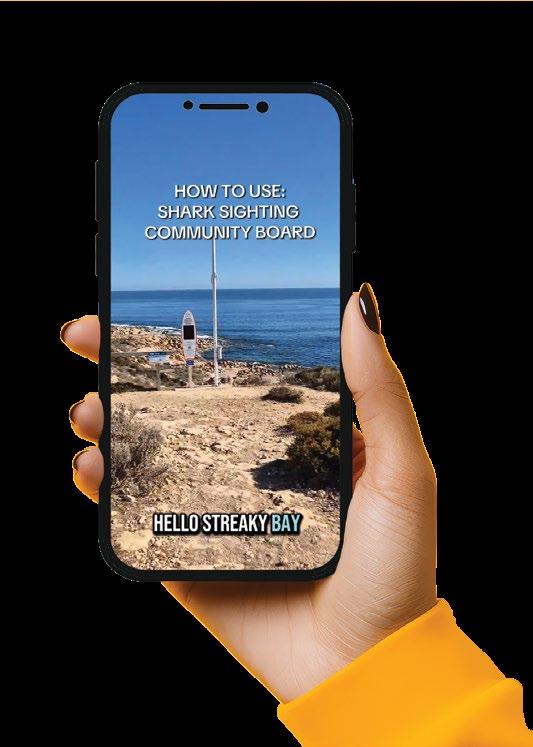
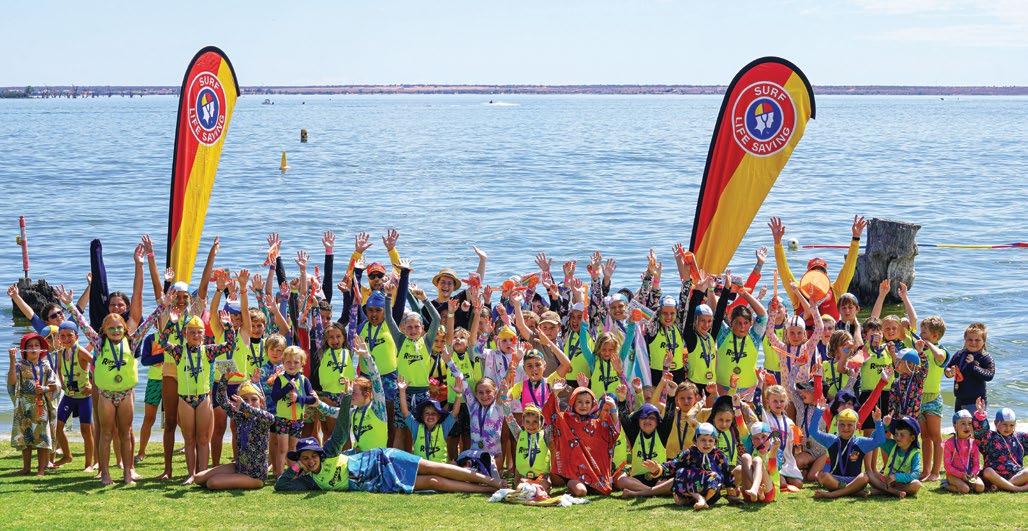
RIPPERS
PROGRAM SPARKS SOUTH AUSTRALIA’S FIRST RIVER-BASED LIFE SAVING CLUB
The Rippers (Nippers on the River) Program has transformed water safety in South Australia’s Riverland and Murraylands, engaging more than 300 children across Murray Bridge, Lake Bonney, and Renmark since 2023. Designed to teach lifesaving skills away from the coast, the program has built strong community ownership by training locals through Community Surf Rescue Certificates, ensuring long-term sustainability.
A major milestone was reached in March 2025 with the establishment of Murray Bridge Life Saving Club –SLSSA’s first ever river-based club. Sparked by strong participation in Rippers, the club quickly achieved probationary affiliation with SLSSA after meeting all requirements: incorporation, board formation,
sponsorship, volunteer training, and attracting more than 100 interested members. With support from SLSSA, the Rural City of Murray Bridge, and the local community, Murray Bridge Life Saving Club has already delivered two Rippers seasons to over 160 children and proudly claimed victory at the inaugural Inland Rippers State Championships at Lake Bonney. That landmark event, held in March 2025, united more than 100 children from inland and coastal clubs. It was not only a showcase of swimming, board paddling, and lifesaving skills, but also a celebration of regional communities rallying around water safety. Supported by Discovery Parks and Berri Barmera Council, the carnival created pride, visibility, and momentum for inland lifesaving.
Located on the River Murray - long recognised as a national blackspot for drowning - Murray Bridge Life Saving Club also holds future potential to boost emergency service capacity as it grows. With the next Rippers season already being planned for summer 2025/26, the club is building a sustainable pathway for the next generation of lifesavers and reshaping what water safety looks like inland.
In the last twelve months, 400 thousand Tasmanians (16 years and above) visited the coast on average 5.4 times each month (NCSS2025). This equates to approximately 26 million individual visitations to the coast.

2024/25: VISITATION & CAPABILITY 47 RESCUES 1,934 PREVENTATIV E ACTIONS
400K COASTAL VISITORS
5.4 VISITS/MONTH
2.1 HOURS/VISIT
250K COASTAL ACTIVITY PARTICIPANTS
$19,919,245 VALUE TO COMMUNITY
1,906 Preventions
19 Searches
75 Cuts & abrasions CAPABILITY
4 CPR provided PATROLLING MEMBERS 796
44 Marine stings
7 Lost children 144 FIRS T AID TREATMENTS
COASTAL DROWNING
2022-25: THREE YEAR REVIEW
Tasmania recorded 18 drowning deaths in coastal waters between 2022/23 and 2024/25, a 14% decrease from the previous 3-year period (n=21).
Males were overrepresented, accounting for 89% of drowning deaths. High-risk age groups include 55-64 (28%) and 65-74 year olds (22%), with decedents aged 55 years and above comprising 56% of Tasmanian coastal drowning deaths since 2022/23.
Swimming/wading, scuba diving and boating accounted for 33%, 22% and 17% of coastal drowning deaths, respectively. Most coastal drowning deaths occurred at beaches (50%), with a further 39% in offshore waters. One third of beach drowning deaths were due to rip currents (33%).
Regional and remote areas, which are harder to access and often have limited resources, recorded 94% of coastal drowning deaths. 83% of drowning deaths occurred more than 1km from a Surf Life Saving service. All coastal drowning deaths occurred at unpatrolled locations, outside of patrol times, or away from the red and yellow patrol flags.
89% MALE 56% 55+ YEAR OLDS
28% 55-64 YEAR OLDS
33% RIP-RELATED
1.05/100,000POP. DROWNING RATE COASTAL DROWNING DEATHS
NB: Arrow indicates change from 10-year average
Figure 97
2023-25: COASTAL DROWNING DEATHS
Over three years 18 coastal drowning deaths were recorded with annual average numbers and rates (n=6, rate=1.05/100,000 pop)., equal to the 10-year average.
50% BEACH
39% OFFSHORE
22%
65-74 YEAR OLDS
83% >1KM FROM SLS
94% REGIONAL/REMOTE
TASMANIA
2015-25: TEN-YEAR COASTAL DROWNING TRENDS
Figure 98
2015-25: COASTAL DROWNING DEATH TRENDS
Annual Tasmanian coastal drowning deaths and rates are illustrated above. Coastal drowning deaths and rates recorded for 2024/25 (n=5; rate:0.87/100,000 pop.) were below the 10-year average.
Figure 99
2015-25: DROWNING DEATHS BY ACTIVITY
Drowning prevalence varies by activity and over time. Since 2015, boating/PWC has recorded the most coastal drowning deaths (36%, n=22), followed by swimming/wading (16%, n=10), then scuba diving (13%, n=8).
2015-25: KEY DEMOGRAPHICS
YEAR OLDS
CAUSAL FACTORS
2015-25: COASTAL DROWNING DEATH NUMBERS & RATES BY REGION
KING ISLAND (n=1, AVERAGE RATE = 6.13/100,000 POP.)
NORTH/TAMAR (n=3, AVERAGE RATE = 0.30/100,000 POP.)
FLINDERS ISLAND (n=2, AVERAGE RATE = 21.37/100,000 POP.)
NORTHWEST
(n=9, AVERAGE RATE = 0.89/100,000 POP.)
WEST COAST
(n=3, AVERAGE RATE = 4.39/100,000 POP.)
5% CHINA OVERSEAS COUNTRIES OF BIRTH
NORTHEAST (n=3, AVERAGE RATE = 4.38/100,000 POP.)
EAST COAST (n=5, AVERAGE RATE = 4.37/100,000 POP.)
SOUTHEAST (n=29, AVERAGE RATE = 1.52/100,000 POP.)
Figure 100 2015-25: BIRTH CONTINENT OF DECEDENT
One fifth of decedents were born overseas (20%).
WATER SAFETY PROGRAMS
CALD WOMEN WATER SAFETY PROGRAM
The CALD Women Water Safety Program, delivered in 2023/24 by Surf Life Saving Tasmania (SLST) in partnership with Reclink, the Migrant Resource Centre, and the Doone Kennedy Hobart Aquatic Centre, aimed to address barriers that prevent women from culturally and linguistically diverse (CALD) backgrounds from participating in aquatic activities. Over the course of 22 swimming sessions, a beach safety day, and CPR and First Aid training, more than 50 women from nine countries developed essential water safety knowledge, swimming skills, and confidence. The program also encouraged social connection, cultural exchange, and independent participation at pools and beaches.
Feedback from participants was overwhelmingly positive, with 90% reporting they felt very satisfied and comfortable, and 75% saying the program exceeded their expectations. Beyond skill development, the initiative fostered behaviour change — participants began visiting aquatic facilities with their families, engaging more in physical activity, and forming new friendships. Notably, one participant and one volunteer were awarded scholarships to become qualified swim instructors, creating pathways for further community impact.
The program’s success was underpinned by overcoming challenges such as language barriers, cultural considerations, and transport logistics, supported by a strong volunteer base. Lessons learned included the importance of scheduling around cultural events, promoting inclusive swimwear options, and delivering training in shorter blocks to encourage ongoing attendance. Overall, the SLST’s CALD Women Water Safety Program has proven to be an effective model for improving safety, confidence, and social inclusion among vulnerable community groups, with clear opportunities for expansion in future years.
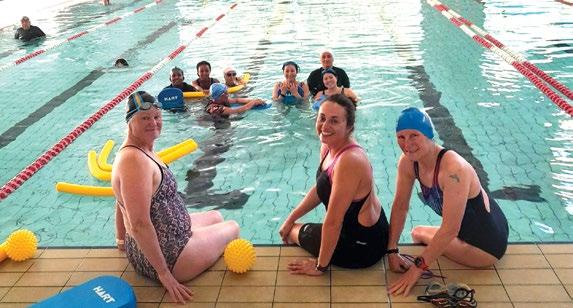
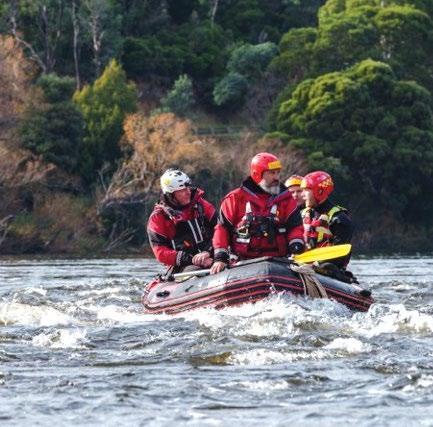
CENTRE OF EXCELLENCE – FLOOD AND SWIFTWATER RESCUE UPDATE
Since its launch in August 2023, the Surf Life Saving Centre of Excellence for Flood and Swiftwater Rescue has strengthened national flood response capability through coordinated training, standard-setting, and innovation. Based in Tasmania, the Centre has delivered nationally consistent and internationally benchmarked training to lifesavers and partner agency personnel, building a scalable surge capacity across multiple states. Work has included the development of best-practice personal protective equipment (including women’s-fit dry suits), trials of floodadapted Inflatable Rescue Boats to create the largest national fleet of flood-capable craft, and the release of updated specifications for rescue equipment. Template Standard Operating Procedures, deployment frameworks, and industry benchmarking have set Surf Life Saving at the forefront of flood rescue standards in Australia. Nationally, the Centre’s impact is evident in the growth of a highly trained volunteer base ready to respond to increasingly frequent and severe flood events. More than 100 members have already completed specialised flood and swiftwater rescue qualifications, with a projected 1,000 candidates expected to receive training in 2025/26. Partnerships with agencies such as the Australian Maritime College have enabled
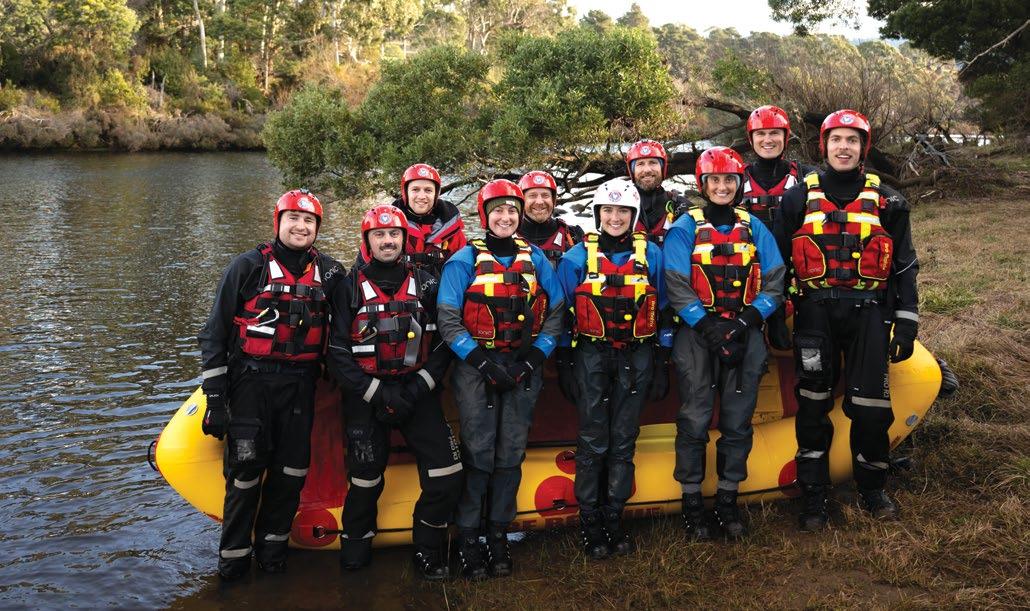
advanced scenario training, including night operations, while collaboration with AFAC and other emergency service organisations is embedding Surf Life Saving’s role in multi-agency flood operations. This unified approach ensures that lifesavers across Australia are equipped with skills, equipment, and operational systems needed to protect communities in flood emergencies now and into the future.
PUBLIC RESCUE EQUIPMENT PROJECT
Since November 2024, the SLST Beach Drowning Blackspot Reduction Project has made significant progress in establishing the foundations for a rollout of Public Rescue Equipment (PRE), enhanced BeachSafe data, and targeted community education. This initiative, informed by collaboration with SLSA, other states, and SLS New Zealand, has produced finalised PRE sign concepts, completed risk assessments, and secured a manufacturer through a procurement process. Staff training in the AMSAMP system has enabled initial desktop audits of high-visitation beaches, ensuring future BeachSafe updates will be accurate and consistent. Early engagement with
councils, land managers, and local surf lifesaving clubs has been critical to building support for the project.
The project is strengthening coastal safety by combining infrastructure, information, and education to address unpatrolled beach risk. The groundwork completed in this period will support the installation of approximately 30 PRE units by November 2026, alongside community training sessions aimed at equipping the public with the knowledge and confidence to use the equipment effectively. The integration of BeachSafe updates ensures the public has access to the most current safety information, improving decision-making before and during beach visits. While the implementation phase is scheduled to accelerate in 2025/26, the project’s early emphasis on stakeholder engagement, resource development, and interstate/international learning positions it to deliver sustainable outcomes that can be replicated across other coastal regions.
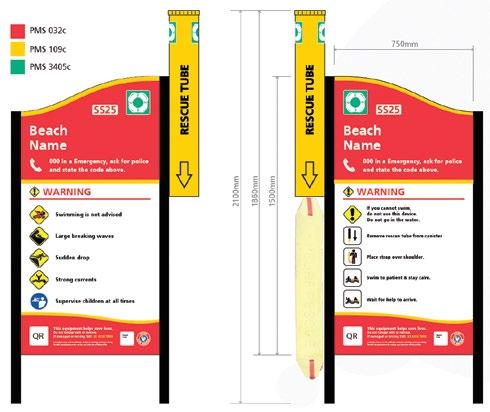
2024/25: VISITATION & CAPABILITY
In the last twelve months, 150 thousand Northern Territory residents (16 years and above) visited the coast on average 3.9 times each month (NCSS2025). This equates to approximately 7 million individual visitations to the coast.
150K COASTAL VISITORS
58 RESCUES 10,579 PREVENTATIV E ACTIONS
3.9 VISITS/MONTH
1.9 HOURS/VISIT
100K
10,571 Preventions
7 Marine stings CAPABILITY PROFICIENT MEMBERS 113 PATROLLING MEMBERS 113
215 Cuts & abrasions
$49,179,577 VALUE TO COMMUNITY
1 Shark alarm 7 Lost children 233 FIRS T AID TREATMENTS
2 Major Wounds
2020-25: FIVE YEAR IN REVIEW
Across the Northern Territory, eight drowning deaths were recorded between 2020/21 and 2024/25. This is 20% lower than the preceeding 5 years (n=10), and 6% below the ten-year annual average.
Males were overrepresented, accounting for 88% of drowning deaths. High-risk age groups include 55-64 and 25-34 year olds, with decedents aged 55+ comprising 50% of Northern Territory coastal drowning deaths.
Swimming/wading, followed by falls, accounted for 50% and 25% of coastal drowning deaths, respectively. Most coastal drowning deaths occurred at beaches (50%), with a further 25% at port/marina locations. The wet season recorded 50% of coastal drowning deaths, as did the dry season.
Regional and remote areas, which are harder to access and often have limited resources, recorded 100% of coastal drowning deaths, and 88% occurred more than 1km from a Surf Life Saving service. All coastal drowning deaths occurred at unpatrolled locations, outside of patrol times, or away from the red and yellow beach safety flags.
0.63/100,000POP. DROWNING RATE COASTAL DROWNING DEATHS
NB: Arrow indicates change from 10-year average
Figure 101
2020-25: COASTAL DROWNING DEATHS
8 coastal drowning deaths were recorded (drowning rate of 0.63/100,000pop.), below the 10-year average.
YEAR OLDS
YEAR OLDS
>1KM FROM SLS
NORTHERN TERRITORY
2015-25: TEN-YEAR COASTAL DROWNING TRENDS
Figure 102
2015-25: COASTAL DROWNING DEATHS
Annual NT coastal drowning deaths and rates are illustrated above. Coastal drowning deaths and drowning rates recorded for 2024/25 (n=1; rate: 0.38/100,000 pop.) were below the 10-year average.
2015-25: KEY DEMOGRAPHICS
Figure 102
2015-25: DROWNING DEATHS BY ACTIVITY
Drowning prevalence varies by activity over time. Since 2015, boating and swimming/wading have recorded the equal highest number of coastal drowning deaths (28%, n=5), followed by falls (17%, n=3).
YEAR OLDS
YEAR OLDS
CAUSAL FACTORS
(n=12, AVERAGE RATE = 0.81/100,000 POP.)
VICTORIA/WEST DALY
(n=1, AVERAGE RATE = 1.50/100,000 POP.)
2015-25: COASTAL DROWNING DEATH NUMBERS & RATES BY REGION
(n=3, AVERAGE RATE = 1.73/100,000 POP.)
UNINCORPORATED NT (n=2, AVERAGE RATE = 2.73/100,000 POP.)
ROPER GULF (n=0, AVERAGE RATE = 0.00/100,000 POP.)
Figure 103
2015-25: BIRTH CONTINENT OF DECEDENT
Almost one third of decedents were born overseas (28%).
AUSTRALIAN BOX JELLYFISH FIRST AID RESEARCH PROJECT
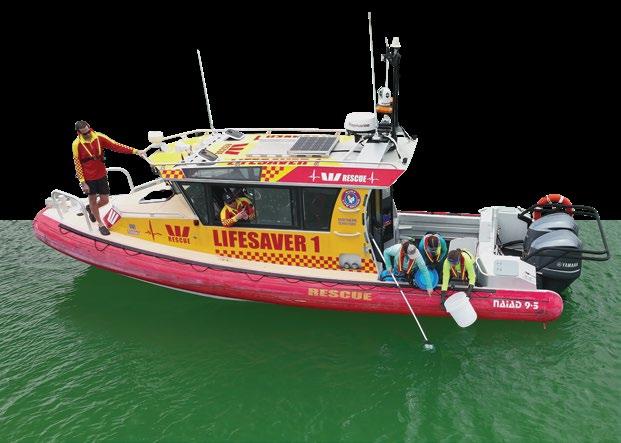
Northern Territory’s Westpac Offshore Rescue Boat in action collecting an Australian box
The Australian box jellyfish is considered one of the most venomous organisms in the world. They are prevalent during the warmer months along northern Australian coastlines, posing a significant risk to tropical beachgoers. In an effort to advance sting management and effective treatment protocols, Surf Life Saving Northern Territory hosted a collaborative research group from Surf Life Saving Australia, Surf Life Saving Queensland, Surf Life Saving New South Wales, James Cook University and the University of Hawaii, collectively seeking to improve public safety and reduce preventable fatalities from tropical marine stingers. Sting management practices for life threatening box jellyfish are currently a contentious topic for risk managers, with current envenomation first aid guidelines being challenged or misinterpreted. This lack of clarity has promoted misinformation relating to these rare, but potentially lethal stings. Clarification of the national jellyfish first aid guidelines are crucial to improve consistency and effectiveness of tropical marine sting management.
The multidisciplinary expert team conducted preliminary investigations into immediate first aid responses of Australian box jellyfish (Chironex fleckeri) envenomation in Darwin in January to assess the effectiveness of vinegar, hot water, saltwater, heat packs, and ice in stopping sting impacts from worsening. Future research is planned to clarify optimal sting management practices, safeguarding beachgoers and patrolling members in high-risk areas, ultimately working towards the national aim of zero preventable deaths in Australian waters.

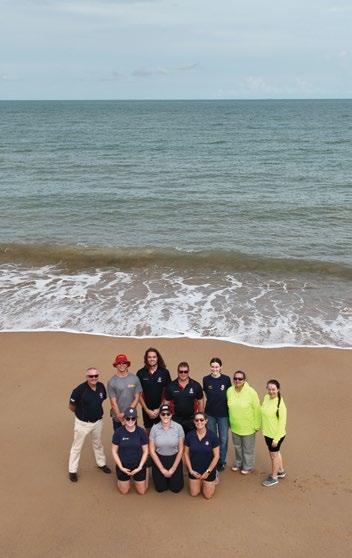
Figure 105 Australian box jellyfish collaborative research team.
Figure 104
SLS
jellyfish at Cullen Bay marina.
INTRODUCING BERT
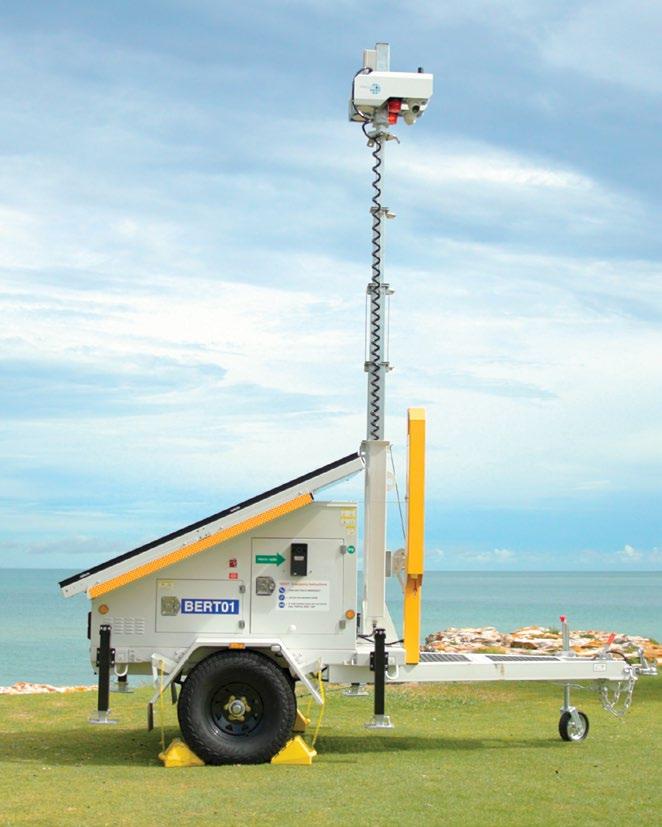
BEACHSIDE EMERGENCY RESPONSE TRAILER
BERT is equipped with emergency call buttons and cameras providing direct contact to SLSNT personnel, allowing for quicker and more directed responses. BERT will be an asset to local beachgoers, featuring an accessible emergency compartment containing an AED, first aid kit, and vinegar, as well as an emergency hailer and rescue tube for capable bystanders to perform rescue if necessary.
This program will include two phases:
Locals and visitors to the beaches of Northern Territory’s Top End can now swim under the assurance of a new safety initiative from Surf Life Saving Northern Territory (SLSNT), who are trialling an exciting development in life saving technology.
With support from local government, Parks & Wildlife, emergency services, and the Blackspot Project, SLSNT are excited to introduce BERT, the Beachside Emergency Response Trailer. BERT is NT’s first Emergency Response Beacon (ERB) and is part of a broader initiative to implement Public Rescue Equipment (PRE) around Australia. First launched in March 2025, BERT will be trialled over a 24-month period at beaches in Darwin and its surrounding coastal areas that have been identified as drowning hotspots by the Blackspot Project, starting with the Nightcliff area in Darwin’s north.
1. First, a trial stage will aim to audit, monitor, and evaluate the ERB at multiple locations. This will asses the equipment, placement, and usage, as well as public awareness, knowledge and interactions. Insights from stakeholders and emergency responders will be used to fill gaps in technology and deployment.
2. Following this, an expanded deployment of ERBs to permanent locations with additional communication support will be carried out.
SLSNT believes BERT will help to save lives and making a difference in NT waters, and will help to extend the reach of lifesaving efforts in unpatrolled and high-risk areas.
GLOSSARY
Adult For the purpose of this report, adult refers to a person 16 years of age and over.
Advanced Resuscitation Techniques A certification providing the skills and knowledge required to use specialised equipment in the provision of resuscitation in line with the Australian Resuscitation Council (ARC) guidelines.
ALS Australian Lifeguard Service.
Apply First Aid A certification providing the skills and knowledge required to provide a first aid response to a casualty.
Aquatic fatality Refers to non-drowning related incidents which have occurred in the water at a coastal location.
Attempting a rescue Trying to retrieve a person in distress and deliver them to a place of safety.
AWSC Australian Water Safety Council also Australian Water Safety Conference.
AWSS Australian Water Safety Strategy.
Bay A body of water partially enclosed by land but with a wide mouth, affording access to the sea.
Beach A wave-deposited accumulation of sediment – usually sand, but ranging in size up to boulders, deposited between the upper swash limit and wave base.
Blackspot An area with a concentration of coastal/ocean incidents and a high probability/risk of ongoing recurrence.
Boating Using either a powered vessel or sailing boat for pleasure and/ or fishing.
Bystander A person who is present at an incident but not part of it initially.
Coastal Describes the foreshore, seabed, coastal water, and air space above a large body of water (harbour/bay/inlet), including areas up to 3nm offshore and of which the landward boundary is the line of mean high water, except where that line crosses a river/inlet, the landward boundary at that point shall be the point upstream that is calculated by multiplying the width of the river/inlet mouth by five (adopted from the Resource Management Amendment Act 1993 New Zealand).
COD Cause of death.
Co-morbidity A term that refers to the occurrence of more than one disorder, disease, injury, or medical condition at the same time.
Dangerous surf warning An alert issued by the Bureau of Meteorology indicating that surf conditions in an area are unsafe for coastal activities. The warnings are calculated based on wave height, swell direction, and swell period and must exceed the predetermined limitations to be in effect.
Decedent A deceased person.
Drowning The process of experiencing respiratory impairment from submersion/immersion in liquid; outcomes are classified as death,
morbidity, and no morbidity.
Drowning death A fatal drowning incident arising from the process of respiratory impairment as a result of submersion/immersion in liquid.
Drowning rate A comparative rate of drowning deaths to the size of the population for a given area or activity.
Drugs A medicine or other substance which has a physiological effect when ingested or otherwise introduced to the body. The category includes therapeutic, over-the-counter and illicit drugs.
Emergency response An action taken by an SLS entity in response to a call for assistance from an emergency management organisation.
Estuary A dynamic coastal water body where freshwater runoff from land transitions to saltwater from the ocean environments.
Falls (trips/slips) Events that result in a person unintentionally and inadvertently in the water, on the ground or other lower level.
Fatality A fatal incident arising from circumstances other than drowning (eg. medical condition, injury, self-harm, marine creature).
Fatality Rate A comparative rate of fatality to the size of the population for a given area or activity.
First Aid Assessments and interventions that can be performed by a bystander (or by the patient) with minimal to no equipment.
Fishing The act of attempting to catch fish from anywhere except coastal rock platforms
Hazard A source of potential harm.
ILS International Life Saving Federation.
Incident Any unplanned event requiring lifesaving services intervention.
Inland An area that is beyond the line of mean high water or within a landward distance of five times the width of the coastal inlet/river mouth.
Intentional fatality Any intentional incident, including homicide and self-harm related incidents.
International Describes an individual who is confirmed to reside overseas and/or is a temporary visitor to Australia.
IRB Inflatable rescue boat.
IRD Incident report database. A web-based portal used by SLS services to electronically record incident reports.
Jetty An artificial structure that projects out into the water from land.
JRB Jet rescue boat.
Jump(ing) The activity of launching off a cliff, rock platform, pier, jetty.
Aka tombstoning (UK/Europe/North America).
Lifeguard An individual who undertakes patrols at a beach or another aquatic environment. He/she is typically a salaried member, qualified in public safety and aquatic rescue.
Lifejacket A buoyant or inflatable garment or device designed to keep a person afloat in water and increase their likelihood of survival.
Lifesaving Service A coordinated group that exists to provide aquatic safety services to the public. This includes Surf Life Saving Clubs, Lifeguards, SurfCom, RWCs, RIBs, JRBs, ORBs, Rescue Helicopters and 4WD units.
Local Government Area (LGA) Also known as local councils, LGAs include cities, towns, shires, municipalities, or boroughs.
Marina A man-made boat basin having sea walls or breakwaters and offering dockage and other services for water vessels.
Marine fauna Macro-organisms that live within marine systems (eg., fish species including sharks and rays, estuarine crocodiles, blue-ringed octopus, jellyfish species, sea snakes, etc.).
Medical For the purpose of this report, medical refers to an aquatic incident that was caused by a medical episode, e.g., a heart attack or epileptic seizure.
NCIS National Coronial Information System.
NCSS The National Coastal Safety Survey conducted annually to gather information about Australian coastal participation, swimming ability, risk perception, behaviours, and attitudes to coastal safety.
Non aquatic fatality Non aquatic fatalities refer to non-drowning related incidents which have occurred at a coastal location but not in the water.
Non aquatic transport Any form of transport that is not meant for the water such as airplanes, bicycles, and motor vehicles.
Ocean The seabed, water, and air space above the water between 3nm and 12nm (the Australian Territorial Sea) offshore.
Offshore Describes the coastal water area beyond the surf zone and inshore area from 500m to 200nm.
ORB Offshore rescue boat.
Patrol Service undertaken to monitor activities in/around an aquatic environment and respond accordingly through either preventative actions or rescue operations.
Patrol flags Red and yellow horizontally divided flags which are set after performing a risk assessment to determine the most suitable area for swimming. The flags identify a zone for swimming and bodyboarding within a patrolled location.
Patrolled location A location supervised by a lifesaving service.
Preventative action Direct action taken to reduce or eliminate the probability of a specific rescue, first aid or other reportable incident from happening in the future.
PWC Personal watercraft, also known as jet ski.
Rescue The retrieval of a person in distress, delivering them to a place of safety and the application of first aid and basic life support as may be required.
Resuscitation Prevention or restoration of life by establishing and maintaining a person’s airway, breathing and circulation.
RIB Rigid-hull inflatable boat.
Rip current A seaward flowing current of water moving through a surf zone.
River A natural stream of water flowing into an ocean, lake, or other body of water.
Rock/Cliff A rock platform or shelf that may project out from the coast or may have a high steep face.
Rock fishing The act of attempting to catch fish from a coastal rock platform.
RWC Rescue watercraft.
Scuba diving Swimming underwater with the aid of scuba equipment for recreational or commercial purposes.
Snorkelling Swimming with a snorkel and face mask. Includes freediving and spearfishing.
SurfCom SLS radio communications centre that assists in managing the communications of lifesaving operations and data collection.
Surf lifesaver An individual who undertakes patrols at a beach or other aquatic environment. They are typically a nonsalaried member qualified in public safety and aquatic rescue.
Support Operations Rapid response rescue units not affiliated to any one Surf Life Saving Club.
Surf Life Saving Club A SLS affiliated not-for-profit organisation that has volunteer members who provide coastal safety services to the community.
Swimming Moving through water by moving the body or parts of the body.
Toxicology The measurement and analysis of potential toxins, intoxicating or banned substances, and prescription medications present in a person’s body.
Unintentional fatality Deaths other than drowning deaths (such as medical incidents, injury, accidents, or marine creature), excluding homicide and self-harm related incidents.
Wading Walking through water while partially immersed.
Watercraft A piece of non-powered recreational equipment used in water. Examples include surfboards, stand-up paddle boards, bodyboards, windsurfers or kayaks.
REFERENCES
METHODOLOGY
The National Coastal Safety Report 2025 contains information on Australian community behaviours and attitudes to the coast; SLS capability and membership capacity; rescues and emergency response; and coastal drowning deaths and other fatalities that occurred along the Australian coast during the period of 1 July 2024 to 30 June 2025. This information is correct as of 30 July 2025. All care is taken to ensure the statistical information included within this report is correct. However, pending the outcome of ongoing coronial investigations and as SLS update their operational information, this data may be amended. Data in figures may not always add up to 100% due to rounding.
THE AUSTRALIAN COMMUNITY ANALYSIS
Information about community knowledge, skills, behaviours, and attitudes to coastal safety was gathered from the SLSA National Coastal Safety Survey (NCSS). Conducted by Omnipoll Market Research, the latest survey (NCSS2025) was run online over the period 11 - 30 April 2025 among a nationally-representative sample of 3,073 respondents aged 16+ years. The study was carried out in compliance with AS-ISO 20252 - Market, Social and Opinion Research. To reflect the population distribution, results were post-weighted (on age, gender, geographic strata, and education) and projected to Australian Bureau of Statistics data (Census 2021). The Australian population aged 16 and above (the reference population for this survey) is 20,434,000.
CAPABILITY & RESCUE ANALYSIS
SurfGuard, the Incident Report Database (IRD), and SurfCom management system (SurfCom) are web-based applications that enable members and SLS entities at all levels to enter and access SLS operational (including rescues and first aids), capability (including assets and services), educational and administrative data. Data relating to lifesaving operations and awards delivered in 2024/25 by volunteers, lifeguards and lifesaving services was extracted. This data was verified by SLS state/territory entities. Information about assets and services were gathered from state/territory entities.
COASTAL MORTALITY DATA ANALYSIS
SLSA collects incident data from SurfGuard, the IRD, SurfCom, the National Coronial Information System (NCIS) and by monitoring media reports for coastal and ocean incidents. The information is verified with the assistance of SLS state/territory entities and compiled for analysis by SLSA’s Research Department. The following variables are used to match fatal incidents from more than one data source: incident date; location; age; gender; and incident description. The NCIS is an online database of data sourced from the Department of Justice and Community Safety (Victoria) who are they organisational source of the coronial data. Deaths are excluded as a coastal drowning if they are reported as ‘intentional deaths’, they occur at inland locations, or ‘drowning/ immersion’ is not a contributory factor as noted by the coroner. Coastal incidents that are deemed intentional or not due to drowning/immersion are logged as coastal fatalities instead. This report presents information on drowning deaths and other non-drowning fatalities that have occurred along the Australian coast. We explore incidents that have occurred between 1 July 2004 – 30 June 2025. Mortality rates were calculated using the number of deaths divided by the population (per head of 100,000) from Australian Bureau of Statistics. The 10-year averages in this report are calculated from drowning death data from 2014/15 to 2023/24 inclusive. The authors are responsible for the use made of the data in this report.
DROWNING & FATALITY DATA LIMITATIONS
Over years of investigation as part of the NCIS process, some cases are amended prior to their closure, resulting in changes to the classification of cases in our datasets. Therefore, the number of coastal drowning deaths published in this report may be different from annual totals previously reported. In an effort to produce a timely report on our current year’s data we acknowledge that these figures will change. Each year, the changes that occur in the previous year’s report will be made transparent. The 2024/25 data in this current report are not the final coastal figures as 88% of drowning deaths and 65% of fatalities recorded remain open cases, and 32% of 2024/25 cases do not yet have a cause of death (COD) listed. Once NCIS
closes a case, SLSA modifies those with unknown intent and those where the cause of death is not drowning, from ‘coastal drowning’ to ‘coastal fatality’. The incidents are included in our annual totals and analysis, and remain so until a COD is listed other than drowning/immersion.
CHANGES FROM PREVIOUS REPORTS
As part of the NCIS investigation process, some cases are amended prior to their closure and have resulted in changes to our datasets. This year SLSA has commenced a thorough review of its coastal and ocean fatality database to update all cases to the same inclusion standards. See the below table for annual case numbers.
For enquiries concerning reproduction, contact SLSA on: phone 02 9215 8000; email: info@slsa.asn.au
Every attempt has been made to trace and acknowledge copyright, but in some cases this may not have been possible. Surf Life Saving Australia apologises for any accidental infringements and would welcome any information to redress the situation.
ACKNOWLEDGMENTS
SLSA wishes to thank the following people and organisations for their contribution to the National Coastal Safety Report 2025: the Australian Government: Department of Health; National Coronial Information System: Jessica Bryan; Department of Justice and Community Safety; Omnipoll: Frederic Anne; Royal Life Saving Society Australia: William Koon, Stacey Pidgeon & Lauren Miller; SLS State Centres, branches, clubs, support operations and ALS; SLSA major national corporate partners: Ampol, DHL, Isuzu, Qantas, and Westpac.
SUGGESTED CITATION: Surf Life Saving Australia (2025) National Coastal Safety Report 2025. SLSA: Sydney.
REFERENCES
• Australian Bureau of Statistics (December 2024), National, state and territory population, ABS Website, accessed 25 August 2025. Available from: https://www.abs.gov.au/ statistics/people/population/national-state-and-territorypopulation/latest-release
• Australian Bureau of Statistics (2021), Population: Census, ABS Website, accessed 25 August 2025. Available from: https://www.abs.gov.au/statistics/people/population/ population-census/latest-release
© 2025 SURF LIFE SAVING AUSTRALIA
This publication is copyright. Except as expressly provided in the Copyright Act 1968 and the Copyright Amendment Act 2006, no part of this publication may be reproduced, stored in any retrieval systems or transmitted by any means (including electronic, mechanical, microcopying, photocopying, recording or otherwise) without prior permission from Surf Life Saving Australia.
This report was compiled by Jasmin Lawes, National Research Manager; Sean Kelly, Research Assistant; Rebecca Stolper, Research Assistant; Norton Grey, Research Assistant; Olivier Pastore, Research Assistant; Elle Kuhta, Project Officer; Rhiannon Brinckman, Coastal Safety Project Specialist; Michael Bonnici, Manager Coastal Safety; Shane Daw, General Manager Southern Region. Design: Melissa Conchar. Maps: John Frith, Flat Earth Mapping.
CONTACT INFORMATION

SLSA receives Government funding to commence valuable initiatives and programs. However, we rely on the generosity of the community and corporate support to ensure they continue.
For more information:
Surf Life Saving Australia sls.com.au
Surf Life Saving New South Wales surflifesaving.com.au
Surf Life Saving Northern Territory lifesavingnt.com.au
Surf Life Saving Queensland lifesaving.com.au
Surf Life Saving South Australia surflifesavingsa.com.au
Surf Life Saving Tasmania slst.asn.au
Life Saving Victoria lsv.com.au
Surf Life Saving Western Australia mybeach.com.au
KEY 2024/25 STATISTICS
HIGH RISK DEMOGRAPHICS
SWIMMERS/ WADERS YEAR OLDS 55+ REGIONAL/ REMOTE AREAS MALES
8,207 RESCUES
65,942
2,194,704
$9,000,003,752 VALUE TO COMMUNITY