TOMORROW’S HOME
Emerging social trends and their impact on the built environment.


Emerging social trends and their impact on the built environment.
This research paints a picture of social change in Britain and its significance for the built environment. The economic, social and environmental forces facing the present generation are so altered that a radical, new approach to urban design is vital. This response to change will and must have a huge impact on the built environment and the wider society of modern Britain.
Author and Researcher - Lily Bernheimer, Space Works Consulting, Consultants and Editors - Robert Adam, Hugh Petter, ADAM Urbanism, Kurt Mueller, Grainger, With Thanks to - Yolanda Barnes, Savills
World Copyright Reserved
ISBN 978-0-9564146-2-5
© Lily Bernheimer and ADAM Architecture Limited
All rights reserved. No part of this publication may be reproduced, stored in a retrieval system, or transmitted in any form or by any means electrical mechanical, photocopying, recording or otherwise, without permission of the publisher.
First published by ADAM Publishing, Old Hyde House, 75 Hyde Street, Winchester, Hampshire SO23 7DW September 2014
Cover Image - ©Thomas Northcut, Getty Images
Emerging social trends and their impact on the built environment.
This report seeks to paint a picture of social changes that are currently taking place in England and Wales and identify the influences that will be most significant for the future of the built environment. The research is focused on the age cohort of 18-34 year-olds. This cohort aligns with the ‘baby boom echo’ generation, accounting for a significant expansion in the population pyramid: 15-34 year-olds currently make up 26% of the population. As the younger generation, they are most affected by social change and will have the greatest influence over future trends in the built environment. As this cohort is made up of those who were born towards the end of the last millennium we describe them as ‘Millennials’.
The New Housing Ladders
Millennials may follow in their parents’ footsteps in terms of housing aspirations and driving behaviour as they age, or their current differing preferences may persist. However, the economic and environmental forces facing this generation are so altered that forging a new and varied set of housing ladders seems certain.
There are two potentially divergent trends: mega/ micro commuting may allow Millennials to pursue the great ideal of countryside living by dwelling farther from cities, or their city orientation may prevail later in life. Transportation and social interaction patterns have both shown that as new technologies enable people to disperse, they are also regenerating and reorganising connections and economies on the local level.
More Millennials are likely to live in cities for longer spans of their lives, both because more are postponing or declining family formation, and because many young families won’t be able to afford to buy in the first-tier suburbs and countryside. Millennials are far more likely to live in cities and flats, and far less likely to own and travel by car than recent generations were at the same age. Economic, tenure and social trends suggest that city-living is not a short term phenomenon. This demographic shift towards more young adults and young families will require different services and functions from cities.
The growth of living alone has been greatly exaggerated. Only half of ‘single-person households’ are solo-dwellers and the slowing
decline of household size also tells us that people are sticking together. ‘Other’ multi-adult households are projected to grow 20% between 2011 and 2021 and we are likely to see a growing demand for housing to accommodate this sector.
As dwellings have shrunk and become spaces of individual leisure and labour rather than socialisation, well-managed communal facilities will become more significant. Cities will need to absorb and accommodate these functions in other ways with facilities such as integrated live/work developments, workhubs, community centres and gardens.
Housing markets are defined by local supply and demand beyond the generality of national statistics. Cities like Manchester, Bristol and Nottingham are predicted to see a continued strong demand for more housing. With both suburbs and major cities becoming more expensive, however, second and third tier cities may become increasingly appealing places to live, calling for the upgrading of existing housing stock, public transport and quality of place.
England’s small size, high density and highly developed transport network, now combined with flexible employment trends, mean that many workers might live almost anywhere in the country while maintaining frequent contact with a main office, clients, or colleagues.
The growth of flexible working arrangements of all types is likely to escalate as Millennials become a
larger and more influential part of the work force. The growth of the knowledge economy, part-time work, and various individualised employment structures are building a labour market that is increasingly flexible and untied from regular daily commuting. Fewer miles on the road will be beneficial to local economies and to the national economy by relieving congestion on the transport network. Strong public transport, from both conventional service providers and the sharing economy sector, will be crucial to meet the needs of this generation.
Changing living and working patterns show that the notion of residential areas solely as dormitories is on the decline. We are likely to see people spending more time where they live, leading to a need for different types of local services and attitudes to places of residence.
Additional around-the-clock activity may require and support services such as eateries, crèches and shared facilities for printing and other office equipment.
Homeworking is forecast to be particularly important to economic development in rural areas. In market towns there is a strong market for live/ work districts, combinations of mixed-use units and workhubs. Live/work development will be an important consideration for new settlements, and workspace and residential facilities can bring new functions to regenerate high streets as shopping moves online.
Millennials will inevitably leave their own imprint on the British landscape but, if the built environment is responsive to these changing social patterns, that impact may have economic and environmental benefits for society at large.
The question of what kind of city we want cannot be divorced from that of what kind of social ties, relationship to nature, lifestyles, technologies, and aesthetic values we desire. The right to the city is . . . a right to change ourselves by changing the city. David Harvey1
Such changes in uses and users can reach a ‘tipping point’ where radical building forms or adaptations are realised in design solutions. Joel Ravetz2
As David Harvey has so well expressed, our relation to the places we live in cannot be separated from our lifestyles, social interactions, technologies, aesthetics, and connection to nature. Rooms such as the kitchen, for instance, have radically changed in terms of design, technology, and social function over the past hundred years. Home ownership has boomed and faltered, and the private rental sector is now making a swift resurgence as social renting declines. As we gain more individual space per person in the home while it shrinks in the workplace, the significance of home in terms of family, work, social roles, and the public versus private realm appears to be at a major turning point. The structure and function of our dwellings and settlements is evolving in tandem, but the built environment has responded more effectively to some forces than others. This report seeks to paint a picture of the intertwined social changes underlying these trends, and to glean the influences that will be most significant in forming the future of the built environment.
In unravelling the correspondence of these societal shifts with the evolution of the built environment, three interlinked macro-trends emerge:
• Individualisation
The most overwhelming social change is a shift towards individualisation, which Ulrich Beck and Elisabeth Beck-Gernsheim describe as a major force of modern society whereby central institutions and ‘basic civil, political and social rights, but also paid employment and the training and mobility necessary for it—are geared towards the individual rather than the group’.3 With more people living alone and many previously public-realm activities such as work, entertainment, and shopping withdrawing into the home, a picture of increasingly private and internalised home-based living emerges.
• Flexible Lifestyles
In family, work life, and housing, younger generations are increasingly resisting commitment to the traditional milestones of adulthood, extending more flexible lifestyles later in their lives. We also see a growing focus on mobility and dispersion—the proliferation of mobile technologies blurring the distinction between home, work, and intermediate spaces, and also changing the way we navigate our spatial and social surroundings. This seemingly downloadable lifestyle has been enabled by new technologies and social freedoms, but is also a result of constraints on wealth and housing.
• The New Collectivism
In the face of what may seem to be an increasingly isolated and self-centred society, we are also seeing the emergence of new types of shared spaces, distributed communities, and a resurgence of urban public life. Individualisation involves a shift from ascribed to acquired roles, leading people to build new kinds of communities and business models.4 These range from the growing ‘citizen sector’ of social entrepreneurs to bike-share systems and mobile ride-sharing apps.5
Part 1 of this report traces these macro themes through four areas of social change in England and Wales in order to understand their impact on the built environment: family formation, labour market, wealth and tenure, and social interaction. Part 2 brings this story together with the history of sociotechnical change in our dwellings, settlements, and ‘life-course’ geographies in order to draw out more specific implications for the built environment.
SOURCE: Adapted from data from the Office for National Statistics Licensed under Open Government Licence v 2.0
This report will also specifically focus on the age cohort of 18-34 year-olds. While other cohorts were researched in the process, this group emerged as the key focal point. The cohort aligns with the ‘baby boom echo’ generation, accounting for a significant bump in the population pyramid: 15-34 year-olds make up 26% of the population in England and Wales.6 As the ascending generation, they are impacted the most by the social trends we will cover and are also in a position to exert great influence over future trends in the built environment. Decline in owner-occupation has already been greatest for this cohort, for example, with owner occupation for 25-34 year-olds in England falling from 60% to 45% between 1993 and 2010.7 This is a very significant change in only 17 years.
The years from age 18 to 34 span critical lifecycle transitions including further education, permanent employment, family formation, and home ownership, so this generation’s crucial choices and patterns are still unfolding. These behaviours and attitudes will have significant impact on future trends. Young adults also generally exert a disproportionate influence over the housing market because they have greater mobility and ability to break housing transaction chains.8
This cohort also makes up the largest segment of the private rental sector, which may further amplify their influence. The private rental sector has an impact on broader housing markets disproportionate to its size because it has high turnover and accommodates those unable to enter other sectors.9 Finally, we simply know less about this group than we do about older age cohorts that have been studied longer.
PERCENTAGE OWNING WITH MORTGAGE BY AGE GROUP
% of owners with mortgage by age group of head of household
35-44 years 45-54 years
25-34 years
55-64 years
16-24 years
65+ years
SOURCE: Whitehead et al., 2012
Often called ‘Millennials’ or ‘Generation Y’, the cohort born roughly between 1980 and 2000 are alternately described as being both more and less civic-minded than previous generations in academic and press reports alike, as in Time Magazine’s recent cover story, ‘Millennials: The Me Me Me Generation’.10 Much research has been conducted to gain insight into whether the first generation to grow up with the Internet is ‘wired’ differently, cognitively speaking.11 Andrea Hershatter and Molly Epstein conclude that Millennials’ behaviour is ‘readily identifiable, often predictable, and frequently unique to the generation’, most particularly regarding their relationship with technology and institutions.12 The major trend emerging from this work is a generation of on-the-go generalists who may be slower to commit in various areas of life than their predecessors were, whether in settling on an exact meeting place or settling into many of the traditional trappings of adult life.
I.
The key trends in family formation today are not new. The rising age of childbirth and marriage, shrinking family size, and increase of divorce, co-habitation, and single living are all continuing along trajectories that began in the 1970s in England and Wales. Nor are these trends unique to British society. These transformations have taken hold across the industrialized world with clear consistency over the past fifty years, beginning in Northern Europe and now reaching great extremes in East Asia as well.13 Psychologists, sociologists, and urban economists have explained this shift through the concepts of individualisation,
The major trend emerging from this work is a generation of onthe-go generalists who may be slower to commit in various areas of life than their predecessors were, whether in settling on an exact meeting place or settling into many of the traditional trappings of adult life.
At the heart of all of these explanations is the idea that the social norms and institutional organising structures of industrialized societies have increasingly prioritised the individual over the family and other group units such as the village, company, or trade union.
post-familialism, and the dawn of ‘emerging adulthood’ as a new phase of human development. At the heart of all of these explanations is the idea that the social norms and institutional organising structures of industrialized societies have increasingly prioritised the individual over the family and other group units such as the village, company, or trade union. These great shifts in family life give particular insight into the future of the built environment in that major residential moves are often tied to major lifecourse stages: partnership, childbirth and leaving the parental home.

On average, British women today are marrying and having children later than their mothers and grandmothers. In 1971 four out of five births were to women under 30; by 2009 just over half were to women under 30.14 Women’s average age at childbirth has gone up from 26.2 to 29.8 over the course of these four decades.15 Beck and Beck-Gernsheim view these trends through the broader development of women gaining ‘a life of one’s own’. As educational opportunities increased, new categories of work opened, traditional and religious values declined, and birth control revolutionized the power women could exercise over their sex lives and childbearing, women’s biographies essentially became closer to the biographies of men. Greater individual earnings allowed women to be more independent from male family members, while rising social and geographic mobility (e.g. commuting further to work) also increased the potential to
gain more distance from one’s family in terms of time, space, and social connections.16 In this short time, women went from having almost no opportunities to define their roles in life to having many. Marriage and childbirth, which had been viewed as obligations, came to be seen as individual choices.17
In only the two decades since 1990, the average age of marriage has risen from 28.8 to 33.6 for women, and from 33.1 to 36.2 for men.18 Jeffrey Jensen Arnett’s extensive research on young adults in Europe and the US suggests that this change reflects the advent of a new era in human development that he calls ‘emerging adulthood’. Much as our understanding of adolescence as a distinct stage of development came about only in the 1920s, many have suggested we now need to recognize the ‘twenteenies’ as a distinct life stage of its own. Arnett and others have found that in many countries ‘there is [now] a clear social norm that emerging adulthood should be enjoyed for some years before full adulthood is entered’.19 This period is understood as an unstable, self-focused time for identity exploration, social norms dictating that young adults should explore and develop as individuals by travelling and pursuing educational opportunities before committing to a partner and children. While marriage was previously thought of as a necessary basic social unit (especially for women), it has come to be understood more as a quest to find one’s ‘soul mate’.
In extension of this individualised life style, increasing numbers of Britons are not marrying at all. In 1985, 95.5% of women born in 1945 married by age 40, whereas in 2010, only 71.3% of women born in 1970 were married by the same age.20 While the number of formal marriages has declined, the number of cohabiting couples has increased, and attitude surveys have suggested the majority of the British
SOURCE: Office for National Statistics
public sees little difference in this technicality.21 With such great increases in cohabitation and births outside marriage, we might question whether the distinction between marriage and cohabitation is relevant to housing decisions. But marriage in fact raises the probability of home ownership by 14%; a much larger proportion of married people are homeowners than either co-habiting couples or single
SOURCE: Adapted from
1. For both parties
2. For one or both parties
3. Figures for 2009 are provisional
SOURCE: Adapted from data from the
persons.22 We will further explore this compelling connection in light of the Millennial cohort’s housing prospects in the chapter on Economic Change.
...marriage in fact raises the probability of home ownership by 14%; a much larger proportion of married people are homeowners than either co-habiting couples or single persons.
As marriage has declined, more women of all ages have been having children out of wedlock, and this is one of the greatest changes in family formation. In 2012, 47.5% of births were outside marriage, as compared to 8.6% in 1972.23 Accordingly a smaller proportion of children are living in families with married parents, and a greater proportion are living with cohabiting couples and single parents. Married and non-married mothers also exhibit discernibly different birth patterns. Births within marriage have especially declined for women under 30, while married women much more closely follow the overall rising trend in women’s age at childbirth and marriage.24
So while average age at childbirth has risen, what this means for the age at which the Millennial cohort may typically transition to a life stage where dwellings need to accommodate children is more complex. As we will explore further in the next chapter, childbearing choices may also be linked to choices about education and work; British women with higher levels of education have been shown to be more likely to postpone having children while focusing on career advancement.25 So within this age range two broad clusters have emerged: 1) those who have children outside of marriage, which peaks in the 20-24 year-old age range, and 2) those who have children within marriage, peaking in the 3034 year-old range.26 A growing number of women, particularly the married segment, have also been having children later in their 30s; births for 35-39 year-old married women have risen 91% since 1971. Nevertheless, the vast majority of childbearing is still taking place by the age of 34 for women.
Surprisingly, the average number of children per women has also risen slightly in the new Millennium. After falling from the 1960s peak of 2.95 to a low of 1.63 in 2001, total fertility rate grew steadily until 2008, wavering around 1.93 since then.27 Possible explanations include the changes in childbirth timing, increase in number of foreign-born mothers (who tend to have more children), and economic factors. Periods of economic downturn are often associated with a reduction in childbearing, followed by a compensating increase as conditions improve.28 This relationship is complicated by the impact of related factors such as the link between unemployment and family formation, however, and the fact that use of birth control and women’s labour market participation are both much higher now than in previous recessions.29 So while this small fertility spurt is notable, it is difficult to conclude what it foretells for Millennials. There has also been a consistent decline in divorce rates from 2003 to 2009 (6.4% decrease from 2008 to 2009 alone), and the proportion of marriages that were the first for both partners in 2009 was 65%, the highest rate since 1980.30

It is too soon to tell whether these numbers signal a reversal of the prevailing trends, but it is possible that the greater financial instability this cohort is likely to face may lead them to make different choices about partnership and family.35 Compared to many of the leading social changes in the labour market, wealth, and social interaction, these trends in family formation have been on the same course for a relatively long time.
SOURCE: Adapted from data from the Office for National Statistics licensed under the Open Government Licence v.1.0
But unlike many other areas, childbirth also has a natural cap in how far upward a mother’s age can drift, short of technological advances like cryogenic egg freezing becoming more widely accessible.
The decreasing size of households has corresponded with a decrease in the size of new dwellings...
The decrease of household size, rise of single-person households, and expanding demand for residential space are all part of the trend towards individualisation in our home lives. Changes in household size, population density, and dwelling size are tied in a complex relationship. Average household size has dwindled from 3.1 in 1961 to 2.35 in 2011.31 This may be related to the rising age of childbirth in that later family formation simply leaves less time for women to have children. This decline is projected to continue, with the average for England forecast to fall to 2.33 by 2021.32 This long-term trend has slowed considerably, however, rising slightly and then levelling off over the past decade.33
The decreasing size of households has corresponded with a decrease in the size of new dwellings; new UK houses are smaller than in any other European country but Italy and have the third smallest rooms. British dwellings also tend to have a relatively high number of rooms.34 As of 2012, the UK average household size was the same as the European average, and while countries such as Spain and Ireland have much larger households, the UK also has more families with three or more children than 75% of other EU countries.35

While new homes tend to be smaller and more densely situated than the older building stock, people are actually living less intensively, occupying more space
per person on average, due to smaller household sizes.36 In real terms this might translate to a couple living in a two-bedroom house or flat that would have more likely housed a family of four thirty years ago. The British public’s desire and demand for more space in their homes, both indoors and outdoors, has consistently been growing.37 There are a myriad of environmental, political, and economic factors involved in the higher density and
While new homes tend to be smaller and more densely situated than the older building stock, people are actually living less intensively, occupying more space per person on average, due to smaller household sizes.
SOURCE: English House Condition Survey 2001, ODPM
smaller size of new dwellings, which will be discussed in Part 2, but the greater social trend has been towards gaining more space per person in the home.
...but the greater social trend has been towards gaining more space per person in the home.
Though the average size of households is decreasing, this statistic obscures other important developments such as the growth of single-person households, the increase in young adults living with parents, and the return of threegeneration households.38 Young adults under 35, particularly men, are increasingly living longer in the family home. In 2013, 32% of 20-34 year-old men and 19% of women were still living with their parents. In 1996, the figures were only 27% for men and 15% for women, representing a 25% overall increase since then.39 This ‘boomerang’ effect is often held up as an example of Millennial commitment resistance, with young people seen to be prioritising travel and leisure over careers and mortgages. But, as we will continue to explore, major economic changes since the 1990s have constrained the work and housing options of this generation in ways that have left many with few alternatives. The population of boomerang 18-30 year-olds is projected to grow from 3.7 million in 2008 to 4 million by 2020.40

Countering this trend is the rise of single-person households, to which the Office for National Statistics attributes much of the decline in overall household size.41 As of 2011, 31% of households were oneperson, a figure that doubled from the early 1970s to late 1990s but has remained fairly stable since. The growing popularity of so-called ‘singlism’ is perhaps the strongest expression of the move towards individualism in the built environment.42 Elderly people are the most likely to live alone, but this is mainly explained by the surge of baby boomers in this age range and greater number of people (especially women) outliving their partners for longer.43
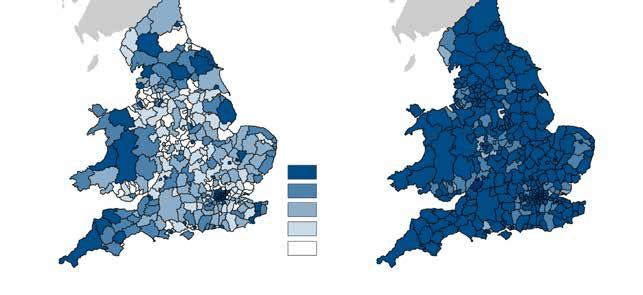
Similarly to the US and Asia, single living has grown fastest in the urban working-age population in Britain.44 As Beck and Beck-Gernsheim write, ‘individualisation means, implies, urbanisation’.45 As of 2011, more than 45% of London’s Westminster, Kensington and Chelsea, and City of London boroughs were single-person households.46 The proportion of 24-45 year-olds living alone, doubled between 1987 and 2004, although it has decreased slightly since then.47 This trend has played a large part in the repopulation of city centres since the 1990s, as they regained cachet as desirable areas to live.48 Interestingly, the growth of single urban living has been stronger among men in the UK,49 as opposed to Asian nations such as Singapore where the shift has been more pronounced among women, and the US, where single women outnumber single men.50
Prophecies for the impact these individualising trends in family formation will have on our built environment are

mixed. Enthusiasts such as sociologist Eric Klinenberg and journalist Ethan Watters report that urban single living is a ‘collective experience’ where people form their own ‘urban tribes’, social networks based on friendship and shared interests that have taken the place of the family.51 Sceptics such as urban theorist Terry Nicholas Clark fear that cities are becoming ‘entertainment machines’, encouraging the development of super-small luxury apartments for unmoored dilettante professionals and driving out middle-class families. Urban development scholar Joel Kotkin describes this as the ‘geography of post-familialism’.52 The resurgence of city-centre living has fuelled economic regeneration in places such as Manchester, but such development has been found to have little benefit to deprived urban areas and their residents.53 Those who live alone may be accommodated by smaller dwellings, but most actually live in homes with more than one bedroom.54 They are also less likely to be owner-occupiers than couples, but it is not clear that this is by choice; living alone is expensive.55
...cities are becoming ‘entertainment machines’, encouraging the development of super-small luxury apartments for unmoored dilettante professionals and driving out middle-class families.
All aged 16 and over living alone Single person households (all ages)
SOURCE: Adapted from data from the Office for National Statistics licensed under the Open Government Licence v.1.0
It is important to clarify, however, that only about half of those in ‘single-person households’ actually live alone. Statistical definitions such as this can be misleading and, to confuse matters further, are often adjusted between studies. Single-person households include unrelated adults who ‘live together but do not share one meal a day or share living accommodation’, so three friends sharing a flat might be counted as three separate households.56 The proportion of adults actually living alone is much lower at only 16%, though this is still double what it was in 1973.57 This proportion also decreased for all age groups except 45-65 year-olds between 2001 and 2010, with only 10% of 25-44 year-olds and 4% of 16-24 year-olds now living alone.58 While the trend towards solo-living has gained much publicity and may still be growing worldwide, the proportion of people living alone in England is currently forecast to stay constant until 2021.59 Furthermore, neither living alone nor single-household figures should
Number of households (millions)
All households
Couple and no other adult
One person
Couple and one or more other adult
Lone parent with or without other adult
Other
SOURCE: Department for Communities and Local Government Household Interim Projections 2011-2021, England
be held up as the proportion of adults who are single in terms of romantic partnership, as people increasingly are living separately from their partners for longer, and single people living with other adult family members are not counted as ‘single households’.60
The English and Welsh population, which is estimated at 57 million in 2014, is expected to reach 65.4 million by 2031.61 This will involve the number of households in England growing to 24.3 million by 2021, representing an addition of approximately 221,000 households per year. This expanding number of households reflects a continuation of the decrease in household size due to smaller families and single persons. However, this decrease has considerably slowed from earlier projections due to the rise of multi-adult and shared households.62
Life expectancy has increased dramatically over the past 80 years and is projected to keep increasing for subsequent generations.63 While young adults are living longer with their parents, the large cohort of baby boomers are also living longer lives, leading to forecasts that three-generation households may grow from 75,000 to 200,000 over the next 20 years.64 Such multi-person adult households—whether unrelated or combinations of adult children and parents—are a growing force not garnering as much attention from media or developers as solo-dwellers. Alongside the individualisation of home-based living trends, we also see new forms of collectivism in living arrangements and social support networks. The increase in single-person households should not be assumed to indicate an equal increase in demand for single-person houses.
While it is difficult to make firm predictions in the area of family formation, these trends have clear bearing on housing futures of the Millennial cohort in terms of dwelling size and number of rooms, flexibility for various and changing family structures, and the tenure tendencies of different household types.
SOURCE: Office for National Statistics Licensed under the Open Government Licence v.1.0
The great trend in the labour market seems to be the increasing disconnection of work from many of the traditional terms, hours, and spaces with which it has traditionally been associated. Recent figures show that alternative workforce segments are growing faster than commuting employees; the number of self-employed homeworkers has grown 24% between 1998 and 2014.65 While the recession has decreased full-time employment, particularly for young adults, part-time and self-employment have grown, as have homework and mobile working. The bigger picture seems to be one of an era and a generation working in an increasingly distributed, mobile, and fragmented way. On the positive side, this may yield greater autonomy and flexibility for those able to work this new world of labour to their advantage. But on the negative side, this more individualised approach to employment may be isolating and provide less security. In Beck & Beck-Gernsheim’s understanding, the opportunities and choices, but also the risks and burdens that were once in the domain of employers and family units have been shifted to the individual.
The bigger picture seems to be one of an era and a generation working in an increasingly distributed, mobile, and fragmented way.
...the opportunities and choices, but also the risks and burdens that were once in the domain of employers and family units have been shifted to the individual.
Substantial effort has been put into specifically researching the work habits of Millennials and the impact this cohort will have on the world of work as they become a larger and more influential portion of the labour force. Much of this research has focused on American samples but is relevant in the British context as well, particularly in light of speculation that the very forces of globalisation and telecommunication marking this generation have rendered Millennials around the world more similar to each other than their parents were. The upsurge of new technologies in British workplaces over the latter 2000s is striking; between 2004 and 2008 alone the number of workers using computers with Internet access went up by 27%.66

In another area where they are often accused of commitment resistance, research has found Millennials to be less interested in taking on positions of professional responsibility and to see work as less central to their lives than previous generations.67 However, many people now work more hours and are expected to take more work home because technology enables it, so the different attitudes noted in Millennials may in fact be a reaction to the greater spillover of work into personal lives.68 As part of this less work-centric mindset, Millennials are often reported to be fickle in their careers, quickly moving on to new opportunities if their high expectations for jobs and workplaces are not met.69 International research has found that 56% of Millennials, especially those in the UK and US, preferred flexible working arrangements.70 Arnett’s research links this trend to the greater focus on employment as an individual choice: ‘Today emerging adults wish to find a job that is an expression of their identity, not just a way to make money’.71
‘Today emerging adults wish to find a job that is an expression of their identity, not just a way to make money.’
Arnett developed his theory of emerging adulthood before the recession of 2008 led to major setbacks in employment and earnings for this generation. This course of events has surely further intensified trends such as living longer with parents and extending higher education. The recession beginning in 2008 has been the biggest blow to the UK economy since the Great Depression, and has taken a great toll on Britons’ ability to find suitable and stable employment. However, this impact is very unevenly felt across the population and is most strongly concentrated on the youngest potential workers. Though they make up only 19.5% of Britain’s population, 74% of the decline in employment has occurred among 16-24 year-olds.72 As of June 2014, 18.5% of 16-24 year-olds were unemployed.73 ‘Economic inactivity’ is also increasing for this age range, largely aligning with those in full-time education.74
Nearly half (47%) of employed recent graduates have found work in ‘non-graduate roles’ (positions not requiring higher education), while in 2001, only 37% were in such roles.
The prevalence of more 16 and 17 year-olds continuing their education is one component of this change, which had already been in progress since the 1990s; between 1992 and 2011, 50-64 yearolds had the greatest increase in employment and 16-17 year-olds had the largest decrease.75 Broadly, unemployment rates lessen with age and are highest for ethnic minorities, the less educated, and men. Although young adults with higher qualifications are less likely to be unemployed, the completion of higher than A-levels degrees does not go as far to guaranteeing graduates better jobs and earnings as it once did.76 Nearly half (47%) of employed recent graduates have found work in ‘non-graduate roles’ (positions not requiring higher education), while in 2001, only 37% were in such roles. Unemployment for non-graduates aged 21-30 is at 14%, but is also high for recent graduates at 9%, and both groups have only incrementally recovered from the sharp increases following the recession.77
These high rates of unemployment have major implications for earning potential in relation to Millennials’ housing careers not just today, but going forward as well. Youth unemployment has been found to have a ‘scarring’ effect, impacting earnings far after the period of unemployment.78 Those who experience unemployment at a young age may earn £1,800 to £3,300 less annually in their early 30s.79
SOURCE: Labour Force Survey Office for National Statistics
NOTE: The headline employment rate is the number of people aged 16 to 64 in employment divided by the population to 64. Data is seasonally adjusted.
Interestingly, unemployment is higher among men than women, although, delving deeper, it seems this may have more to do with the fact that women were already more likely to be in the more unstable and untraditional types of employment that are ascending now. Between 2008 and 2010, the reduction in men’s employment accounted for 84% of total employment loss, a share that has been characteristic, though slowly rising, through other periods of UK recession in the 1980s and 1990s.80 As Arnett and others have noted, the restructuring of Britain’s economy since the Thatcher era has particularly opened up new employment opportunities for young women, while bringing about new difficulties for working-class young men.81 Between 1998 and 2008 average income for women rose by 18%, while falling 6% for men.82
The particularities of the British welfare system and flexible labour market thus encourage a twoearner model through individual taxation, which leads to unstable employment patterns.
Women’s employment rate has risen steadily from 53% in 1971 to 66% in 2011, while men’s employment rate peaked at 92% in 1971.83 UK women’s labour market participation is high, but many women work part-time, which accounts for a large part of the gender wage gap. In joining the traditionally male work world, women were encouraged and enabled to focus on their lives as individuals for the first time in many ways, but often in tension with the competing demands of family formation. UK social support is comparatively low and private childcare is among the most expensive in the EU, placing a particular burden on mothers. The particularities of the British welfare system and flexible labour market thus encourage a two-earner model through individual taxation, which leads to unstable employment patterns.84
There are deep connections here with the trends around age at family formation. British women are more likely to have a child if their work prospects are less promising. Unemployed women are three times as likely to become mothers as those employed full-time, though part-time employment may
also be a choice in relation to work/family balance. This has changed somewhat over the past 15 years as the gap in employment rates between women with and without dependent children has narrowed considerably. The rising age of motherhood may help explain this, however, as more women having children later means that these older mothers are more likely to be employed.85
While overall employment decreased as a result of the 20082009 recession, this reduction was mainly in full-time work, while part-time work has increased.86 Between 2008 and 2012 the number of part-time workers unable to find full-time jobs went up from 9.7% to 17.8%.87 Self-employment has also grown considerably, increasing by 10.7% over this period even as the number of traditional employees fell.88 Combined with the rise of homeworking and social enterprise, the model of going to work for one employer in one office every day is on the decline.
Combined with the rise of homeworking and social enterprise, the model of going to work for one employer in one office every day is on the decline.
A key strategy in the design of traditional offices and management systems was the assignment of each worker to a ‘box’ in which materials, productivity, and output could easily be accounted for.89 The escalating spread of information and communication technologies has caused a ‘weakening of the spatial fixity of the workplace with workers increasingly detached from their personal cubes of space’.90 This shift is taking place both within traditional workplaces and outside them. Organisations are increasingly turning to open-plan layouts, hotelling, and hot-desking, solutions ranging from the dissolution of individual offices or cubicles to completely ‘non-territorial’ plans where workers have no dedicated desk of their own. This change is closely tied to homeworking, as the greater portion of time spent working at home or elsewhere is what allows companies to do away with the notion of one desk per person. This reduces real estate overhead costs and makes the structure of work more flexible in terms of both space and time.
As of 2010, 15.3% of workers spent at least one day a week working (or starting a day of non-office-based work) from their home.
Homeworkers are multiplying much faster than traditional commuting employees, increasing by 44% between 1998 and 2014 while the commuting population grew by less than 11%. Homeworking now accounts for 13.9% of the workforce, and has been growing robustly from a rate of 11.1% in 1998 when records began. However, only 5% work completely from their own property, while the other 8.9%

SOURCE: Annual Population Survey Office for
SOURCE: Office of National Statistics - Labour Force Survey
worked in a variety of places, using their home as the main base of operation. Although only 4.8% of employees are categorised as homeworkers today, their numbers have increased by 52.7% over the past 16 years, faster than self-employed homeworkers or any other comparable group.91 If we expand our
definition of homeworking to include those working part-time from home even if not based there, the growth of this trend is likely to be even greater. As of 2010, 15.3% of workers spent at least one day a week working (or starting a day of non-office-based work) from their home.92
There is also a strong connection between homeworking and self-employment. Today, 63% of homeworkers are self-employed, as compared with only 7% of those who don’t work at home.93 The Labour Force Survey has consistently reported around two thirds of homeworkers as self-employed since 2001, but this does not include people directing limited companies from home, meaning the actual proportion of self-employed homeworkers is even higher.94
In the face of dwindling job opportunities and earnings, young adults are increasingly encouraged to create jobs for themselves. Entrepreneurialism is individualising the labour market, but the social enterprise model is also a compelling example of new collectivism. Social enterprises—organisations that apply business models to maximize social and environmental well-being rather than shareholder profits—are now estimated to number 70,000 in the UK and employ approximately a million people. A third of these organisations have been operating for three years or less, which is three times the proportion of start-ups seen in the small and medium enterprises sector. Significant growth is forecast for this sphere, which has seen considerably higher rates of leadership from women and ethnic minority groups than in conventional businesses.95
...as many as two thirds of new homeworkers from 1997 to 2000 were in professional, technical, and managerial professions.
Both the self-employed and homeworkers tend to be highly skilled because they have high proportions of workers in professional occupations as well as skilled trades.96 The most common homeworking roles are farming, construction and sales accounts and business development managers, but growth may be more heavily skewed towards white-collar workers. It has been estimated that as many as two thirds of new homeworkers from 1997 to 2000 were in professional, technical, and managerial professions.97 Homeworkers are also more likely to be male than female.
While homeworking may seem to offer comfort and flexibility, bringing work into the home entails managing different workday interactions with family members, strangers, and colleagues, as well negotiating isolation and spatial reorientation. It also places more of the burden of office equipment (printers, ergonomic desk set-up), overhead costs (heating, Internet), and space use on workers and their families and homes rather than companies themselves. While individually allocated space per person has been shrinking in the office, it has simultaneously been growing in the home in a perfect illustration of individualisation. Considering the suitability of home environments for homeworking will be crucial going forward, as it is estimated that 20% of workers will engage in some sort of homework by 2025.98
...bringing work into the home entails managing different workday interactions with family members, strangers, and colleagues...
Mobile Working, Work Hubs, and Commuting
The transfer of work away from the traditional office does not necessarily mean it will shift to the home. The strong research and media focus on homeworking may have obscured a linked and sizable trend towards ‘mobile working’. Some have predicted that over the next 20 years much more work will take place on the move for a substantial part

of the workforce.99 There has been particularly strong growth in the number of people using their home as a base for work: a 50.5% increase since 1998.100 And while homeworking allows people to live further from work and travel to the employer’s premises less often, it may also mean that their commutes are longer when they do so.
It is likely that commuting will continue to decrease in this way as homeworking grows. If more people take up working two days a week from home, we may see a shift towards more localised transport and lifestyle.
Though the long-term environmental repercussions of flexible working are uncertain, the evidence so far is promising. While there has been much debate about whether homeworking does decrease car use, the general consensus from international research is that even if commuting trips are replaced by other trips, these usually tend to be shorter. A recent international review of the effect of telecommuting found that it reduced environmental impact through all relevant transportation factors.101 In line with this, the dominant trend in commuting patterns since the mid-1990s has been towards longer, less frequent commutes, resulting in an overall decrease (8%) in miles spent on the road or train to get to work. Business trips have also declined by a quarter since the mid-1990s in terms of both the number of trips and distance travelled.102 It is likely that commuting will continue to decrease in this way as homeworking grows. If more people take up working two days a week from home, we may see a shift towards more localised transport and lifestyles.
This localisation trend also has potential economic benefits. Because the UK already has comparatively high labour market participation rates, economic growth will depend upon increasing productivity, which currently lags behind the US, Germany, and France. The congested British transport network has been cited as a major drag on efficiency, threatening the future of economic development.103 Flexible working is particularly effective in reducing pressure on peak morning hour commutes, significantly alleviating this economic and environmental bottleneck.
The growth of workhubs or co-working spaces—workspaces run similarly to a gym or club, which are owned neither by employers nor workers—could further contribute to this more local and distributed pattern of daily life. A 2010 study of sixty five UK workhubs found that while the average distance from a workhub to the home of its members was similar to the average commute distance (nine miles), most members still worked from home enough of the time to significantly lessen their environmental impact. The wastefulness of the ‘edge city’ business park developments of recent decades is due to the long commutes and inaccessibility by public transport they often entail, but also because they are unoccupied so much of the time.104 Many workhubs, in contrast, double as event and conference spaces at night and weekends.
The Workhubs Network study identified strong potential for expanding workhubs in rural market towns and urban centres. Rates of homeworking are higher in rural areas (18.88% of workforce) than in urban areas (11.24%).
The Workhubs Network study identified strong potential for expanding workhubs in rural market towns and urban centres. Rates of homeworking are higher in rural areas (18.88% of workforce) than in urban areas (11.24%). Wealthy areas surrounding market towns have a high proportion of homebased businesses, often combined with poor quality broadband, and existing needs to travel into the town centre to access services such as the dentist or Post Office. With the impending roll-out of fibre-optic networking across the UK in the next few years, there is clear potential for greater development of a more distributed model of co-working business hubs in market towns across the country. Much of the recent growth in self-employment has also taken place in urban areas such as London, so there is a strong and growing market for more urban workhubs as well.105
Beyond the confines of the home itself, these flexible work trends are likely to impact the form and function of our cities and suburbs. As ‘workhomes’ proponent Frances Hollis has been keen to point out, the combination of these functions in the same structure may not be so novel. Workhomes were widespread from the ale- and bake-houses of medieval ages to the cottage industry productions of the proto-industrial era, and it has only been since the industrial revolution that living and working became increasingly spatially disparate.106 In Richard Sennett’s words, ‘segregation of function has become the planner’s yardstick of efficiency’, but homeworking is diversifying the function of residential areas, and is likely to require different local services in support of these activities.107
Nor is the decline of residential segregation limited to rural and suburban settings. Regionally, the South West and South East have the highest proportion of homeworkers, but London is the fastest growing, followed by the South East and North West.108 If fewer people commute into the city, and central offices become smaller, we may see a return of residential colonisation similar to what is now occurring in Manhattan’s financial district.
London has been notable among major world metropoles for its low residential density since the creation of the first underground and railway systems dispersed people to earlier incarnations of suburbs.109 But central areas including the City of London, Tower Hamlets, and Southwark now top the charts for highest projected residential growth in the UK.110 Recent GIS analysis comparing historic maps of British town centres with the most highly trafficked streets today has shown that converting closed shops to residential use would be not so much a radical turnover of planning regulations as a return of these spaces to the function they originally evolved to serve.111 Repopulating city and town centres has the potential to regenerate declining areas and can bring further environmental benefits from people living closer to where they work in another type of setting.
SOURCE: Adapted from data from the Office for National Statistics Licensed Under The Open Government Licence v2.0
Many theorists have seen the rise of home-ownership in England and Wales as one of the most momentous changes of the twentieth century. Whereas the majority of the British population were tenants at the start of the last century, home-ownership was bolstered in various ways to become the dominant tenure and continued to grow through 2004.112 This increase in home ownership, combined with the revision of traditional roles and working patterns, rise of investment schemes, and greater wealth accumulation over longer life-spans have greatly changed the make-up of wealth.113 The transforming nature of wealth is an important consideration in terms of what kind of housing the Millennial cohort may be able to afford, but also because housing assets are one of the main forms in which wealth is held, transferred, and linked to other forms of wealth. Over half of home owners have received an inheritance at some point in their life, whereas only one third of social and private renters have.114
The current cohort of 18-34 year-olds have entered the labour and housing markets at a difficult moment. Owner occupation increased greatly in the 1980s, continuing in the 1990s and early 2000s, but has stagnated since 2004. This trend was accompanied by rising house prices, increasing at a rate greatly out of proportion to earnings. Since 2007 house values have retreated, but this ‘correction’ has only taken prices down to their 2003-2004 level, which is still highly inflated. The lack of a fuller correction in the wake of the recession has been attributed to supply issues and continuing demographic change, which led to even higher demand and continued high home-owning aspiration.115 In 2011, fewer new homes were built in England than at any point since the 1920s.116 Despite this continuing inflation, the recession has also, of course, increased negative housing wealth.117 Between 2006 and 2010 net property wealth fell by 3.7%, but net total wealth has risen, primarily based on estimates of private pension wealth. Housing wealth is very unequally distributed, though less so than other forms such as financial or pension wealth.118 Inequality has levelled slightly since 2006, but is still extreme; as of 2010, the less wealthy half of British households held only 10% of all wealth, whereas the wealthier half held 90%.119
Owner occupation is still the dominant form of tenure at 65%, but has been steadily on the decline since its peak at 71% in 2003. As of the English Housing Survey’s 2012/13 release, there are
...there are now more people living in private rentals (18%) than in social housing (17%) for the first time in recent history.
now more people living in private rentals (18%) than in social housing (17%) for the first time in recent history.120 These shifts are much more dramatic for those under 35; between 1993 and 2010 owner occupation for 25-34 year-olds in England fell from 60% to 45% and for 16-24 year-olds it fell from 27% to 13%.121
SOURCE: Social Trends 41: Housing, English Housing Survey
Some might imagine that the fall of mortgaged buying and rise of private renting is a post-2008 phenomenon, but the current shift in tenure trends has been underway since the 1990s. Before 1990 we saw households purchasing homes at decreasing ages, but this trend has since reversed to one of aging first-time buyers. By 2004, a ‘permanent change in the route to owner occupation’ had already been observed.122
only 10%
This existing trend was amplified by the lender-imposed credit market constraints in the wake of 2008, which have been shown to have a significant effect on young adult tenure choices and delay the transition to home ownership.123 Today only 10% of all owner-occupiers are under 35.162 Much of the private rental sector growth is fuelled by would-be first-time buyers unable to afford a mortgage, or hoping to eventually do so.124 Half of all private renters are now under 35.125
What has puzzled many analysts is that this shift began in 1990s, when home ownership would seem to have become more affordable because mortgage interest rates and house price to average earnings ratio had both fallen.126 One key factor may have been the relatively slower growth in young people’s incomes. Young adults experienced slower earnings growth beginning around 1990, which, as their largest source of wealth, postponed their ability to make a down payment for a mortgaged purchase. The average price of a house is now almost nine times that of average earnings.127 Socio-demographic
...there is significant evidence for the overwhelming impact of young people’s incomes falling, and the fact that the age of private rental tenants is increasing indicates affordability as the primary driver of this change.
SOURCE: English Housing Survey, Headline Report 2012/13
changes such as the increase of single-person households and total population growth have also affected the market. And trends such as the increase in higher education and later marriage and childbirth may have also brought about a greater cultural shift towards a social norm of ‘settling down’ at a later age. But there is significant evidence for the overwhelming impact of young people’s incomes falling,128 and the fact that the age of private rental tenants is increasing indicates affordability as the primary driver of this change.129
A general ‘lifecycle effect’ in wealth distribution across age is to be expected: as age increases, a higher proportion of individuals are in higher wealth bands, until 65 when it starts to go down.130 But many believe that the lifecycle explanation only accounts for part of the wealth inequality we are seeing today.131 The proportion of under-35 year-olds in the least wealthy segments of society is far higher than in any age groups over 35. Labour market earnings are the main source of income and wealth for most young adults,171 and median real wages have decreased since 2009, now at levels similar to 2002.132
However, there have been some notable changes in wealth distribution across age groups between 2006 and 2010. While the percentage of under-35 year-olds in the lowest two wealth bands is still far higher than those over 35, this disparity was considerably much less extreme by 2010. For those in the lowest two wealth bands, the greatest decline between the two periods was for those under 35. Both 16-24 year olds and 25-35 year-olds also had greater growth than any age groups in the highest wealth band. Wealth is assessed by household rather than individual, though, and given that young adults are increasingly living longer in the parental home, it seems that this shift is most likely a reflection of this boomerang effect.
In confirmation of this suspicion, the incomes of young adults living in households headed by older adults grew by only 3% between 1998 and 2008.133 Wealth patterns are also strongly geographical, with the highest concentration of wealthy households tending to cluster in the South East and the lowest in
SOURCE: Office for National Statistics Wealth and Assets Survey licensed under the Open Government Licence v.1.0
the North East. But interestingly, wealth varies much less by region for those between 25 and 44 than it does for other age groups.134
Nigel Lawson’s prediction that the UK would be a ‘nation of inheritors’ has not yet come to pass, and looks as though it will be slow to come if it does. The large cohort of home-owners from the 1980s are living even longer than expected, delaying passing down wealth, and may use or disperse this equity during their lifetimes.135

So what do these wealth and tenure trends mean for the housing futures of young adults? Looking forward, the fall in young adult home ownership is likely to continue, particularly because of higher education finance reform. Future graduates are expected to accumulate £18,000 to £21,000 in student debt. Not only will the debtor status and net income loss from repaying loans be counted against graduates seeking mortgages, it is also likely that they may continue to see lower returns on their education investment in the form of lowered real earnings.136
As a result, there is likely to be much greater variation in age at first house purchase between different groups of future graduates because of projected increase in earnings disparity, parental assistance, and
home ownership affordability schemes. The proportion of first-time buyers under 30 getting substantial help from parents rose from 10% in 1995 to 46% in 2005. Today 55% of all parents and 70% of owneroccupier parents expect to help their children purchase a home.137
The Joseph Rowntree Foundation (JRF) has identified four primary housing ladder pathways for 18-30 year-olds aspiring to home-ownership in the post-recession era (percentages apply to England alone unless otherwise noted):
• 28% Homestayers: the majority who were able to achieve ownership did so by staying in the family home through much of their 20s and early 30s to save for a mortgage deposit.178 Growth is projected for this group.
• 18% ‘Dual Income No Kid Owners’: tend to take up shared PRS accommodation before finding a partner and buying together. Within 10 years, 40% own their own homes, while 30% are still in the PRS. This segment is considerably smaller in London and the South East (13%) and especially in Wales (9%), but is projected to stay stable overall.
• 13% ‘Young Professional Renters’: most of whom had higher than A-level qualifications, take the private rental path and stay on it for many years. Only 15% are owners within a decade. This group exemplifies the Twenteenies phenomenon, living in shared households or on their own by choice. This group is the second largest overall as many segments involve the PRS, especially in London and the South East (16%), although is much smaller in Wales. Significant growth is projected.
• 17% Late Family Bloomers: tend to form two-parent families by age 30, spending some time in the parental home or PRS as singles or couples, but with the majority attaining ownership within ten years. Decline is projected.
• An additional 8% tend to start families and buy homes at an early age, while the remaining 16% were social renters, including lone parents and families.138
SOURCE: Clapham et al. 2012
Long-term growth is forecast for 20-34 year-olds living and renting in major cities.
Young people’s attitudes to home-ownership have become more negative since the housing market recession. But home-owning aspiration is still high; 84% of adults still hope to be homeowners within ten years.139 Looking forward to 2020, the ladder to home ownership is projected to grow longer. Whether lingering in the family home or taking the step toward private rental first, young people are expected to have to wait till later in their 30s before stepping up to ownership.140
Long-term growth is forecast for 20-34 year-olds living and renting in major cities.141 In London private renting is projected to become the dominant tenure for families within ten years.142 The number of 18-30 year-olds living in private rental properties of their own is expected to increase by 1.3 million to reach 3.7 million in 2020, while those owning their own properties will decrease by 1.1 million, dipping to a low of 1.3 million.143 While there has been a great deal of focus on the private rental sector as an alternative for young adults aspiring to home ownership, it is also important to remember that this sector is extremely diverse and captures many segments who might previously have been served by the social renting sector. In the 1990s lone parents and multi-family households accounted for greatest growth of private renters after single households.144 The proportion of young adults in the queue for social housing is projected to expand, as are ‘chaotic’ housing pathways involving homelessness.145 There has been strong growth of private renting amongst groups who tend to be highly mobile, such as students, singles, and migrants (though projections on the continuing growth of these groups are mixed).
Government policy has continued to subsidise the ideal of home-ownership through schemes such as right-to-buy and shared ownership, with the Labour administration having aimed for 75% of Britons to become homeowners, according to a report from DCLG.146 Extending ownership to the less wealthy would be key to such further expansion of owner occupation. The Joseph Rowntree Foundation has warned, however, that in addition to now seeming highly improbable, ownership comes with risks, especially for the less wealthy. It is possible that continuing this policy may further widen the inequality gap.14


The Housing Ladder and ‘Commitment Resistance’
How then might the lower wealth and homeownership prospects of this generation relate back to trends in family formation? As we know, married couples are more likely to be homeowners than either cohabiting couples or single people, but might the decline of home ownership further play into the decline and postponement of traditional family formation? While marriage and home ownership are correlated, this is a typical chicken-and-egg question where causality is very difficult to establish confidently.
Research on the impact of splitting up and divorce on housing careers has found that both the commitment made to a partner and investment in housing situation is less for cohabiting couples than married ones. Both types of dissolutions are likely to lead people
to move out of single-family homes and owner-occupation, and also to move house more frequently. But these differences are smaller between current and former cohabiters than between married couples and divorcees, as cohabiters are already more peripatetic. This is partly because cohabiters tend to be younger, as do their partnerships. The majority of cohabiting relationships do eventually progress to marriage.148
Shifting wealth and tenure trends may play a large role in this cohort’s seeming resistance to commit to their own housing, giving many no option but to live longer with their parents.
This research, however, is conducted under the assumption of traditional progression up the ‘housing ladder’, where major life-course events such as marriage and children often coincide (and are socially expected to coincide) with ‘upward’ moves towards home-ownership and single-family dwellings. Given the economic climate and housing market faced by young adults today, it seems possible that marriage and childbirth might be pushed further back if the housing ladder stages expected to coincide with them are a few years further away—especially if women feel the need to focus more heavily on their careers for longer in order to afford more expensive housing. But for many, these traditional steps will not be within reach at all, so we may see different norms emerging around the housing goals associated with these life stages.
We might see joint home-ownership functioning as a sort of legal contract similar to marriage in that it encourages people to commit to relationships and mortgages and the stable careers needed to afford them; essentially the major trappings of ‘adulthood’. Shifting wealth and tenure trends may play a large role in this cohort’s seeming resistance to commit to their own housing, giving many no option but to live longer with their parents. But it is also important to note that the increasing ages for marriage and childbirth have been steadily on their current upward trajectories since the 1970s, whereas these wealth and tenure shifts are much more recent. While the lack of tie from owning property may contribute to a more peripatetic lifestyle, it seems improbable that this is a cause of the overall delay in family formation, to the extent that we can define either the chicken or the egg in this story.

Transport, socialising, and consumption patterns may seem to be decoupling from the local and physical, but it is also becoming clear that economic and online activity are still geographically clustered in significant ways. Between 2006 and 2010 alone, the proportion of UK households with Internet access rose from 57% to 73%.149 Clear shifts are emerging in the nature of social and leisure activities within and outside of the home, under the influence of new technologies. People are commuting longer distances less frequently, travelling less to shop and visit friends at home, and are less civically engaged. At the same time they are travelling more for leisure and holidays, and are able to socialise easily and spontaneously outside of the home due to smartphones and social media. Combined with the economic shift towards the sale of services rather than goods, the rise of social enterprise, and growing popularity of public transport, technological change is facilitating new forms of collective and local activity along with dispersion.
Despite what the media might have us believe, international research consistently suggests that the Internet has not made people either more isolated or connected, but has changed the way these connections are organised.150 That being said, Internet users tend to have more social connections and activity than non-users, who tend to be older and of lower socio-economic status.151 Millennials are sometimes referred to as ‘digital natives’, having grown up roughly at the same time as the Internet and the many related digital devices now filling our lives (information and communication technologies or ICTs).152 There has been much speculation about the impact of technology on young adults’ behaviour and cognitive processes, and neuroscientists such as Gary Small have charted differences in digital natives’ neural circuitry. Small found that Millennials to be stronger at multitasking, filtering information, and reacting to visual stimuli, but weaker in face-to-face communication and understanding nonverbal cues.153
SOURCE: Joseph Rountree Foundation. Dutton, 2010
While all of today’s 18-34 year-olds have grown up as digital natives to some extent, the experience of a 15-year-old with occasional dial-up access via the family computer, and that of one with their own smartphone are worlds apart. The wide-ranging experiences of this cohort are often lumped together, and should be distinguished. Over two thirds of the population now use more than one device to access the Internet and this tendency is much stronger with the younger half of the Millennial cohort. In fact, 16-24 year-olds are twice as likely as 25-34 year-olds to access the mobile web on a daily basis. This reflects the younger segment’s high rates of smartphone ownership, greater tech-savviness, and general tendency to rely on online means of social interaction.154
16-24 year-olds are twice as likely as 25-34 year-olds to access the mobile web on a daily basis. This reflects the younger segment’s high rates of smartphone ownership, greater tech-savviness, and general tendency to rely on online means of social interaction.
Recent research on young people in the UK and US, however, found that mobile communication was used to facilitate spontaneous, on-the-go meet-ups rather than replacing face-to-face social interaction.
ICTs have allowed people both to spread out and form new types of connections in a pattern that social networks expert Barry Wellman calls ‘networked individualism’.155 Britons increasingly use email to communicate with friends and family living far away (growing from 16% of the population in 2005 to 70% in 2009. They are also meeting new people through online connections more often; in 2009, 38% of Internet users had met someone online, while only 20% had in 2005.156 In line with this we often hear that technology has diminished the importance of physical localities and distances, but alienates people from those physically closest to them. Recent research on young people in the UK and US, however, found that mobile communication was used to facilitate spontaneous, on-the-go meet-ups rather than replacing face-to-face social interaction.157
As the Internet evolves, becoming more interactive and more portable, it is thus connecting and reorganising on the local level as well as the global. Recently, the upsurge in use of email to communicate with contacts nearby has been even more dramatic than that with distant contacts, rising from 14% in 2005 to 88% in 2009. Websites and services are also becoming more localised, designed for ‘hyperlocal networks’, and often employing user-generated content.158 As of 2010, 38% of Internet users were uploading self-created content.159 And partly because of the local and impromptu connections these technologies enable, we may be seeing more social interaction in the public realm.
In North America, for instance, research indicates that people in urban public spaces are now more likely to be found in groups than they were in 1979. A recent study suggests there are now simply more people in urban public spaces, and a much greater proportion of them are women, a change that may also be linked to the rise of city living and women’s role in the labour market.160 At the intersection of individualisation and new collectivism, there is a clear pattern of individual collectivism in social interaction and this may have a particularly significant impact on how people behave in cities.
Longitudinal research has shown that the Millennial generation ranks civic engagement as less important to them than their parents and members of Generation X did at the same age.161 In 2010, only 34% of UK adults engaged in some sort of ‘civic participation’, falling from 38% in 2001.162 Arnett, however, proposes that greater exposure to people of different backgrounds through developments such as cheap international travel, foreign gap years, online interaction, and growing up in more ethnically diverse communities has led Millennials to hold a more globally empathic orientation.
In 2010, only 34% of UK adults engaged in some sort of ‘civic participation’, falling from 38% in 2001.
Notable studies showing Millennials to have less ‘community feeling’ or civic orientation than previous generations have also acknowledged that these results may be skewed by outdated metrics for these values. Jean Twenge and her colleagues—whose work Time’s recent ‘Me Me Me Generation’ cover story drew heavily upon—concede that measures used to compare Millennials’ civic engagement to Baby Boomers’ may resonate more with Boomers as the questions were originally written in their era. And while Millennials have placed greater value on goals such as ‘being very well off financially’, it may be unreasonable to assume this indicates a greater self-centred orientation as this generation realistically has far greater student debt and housing costs to contend with than their parents had.163
While British ‘social participation’ has fallen over the past decade by measures such as volunteering and ‘civic participation’, these activity categories may similarly fail to capture the forms of collectivism and communal action most relevant to this moment and generation.164 The rise of social enterprise is
a crucial expression of new collectivism accounting for major communal investments, which is lost in statistics on volunteering and charity donations. Currently, 38% of social enterprise organisations work in the top 20% most deprived communities in the UK. Social enterprises also tend to work in and employ people from their local communities, and are particularly concentrated in service sector industries such as education (16%), employment and skills (14%), and housing (13%).165
Similar to leading patterns in technology and social interaction, regional transport trends show that people have dispersed, but economic activity remains concentrated around physical localities.
The tremendous expansion of private car ownership over the course of the twentieth century has been a major force of individualisation. In 1951, only around 20% of households owned a car, whereas now fewer than 20% are car-less.166 The dominant trend in travel patterns since the 1970s is that Britons now travel 53% greater average distance each year. Travel distances surged throughout the 1970s and 1980s, primarily because average trips, such as daily commutes, became longer. The number of trips people make per year also grew from the 1970s to the mid-1990s, but has since fallen to rates similar to the 1970s.167
From 1995-97 to 2011, the number of trips made by any mode steadily decreased by a total of 12%. However, at the same time, the average trip length rose by 11%, meaning that total annual distance travelled per person was lowered by only 2%.
Since the 1990s, the major change has been towards making fewer but longer trips. The 1990s marked a major turning point in transport trends, as total distance travelled and the average length of each trip have both plateaued since the latter part of the decade. As we will see in Part 2, this rise and fall correspond to the growth of space-hungry lifestyles through the 1990s, and the resurgence of urban
SOURCE: Department for Transport Statistics National Travel Survey
SOURCE:
flat-dwelling since then. From 1995-97 to 2011, the number of trips made by any mode steadily decreased by a total of 12%. However, at the same time, the average trip length rose by 11%, meaning that total annual distance travelled per person was lowered by only 2%. 168 This more dispersed pattern of travel may reflect more flexible commuting patterns, as well as home-based living trends.
The reach of functional metropolitan regions is thus extending, a phenomenon that Richard Florida and others such as Shadid Yusuf of the World Bank have identified as ‘mega-regions’. 169 Florida and his colleagues describe mega-regions as ‘integrated sets of cities and their surrounding suburban hinterlands across which labour and capital can be reallocated at very low cost’. 170 They see mega-regions as the defining economic and organisational units of our time, serving functions similar to that of great cities in ancient times, or of nations more recently. Using satellite images of night-time light emissions, combined with other economic, population, and intellectual output indicators, Florida and colleagues identify 40 continuous mega-regions with economic output over $100 billion, which collectively account for 66% of global output.
The English mega-region, which stretches from London up through Leeds, Liverpool, Manchester, and Birmingham, houses over 50 million people and accounts for $1.2 trillion in economic production. 171 Other studies have confirmed that English and Welsh commuter flows are primarily organized around a corridor connecting these cities, which grew significantly wider between 1991 and 2001. The whole of South East England made considerable progress towards operating as a functionally integrated urban region with an enlarged catchment area during the 1990s, a progression likely to continue. Commuter fields around cities outside the corridor such as Bristol, Newcastle, and Cardiff have also been expanding, to the point that they have merged to create a single mega-region covering almost all of England except the outer reaches of Cornwall and the North. As Nielsen and Hovgesen describe, the English mega-region is beginning to resemble an ‘extended urban field organised around the national interaction corridor much more than individual urban centres (with the exception of London)’. 172 In other words, the feasibility of daily commute to the nearest city is losing influence over people’s choice of where to live in England, replaced by the importance of more sporadic access to major hubs of specialist industries, particularly London.
England’s densely populated, highly networked, and uni-nodal nature mean that extending these new and alternative models of commuting and residential choice is uniquely feasible here.
The irony of mega-regions, as Florida has expressed, is that as technology has facilitated the dispersion of economic and intellectual production, these activities still tend to be geographically clustered. But what is particularly interesting about the English mega-region is that it appears to be nearly the only one identified by Florida that is roughly contiguous with national borders. This is inherently related to being an island, but England is still somewhat unique. Territories such as Japan and the state of California contain multiple distinct mega-regions, while many mega-regions span multiple nations, and most countries contain vast areas of lesser economic activity. England’s densely populated, highly networked, and uni-nodal nature mean that extending these new and alternative models of commuting and residential choice is uniquely feasible here.
Transport trends also give keen insight into developments in social interaction and leisure, particularly those that are relevant to the built environment. People are generally travelling less, except for leisure purposes, and driving is still very much the main mode. However, public transport has started to trend up.
SOURCE: Department for Transport National Travel Survey 2011
Today the private car is still the main mode of transport. In 2011 64% of trips were made by car, accounting for 79% of distance travelled, but car travel is also declining in line with the overall reduction in travel. The overall decline in trips was mainly due to a 13% decline in trips by private modes, while public transport trips increased slightly. Most of this decline is due to decreases in journeys for shopping, visiting friends, and commuting. Trips to visit friends declined 22% from 1995-97 to 2011, primarily falling in visits to friends’ homes as opposed to meeting in other places. This aligns with the shifts towards online social interaction and commerce, trends likely to continue, which will have implications for the geography of successful housing for Millennials.173
A notable change is that the decline of private car use has been particularly strong among 18-34 yearolds. Generally, adults’ car use has tended to increase as they age from 17 into their 40s, and decline slowly after the age of 50. Following their parents, we would expect Millennials to use cars progressively more as they grow towards middle age. But looking more closely, we see that car use among the current cohort of 18-34 year-olds is lower than it was among their counterparts in the mid-1990s by a number of measures. For all the age groups between 17 and 40, car use has declined since the mid-1990s, both in number of trips and in total annual distance travelled. For example, car journeys made up 81% of the total distance 20-29 year-olds travelled in 1995-97, but have now dropped to only 67%.174 This stands in opposition to the general trend, where distance changed very little while trips declined.
Furthermore, fewer people in the younger age bands are taking the step of getting a driver’s licence, or are putting it off until later. Overall, the percentage of both men and women holding driver’s licences has gone up significantly since the 1970s, but much of this increase was accounted for by older age groups. The proportion of 17-29 year-olds with licences has dropped since it was at its highest in the 1990s, significantly below even 1970s levels for men in this age band.175 Even for 30-39 year-olds, licence holding has declined slightly in the past ten years, reflecting a shift away from car-dependent lifestyles or towards city-living for the Millennial generation, at least at this point in their lives. The less dramatic expression of these shifts in the 30-39 year-old band suggests that Millennials will still drive more as they get older, but that car use may remain a smaller portion of their transport activity than it was for their parents and Generation X siblings. Driving has similarly decreased by these diverse metrics in other industrialised countries including Norway, France, the US, and Japan, but Germany and the UK present the two most extreme examples. Interestingly, young men have cut back on driving more strongly than women across all these countries.176

New collectivism is also visible in the rise of public or shared forms of transport. Bike-share systems and carsharing or car clubs are two new modes of collective transport provision for downloadable lifestyles. In London, TFL’s Barclays Cycle Hire scheme aims to increase cycling by 400% by 2026.177 The system is expanding to southwest London and has facilitated over 26 million journeys since it was introduced to London in 2010.178 Car clubs are also a relatively new model for the UK, but have swiftly expanded over the past five years in terms of membership and network coverage. With 137,000 members, London is the largest car club market in Europe, while membership across other urban and rural areas in England and Wales is estimated at 20,400.179 Combined with peer-to-peer ridesharing apps for intra- and inter-city travel, it is increasingly easy to make many types of journeys without a privately owned vehicle.
More traditional forms of public transport including buses, surface rail, and underground, now account for 3% more of all trips made than it did in the mid-1990s.180 Rail travel grew by 60% between 1995/97 and 2005 as a result of more people taking up train travel. Notably, this uptake is evenly spread across Great Britain regionally, but differs by gender. Men of all age groups are travelling more by rail, while
SOURCE: Vision Critical. Owyang, Samuel and Grenville, 2014
for women the uptake has been particularly strong for under-30s.181 In London specifically, bus and surface rail have grown tremendously, increasing 40% and 47% respectively over this time period. But the flourishing of bus use in particular seems mainly a London phenomenon; trips elsewhere declined by 15%, although the total distance people are travelling by bus has not changed much.182 However, low bus use outside the capital may also be related to the bus service cuts and fare hikes during this period. Overall, research indicates that Millennials are demonstrating a dramatic shift away from car use, reflecting a genuine generational social change.183
Leisure and spending trends display a similar pattern of dispersion and individualisation, with social activity moving out of the home and economic activity moving in. It is interesting that while travel for shopping and visiting friends declined over the past two decades, trips for leisure activities have burgeoned. Transport journeys made for leisure including sport, entertainment, holidays, and day trips went up 10% between 1995-97 and 2011. Leisure was the only trip category to increase over these years, though it still accounts for only 16% of journeys.184 Younger people specifically tend to spend more of their leisure time than older groups with family and friends, using the Internet, going to the cinema or pub, and exercising.185

Younger people specifically tend to spend more of their leisure time than older groups with family and friends, using the Internet, going to the cinema or pub and exercising.
While everyday travel is stagnating in many industrialised economies, long-distance travel is expanding, and these trends are especially pronounced in the UK. Between 1996 and 2005, the average yearly number of car trips longer than 100km taken by 16-
29 year-olds dropped from 13.9 to 10.5, and it is believed that much of this decrease has been replaced by the rising popularity of international air travel among young people.186 Single adults overall are estimated to have spent £11 billion on holidays in 2012, with foreign holidays accounting for nearly two thirds of spending.187 It appears however, that leisure spending priorities differ greatly between the 18-24 and 25-34 year-old segments of our age cohort, as foreign travel has fallen for 16-25 year-olds since 2008.188 For 15-24 year-olds, clothing is the number one spending priority and is more important than eating out or holidays.189
Combined with heightened investment in home security, these shifts paint a picture of the dwelling as a control centre from which diverse activities may be managed in a trend towards home-based living.
Internet shopping is also more common in the UK than anywhere else in the EU. Between 2006 and 2009 the percentage of adults ordering goods and services through the Internet rose from 45% to 66%, with clothes and sportsgoods being the most common purchase.190 Britons made 19% fewer shopping trips per year in 2011 than they did in 1995-97, aligning with this increase in ordering goods for delivery. This trend seems to hold true for under-25s’ clothing shopping, as 39% of under-25s, especially girls, buy clothes online.191 When they do still shop in person, people are generally shifting from more frequent, shorter trips on foot to longer, less frequent car trips (from an average of 3.9 to 4.4 miles). Walking has fallen by 13% since the mid-1990s in terms of the number of trips made.192 Combined with heightened investment in home security, these shifts paint a picture of the dwelling as a control centre from which diverse activities may be managed in a trend towards home-based living.
We are also witnessing a major shift towards ‘selling services rather than goods’, also known as the sharing or collaborative economy, as Rachael Unsworth and others have noted.193 Systems and applications like bike share and Bla Bla Car are all part of the sharing economy, which is projected to potentially double within the next year alone.194
...a considerably higher proportion of the UK population engages in the sharing economy than in the US and Canada; 52% as compared to 39% and 41%, respectively.
Vision Critical’s recent research on the sharing economy found that a considerably higher proportion of the UK population engages in the sharing economy than in the US and Canada; 52% as compared to 39% and 41%, respectively. This is largely because of the greater proportion of Britons ‘re-sharing’: 29% buy and/or sell second-hand goods through sites like eBay and Gumtree, compared to only 16% of Canadians and Americans. ‘Neo-sharing’—the use of newer sharing services like Airbnb, Kickstarter, and ZipCar—is far more consistent at 23-25% across all three nations.
Those engaging in the sharing economy are demographically average by most measures, but do tend to be more urban and more affluent. Although the economic digital divide means many of these technological trends are less applicable to the less wealthy, Millennials’ higher rates of ICT use implies this disparity will decline. Almost half (48%) of neo-sharers are 18-34, meaning significant long-term growth is expected for this model. 23% of sharers reported the desire to ‘connect locally’ as a reason for using peer-to-peer sites, though motives such as convenience (75%), better price (61%), and quality (36%) ranked as more important.195
As we have seen, these trends in social interaction and technology tend to have different impact in cities than they do in suburban and rural areas. Sharing economy activity is stronger in urban areas, partly because the incentives and practicality of sharing services like vehicles and office space are greater at higher densities. Broadband penetration rates vary greatly, and are interestingly higher in smaller cities than in larger ones.196 However, the shift from some offline to online commercial activities like banking appears to be stronger in rural regions. Exchange of second-hand goods also tends to be higher outside

urban areas, and this may be related to the greater proportion of adults over 34 in these places.197
People retreating into homes and computer screens may have negative well-being implications, especially in rural and suburban areas. Sedentary lifestyles have alarming health consequences, and in 2008-09 more than half of Britons were classed as overweight.198 At the other extreme, very high-density living may be deleterious to social interaction. Higher density housing is associated with weaker attachment to place, and city centres tend to have lower levels of social interaction and social networks, although these measures of healthy social life also tend to be strong in lower-density city districts.199 Overall, fewer people felt a sense of connection to their neighbourhood in 2011/12 than 2009/10, falling from 66% to 62.9%.200
But as we have also seen, new developments in transport, social enterprise, and commuting and working patterns indicate that the Millennial generation is forging new forms of collectivism that are difficult to measure against older metrics. Millennial tendencies are changing the demographics of British urban and rural areas, and the landscape of how these trends play out across our cities and suburbs.
The interplay of these social trends in family, work, wealth, and social interaction with our use and transformation of the built environment is already evident. But we will now turn to examine the major built environment trends in England and Wales and the implications of these social changes for the future of our homes, cities, and countryside. The macro-trends of individualisation, flexible lifestyles, and new collectivism, which we have traced through societal change, are also reflected in the major developments of the built environment. As Tim Putnam has written:
When a new mode of living is mapped onto a house or a new house mapped onto an existing mode of living...the meaning of domestic space is redefined...Changes in the material order of the home...reflect and indeed define cultural changes.201

As with social change, the increasingly individualistic orientation of modern Western culture and the inherently collective nature of managing the communal resource of space are in tension. The expression of individualistic and communal values through tenure trends and planning policies in the UK is an interesting one. Commentators ranging from Ralph Waldo Emerson to Jeremy Paxman have observed ‘privacy’ to be a characteristically English concept keenly expressed in the British preference for free-standing houses; a comparable word does not exist in French or Italian.202 Americans may be famed for an individualistic obsession with owning their own homes, but British 25-34 year-olds are more likely to
be homeowners—45% compared to 39.7% in the US—and were more likely to be before the recession as well.203
On the other hand, British house sizes are smaller than most of their counterparts in other Anglophone countries, and restrictions such as limited space, greenbelts, and other planning controls make it more difficult to build a new home catered to one’s individual preferences than in much of Europe, North America, and Australia. Furthermore, according to Tony Chapman and Jenny Hockney, the housing stock here is essentially less diverse than in many comparable countries, meaning that the ‘range of “models” of the ideal home is relatively limited in Britain’.204
British house sizes are smaller than most of their counterparts in other Anglophone countries, and restrictions such as limited space, greenbelts, and other planning controls make it more difficult to build a new home catered to one’s individual preferences than in much of Europe, North America, and Australia.
The World Wildlife Fund have even gone so far as to suggest that planning policy such as the 1947 Town and Country Planning Act, which nationalized development rights and values, has influenced the British public through ‘policy feedback’ to hold a more communal understanding of land use rights and values than is common in similar economies such as the US.205
If the expansion of owner occupation and suburban dispersal placed greater value on individualisation in British culture, then will the rise of the private rental sector and return of city living reverse this shift? We will trace the macro-trends of individualisation, flexible lifestyles, and new collectivism through socio-spatial change on three different scales: dwelling, settlement, and life cycle.
Across these scales of analysis, it is important to be mindful of margins of impact. A great deal of policy, design, and press attention is given to new housing, but with housing stock expanding at an annual rate of only 0.8%, this sector exerts marginal influence over some averages.206 It has been estimated that as many as 75% of dwellings that will be in use in 2050 already exist today.207 This is not to say that the direction and potential impact of new housing are not important, but that the overarching trends may often be almost opposite to the tide of change. Finally, we will assess potential challenges and opportunities for the Millennial generation that should be considered in planning and designing the future of our built environment.
As society has become more oriented towards the individual, our dwellings have become more space-hungry, more hi-tech, and more defensive. These changes are part of a greater breakdown and reorganisation of public versus private and formal versus informal zones in the home.208
As incomes increased throughout the twentieth century, appetite for domestic space has grown as well.209 In choosing to have smaller families, people have bought themselves more space per person at home; households tend to go in for the maximum living space they can afford.210 Between 1991 and 2001 the average amount of residential space per person increased from 38m2 to 44m2 211 The expansion of spatial appetite with incomes has followed similar patterns in North America, but not in the EU, and was further intensified by the rise of private car ownership in the post-war era.212
Extensions are an increasingly popular means of expanding home space; 43% of UK dwellings have had at least one major alteration in their lifetime.213 These alterations involved increasing living space 29% of the time overall and in 45% of pre-1945 dwellings.214 Sometimes these additions represent the cheapest way to get more space, and for others it is more expensive than moving but allows continuity of neighbourhood and schools.215
Social norms have shifted towards an expectation for more private domestic space on an individual
level— apart from other family members—as well as for the household as a whole. Notably, the 1991 edition of Social Trends was the first to use the statistic of ‘rooms to a person’ rather than ‘persons to a room’.216 We see this in the trend towards ‘cellular structures’ designed to fit in ever more, smaller bedrooms and bathrooms.217 New developments are now often built with a bathroom for each bedroom and older housing is increasingly remodelled to this standard.218 Between 2001 and 2011 the proportion of homes with two WCs increased from 35% to 41%, and the proportion with a second bath or shower went up from 15% to 22%.219 The social necessity for children and parents or family and guests to have the privacy of separate bathing facilities is commonly cited as a reason for adding new bathrooms.220
The overall impact has been an increase in under-occupation, largely because rates in the owneroccupied sector rose from 44% to 49% between 2002 and 2012. However, general shift towards more space per person plays out differently for 18-34 year-olds; less than 20% of households headed by a person under 35 were under-occupied, while more than 50% of over-55 year-olds’ households were under-occupied.221
Proliferating technologies are also colonising our homes, and this is a key driver of the demand for more domestic space. The installation of tumble driers alone, for instance, has taken over approximately 3.6 million m2 of home space in the past thirty years.222 The defensive and hi-tech trends in the home, also described as the ‘electronic home’ or ‘dwelling as technology centre’, play into the function of the dwelling as a self-contained and increasingly impermeable world of its own.223
Domestic technological change has been propelled by a variety of industries, electronic and energysaving technologies being the two most recent entries. Electronics goods and infrastructure were first prompted by entertainment (particularly children’s computer games) and security, as a sharp rise in burglaries in the 1980s grew the market for intruder alarms.224 The hi-tech home, supports home-based living, as home printers, Digiboxes, and microwave ovens draw activities
The installation of tumble driers alone, for instance, has taken over approximately 3.6 million square metres of home space in the past thirty years.
such as office-work, watching new-release movies, and ‘eating out’ into the private realm. Homeworking in particular brings with it a new set of demands and related technologies, which the relatively small size of UK homes may make difficult to accommodate. Important considerations include the number and placement of electric outlets, natural light and ventilation, heating, and ergonomic workstation set up.225

With tablets, laptop computers, and digital media (displacing CD storage), many technologies are also now becoming slimmer and more portable. Becoming un-embedded from specific rooms, technology may follow the same trend towards flexibility and mobility observed on the macro scale, with distinct room functions blurring and merging as activities are carried along with devices. But the sheer volume that these technologies
occupy in our dwellings cannot be understated. The need to accommodate various appliances has even been found to affect the demography of entire neighbourhoods. Installing washing machines and additional bathrooms leaves terraced homes with ‘only enough’ room for two people, changing formerly family neighbourhoods to temporary communities for young couples and singles who plan to move on to bigger places.226
Installing washing machines and additional bathrooms leaves terraced homes with ‘only enough’ room for two people, changing formerly family neighbourhoods to temporary communities for young couples...
Alternately, technologies such as video walls, smart-meters, and fob security systems are building certain functions into the very fabric of our dwellings. The expansion of security and surveillance technology has had a particularly strong influence in reshaping the form of our dwellings and landscapes in the trend towards defensive homes. Private property has become much more dominant in Britain over the past thirty years, both because of the emphasis placed on home ownership, and the expansion of ‘mass private property’ in the form of shopping malls, airports, and conference centres. One result of this privatisation has been an increase in private security, which tends to prioritise the protection of property itself. Security infrastructure requirements have been formalized in Secured by Design, a set of standards like Health and Safety, which must be met for planning permission for schools and many other public buildings. The broader concept of Crime Prevention through Environmental Design has since been expanded to private housing and public space as well. Developers may become locked into building to similar standards through the ‘FIRE’ economy (Finance, Insurance, and Real Estate), in which the security, insurance, and building industries are tied together by obtaining lower insurance premiums on high security developments.227 As Jon Coaffee observed in his foundational work on London’s ‘ring of steel’ surveillance cordon, ‘insurance mechanisms increasingly attempt to distribute risk and contribute to the prevalence of fortified risk-adverse landscapes’.228
...‘insurance mechanisms increasingly attempt to distribute risk and contribute to the prevalence of fortified risk-adverse landscapes’.
The success of these design standards in averting actual crime is uncertain and research suggest that the often inflexible, closed off, and monotonous quality of high-security environments mirrors and is conducive to defensive, selfish, and extremist behaviour.229 One Glasgow-based study found that while people believed CCTV surveillance would increase safety, both crime and fear of crime went up after its introduction.230 In requiring surveillance technology and multiple key fob security checkpoints, the defensive home plays into the hi-tech home’s amassing and integration of ever more technologies.
The increasing fortification and impermeability of dwellings thus contributes towards the image of the modern home as a private refuge.
The leading movement in domestic design over the past half-century has been the open-plan ideal of flexibility. Hand and Shove describe how the evolution of the home can be likened to ‘a forest: both being battlegrounds in which some “ecological” arrangements survive and flourish and in which others become extinct’.231 While bedrooms and bathrooms have been multiplying, the disparate common spaces of the house seem to have been slowly merging into one amorphous space.
The rising popularity of open-plan layouts has been one of the most important changes in British domestic interiors in the post-war era, mirroring in miniature, the utopian ideals of urban planning in this period. The shift towards the open-plan living space was meant to embody the anti-hierarchical virtues of accessibility and flexibility, breaking down the barrier between the seldom-used ‘parlour’ and the more utilitarian living room. Reserved for entertaining guests, the parlour or ‘front room’ became associated with outdated social hierarchies, which mid-twentieth-century design reformers sought to transform, particularly in social housing.232

Copyright © ADAM Architecture
The open-plan movement also expresses what some have called informalisation, involving ‘a subtle transition from status to function, in which the ancient dichotomies of front : back, formal : informal, public : private, leisure : work, and clean : dirty were at least partially dissolved’.233 As previously formal reception areas such as the parlour have disappeared, formerly ‘backstage’ areas such as the kitchen have also been promoted to take on some elements of this role.234 Kitchens are major areas of capital investment, with kitchen furniture sales in Britain already reaching a billion pounds per year in the 1990s.235 The proportion of homes with kitchens less than five years old rose from 29% to 35% between 2001 and 2011.236
The most recent development in this pattern is the decline of the dining room and growing importance of the open-plan kitchen as the central living space and ‘heart of the home’.237 It is estimated that 67% of dwellings built since 2003 have open-plan living/dining areas, and for fully occupied households this figure may be as high as 87%.238 Elizabeth Hand and Martin Shove have charted the transformation of the ideal kitchen from backstage ‘engineering’ facility in the 1920s, to a coherent and manageable ‘mega-machine’ in the 1950s, to a site of ‘living, leisure, and self-expression’ in the 2000s.239 Kitchens are increasingly becoming more multi-functional, seen as important to providing space for family and friends to eat, socialize, and relax. They are now often portrayed as a place for people, while machines are hidden behind uniform countertop/shelving products or banished to utility room and garage extensions. Meanwhile, dining rooms are increasingly absorbed into the larger open-plan or left out all together in new developments.240
While open-plan dwellings reflect the macro-trend of flexibility in terms of breaking down traditional social hierarchies and the rooms that helped structure them, they also reflect individualisation. The evolution of the kitchen is closely linked to women’s advancement in the traditionally male labour market. But the decline of the dining room and parlour have also been linked to the declining importance of extended family networks, as individualizing forces have shifted emphasis to acquired networks such as those gained through work, advanced education, and interest groups. Formal entertainment space has largely been subordinated to the leisure and labour activities of the occupants, some of which may be communal, but many of which, such as work, studying, or hobbies, are individual.241 And while some technological activities such as Skype calls and TV-watching may be framed as collective, many exert an individualizing influence as well. Family members may be physically co-present in the same open living space while engaging in remote realms of computer games and social media updates, separated by headphones and iPads in another instance of individual collectivism.
Family members may be physically co-present in the same open living space while engaging in remote realms of computer games and social media updates, separated by headphones and iPads in another instance of individual collectivism.
Contrary to these aspirations for more space in the home, the size of new dwellings has decreased since the 1980s. The average new home is now only 76m2, whereas the average dwellings is 85m2.242 Kotkin sees the recent extremes of this trend in cities such as New York, where Mayor Bloomberg endorsed ‘micro-units’ as small as 24m2, as developers ‘hoping to accommodate the post-familial demographic... obviously intended to house single professionals’.243 While the resurgence of city population is a feature of new collectivism, the shrinking size of new housing seems distinctly individualistic. In settlements, as in dwellings, society is recongregating in a new pattern of individual collectivism.
Contrary to these aspirations for more space in the home, the size of new dwellings has decreased since the 1980s. The average new home is now only 76m2.
The forces of the Industrial Revolution and imperialism combined to make the English the first primarily urban-dwelling culture in the known history of settlements. But despite or perhaps because of this, the idea of nature and the countryside has historically played a particularly important role in English culture. As cultural critic Raymond Williams has observed,
English attitudes to the country, and to ideas of rural life, persisted with extraordinary power, so that even after the society was predominately urban its literature, for a generation, was still predominately rural; and even in the twentieth century, in an urban and industrial land, forms of the older ideas and experiences remarkably persist.244
By the 1900s, approximately 75% of the English population were living in cities and towns. This early process of urbanisation also led to an early suburbanisation, continuing throughout the post-war era and particularly in the 1980s and 1990s.245 By one definition 80% of the English population now lives in suburbs, but the official Rural – Urban Classification statistics define 82.4% as living in urban areas.246 This confusion in classification complicates meaningful policy intervention, but may also reflect a confusion of identification, related, possibly, to the unusual combination of early urbanisation, small territory, and high density, with strong pastoral aspirations. This analysis defines suburbs in terms of the virtually exclusive residential nature of the dormitory suburb, while ‘cities’ will generally refer to England and Wales’ 59 largest cities, towns, and urban conurbations.247
In post-war Britain, urban population densities declined significantly. This has been attributed partly to migration resulting from job losses in industrial and port cities, but primarily to the desire for more domestic space.248 This led to the overall expansion of developed areas, as well the evolution of poly-centric and discontinuous regions, presenting a far more complex geography of population density. This trend slowed in the 1980s, and then reversed in the capital in the 1990s, with London’s population density rising significantly (8%) between 1991 and 2001. City centres began to see particular resurgence and increase in population. Between 1991 and 2001, the central areas of Bristol, Cardiff, Swansea, and Birmingham grew by 66%, 60%, 13%, and 8% respectively.249 Strong population growth has continued since 2001 in major cities like Manchester (21.6%), London (14.9%), and Cardiff (13.4%), and smaller cities like Peterborough (19.7%) and Swindon (18.8%), in contrast to overall UK population growth of 8.45%.250

The UK has very high population density relative to other high-income countries, both nationally and within its urban areas. England is the third densest country in the EU and Wales is the eighth.251 Population density tells us the number of people over a total area, but it may reveal very little about how densely dwellings are distributed in the built-up regions (dwelling density) and how much space per person these dwellings provide in square metres and number of rooms. The UK is densely populated in all these measures except the dwelling density of the centre of major cities such as London, in comparison to counterparts like Paris and Berlin.252
British green-belt policy has played a particular role in densifying urban municipal-bounded areas, while also making their broader commuting catchment areas less compact. More recently, ‘compact city’ policies have further encouraged denser development on existing urban brownfield sites and discouraged greenfield development, especially surrounding cities. In reaction to the sprawling, cardependent trends of the post-war era, these policies have aimed to lessen energy use by zoning for denser urban forms. Although the short-term impact of such policies is less certain, we know that denser development tends to relate to transport patterns in two ways: (1) people make more, but shorter trips, ultimately travelling fewer miles, and (2) by making more energy-efficient modes of public transportation more viable.253 Additionally, higher density was hoped to bring about benefits such as urban resurgence, social sustainability, and greater productivity.254
Housing demand increased considerably during this time (through population growth and shrinking household size) and the supply of available land was limited, which drove up both housing and land prices.255 Together, these trends have led developers to focus much more on building smaller, higherdensity housing. From 2001 to 2009, there was a substantial decline in the proportion of detached houses built in England, and a substantial rise in the proportion of flats developed, resulting in an the oversupply of flats. Evans and Unsworth have shown that the dramatic amplification of those existing tendencies at this point was linked to the compact-city policies put into place soon after the Rogers report, Towards an Urban Renaissance, was published in 1999. Particularly telling is that these development shifts took place all over England, even in low-density areas such as the North East, but were not observed in Scotland, where compact-city policies were not pursued.256
These forces have resulted in less living space in new homes, particularly in the rental sector: 66% of social renters and 54% of private renters now have less than 70m2 of usable space.257 Households have decreased in size, but their appetite for domestic space does not appear to have decreased accordingly. Useable space per person in the home has continued to grow (meaning that this growth is occurring in existing houses as it is shrinking in new builds) and is also higher than in countries such as Ireland and the Netherlands where useable floor space in new homes is greater.258 The majority of research has shown that people tend to prefer lower-density housing, and most homebuyers think new housing is too dense.259
The majority of research has shown that people tend to prefer lower-density housing, and most home-buyers think new housing is too dense.
Around half of new-build residents in London and the South East have been found to be unhappy with the amount of space they have.260 Particular issues include privacy and inadequate space for socializing, storage, and external recreation. Nearly half (48%) of fully occupied new-build households say they don’t have enough space to entertain guests at all.261 Rooms expected to serve double-duty as a bedroom and office are too small for this to be practical. And while the open-plan living space promised flexibility, it further impinges on residents’ privacy when applied on such a small scale.
Nearly half (48%) of fully occupied new-build households say they don’t have enough space to entertain guests at all.
A recent survey of residents of new high-density flats in Leeds found that 86% of renters and even 30% of owner-occupiers planned on moving out of the city centre within two years. Motivating factors included ‘inadequate living space’ (89%), lack of green space (83%), and preferring houses over flats (80%).262 Similarly, a 2011 RIBA study of attitudes to new housing found that the most important factors people consider in moving are outside space (49%), room size (42%), and proximity to local services (42%).263 Families particularly tend to prefer houses over flats, as well as larger property and
SOURCE: Adapted from data from the Office for National
safe outdoor space.264 Households with children are the most likely to be overcrowded though, at 10% for single parents with dependent children and ‘other multi-person households’ and 6% for couples with dependent children.265
The trends in new housing thus seem to oddly oppose the trends we have seen in use and retrofitting of existing housing stock. However, dense urban living is also by no means a new phenomenon in England. What we might call ‘naturally occurring’ instances of compact city form do not seem to suffer from many of the issues that have plagued our attempts to re-engineer it. Many moderately dense city areas are in great demand and, as covered earlier, have high levels of social interaction and well-being. It is important to disentangle actual density from factors such as housing costs, dwelling and neighbourhood design quality, and tenure type, which impact on residential satisfaction and well-being.266 Happiness is significantly associated with housing costs, and correlations have also been found between housing tenure and general life satisfaction.267 81% of outright home owners rated their satisfaction with life medium to high, whereas only 67.8 % of renters were this satisfied, though confounding factors may be at play here as well.268

Still holding onto a bit of country in the city, Britain has an unusually high proportion of dwellings with private gardens.269 84% of dwellings have some type of private outdoor plot and 15% have a shared plot, meaning that only 1% include no outdoor space.270 Many have questioned why continental Europeans of comparable income levels seem more content with life-long urban living and less access to green space, but this need may be fulfilled in other ways. In France and Germany, for instance, many citydwellers have traditionally maintained family contacts in rural areas where they spend a portion of the year.271
As the price of land has risen, however, gardens have shrunk along with dwellings, either in the form of smaller gardens accompanying the houses built today, or as a result of home extensions that take over part of the open space.272 Dwellings at higher residential densities tend to have less access to public or green space, particularly private gardens.273 There is evidence that both adults and children have a psychological need for outdoor space within their ‘ownership’, but this can be fulfilled by a small balcony or a communal garden.274
New developments are increasingly including shared outdoor spaces, a rare example where we see the residential sector responding to the social trend towards new collectivism. This trend is still emerging, and a 2012 study of shared spaces in five UK cities found that poor maintenance and concerns around comfort and privacy led many to be underused.275 Many successful examples of communal outdoor spaces have been identified, however, particularly ‘those where the values of privacy and community were seen as complementary parts of a complete whole’, according to a 2003 study.276 It seems that the overarching issue with these common areas has been space management. Formal arrangements for the maintenance and management of shared open spaces are the key to their success.277
The coalition government have made a number of planning policy changes that may impact future development patterns. The minimum density requirement of 30dph, for instance, was removed, but the definition of ‘brownfield’ sites was also revised to exclude gardens, while still requiring that 60% of
new homes be built on such areas. The coalition have also done away with the housing targets set by their predecessors, but have established the New Homes Bonus, which may encourage local authorities to build more and larger dwellings. Overall, Evans and Unsworth predict that this will not result in any great increase in the total number of homes constructed, but that the proportion of detached houses will slowly increase as the proportion of flats falls.278 The proportion of houses completed in England recovered dramatically from a low of 50% in 2008/09 to 67% in 2012/2013, and may now be plateauing or slightly growing.279 Nevertheless, many have projected that new urban dwellings will continue to be small and high-density despite indications to the unsuitability of such housing for our longer-term demographic needs.280
Finally, these socio-spatial transformations at the dwelling and settlement levels mean that patterns of mobility and geography over the life-course are changing as well. Understanding this life cycle geography is important to predicting where the Millennial generation will live and when they will make key moves.
The life-course approach focuses on events such as leaving home, union formation, and childbearing as mobility triggers.281 In the UK, the South East acts as an ‘escalator region’, attracting upwardly mobile young people who often move away later in the life cycle after promotion to better status and pay.282 So, much like, and intimately related to, the trends we saw in transport patterns over the life-course, previous generations have tended to be more urban-dwelling in their emerging adulthood years, and move on to more suburban settings as they age into their 30s and 40s.
...while there has been a long-term pattern of young adults living in cities, this has significantly increased over the past two decades.
The question now is if the Millennial cohort will follow this pattern, or if the combination of wealth and housing constraints with the other cultural shifts we have observed may lead this generation on a different path. The recent growth of city-centre populations has been disproportionately driven by young adults, especially the university-educated and students themselves. Estimates are that by 2001 as much as 41% of Manchester’s and 39% of Liverpool’s city-centre populations were in the 20-29 age bracket alone.283 So while there has been a long-term pattern of young adults living in cities, this has significantly increased over the past two decades.
Looking back to the four primary post-recession housing ladder pathways identified in Chapter III, approximately, 56% of 18-30 year-olds took routes that involved the private rental sector on the way to owner occupation, or extended PRS tenure. The greater share of young adults in this cohort living in the private rental sector means that this generation is likely to have greater residential mobility. Between 1998 and 2008, the proportion of 18-34 year-olds living in rentals grew from 36% to 45%, and the proportion of young households living in flats rose from 27% to 36%.284 Private rental tenants have lower moving costs, and are more likely to move, often using rentals as stepping-stones to other tenures while acclimating to a new area.285 In 2012, 32% of private rental tenants had moved within the past year alone, in great contrast to owner-occupiers and social renters, 61% of whom had been in their homes for at least ten years.286 The shift towards higher-density, urban, private-rental units is therefore particularly important to the housing futures of the Millennial generation.
SOURCE: Institute for Mobility Research, 2013
BASE:
SOURCE: English Housing Survey, full household sample
SOURCE: Institute for Mobility Research, 2013
The dominant assumption is that this segment of Millennials will aspire to climb up the traditional housing ladder over the next twenty years. As Evans and Unsworth sum up:
Once these young city-centre residents have outgrown the brief experience of city-living, they will be competing for the still-constrained supply of suburban or small-town property with which they are familiar from their own childhood. High density does not, by itself, a European city make.287
In 2006 it was estimated that the proportion of 30-34 yearold couples able to afford home ownership would decline from 50% to 35% by 2026 if housing supply did not increase.
Just because survey results say people want to live in semidetached houses, however, does not mean that this can or will come to pass. In 2012, 59% of private renters of all ages said they expected to buy property at some point, but 45% of those expecting to buy thought it would be at least five years before they were able to.288 Given the undersupply of housing, extending babyboomer lifespans, and economic obstacles facing the Millennial generation, a significant portion are unlikely to ever be able to obtain the type of housing they desire, or at least not until later into their 40s and 50s.289 In 2006 it was estimated that the proportion of 30-34 year-old couples able to afford home ownership would decline from 50% to 35% by 2026 if housing supply did not increase.290 Evans and Unsworth predict two potential trajectories for the current cohort of urban, flat-dwelling young adults:
A: With higher incomes over the next few years, this group will be able to move into the detached homes they aspire to, which will mean too many small flats are currently being built for anticipated demand, and their prices will fall.
B: If baby-boomers and the elderly continue to occupy desirable housing stock, Millennials will have little option but to remain in such flats, which will keep prices high. A generation starting families in cramped, ill-suited quarters may have negative well-being implications similar to 1960s council tower blocks.291

While we are already seeing the oversupply of small flats, the market evidence for scenario ‘A’ does not seem to be very strong. Even in the face of swiftly escalating house prices over the period of 1995-96 to 2006-07, both density and over-crowding declined in the owner-occupied sector. Owner-occupiers, many of whom are in the older age bands, rarely move from houses to flats.292 In the South East, for instance, the number of over-65s living in rural areas grew 61% faster than in cities and towns during the 2000s.293 Population is projected to grow disproportionately in the South East, South West, and West Midlands, meaning those areas that are already highly populated are likely to come under the most pressure.294
As the National Housing Federation (NHF) has shown, 30-somethings are already disappearing from the countryside and villages in the most sought-after regions. In the South East, for instance the number of 30-44 year-olds has dropped almost 8% in rural areas, eight times greater than in urban areas. The number of children under 10 has grown 6% in South Eastern urban areas, while falling in the countryside. Similar shifts took place in the South West, East and West Midlands, and East of England. While NHF describe these figures as ‘moving out of the countryside’, the story they may really tell is
that young adults are not moving into the countryside. Average rural house prices in the East have risen 82% in these ten years, while rural pay rates rose 25% more slowly than in Eastern urban areas over the past five years.295
The prospects for Millennials moving to desirable countryside and suburban areas do not look good unless supply and affordability are improved. New policies such as shared ownership and Help-To-Buy may make mortgages more affordable and accessible for some. But many have argued that Help-ToBuy in particular will only exacerbate the existing predicament, as measures spurring housing demand without expanding supply will further escalate prices.296
In assuming that Millennials will follow in their parents’ footsteps if the supply and demand equation allows, many projections may fail to account for the interplay of technological and social changes we have covered. Research from the US, however, indicates that Millennials’ housing ladders will look significantly different. A recent Urban Land Institute study predicts that demand for compact, walkable development will continue to rise, while demand for more remote suburban housing will fall. Sixty percent of Millennials expressed a preference for mixed housing options in proximity to public transport, shopping, workplaces, and 75% said they value walkability in their residential decisions.297 The driving force consistently emphasized in the ULI report and related op-eds such as ‘Letter from a Millennial: We’re not going to buy your house’, is that housing aspirations are shifting away from the dormitory suburban, car-dependent model.
...housing aspirations are shifting away from the dormitory suburban, car-dependent model.
Comparable attitudinal research on British Millennials’ does not seem to be available. But as discussed, young adults in Britain have decreased their driving behaviour in similar ways to those in the US and other high-income economies over the past three decades. Britain and Germany have see the most drastic change by far, according to data compiled by the Institute for Mobility Research (IFMO).
Does the fact that British Millennials are driving less indicate that their transportation preferences, and hence housing preferences, have shifted similarly as well? While smaller incomes largely explained the driving decline in Germany, the IFMO found that young adults’ ‘changing preference regarding car ownership’ was the key factor in Great Britain.298 Changes to location and dwelling type appear to be more important than economic situation in explaining young Britons’ transport behaviour. But even flat and city dwellers, who were already less likely to drive, reduced their driving and car ownership further between 1998 and 2008. A separate analysis examining the increase in train travel as well as the decline in car travel confirms that these trends seem to reflect real changes in personal behaviour rather than demographic or geographic shifts.299
As increasing numbers of Millennials delay traditional family formation or put it off indefinitely, a greater proportion may not aspire to the suburban, car-based lifestyle associated with this life stage...
The relationship between changing attitudes, transportation behaviour, urban form, and market constraints on choice is notoriously difficult to unravel. But the strength and international consistency of these changes indicate that a genuine generational shift in mobility attitudes and behaviours has taken place. As increasing numbers of Millennials delay traditional family formation or put it off indefinitely, a greater proportion may not aspire to the suburban, car-based lifestyle associated with this life stage either. Single-person households are less likely to own cars, as are those sharing flats with people other than partners or family members.300 Of the 2.2 million additional households projected for England for 2021, an entire 67% will be couples without any dependent children.301
Many British Millennials will still certainly aspire to more indoor space and better access to outdoor
space as they age. But the life stage associated with ‘having children and moving to the suburbs’ may look different for many in this generation than it did for their parents. The IFMO concludes that while family formation often brings greater car use, multi-modal Millennials are likely to retain this general tendency as they grow older, and this will impact where they will live. As a greater portion of Millennials are likely to continue living in flats, they will continue to be less likely to drive.
The confusion around urban and suburban classification seems to pose an extreme of city-centre living against an assumed suburban alternative, overlooking intermediary settings such as smaller cities, city neighbourhoods, and town centres. The goal of ‘home-ownership’ has been associated with the ideal of a suburban family house, but it is important to disentangle these definitions, as it looks likely that they may be increasingly less synonymous for Millennials. Rather than moving from London to the South Eastern countryside, the step on the housing ladder for having children may look more like moving to a city neighbourhood in Bristol, Brighton, or Nottingham, or even to a town centre. As Sir Peter Hall has written, ‘We often forget that all our best urban places were once suburbs’.302
Both socially and spatially, people have dispersed, individualised, and are now drawing back together in new types of nodes and networks. This shift towards individual collectivism is evident in the resurgence of cities. Individual collectivism is a reaction to the individualised lifestyles of the latter twentieth century, and the economic and environmental realities of the twenty-first century. So while driving is in decline and solo-living has stagnated (hence the oversupply of small flats), public transport and co-working spaces are burgeoning. This shift may be the distinctive imprint of the Millennial generation, just as the move towards suburban houses and cars was for their parents.
...driving is in decline and sololiving has stagnated (hence the oversupply of small flats), public transport and co-working spaces are burgeoning.
Major cities are drawing in more people, especially the young, and this is transforming their work and social lives. Population has grown in almost all UK cities since 2001, topped by Manchester, Milton Keynes, and Peterborough.303 As the official designation is somewhat arbitrary, ‘city’ is defined here in terms of the 59 largest cities, towns, and functional conurbations in England and Wales.304 18-21 year-olds are pouring in by year, and major growth is projected for 20-34 year-olds living and renting in large cities. Millennials are far more likely to live in cities and flats and far less likely to own and travel by car than recent generations were at the same age.
Millennials are far more likely to live in cities and flats and far less likely to own and travel by car than recent generations were at the same age.
Economic, tenure, and social trends suggest that city-living isn’t a blip for this generation. More Millennials are likely to live in cities for longer spans of their lives, because more are deferring or declining family formation, and because many young families won’t be able to afford to buy in first-tier suburbs and countryside areas. This demographic shift towards more young adults and young families will require different services and functions from cities.
Millennial lifestyles seem increasingly downloadable. Renting, moving frequently, plugging into different workspaces and opportunities, and meeting up on the go, mean that young adults’ work and personal lives are ever more detached from distinct long-term spaces. Finding flatmates through sites like Gumtree, work opportunities through Twitter, or dates through mobile apps like Tinder, means that digital technology is the driving force enabling this generation to live in a way that is at
once collective and individual. One of the Joseph Rountree Foundation’s most compelling findings about the segment they call ‘Young Professional Renters’ is that they see shared housing as a life choice rather than an unfortunate economic necessity.305
One of the Joseph Rountree Foundation’s most compelling findings about the segment they call ‘Young Professional Renters’ is that they see shared housing as a life choice rather than an unfortunate economic necessity.
These downloadable lifestyles also require uploading cities, a trend we’re seeing in the flexible, collective spaces and systems of the workspace and public realms, ranging from bikeshare and hotdesking to the explosion of public festivals and markets. A higher proportion of young city-dwellers postponing family formation while they focus on careers and saving for mortgages may require an interactive and flexible public sphere along the lines of phone booth WIFI hotspots, later-running public transport, and spaces to recharge physically and electronically. Shrinking offices and growing populations also mean that city centres are becoming more residential, requiring amenities for the nights and weekends as well as lunchtimes. The highest residential growth in the UK is now projected for the City of London, followed by other central boroughs such as Tower Hamlets and Southwark.
The growth of living alone has been greatly exaggerated. Only half of ‘single-person households’ are actual solo-dwellers and the slowing decline of household size also tells us that people are sticking together.
The residential sector has already individualised in the form of small cellular flats, high security infrastructure, and home-based living amenities, but has been less responsive to the collectivist component of this trend. The growth of living alone has been greatly exaggerated. Only half of ‘single-person households’ are actual solo-dwellers and the slowing decline of household size also tells us that people are sticking together. ‘Other households’, which include students and other groups of adults sharing accommodation, are projected to grow 20% between 2011 and 2021, and we are likely to see a growing demand for housing to accommodate this sector.306
As dwellings have shrunk and become spaces of individual leisure and labour rather than socialisation, developments that offer well-managed communal facilities are likely to be sought after. With no room in flats to start a social enterprise, throw a dinner party, or store a surfboard, cities will need to absorb and accommodate these functions in other ways. Integrated live/work developments, workhubs, and entities like community centre gardens might foster better shared space by building community, management systems, and vested interest. Extending the success and popularity of the sharing economy model will be an innovative area of growth to fulfil Millennials’ unmet needs for green space, social space, and storage space.
It is also clear that the private rental sector will increasingly be the only tenure available to many young families, particularly in London. All of the housing pathways involving young family formation identified by the JRF (11% total in London and the South East) are projected to rely more heavily on the PRS. The growing group of career-oriented mothers in their early and later 30s are also likely to be more PRS-dependent as ownership slips further into the future. Longer-term private rental tenure for families is expected to produce a new set of needs from these dwellings and their neighbourhoods, such as outdoor play space, greater storage capacity, and a layout that is suitable to family life.
The impact that these trends have in London and other large cities is also likely to differ from that in smaller cities. Housing need is usually discussed at the national level, but housing markets are more deeply defined by the local context of supply and demand. Thriving cities like Manchester, Oxford, and Nottingham and are predicted to see continuing strong demand for more housing. However, with both suburbs and major cities becoming more expensive, second- and third-tier
...second- and third-tier cities may become increasingly appealing places to live. Growing population in such cities may call for the upgrading of existing housing stock, improving public transport, and investing in broader quality of place.
cities may become increasingly appealing places to live. Growing population in such cities may call for the upgrading of existing housing stock, improving public transport, and investing in broader quality of place.307
Commuting patterns tell two stories; commutes are reaching increasing extremes, either from Lincolnshire down to London, or simply from the bedroom to the kitchen table. In line with overall transportation trends, commuting has shifted to be longer and less frequent as teleworking and homeworking have grown over the past two decades. Between 1995-97 and 2011, the total number of commuting trips decreased 16%, but the average length of each trip went up by 9%.308 People are commuting longer distances, but are also working from home or other places more often. The feasibility of daily commute to the nearest city is losing influence over residential choice, replaced by sporadic access to major hubs, particularly London. The reach of functional metropolitan regions is expanding and overlapping to operate more like one single mega-region.
Between 1995-97 and 2011, the total number of commuting trips decreased 16%, but the average length of each trip went up by 9%. People are commuting longer distances, but are also working from home or other places more often.
England’s small size, high density, and highly developed transport network, now combined with flexible employment trends, mean that many workers might live almost anywhere in the country while maintaining frequent contact with a main office, clients, or colleagues. The ‘re-working’ of residential geography – employing a combination of mega and micro commutes – is viable here in a way that it isn’t in China or the United States.
Mega/micro commuting bodes well for sustainability, economic development, and even work/life balance. Decentralisation initially leads to longer commute distances, but people and employment rebalance as they spread out, leading to shorter journeys.309 When enough people move further out to support local services, transport patterns tend to localise. The upsurge in flexible working is the key factor expected to drive this transformation further. The homeworking workforce has increased by 44% since 1998, while traditional commuting employees grew by less than 11%.310 And the growth of flexible working arrangements of all types is likely to escalate, as Millennials become a larger and more influential part of the work force. The growth of the knowledge economy, part-time work, and various individualised employment structures are building a labour market that is increasingly flexible and untied from regular daily commuting. The knock-on effect of mega/micro commuting has been an 8% overall decrease in miles travelled to work since the 1990s.311 Fewer miles on the road will be beneficial to local economies, and also to the national economy as the congested transport network has been identified as a threat to the future of British economic development.312
The combined rise of flexible employment trends, a resurgence in inner-city living, and change in transport behaviour reveal a shifting landscape, one where dwellings and workspaces are more closely interspersed...
The blurring of living and working spaces we have seen so far forecasts an evident decline of the entire dormitory suburban model. Dormitory suburbs have been defined by their virtually exclusive residential use-type, a category including the largely residential areas of small towns. Many Millennials will still aspire to the ideal of the suburban house and mega/micro commuting may make this possible by opening up more affordable housing options further from centres of lucrative employment. These demographic and cultural shifts mean that dormitory suburbs are becoming less exclusively residential.
The combined rise of flexible employment trends, a resurgence in inner-city living, and change in transport behaviour reveal a shifting landscape, one where dwellings and workspaces are more closely
41% of all UK businesses are now run from home, and 55% in rural areas.
interspersed in cities, town centres, and suburban and rural settings. The functional and geographical separation of the dwelling from industry began during the industrial revolution, but the extreme of the post-war dormitory suburb may turn out to be a twentieth century anomaly.313 As dedicated space per person in offices is shrinking, space per person in the dwelling has grown, reflecting, in part, the movement of work activity into the home. 41% of all UK businesses are now run from home, and 55% in rural areas.314 Whether this means literally working from home, a workhub, or more bespoke live/work units, these developments are all part of the shift that many see as a re-working of the preindustrial proximity of living and working spaces.
Although mega commuting has sometimes been blamed for sprawl and ‘placelessness’, micro commuting may be a great tool for place-making and revitalisation. Live/work researchers such as Tim Dwelly have found a strong UK market for clusters of dual-use units, which can afford homeworkers a greater degree of professionalism, contribute to local economic development, and mitigate the isolating potential of individualised employment. Specialised live/work communities can function like residentially integrated workhubs, though this may involve some policy updates to be feasible in terms of mortgages, taxation, and planning controls.315
Although mega commuting has sometimes been blamed for sprawl and ‘placelessness’, micro commuting may be a great tool for place-making and revitalisation.
Changing living and working patterns clearly show that the notion of residential developments as places where people go just to sleep is on the decline. We are likely to see people spending more time where they live, which will lead to a need for different types of local services. The prospect of homebased working is a particular motivation for aspiring female entrepreneurs (70%, as compared to 56% of men), and for those over 35 because of the importance of family life for these groups.316 Additional around-the-clock activity may require and support services such as cafés, crèches, and shared facilities for printing and other office equipment. Strong public transport from both conventional service providers and the sharing economy sector, will be crucial to meet the needs of a generation with lower rates of car travel and ownership.
Homeworking is forecast to be particularly important to economic development in rural areas, where it already represents 18.88% of the workforce. The rural market is largely for highly tailored units for the self-employed and small businesses, rather than home-working employees.317 However, employed homeworkers will be important to consider going forward. This sector grew by 52.8% between 1998 and 2014, faster than any other part of the workforce. In market towns there is a strong market for live/work districts; combinations of mixed-use units and workhubs. Finally, live/work development may be especially important to consider for new settlements, and the government have already called for such provision in EcoTowns and specific sites such as Thames Gateway.318 Workspace and residential facilities can bring a new function to regenerate hollowed-out high streets across the board as shopping moves online.
live/work development may be especially important to consider for new settlements, and the government have already called for such provision
Overall, it seems we’re seeing two potentially divergent trends: mega/micro commuting may allow Millennials to pursue the great ideal of countryside living by dwelling farther from cities, or their city orientation may prevail as they start families, or don’t. The dual-earner model and women’s increasingly important role in the labour market may play into both of these patterns. The dormitory suburb was based on the twentieth century model of a single-earner going to work in the city while mothers stayed home with children. Many Millennial mothers (especially for the older segment likely to
maintain existing careers) may prefer to stay in cities, with easier access to employment. Alternatively, homeworking in a new, more mixed-use type of suburb may be seen as an ideal work/life balance for part-time working mothers.
While these two visions might seem to be at odds, what they share is an end of the twentieth century dormitory suburban model of family and work life, housing, and social interaction. It remains to be seen whether Millennials will follow in their parents’ footsteps regarding housing aspirations and driving behaviour as they age, or whether their differing preferences will persist. But the economic and environmental forces facing this generation are so altered that forging a new and varied set of housing ladders seems certain. The future will likely see a combination of Millennials climbing both the ladders we have forecast.
Perhaps the more crucial question than whether Millennials will favour suburbs or cities is whether this dichotomy will continue to define our lives and landscapes in the same way. Transportation and social interaction patterns have both shown that as new technologies enable people to disperse, they are also regenerating and reorganising connections and economies on the local level. Millennials will inevitably leave their own imprint on the British landscape, but if the built environment is responsive to these changing social patterns, that impact may have great economic and environmental benefits for broader society. As Joel Ravetz writes, ‘such changes in uses and users can reach a “tipping point” where radical building forms or adaptations are realised in design solutions’. The change in uses and users of dwellings and settlements in England and Wales is well underway, and forward-thinking designs and adaptations are needed for the built environment to respond.
The change in uses and users of dwellings and settlements in England and Wales is well underway, and forward-thinking designs and adaptations are needed for the built environment to respond.
1 Harvey, David. 2008. ‘The Right to the City’. New Left Review 53 (Sept Oct): 23-40.
2 Ravetz, Joel. 2008. ‘State of the Stock—What Do We Know About Existing Buildings and Their Future Prospects?’ Energy Policy 36 (2008): 4465.
3 Beck, Ulrich, & Elisabeth Beck-Gernsheim. 2001. Individualization: Institutionalized Individualism and its Social and Political Consequences. London: Sage.
4 Beck & Beck-Gernsheim, 2001: 55.
5 Drayton, Bill, & Valeria Budinich. 2010. ‘A New Alliance for Global Change’. Harvard Business Review 88 (9): 56.
6 ONS. 2011a. 2010-Based National Population Projections, 26 October 2011 Release. Office for National Statistics.
7 Whitehead, Christine, Peter Williams, Connie Tang, & Chihiro Udagawa. 2012. Housing in Transition: Understanding the Dynamics of Tenure Change, A Report for the Resolution Foundation and Shelter. Cambridge: Cambridge Centre for Housing and Planning Research.
8 Andrew, Mark. 2004. ‘A Permanent Change in the Route to Owner Occupation?’ Scottish Journal of Political Economy 51: 24–48.
9 Houston, Donald, & Paul Sissons. 2012. ‘The Changing Geography of Privately Rented Housing in England and Wales’. Urban Studies 49 (4): 795-819.
10 Stein, Joel. 2013. ‘Millennials: The Me Me Me Generation’. Time, 9 May.
11 Deal, Jennifer J., David G. Altman, & Steven G. Rogelberg. 2010. ‘Millennials at Work: What We Know and What We Need to Do (If Anything)’. Journal of Business Psychology 25: 191-199.
12 Hearshatter, Andrea, & Molly Epstein. 2010. ‘Millennials and the World of Work: An Organization and Management Perspective’. Journal of Business Psychology 25: 212.
13 Arnettt, Jeffrey Jensen. 2006. ‘Emerging Adulthood in Europe: A Response to Brynner, The Author is currently a Fulbright Scholar at the University of Copenhagen’. Journal of Youth Studies 9 (1): 111-123. Kotkin, Joel. 2012. The Rise of Post-Familialsim: Humanity’s Future? Edited by Zina Klapper. Singapore: Civil Service College.
14 ONS. 2011b. Households and Families, Social Trends 41. Edited by Jen Beaumont. Office for National Statistics.
15 ONS. 2013a. Birth Summary Tables, England and Wales, 2012, 10 July 2013 Release. Office for National Statistics.
16 It should be noted that many working class women already worked outside their own homes, but pay was typically low or non-monetary in traditional female roles like domestic service, and was often not under their discretionary control.
17 Beck & Beck-Gernsheim, 2001.
18 ONS. 2012a. Marriages in England and Wales, 2010, 29 February 2012 Release. Office for National Statistics.
19 Arnett, 2006: 113.
20 ONS, 2012a.
21 Beajouan, Eva, & Maire Ni Bhrolchain. 2011. ‘Cohabitation and Marriage in Britain Since the 1970s’. Population Trends 145 (Autumn): 35-59.
22 Andrew, Mark. 2010. ‘The Changing Route to Owner Occupation: The Impact of Student Debt’. Housing Studies 25 (1): 39-62.
23 ONS, 2013a.
24 ONS, 2011b.
25 Schmitt, Christian. 2012. ‘Labour Market Integration, Occupational Uncertainties, and Fertility Choices in Germany and the UK’. Demographic Research 26 (12): 253-292.
26 ONS, 2011b.
27 ONS, 2013a.
28 Sobotka, Tomas, Vegard Skirbekk, & Dimiter Philipov. 2010. Economic Recession and Fertility in the Developed World: A Literature Review. Vienna: European Commission.
29 Sobotka et al., 2010.
30 ONS, 2011b.
31 ONS, 2011b.
ONS. 2013b. Chapter 3—Households, Families, and People, (General Lifestyle Survey Overview—a report on the 2011 General Lifestyle Survey), 7 March 2013 Release. Office for National Statistics.
32 DCLG. 2013. Household Interim Projections, 2011 to 2021, England, 9 April 2013 Housing Statistical Release. London: Department for Communities and Local Government.
33 ONS, 2013b.
34 Williams, Katie. 2009. ‘Space Per Person in the UK: A Review of Densities, Trends, Experiences, and Optimum Levels’. Land Use Policy 26S (2009): S83-S92.
35 ONS. 2012b. Families and Households, 2012, 1 November 2012 Release. Office for National Statistics.
ONS. 2013c. Family Size in 2012, 25 March 2012 Release. Office for National Statistics
36 Williams, 2009.
37 Whitehead, Christine. 2008. The Density Debate: A Personal View. London: London School of Economics/Cambridge Centre for Housing and Planning Research.
38 Ravetz, 2008.
39 ONS. 2014a. Young Adults Living with Parents in the UK, 2013, 21 January 2014 Release. Office for National Statistics.
40 Clapham, David, et al. 2012. Housing Options and Solutions for Young People in 2020. Cambridge: Joseph Rowntree Foundation.
41 ONS, 2013b.
42 De Paulo, Bella. 2006. Singled Out: How Singles are Stereotyped, Stigmatized and Ignored, and Still Live Happily Ever After. New York: St Martins / Griffin.
43 Bennett, Jim, & Mike Dixon. 2006. Single Person Households and Social Policy: Looking Forwards. York: Joseph Rountree Foundation.
44 Bennett & Dixon, 2006.
45 Beck & Beck-Gernsheim, 2001: 55.
46 ONS. 2012c. 2011 Census – Population and Household Estimates for England and Wales, March 2011, 20 July 2012 Release. Office for National Statistics.
47 Bennet & Dixon, 2006.
ONS, 2011b.
48 Bennet & Dixon, 2006.
49 Bromley, Rosemary D.F., Andrew R. Tall, & Alexander J. Roberts. 2007. ‘New Populations in the British City Centre: Evidence of Social Change from the Census and Household Surveys’. Geoforum 38 (2007): 138-154.
50 Kotkin, 2012.
Klinenberg, Eric. 2013. Going Solo: The Extraordinary Rise and Surprising Appeal of Living Alone. New York: Penguin Books.
51 Klinenberg, Eric, Daniel Roberts, & Doris Burke. 2012. ‘The Solo Economy’. Fortune 165 (2): 128133.
52 Kotkin, 2012.
53 Bennett & Dixon, 2006.
54 Palmer, Guy. 2006. Single Person Households: Issues that JRF Should be Thinking About. York: Joseph Rountree Foundation
55 Palmer, 2006.
56 ONS, 2013b.
57 ONS, 2013b.
58 ONS, 2011b.
59 DCLG. 2013a.
60 Palmer, 2006.
61 ONS, 2011a.
62 DCLG, 2013a.
63 ONS. 2011c. Health, Social Trends 41. By David Sweet. Office for National Statistics.
64 Williams, 2009.
65 ONS. 2014b. Characteristics of Homeworkers, 2014, 4 June 2014 Release. Office for National Statistics.
66 ONS. 2010a. e-Society, Social Trends 41. By Chris Randall. Office for National Statistics.
67 Families and Work Institute. 2005. Generation & Gender in the Workplace. Waltham, MA: American Business Collaboration.
68 Deal, Altman, & Rogelberg, 2010.
69 Hershatter & Epstein, 2010.
70 Johnson Controls. 2010. Generation Y and the Workplace: Annual Report 2010. London: Johnson Controls/ Haworth / iDEA.
71 Arnett, 2006: 118.
72 Bell, David N.F., & David G. Blanchflower. 2010. ‘UK Unemployment in the Great Recession’. National Institute Economic Review 214 (1) R3-R25.
73 ONS. 2014g. Labour Market Statistics, June 2014. Office for National Statistics.
74 ONS. 2013d. Labour Market Statistics, March 2013. Office for National Statistics.
75 ONS. 2011d. Labour Market, Social Trends 41. By Alison Spence. Office for National Statistics.
76 Bell & Blanchflower, 2010.
77 ONS. 2013e. Full Report: Graduates in the UK Labour Market 2013, 19 November 2013 Release. Office for National Statistics.
78 NEF Consulting. 2013. Youth Unemployment: London and the UK. London: NEF Consulting.
79 Gregg, Paul, & Emma Tominey. 2005. ‘The Wage Scar from Male Youth Unemployment’. Labour Economics 12 (2005): 487-509.
80 Bell & Blanchflower, 2010.
81 Arnettt, 2006.
82 Institute for Mobility Research (IFMO). 2013. ‘Mobility Y’—The Emerging Travel Patterns of Generation Y. Munich: IFMO.
83 ONS, 2011d
84 Schmitt, Christian. 2012. ‘Labour Market Integration, Occupational Uncertainties, and Fertility Choices in Germany and the UK. Demographic Research 26 (12): 253-292.
85 ONS, 2011d.
86 ONS, 2011d.
87 ONS. 2014c. Labour Market Statistics Dataset. Accessed 10 July 2014: http://www.ons.gov.uk/ons/ rel/lms/labour-market-statistics/may-2014/dataset--labour-market-statistics.html
88 ONS. 2013f. Self-Employed Workers in the UK, February, 2013. Office for National Statistics.
89 Felstead, Alan. 2012. ‘Rapid Change or Slow Evolution? Changing Places of Work and Their Consequences in the UK’. Journal of Transport Geography 21 (March): 31-38.
90 Feldstead, 2012: 32.
91 ONS. 2014d. Characteristics of Homeworkers, 2014, 4 June 2014 Release. Office for National Statistics.
92 Feldstead, 2012.
93 ONS, 2014d.
94 Live Work Network. 2012. Live/Work Business Briefing 2012. Penzance, UK: Live Work Network.
95 Villeneuve-Smith, Frank, & Charlotte Chung. 2013. Social Enterprise: The People’s Business. London: Social Enterprise UK.
96 ONS, 2014d.
97 Felstead, 2012.
98 Felstead, 2012.
99 Urry, John. 2000. Sociology Beyond Societies: Mobilities for the Twenty-First Century. London: Routledge.
100 ONS, 2014d.
101 Adreev, Pavel, Ilan Salomon, and Nava Pliskin. 2010. ‘Review: State of Teleactivities’. Transportation Research Part C: Emerging Technologies 18 (1): 3-20.
102 DFT. 2012. National Travel Survey: 2011, 13 Decemeber 2012 Satistical Release. London: Department for Transport.
103 The Economist. 2012. ‘Economy: Long-Term Outlook Summary’. The Economist Intelligence Unit. Updated 9 May 2012: http://country.eiu.com.
104 Dwelly, Tim, Andy Lake, & Lisa Thompson. 2010. Workhubs: Smart Workspace for the Low Carbon Economy. Reduth: Work Hubs Network.
105 Dwelly, Lake, & Thompson, 2010.
106 Holliss, Frances. 2008. ‘Beyond Live/Work’. Planning in London 67 (October-December): 22-24.
107 Sennett, Richard. 2013. ‘Efficient or Sociable Cities?’ City Transformations October (2013).
108 ONS, 2014d.
109 Levinson, David. 2008. ‘Density and Dispersion: The Co-Development of Land Use and Rail in London’. Journal of Economic Geography 8 (2008): 55-77.
110 DCLG, 2013a.
111 Adam, Robert. 2013. ‘Will It Save Town Centres? — A Network Systems Analysis’. Planning in London 87 (October-December): 9-10.
112 Appleyard, Lindsey, & Karen Rowlingson. 2010. Home-Ownership and the Distribution of Personal Wealth: A Review of the Evidence. York: Joseph Rountree Foundation.
113 ONS. 2011e. Wealth in Great Britain: Main results from the Wealth and Assets Survey: 2008/10. Office for National Statistics.
114 Appleyard & Rowlingson, 2010.
115 Appleyard & Rowlingson, 2010.
116 National Centre for Social Research. 2012. British Social Attitudes 28. Edited by Alison Park, John Curtice, Miranda Phillips, & David Utting. SAGE: London.
117 Appleyard & Rowlingson, 2010.
118 It should be noted that the greater equality of housing wealth may be skewed by self-report—people tend to overestimate their own property value.
119 ONS. 2012d. Chapter 2: Total Wealth, 2008/10. Office for National Statistics.
120 DCLG. 2013b. English Housing Survey, Headline report 2011-12. London: Department for Communities and Local Governement.
121 Whitehead et al., 2012.
122 Andrew, 2004.
123 Andrew, 2004.
124 Pearce, Jen. 2013. Who Lives in the Private Rented Sector? An Analysis of Households’ Characteristics. Coalville, UK: Building and Social Housing Foundation.
125 DCLG, 2014b.
126 Andrew, 2010.
127 Centre for Cities. 2013. Cities Outlook 2013. London: Centre for Cities.
128 Andrew, 2004.
129 Houston & Sissons, 2012.
130 ONS, 2012d.
131 Appleyard & Rowlingson, 2010.
132 ONS, 2013d.
133 IFMO, 2013.
134 ONS. 2013g. Total Household Wealth by Region and Age Group, Regional Economic Analysis, Wealth by Age Group and Region Release, 4 June 2013. Office for National Statistics.
135 Appleyard & Rowlingson, 2010.
136 Andrew, 2010.
137 Andrew, 2010.
138 Clapham et al., 2012.
139 Appleyard & Rowlingson, 2010.
140 Clapham et al., 2012.
141 Savills World Research. 2012. Residential Property Focus: Q4 2012. London: Savills.
142 Whitehead et al., 2012.
143 Clapham et al., 2012.
144 Houston & Sissons, 2012.
145 Clapham et al., 2012.
146 DCLG. 2007. Social Mobility and Home-ownership: A Risk Assessment, New Horizons Research Summary No. 5. London: Department for Communities and Local Government.
147 Appleyard & Rowlingson, 2010.
148 Feitjen, Peteke, & Maarten van Ham,. 2010. ‘The Impact of Splitting up and Divorce on Housing Careers in the UK’. Housing Studies 25 (4): 483-507.
149 ONS, 2010a.
150 Dutton, William H. 2010. The Local Impact of the Global Internet: The Effect of New Technology and Global Communication on Individuals and Communities in Britain. York: Joseph Rountree Foundation.
151 Rice, Ronald E.; Adrian Shepherd; William H. Dutton.; & James E. Katz. 2007. ‘Social Interaction and the Internet: A Comparative Analysis of Surveys in the US and Britain’. In Oxford Handbook of Internet Psychology, edited by Adam N. Joinson et al., 7-30. Oxford: Oxford University Press.
Dutton, William H., Ellen J. Helsper, & Monica M. Gerber. 2009. The Internet in Britain. Oxford: Oxford Internet Institute, University of Oxford.
152 Hershatter & Epstein, 2010.
153 Small, Gary, & Gigi Vorgan. 2008. iBrain: Surviving the Technological Alteration of the Modern Mind. New York: Harper Collins.
154 Mintel. 2010. Digital Trends Autumn — UK — Spetember 2010. London: Mintel Group Ltd
155 Wellman, Barry, Bernie Hogan, Kristen Berg, Jeffrey Boase, Juan-Antonio Carrasco, Rochelle Cote, Jennifer Kayahara, Tracy L.M. Kennedy, & Phuoc Tran. ‘Connected Lives: The Project’. In Networked Neighbourhoods, edited by Patrick Purcell, 157-211. Berlin: Springer.
156 Dutton, William H., & Rebecca Eynon. 2009. ‘Networked Individuals and Institutions: A CrossSector Comparative Prespective on Patterns and Strategies in Government and Research’. The Information Society 25 (3): 1-11.
157 Leyshon, Michael, Sean DiGiovanna, & Briavel Holcomb. 2013. ‘Mobile Technologies and Youthful Exploration: Stimulus or Inhibitor?’ Urban Studies 50 (3) 455-466.
158 Dutton, 2010.
159 ONS, 2010a.
160 Hampton, Keith, Oren Livio, Craig Trachtenberg, Rhonda McEwan. 2010. ‘The Social Life of Wireless Urban Spaces’. Contexts. 9 (4).
161 Twenge, Jean, Keith Campbell, and Elise Freeman. 2012. ‘Generational Difference in Young Adults’ Life Goals, Concern for Others and Civic Orientation, 1966-2009’. Journal of Personality and Social Psychology 102 (5): 1045-1062.
162 ONS. 2011f. Lifestyles and Social Participation, Social Trends 41. By Carla Seddon. Office for National Statistics.
163 Twenge, Campbell, & Freeman 2012.
164 Civic participation is defined by ONS as ‘wider forms of engagement in democratic processes, such as contacting an elected representative, taking part in a public demonstration or protest, or signing a petition.’
165 Social Enterprise UK, 2013.
166 Leibling, David. 2008. Car Ownership in Great Britain. London: RAC Foundation.
167 DFT, 2012.
168 DFT, 2012.
169 Yusuuf, Shadid. 2007. About Urban Mega Regions: Knowns and Unknowns. World Bank Policy Research Working Paper 4252.
170 Florida, Richard, Tim Gulden, & Charlotta Melander. 2007. The Rise of the Mega-Region. Toronto: Rotman School of Management: 3.
171 Florida, Gulden, & Melander, 2007.
172 Nielson, Thomas, & Henrik Hovgesen. 2008. ‘Exploratory Mapping of Commuter Flows in England and Wales’. Journal of Transport Geography 16: 90-99.
173 DFT, 2012.
174 DFT. 2013. National Travel Survey: 2012, Tables NTS0605 and NTS0601. London: Department for Transport.
175 DFT, 2012.
176 IFMO, 2013.
177 Greater London Authority. 2010. Mayor’s Transport Strategy. Updated 10 May 2010: http://www. london.gov.uk/publication/mayors-transport-strategy
178 Transport for London. 2013. ‘Barclays Cycle Hire Expansion’. Updated 2 December 2013, http:// www.tfl.gov.uk/info-for/media/news-articles/barclays-cycle-hire-expansion
179 Steer Davies Gleave. 2014. Carplus Annual Survey of Car Clubs 2013/14. Leeds: Carplus.
180 DFT, 2012.
181 Le Vine, Scott, & Peter Jones. 2012. On the Move: Making Sense of Car and Train Travel Trends in Britain. London: RAC Foundation.
182 DFT, 2012.
183 Le Vine & Jones, 2012.
184 DFT, 2012.
185 Seddon, Carla. 2012. Measuring National Well-Being—What We Do, 2012. Office for National Statistics.
186 IFMO, 2013.
187 Mintel, 2013. Singles on Holiday — UK — March 2013. London: Mintel Group Ltd
188 Mintel. 2010. Youth Holidays — UK — May 2010. London: Mintel Group Ltd.
189 Mintel. 2012. Youth Fashion — UK — December, 2012. London: Mintel Group Ltd.
190 ONS, 2010a
191 Mintel, 2012.
192 DFT, 2012.
193 Unsworth, Rachael. 2012.‘The Future of City Living as Eco-Localisation’. Forthcoming Publication, School of Geography, University of Leeds.
194 Owyang, Jeremiah, Alexandra Samuel, & Andrew Grenville. 2014. Sharing is the New Buying. Vancouver: Vision Critical / Crowd Companies.
195 Owyang, Samuel, & Grenville, 2014.
196 Centre for Cities, 2013.
197 Owyang, Samuel, & Grenville, 2014.
198 ONS, 2011c.
199 Dempsey, Nicola, Caroline Brown, & Glen Bramley, 2012. ‘The Key to Sustainable Urban Development in UK Cities? The Influence of Density of Social Sustainability’. Progress in Planning 77 (2012) 89-141.
200 ONS. 2014e. Measuring National Well-being: Life in the UK, 2014, 18 March 2014 Release. Office for National Statistics.
201 Putnam, 1999. ‘”Postmodern” Home Life’. In At home: An Anthropology of Domestic Space, Edited by Irene Cieraad, 145-152. Syracuse, NY: Syracuse University Press.
202 Mulholand Research & Consulting. 2003. Perceptions of Privacy and Density in Housing. London: Popular Housing Group.
203 Hansen, Barbara. 2013. ‘Housing Recovery Leaves Millennials Behind’, Analysis of US Census Bureau data from the American Community Survey. USA Today. Accessed 7 July 2014: http://www. usatoday.com/story/money/personalfinance/2013/07/17/young-adult-home-ownership-ratesdecline/2456845/
204 Chapman, Tony, & Jenny Hockney. Introduction to Ideal Homes: Social Change and Domestic Life, edited by Tony Chapman & Jenny Hockney. London, New York: Routledge: 5.
205 Crompton, Tom. 2010. Common Cause: The Case for Working with our Cultural Values. Woking: World Wildlife Fund.
206 DCLG. 2014a. Dwelling Stock Estimates: 2013, England, 27 February 2014 Housing Statistical Release. London: Department for Communities and Local Government.
207 Ravetz, 2008.
208 Ravetz, Alison, & Richard Turkington.1995. The Place of Home: English Domestic Environments, 1914-2000. London: Taylor & Francis: 166.
209 Evans, Alan, & Rachael Unsworth, 2012: ‘Housing Densities and Consumer Choice’. Urban Studies 49 (6): 1165-1177.
210 Hand, Martin, Elizabeth Shove, & Dale Southern. 2007. ‘Home Extensions in the United Kingdom: Space, Time, and Practice’. Environment and Planning D: Society and Space 2007 (25) 668-681.
211 Office of the Deputy Prime Minister. 2001. English House Condition Survey: 2001 Key Facts. Wetherby: ODPM Publications Centre.
212 Gordon, Ian. 2008. ‘Density and the Built Environment’. Energy Policy 36 (2008) 4652-4656.
213 Hand, Shove, & Southern, 2007.
214 DCLG. 2011. English Housing Survey: HOMES 2011. London: Department for Communities and Local Government.
215 Hand, Shove, & Southern, 2007.
216 Ravetz, 1995.
217 West, B., & S. Emmitt. 2004. ‘Functional Design? An Analysis of Speculative House Plans in the UK’. Design Studies 25: 275-299.
218 Hand, Shove, & Southern, 2007.
219 DCLG, 2011.
220 Hand, Shove, & Southern, 2007.
221 DCLG. 2013c. English Housing Survey: Households Report 2011-12. London: Department for Communities and Local Government.
222 Hand, Shove, & Southern, 2007.
223 Ravetz, 1995. Ravetz, 2008.
224 Ravetz, 1995.
225 Shaw, Adam Green, Adam Strange Shaw, & Hichem Trache, 2000. ‘The Homeworking Revolution: Considering the Property Dimension. Regional Studies 34 (3): 303-307.
226 Hand, Shove, & Southern, 2007.
227 Minton, Anna, & Jody Aked. 2012. ‘Fortress Britain’: High Security, Insecurity and the Challenge of Preventing Harm. London: New Economics Foundation.
228 Coaffee, Jon. 2003. Terrorism, Risk, and the City. Ashgate: Aldershot: 212.
229 Minton & Aked, 2012.
230 Ditton, Jason. 2000. ‘Crime and the City, Public Attitudes to Open Street CCTV in Glasgow’. British Journal of Criminology 4 (4): 692.
231 Hand & Shove, 2004: 3.
232 Attfield, Judy. 1999. ‘Bringing Modernity Home: Open Plan in the British Domestic Interior’. In At Home: An Anthropology of Domestic Space, edited by Irene Cieraad, 145-152. Syracuse, NY: Syracuse University Press.
233 Ravetz, 1995: 166.
234 Putnam, 1999.
235 Hand & Shove, 2004.
236 DCLG, 2011.
237 Hand, Shove, & Southern, 2007.
238 CABE. 2009. Space in New Homes: What Residents Think. London: Comission for Architecture and the Built Environment.
239 Hand & Shove, 2004: 3.
240 Hand, Shove, & Southern, 2007.
241 Putnam, 1999.
242 Roberts-Huges, Rebecca. 2011. The Case for Space: The Size of England’s New Homes. London: RIBA.
243 Kotkin, 2012: 16.
244 Williams, Raymond. 1973. The Country and the City. Sheffield: Spokesman Books: 2.
245 Clapson, Mark. 2003. Suburban Century: Social Change and Urban Growth in England and the USA. Oxford: Berg.
246 RICS, CABE. 2007. Sustaining Our Suburbs: Suburbia All Grown Up. London: Royal Insitution of Chartered Surveyors.
DEFRA. 2013. Rural –Urban Classification for England. Government Statistical Service.
247 Centre for Cities. 2014. Cities Outlook 2014. London: Centre for Cities.
248 Gordon, 2008.
249 Bromley et al., 2007.
250 ONS. 2014f. Mid-Year Population Estimates. Accessed 5 August 2014: www.nomisweb.co.uk
251 ONS. 2012e. 2011 Census, Population and Household Estimates for England and Wales, March 2011. Office for National Statistics.
252 Gordon, 2008.
253 Gordon, 2008.
254 Dempsey, Brown, & Bramley, 2012.
255 Williams, 2009.
256 Evans and Unsworth, 2012.
257 DCLG. 2014b. English Housing Survey: Headline Report 2012-13. London: Department for Communities and Local Government.
258 Roberts-Huges, 2011.
259 Howley, Peter. 2009. ‘Attitudes Towards Compact City Living: Towards a Greater Understanding of Residential Behaviour’. Land Use Policy 26 (2009): 792-798.
260 Williams, 2009.
261 Roberts-Huges, 2011.
262 Evans and Unsworth, 2012.
263 Roberts-Huges , 2011.
264 Pearce, 2013.
265 DCLG, 2013c.
266 Dempsey et al., 2013.
267 Florida et al. 2013. ‘The Happiness of Cities’. Regional Studies 47 (4): 618-567.
268 ONS. 2012f. Measuring National Well-Being: Life in the UK, 2012, 20 November 2012 Release. Office for National Statistics.
269 Bhatti, Mark. 2002.‘The Meaning of Gardens in an Age of Risk’. In Ideal Homes: Social Change and Domestic Life, edited by Tony Chapman & Jenny Hockney. London, New York: Routledge.
270 DCLG, 2011.
271 Whitehead, 2008.
272 Evans & Unsworth, 2012.
273 Dempsey, 2012.
274 Williams, 2009.; Mulholand Research & Consulting, 2003.
275 Dempsy et al., 2012.
276 Mulholand Research & Consulting, 2003: 5.
277 Dempsey, 2012.
278 Evans & Unsworth, 2012.
279 DCLG. 2014c. House Building: December Quarter 2013, England, 20 February 2014 Statistical Release. London: DCLG.
280 Williams, 2009.
281 Ermisch, John, & Elizabeth Washbrook. 2012. ‘Residential Mobility: Wealth, Demographic, and Housing Market Effects’. Scottish Journal of Political Economy 59 (5): 483-499.
282 Rabe, Birtgitta, & Mark Taylor. 2012. ‘Differences in Opportunities? Wage, Employment and HousePrice Effects on Migration’. Oxford Bulletin of Economics and Statistics 74 (6): 831-855.
283 Bromley et al., 2007.
284 IFMO, 20, 201313.
285 Rabe & Taylor, 2012.
286 DCLG, 2013c.
287 Evans & Unsworth, 2012: 1176.
288 DCLG. 2013b.
289 Whitehead et al., 2012.
290 DCLG, 2007.
291 Evans & Unsworth, 2012.
292 Whitehead, 2008.
293 National Housing Federation. 2013. ‘Thirty-Somethings Abandon South East Villages as Rural House Prices Soar’. Last modified 13 June 2013: http://www.housing.org.uk/media/press-releases/ thirty-somethings-abandon-south-east-villages-as-rural-house-prices-soar
294 Williams, 2009.
295 National Housing Federation, 2013.
296 Centre for Cities, 2013.
297 Urban Land Institute. 2013. America in 2013: A ULI Survey on Housing, Transportation, and Community. Washington, DC: Urban Land Insitute.
298 IFMO, 2012: 30.
299 Le Vine & Jones, 2012.
300 IFMO, 2013.
301 DCLG, 2013a.
302 Hall, Peter. 2002. ‘Planning: Millennial Retrospect and Prospect’. Progress in Planning 57 (2002): 281.
303 ONS, 2012c.
304 Centre for Cities, 2014.
305 Clapham et al., 2012
306 DCLG, 2013a.
307 Centre for Cities, 2013.
308 DFT, 2012
309 Titheridge, Helena, & Peter Hall. 2006. ‘Changing Travel to Work Patterns in South East England’. Journal of Transport Geogrpahy 14 (2006): 60-75.
310 ONS. 2014d. Characteristics of Homeworkers, 2014, 4 June 2014 Release. Office for National Statistics.
311 DFT, 2012.
312 The Economist, 2012.
313 Holliss, 2008.
314 LiveWork Network, 2012.
315 Dwelly, Tim, Andy Lake, & Lisa Thompson. 2008. Tomorrow’s Property Today: Sustainable Live/ Work Development in a Low Carbon Economy. Penzance, UK: Live Work Network.
316 DTI, DFEE, DETR. 2000. Working Anywhere—Exploring Telework for Individuals and Organisations. Great Britain: Department of Trade and Industry.
317 Dwelly, Lake, & Thompson, 2008.
318 Dwelly, Lake, & Thompson, 2008.