
The Use Of Low Amplitude Response Data For Seismic Capacity Assessment.
40 Wall Street • 19th Floor • New York, NY 10005
STRAAM Group, Inc.

High-amplitude and Low-amplitude Dynamic Measurements and Assessments.

Codes of practice and standards use much of their output for guidance on the design process. Notwithstanding this there is a little information about acceptable performance criteria, and such approaches as drift limits are widely used in seismic assessment. None of this addresses the state of health and the remaining capacity of a structure.
This paper introduces a different complementary method that addresses the current state of a structure without relying only on measurements at high amplitude. The diagram to the right demonstrates this concept. The response of a structure is shown before, during and after a seismic event. The suggested complementary approach uses a comparison of the ‘before and after’ dynamic behavior of the structure to assess its probable response to large events in the future. This complements the current method of analysis using data from the high amplitude event only Also, it provides an economical alternative for all structures if they are not actively instrumented for high amplitude seismic monitoring.
There are several benefits to this approach:
1. Measurement of a structure’s response at high amplitude is imprecise because of the short recordlength, and several non-linearities involved. Details are considered below.
2. Assessment of the response at low amplitude carries a vast quantity of information about the state of a structure and of its capacity, if analyzed correctly.
3. Low amplitude data can be collected over long periods and this allows for precise and accurate measurement and analysis of the structure’s characteristics.
4. Changes in the dynamic parameters reflect the effects of damage, or ageing in a structure and can be assessed accurately with longer data lengths.
A limitation of low amplitude measurement analysis is that no direct evidence of the behavior at high amplitude is included in the analysis. However, this can be overcome by using the same design process that is included in codes of practice and standards, but now having a calibrated structural definition in the elastic range. Extrapolation into ductile behavior can be performed exactly as currently conducted. The behavior of a structure at high amplitude is subject to a series of non-linearities, and measurement of this response together with the calibrated low amplitude behavior and the design assumptions for the ductile range,
potentially allow a greater understanding of the high amplitude response. Also, by combining the two approaches, a prediction combined with a calibrated measurement of actual performance is achieved.
The use of structural dynamic measurements is well established and can be used to define the system parameters by analysis of the modes of vibration that are inherent in the mathematical description of a structure.
Codes of practice do a very good job of establishing the magnitude and risk of a seismic event at a particular location, and this complementary approach does not change that, indeed it seeks to utilize the codification approach on top of the ‘before and after’ comparison.
The different approaches adopted by seismic, wind and mechanical engineers over the decades has been predicated on the data lengths commonly available. Each discipline can learn from others.
The important modal parameters used to describe a structure are:
Frequency of resonance
Modal damping ratio
Deflected form of a mode of vibration (mode shape, also acts as an influence function)
Displacement per unit force
Participating mass
Interestingly, techniques for the measurement of structural dynamics parameters are considered in some detail in the document FEMA 461 (Interim testing protocols for determining the seismic performance characteristics of structural and nonstructural components, June, 2007) for shake table experiments. This paper extends these ideas to the full-scale, at the same time assessing the implications of the requirements for the analysis of randomly induced responses, necessary for statistically accurate parameter estimation.
High-amplitude techniques.
Earthquakes generally last for a few seconds to a few minutes, depending on the magnitude and distance of the event, providing a limited length of dynamic data for analysis. As a result, the currently used design approach is to combine the imposed force with the structural characteristics to produce a probable response. This process involves combining both force and response data, coupled with the use of ‘most likely’ values for ductility, energy dissipation, and acceptance of energy by the structure. In this approach, the incoming energy is assessed as having different energy levels at a spread of periods. In both mechanical and wind engineering, with longer lengths of data it is possible to use spectral techniques to establish structural parameters to a high degree of accuracy. In this way the characteristics of a structure, albeit in the elastic range, can be assessed with precision. This accurate characterization is very valuable in the seismic community. Attachment A contains a paper by Cruz and Miranda (2019) entitled, “Reliability of Damping Ratios Inferred from the Seismic Response of Buildings”, which discusses some of the challenges in determining building modal periods of response and damping ratios from recorded earthquake strong-motion data.
1. Structural modal period/frequency content of forcing – In this section, we separate the structure’s characteristics from the incoming seismic action and use the structural characterization to establish its condition. For a long time, the seismic force has been established by using a series of earthquake data from structures. Now, by using low amplitude data, very low noise instrumentation, and long data sets, we can separate the structural characteristics from the action caused by the seismic event. Mixing the
effects of the input action with the response causes a series of problems associated with structural identification. When the response of the structure is assessed at low amplitude, the modal parameters, including both long and short period resonances, can be assessed with high accuracy. This information is difficult to obtain from high-amplitude data because of the following:
(a) the short duration of high-amplitude events contributes to large variance errors in estimating building periods when using spectrally based analysis;
(b) the structural forces induced by ground motions reflect a combination of both the input forces and the structural response, as opposed to only the structural response;
(c) because of (b) above, the modal mass, the modal frequency and the modal and overall damping, represent a changed system that behaves as a larger system incorporating not just the structure, but also the adjacent ground.
(d) the input forces can be composed of quickly varying forces spread across a range of frequencies.
(e) the period of the structure changes when the amplitude of response is high. This can be caused by damage (in which the modal stiffness changes), by changes to structural damping and by changes of participating mass when soil-structure interaction occurs, (as in (c) above).
The foregoing implies that it is easier to measure the structural characteristics when soil/structure interaction is minimized. All of these factors contribute to significant challenges in determining the accurate modal periods of response of a building during high-amplitude recordings. As a result, highamplitude techniques that experience these inherent difficulties yield varying levels of reliability of the results. This variability leads to a lack in confidence of the significance of the dynamic characteristic due to the difficulty of defining a parameter from a short data sample in which the parameter may change quite rapidly.
2. Displacement – Displacements are calculated from the high-amplitude events by analyzing the acceleration time history around the peak values of the event. Then the time history is filtered to the dominant frequency Assuming simple harmonic motion (which is only a correct assumption if the frequency is invariant) the displacement is calculated using a double integration of the time history to simulate simple harmonic motion at a single frequency that may not represent the structural resonance. Yet the standard analysis provides a reasonable estimate based on the primary frequency. This leads to the imprecise estimation of peak displacements because of the behavior of the structure in short period modes of vibration.
3. Damping – Calculating damping from high amplitude events is fraught with difficulties, not just because of the short record lengths, but also, and crucially, because damping is a measure of energy dissipation, and the energy dissipation in the soil contributes. If techniques of estimating modal damping of the structure are used, there is also the factor of the non-linear behavior masquerading as an increase in damping if the measurement is based on averaging methods (such as using spectrum-
based methods, autocorrelation, or some time-stepping fitting methods). In the case of each of these methods there is an introduced bias that overestimates the value of damping. Fortuitously, there are now several methodologies for measuring non-linear damping directly from a time-history of response. The most important aspect of this analysis is that it becomes possible to establish the rate of change of damping with increasing amplitude. Nevertheless, for these methods to work accurately, long record lengths are required.
Calculating damping from a technique of system identification (as depicted in the attached Cruz and Miranda paper) in which a time history is artificially created and compared with the measured response. Parameters are then changed until a satisfactory fit is achieved. The resulting damping estimate contains influences from all the aforementioned mechanisms as well as the structural contribution. There are several parameters that must be modified including both the force and the damping, and an error in the estimation of one assumption, influences the other. This has led to skepticism about the ability to extract damping data from high amplitude responses.
It is common practice to assume, in seismic engineering design, that the structural component of damping may be assumed to be 5%, and that even if it is not, the calculation of displacement will still be quite accurate. Unfortunately, this is not true, and a small value of damping at low amplitude will result in a structure reaching high amplitude faster than expected, which in turn leaves it with inertia to overcome as well as the rising input forces.
Value of this approach - Regardless of the sources of error, the high-amplitude techniques provide valuable information for engineers to conduct analysis from the time history of an earthquake. Displacements are a critical criterion for determining the response from a seismic event and using the measurements can yield relatively accurate values. The use of these techniques in addition to the ‘before and after’ approach undoubtedly helps in establishing a complete picture of the structural behavior. A comparison of the response of the structure both ‘before and after’ a seismic event gives a comparison under similar conditions in which changes are a function of changes in the structure only.
Limitations to this approach – It is important to be aware that parameters may be changing rapidly through a seismic event, and that changes may appear to be changes in other parameters. This is a function of the short data lengths, and the non-linearities in both the structure and the incoming force. Thus, the variability of the dynamic characteristics erodes confidence in the accuracy of their estimation together with a lack of confidence in their true values. Traditional high amplitude equipment is not capable of capturing low amplitude response information, although some of the most modern devices, already deployed, may be usable for this complementary approach
Low-amplitude techniques.
In both mechanical and wind engineering the response to random excitation has been studied for over four decades. By using low-amplitude measurements, the flexibility to measure the dynamic response can occur frequently, although times at which the wind is stronger, or traffic intensity is more severe allows the analysis to larger amplitudes of response, which in turn adds confidence to extrapolations to larger amplitudes within the elastic range. The analysis of the dynamic response information is based on the use of sufficient lengths of data to allow spectrally based analysis to reduce random variance errors to within a well-defined proximity to the average response to a mean wind speed. Wind engineers then have several techniques for estimating the
ratio of the peak response to the mean response. If the random data are well behaved, then this ratio is also well-behaved. This type of random response is defined as stationary, meaning that the statistical properties remain invariant with time. Thus, the system properties of the structure can be well defined with a high level of accuracy. These dynamic parameters vary little within the elastic range which applies here. The luxury of this type of analysis is not available for short data lengths associated with earthquakes but can be used to complement that approach. Therefore, these techniques provide the consistency needed to accurately define the dynamic parameters not available through seismic techniques.
1. Frequencies of resonance - Wind engineers refer to the inverse of the period of a structure as the frequency of resonance. By using the appropriate techniques for low-amplitude energy, estimating the structure’s dynamic properties, including the frequencies of resonance, can occur to a very high level of accuracy (99%). Also, various structural modes of vibration can be identified allowing for clarity of the stiffness relationship throughout the structure. Further, the mode shapes are always consistent in the elastic amplitude range which is not necessarily the case with high-amplitude responses. By introducing a ‘before and after’ measurement of the response of a structure it is possible to establish the displacement per unit force through the measurement of the parameters which define the structure as a system. This is possible because ‘before and after’ an event the modal mass is invariant.
2. Damping – By using low-amplitude energy, the damping response is nearly 100% generated from the structural elements, and there is negligible contribution of the other mechanisms of damping such as radiation, hysteretic and viscous sources. As referenced in the paper, Attachment B, “Generalized Random Decrement Method for Analysis of Vibration Data”, the Random Decrement Algorithm allows for measuring the structural damping response to a very high level of accuracy, generally better than 98% accurate when measuring structural modes of vibration. Because it is not common practice to separate structural damping from overall damping in the seismic design process the importance of the information available from the non-linear structural damping parameter may not be immediately obvious in the communities working with seismic design. Measuring ‘structural’ damping accurately is a critical aspect of defining the structure’s dynamic properties and cannot currently be achieved accurately using high-amplitude data sets. The Random Decrement (RANDEC) algorithm gives an amplitude dependent curve that can give critical insight into how the structure functions over a wide range of amplitudes. RANDEC was developed by NASA to detect early stage damage in the wings of the space shuttle, and if used appropriately, provides an accurate change in response due to damage to the structure. This parameter is extremely sensitive to changes in energy dissipation within the structure, such as that caused by damage.
Value to this approach – The use of low-amplitude techniques allows measurements to be taken almost any time since there is normally movement of the structure from ambient sources of excitation. So long as measuring equipment has a low noise platform, then very low amplitude responses can be captured. Because even these amplitudes represent motion in the linear-elastic range then extrapolation throughout that range is justified (and supported by experiment). This provides flexibility and consistency for taking dynamic response measurements, and these measurements can be captured at almost all times, leading to an accurate assessment of the system properties. The frequency response is accurate to within 99% and structural (nonlinear) damping values can be estimated to better than 98% precision using these techniques. This high level of accuracy allows a precise comparison of the ‘before and after’ system properties, including their non-linear aspects. In this way the estimation of structural parameters becomes consistent and accurate.
The equipment necessary for the capture of low amplitude responses can also be used to capture the high amplitude response. The inverse is not normally true, and so there is an added advantage to using these new techniques.
Limitations to this approach – The establishment of structural identification through the use of low amplitude techniques requires extrapolation throughout the elastic range, and then beyond. The behavior of the structure at low amplitude can be used for calibration purposes, and then extrapolations within the ductile range must use conventional design assumptions.
Value in combining both high-amplitude and low-amplitude techniques.
Using both techniques provides a very clear picture of the performance of a structure as it transitions through a high-amplitude event:
Before event – Using low-amplitude dynamic analysis techniques prior to a high-amplitude event would establish the baseline measurement of a structure’s dynamic characteristics and response. It allows the comparison of the structure’s description with what is expected in the design philosophy. Additionally, it can be used to establish the decreased capacity associated with ageing of the structure. These measured structural parameters establish a baseline condition and can be used for future comparison to quantify damage to a high degree of accuracy.
During the event – Analysis of the high-amplitude event gives an opportunity to establish the most likely velocity and displacement behavior during the high amplitude event, and these estimates give a good insight into the probability of damage having occurred. However, the information is important to understand how a structure responds to the imposed forces.
After event – Taking a follow up post-event measurement of the dynamic properties provides a comparison of the any changes to the state of the structure. Changes to mode shapes can indicate an area of weakness, changes to the frequency of resonance indicate a change of modal stiffness, and changes to structural damping indicate changes to the energy dissipation of the structure (such as those caused by cracking or other damage). The structural damping parameter is extremely sensitive to damage, often 10 to 20 times more sensitive than changes in stiffness.
References
Cruz, Cristian, and Miranda, Eduardo, 2019, Reliability of damping ratios inferred from the seismic response of buildings, Engineering Structures, Volume 184, pages, 355-368.
Spano, P.D. and Zeldin, B.A., 1998, Generalized Random Decrement Method for Analysis of Vibration Data. Journal of Vibration and Acoustics, Volume 120
Contentslistsavailableat ScienceDirect
EngineeringStructures

journalhomepage: www.elsevier.com/locate/engstruct

Reliabilityofdampingratiosinferredfromtheseismicresponseofbuildings
CristianCruza,b,⁎,EduardoMirandab
a DepartamentodeObrasCiviles,UniversidadTécnicaFedericoSantaMaría,Santiago,Chile b DepartmentofCivilandEnvironmentalEngineering,StanfordUniversity,Stanford,CA94305-4020,UnitedStates
ARTICLEINFO
Keywords:
Dampingratios
Reliability
Dampingofhighermodes
Systemidentification
ABSTRACT
Thispaperstudiesthereliabilityofdampingratiosinferredfromtheseismicresponseofbuildingsemployinga modalminimizationparametricsystemidentificationtechnique.Thereliabilityofinferreddampingratiosis quantifiedthroughtheuseofthreemetrics:(1)dynamicamplificationfactors;(2)Ariasmodalcontribution factors;and(3)reliabilityintervals.Dynamicamplificationfactorsmeasuretheamplificationof1%damped flooraccelerationspectralordinatesoftherecordedresponseattheroofinthevicinityofidentifiedmodal periodswithrespecttothoseofthemotionrecordedatthebaseofthebuilding.Itisshownthatthismetric allowstodetermineiftheearthquakeproducedaminimumdynamicamplificationofthe firstandsecondmodes ofthestructure,toreliablyidentifytheirdampingratios.TheAriasmodalcontributionprovidesameasureofthe intensityofacomputedmodalresponserelativetothetotalpredictedstructuralresponse.Itisarguedthatonly dampingratiosfrommodeswithaminimumcontributiontotheseismicresponsemaybereliablyestimated.The thirdmetriccorrespondstothereliabilityintervalsoftheidentifieddampingratios,whichmeasurethesensitivityoftheobjectivefunctiontosmallvariationsinthedampingratio.Itisshownthattheobjectivefunctionis typicallysignificantlylesssensitivetovariationsindampingratiosthantosimilarvariationsinmodalperiods, whichleadstolargervariabilityintheresultsfordampingwithrespecttothatobtainedinmodalperiods. Reliabilityscreeningtestsaredevelopedbasedonestablishinglimitingvaluesforthesethreemetrics.Itisshown thatthesescreeningtestsarecapableofdiscriminatinginferreddampingratiosthatarereliablefromthosethat arenot,independentlyfromtheadoptedidentificationtechnique,andalsoreducingthevariabilityoftheinferredresults.
1.Introduction
Theinherentdampingofabuildingisusuallymodeledaslinear viscous,asitisasimplemathematicalrepresentationofallthesources ofenergydissipationinastructurethatarenotexplicitlyincludedin thestructuralmodel.Thesesourcesinclude,amongothers,theinherent dampingcapacityofthebuildingmaterials,theenergydissipationdue tofrictionbetweenthedifferentstructuralandnon-structuralelements (orwithinthem),theenergydissipatedduetosoil-structureinteraction, andtheeffectsoftheaerodynamicpropertiesofthebuilding [1].Even thoughthereisevidencethatsomeofthesesourcesofenergydissipationdonotbehaveinaviscousmanner,assuminglinearviscous dampinghasbecomethestandardincurrentstructuralanalysis methodsbecauseitsignificantlysimplifiesthedifferentialequationsof motion(e.g., [2,3])but,moreimportantly,becausemultiplestudies haveshownthatemployingthisdampingmodelinbuildingsrespondingelasticallyallowstoadequatelyreproducethemeasuredresponseofinstrumentedbuildings(e.g., [4
yearsthemostcommonlyusedapproachtomodeldampinginstructuresrespondingelasticallyhasbeentogroupthecontributionofthe varioussourcesofenergydissipation-whosemodelingmaybeimpractical,toocomplex,ornotyetfullyunderstood-usingalinear viscousdampingmodel.Giventhatitisnotpossibletomeasure dampingdirectly,themostreliablewaytodetermineitsvalueinexistingbuildingsisbyusingsystemidentificationtechniquestoinferit frommeasureddynamicresponses.
8]).Therefore,formany
Sincethelate1970s,the fieldofstructuralidentificationhasshifted emphasisfromnon-parametrictomorecomplexmechanicalparametric methodssincetheyprovideabetterunderstandingofthemechanicsof thestructureandbecauseoftheavailabilityoffastercomputers [9].A parametricsystemidentificationtechniqueconsistsin findingtheoptimalsetofparameterstobeusedinanumericalmodelofthestructure inordertoreproducetherecordedresponsewiththeleasterror.The mainadvantageofusingaparametricmodelsystemidentification techniqueisthatastructuralmodelisused,whichallowsthecomputationofresponseparametersnotdirectlymeasured,suchaslateral
⁎ Correspondingauthorat:DepartamentodeObrasCiviles,UniversidadTécnicaFedericoSantaMaría,Santiago,Chile.

E-mailaddresses: cristian.cruzd@usm.cl (C.Cruz), emiranda@stanford.edu (E.Miranda).
https://doi.org/10.1016/j.engstruct.2019.01.056
Received2January2018;Receivedinrevisedform22December2018;Accepted14January2019
displacements,interstorydrifts,storyshears,storyoverturningmoments,etc.Thesetechniquesalsoallowtounderstandtheinfluenceof theparametersbeinginferred/identifiedonresponseparametersnot measured,providinganimprovedunderstandingoftheseismicresponseofthebuilding.Itshouldbestressedthatmodelspersearenot identifiable,butratherwhatisidentifiedarethebestsetofparameters oftheselectedmodelthatminimizeameasure-of-fitbetweentherecordedresponseandtheresponsecomputedwithamodel.Different parametricsystemidentificationmethodsdifferprimarilyinthenumericalmodelofthebuilding,thedefinitionoftheobjectivefunction usedtoquantifythedifferencebetweenthemeasuredresponseandthat predictedbythenumericalmodel,andthealgorithmemployedto performtheoptimization(e.g., [10–14]).Anotherdifferentiatingfactor ofdifferentsystemidentificationtechniquesiswhethertheinputtothe systemisknownornot.The fieldofExperimentalModalAnalysis (EMA)dealswithmethodsthatrequireknowledgeoftheinputsignal –inthecaseofearthquakeengineering,theinputgroundmotion, – and moststudiesattemptingtoidentifystructuralpropertiesfromearthquakerecordsfallintothiscategory(e.g. [6–8,10,11,15–18]).The field ofOperationalModalAnalysis(OMA)regardsthosemethodswherethe inputsignalisunknown.Recentinvestigationsinthis fieldshowpromisingapplicationstothe fieldofearthquakeengineering(e.g. [19–25]),especiallywhenstrongsoil-structureinteractioneffects – that mightdistorttheinputsignal – areconsidered.
Structuralmodelsareanidealizedmathematicaldescriptionofthe motionofabuilding.Inpractice,severalsimplifyingassumptionsofthe selectedmodel,suchaslinear-elasticity,timeinvariance, fixedconditionatthebase,linearviscousdampingbehavior,etc.,arenotentirely satisfied.Consequently,thenumericalmodelwillneverbeableto perfectlyreproducethemeasuredstructuralresponseeveniftheresponseislinear.Inotherwords,therewillalwaysbeanerrorinthe prediction,introducinguncertaintyaboutthetruevaluesoftheidentifiedparameters.Inadditiontothesystemidentificationmethodused toinferdampingratios,variability(andthereforeuncertainties)ininferreddampingratiosareinfluencebymanyotherfactorssuchasaccuracyofthesensors,limitednumberofrecordsormalfunctionin certain recordingchannels,limiteddurationofresponse,noiselevelin therecordedaccelerationtimehistories,modalresponsenotsufficientlyexcitedornotsufficientlycontributingtothetotalrecorded response,etc.Therefore,foragivenbuilding,identifieddampingratios mayexhibitvariationsfromoneearthquaketoanother,particularlyfor certainmodes.Severalinvestigationshavedealtwiththeuncertaintyof theestimatedparameters,mostofwhicharebasedonaprobabilistic approach.Oneofthe firstworksonthissubjectistheonebyGersch [26],whoemployedtheCramer-Raolowerboundtheoremtodevelop expressionsforthemaximumachievableaccuracyofthemodalfrequenciesanddampingratiosinferredbyamethodbasedonthemaximum-likelihoodestimatesofanauto-regressivemodel [27].Morerecentstudieshavetakensimilarapproaches,leadingtotheconclusion thattheuncertaintyintheidentifieddampingratiosissignificantly largerthanintheidentifiedmodalperiods(e.g., [18,28–30]).Itshould benotedthatthisobservationwas firstmademuchearlierbyseveral researchersusingnon-probabilisticapproaches,suchasMcVerry [5] andBeckandJennings [10]
Asystemidentificationtechniquemayinferanimportantnumberof parametersbyusingrecordedresponse.However,notallinferredvaluesmaybereliable.Forexample,inbuildingstheproductofthemodal participationfactorandmodalshapesdecreasesrapidlywithincreasing mode.Therefore,thecontributionofhighermodestothetotalrecorded responsetendstodecreaseasthemodenumberincreases.Thismeans thatthereisaneedforcut-off criteriaforinferredparametersthatmay notbereliablebecausetheycorrespondtomodesofvibrationthatdo notsignificantlycontributetothetotalresponse.Butunreliableinferred modalpropertiesmayalsooccurforlowermodes.Forexample,insmall magnitudeearthquakesthe firstmodemaynotbesufficientlyexcited, andeventhoughtheproductofthemodalparticipationfactorand
modalshapeforthe firstmodemaybelargethemodalresponsemaybe almostnegligibleorhaveasmallsignaltonoiseratioasnoisetendsto belargerforlowfrequenciesinaccelerationsensorsleadingthesystem identificationtechniquetoinfersomevalues,buttheymaynotbereliable.Inthesecases,inadditiontoquantifyingthevariabilityinthe inferreddampingratiositisnecessarytodiscriminatewhichvaluesare reliableandfromthosewhicharenot.
Thisstudyispartofaninvestigationaimedatevaluatingdamping ratiosinferredfromtheseismicresponseofbuildings.Ina firstpaper, theauthorsevaluatedthedampingratiooftallbuildingsforboththe fundamentalandhighermodesofvibration [8].Thepapershowedthat dampingratiostendtodecreasewithincreasingbuildingheight,and that,onceathresholdlevelofresponseisexceeded,dampingratios remainapproximatelyconstantwithincrementsinseismicresponseas largeare five-orten-fold,providedthatthebuildingremainelasticor nearlyelastic.Inasecondpaper,theauthorsanalyzedalargerdataset ofbuildingsinordertoprovidedampingrecommendationsforhigher modes [7].Thatstudyshowedthatdampingratiosofhighermodesare typicallylargerthanthoseoffundamentalmodesofvibrationandthat dampingratiosofhighermodesincreaseapproximatelylinearlywith increasingfrequency.Thispaperisaimedatdevelopingmetricstoexaminethereliabilityoftheinferredmodaldampingratiosbasedon(1) thecapacityofthegroundmotiontoexcitethemodesbeingidentified; (2) therelativecontributionofthedifferentmodestothetotalseismic response;and(3)thesensitivityofthecomputedstructuralresponseto changesinmodaldampingratios.Basedontheseconcepts,whichare familiartomoststructuralengineers,aseriesofmetricsaredeveloped toquantifythereliabilityofthedampingratios,andtodevelop screeningteststoidentifyinferreddampingratiosthatarenotreliable byimposinglimitingvaluesonthesemetrics.
2.Variabilityinidentifiedparameters
Therearemanyavailabledifferentsystemidentificationtechniques toinferdynamicpropertiesofbuildingsfromseismicrecords.Insome cases,forthesamebuildingandforthesameearthquake,different investigatorsusingdifferentsystemidentificationtechniquesmayresult indifferentresults.Inordertoillustratethissituation,thissection presentsresultsofinferreddynamiccharacteristicsforthreebuildings obtainedbydifferentinvestigatorstoshowthatidentificationof dampingratiosismorechallengingthanidentifyingmodalfrequencies. Pleasenotethatthedetailsofthesystemidentificationtechniques employedbythesedifferentinvestigationsarenotthefocusofthis section.Theinterestedreadercangotothecitedpapersfordetails aboutthem,orto Section3 fordetailsaboutthetechniqueemployedin thisinvestigation.Themainquestionthatisdiscussedinthissectionis thefollowing:Whyidentifyingdampingratiosisharderthanidentifyingperiods?Althoughthisisalsorelatedtotheparticularsystem identificationmethodused,themainreasonisthattheseismicresponse ofbuildingsismoresensitivetochangesinmodalfrequenciesthanitis tochangesinmodaldampingratiosandthereforethereisamuch smallervariabilityinidentifiedmodalfrequenciesthanininferred modaldampingratios.
The firstbuildingcorrespondstothe1900AvenueoftheStars buildinglocatedinLosAngeles,California(Fig.1,left).Thebuilding hasheightof113m,with27-storiesabovegroundlevelandone basement.Ithasarectangularshapeof63mby33m,anditslateral resistantsystemconsistsofsteelmoment-resistingframes.Thisbuildingswasdesignedin1969,andinstrumentedsinceitsconstruction.The structuralresponseduringthe1971SanFernandoearthquakewas capturedbysensorsinthebuilding.Thiswasoneofthe firstbuildings whoseresponsewasrecordedduringanearthquake,soitcapturedthe interestofpeopleworkingonsystemidentificationatthetime.Among theseresearcherswereHartandVasudevan [31],andMcVerry [5],who analyzedthebuildingusingtwodifferenttechniques.HartandVasudevanusedasimplifiedmethodbasedonthepeaksoftheroof-to-
groundtransferfunction,McVerryusedaparametricmodalminimizationtechniqueinthefrequencydomain.Forthisinvestigation,all thebuildingswereanalyzedusingtheparametricmodalminimization methodinthetimedomaindescribedin Section3
ThesecondbuildingtocompareisthePacificParkPlazabuilding, locatedinEmeryville,California(Fig.1,center).Thisbuildingwasbuilt in1983,andhas30storieswithatotalheightof95m.Thebuildinghas aYshapeinplanandhasshearwallsfromthefoundationtothesecond flooratthecentralcoreandatthethreewings.Abovethesecondlevel, thelateralresistantsystemconsistsofductilemomentresistantreinforcedconcreteframes.Thebuildingwasinstrumentedin1985bythe UnitedStatesGeologicalSurvey,with21channelsdistributedinthe 30th,21st,13th,andground floors.Thebuildingwasshakenbythe 1989LomaPrietaearthquake,anditsrecordedresponsehasbeenused byseveralresearcherstoinferitsdynamicproperties.Themostrelevant studiesonthisbuildingcorrespondtoCelebi [16],andSafakandCelebi [15].Bothstudiesuseadiscretetimelinear filtersmethodforsystem identification [12].ReinosoandMiranda [32] alsostudiedthisbuilding usingtheparametricmodalminimizationmethodinthetimedomain, however,theyusedasimplifiedcontinuouscantileverbeammodelas thestructuralmodelandfurthersimplifiedthemodelbyconstraining thedampingratiostobeequalforallmodes,astheywereprimarily interestedinestimatingaccelerationdemandsinbuildingswithonly threeparameters:fundamentalperiod T1 ,dampingratio ξ ,andlateral stiffnessratio α .
ThethirdbuildingisoneofthebuildingsoftheEmbarcadero Center,locatedinthe financialdistrictofSanFrancisco,California (Fig.1,right).Thebuildinghas47storiesabovegroundlevelandtwo basements,withaheightof172m.Thelateralresistingsystemconsists ofsteelmoment-resistingframesinthelongitudinaldirectionanda dualsystemthatcombinesmoment-resistingframesandeccentricallybracedframesinthetransversedirection.Thebuildinghasanapproximatelyrectangularplanshape,withsetbacksinthetransverse directionatlevels39and41.Thebuildingwasconstructedin1978, andinstrumentedin1985with18accelerometerson7levels.Therecordedresponseofthisbuildingduringthe1989LomaPrietaearthquakewasstudiedinthepreviouslymentionedstudiesofCelebi [16], andReinosoandMiranda [32].Itwasalsomorerecentlystudiedby Bernaletal. [18],whousedasubspacemethodtoperformthesystem identification.

Tables1–3 showtheresultsobtainedbyalltheaforementioned investigatorsforthedampingratioandperiodofthefundamentalmode ofallthebuildings – inbothdirections.Thetablesalsoindicatethe differenceintheidentifiedpropertieswithrespecttothoseobtainedin thisinvestigation.Evenwhenthedifferentinvestigationsusethesame data,itcanbeseenthatthereissignificantvariabilityintheresults.The variability,however,isseveraltimeshigherfortheinferreddamping
erencewithrespecttothisinvestigation. Table2 ResultsforPacificParkPlaza.
*Di
ratiosthanfortheinferredfundamentalperiods.Takingtheresults fromthisinvestigationasareference,theaveragedifferenceinperiods isonly1.9%,withastandarddeviationof2.5%.However,fordamping
ratios,theaveragedifferenceacrossbuildingsis64.5%,withastandard deviationof54.9%.Inotherwords,thereisageneralagreementon whatisthefundamentalperiodofthesestructures-withdiscrepancies thatarewithinatolerablemargin-butarelargerdifferencesonthe dampingratios.Moreover,withoutfurtheranalysis,itisnotpossibleto tellwhichofthereporteddampingratiosisclosertothetruevaluefor thedifferentbuildings.
Thereareseveralquestionsthatarisefromthissimplecomparison exercise:Whyitiseasiertoidentifyperiodsthandampingratios? Whichofthesereporteddampingratiosismorereliable?Isitpossible todefineanintervalthatislikelytobracketthetruedampingratioof thebuilding?Thispaperaddressesthesequestions.Thereliabilityis estimatedbasedonthelevelofmodalexcitation,therelativecontributionofthedifferentmodestothestructuralresponse,andonthe sensitivityoftheobjectivefunctiontosmallchangesindampingratio. Metricstoquantifythereliabilityoftheinferreddampingratiosare thendeveloped,andaseriesofreliabilitytestsareproposed.Finally,an exampleofthedifferentreliabilitytestsispresentedusingtheactual recordsofa32-storybuildingsubjectedto8differentearthquakes.
producebetter fitsforsensorslocatedhigherinthebuildingthanthose inthelowerpartofthebuilding.Thesystemidentificationproblem thenconsistsin findingtheoptimalsetofparameters θ ,thatminimize J Inthiswork,alinear-elasticmodel,consideringclassicaldamping (i.e.modeshapesarereal-valuedandorthogonalwithrespecttothe dampingmatrix [33]),andassuminga fixedconditionatthebasewas employed.Sincethemodeliselastic,itsdynamicpropertiesremain constantintime,thatis,weuseatime-invariantsystemidentification. Furthermore,sincethemodelisassumedtohaveaclassicaldamping, thesystemofequationsofmotionscanbedecoupledandthepredicted structuralresponsewascomputedusingmodalsuperposition:
Themodalminimizationmethodisaparametricsystemidentificationtechniquethatconsistsin findingtheoptimalsetofparametersthat willmakeamathematicalmodelofthestructurereproducetherecordedresponsewiththeleasterror.The fitcanbedoneineithertime domain(e.g., [10])orinfrequencydomain(e.g., [11]),withoutsignificantdifferencesintheresultswhenthesamebuildingmodelisused andtheresponseisentirelyelastic.Ifthismethodiscombinedwitha modalresponse-historyanalysis,thenthemodalparametersthatare identifieddirectlycorrespondtothemodaldampingratios,modal periods,andproductsofmodeshapesandmodalparticipationfactors thatanengineershoulduseinordertoreproduceasbestaspossiblethe recordedresponseofthebuilding.Inotherwords,ithastheadvantage thatthemethodofanalysisusedinthesystemidentificationisthesame asthemostcommonlyusedmethodtoanalyzebuildingsincurrent engineeringpractice,thatis,alinearelasticclassicmodalanalysis.For thisreason,itwasthemethodchosenforthisinvestigation.Here,the processwascarriedinthetimedomain,adaptedfrom [10],because whenusedinthefrequencydomainitmayleadtooverestimationof dampingratiosinthepresenceofevenmildnonlinearities,evenifthis occursinashortsegmentoftimeintherecord.
The firststepistodefineamathematicalmodelofthestructure.The secondstepisto findtheparametersthatminimizetheerrorofthe responsepredictedbythismodel.Theobjectivefunction J isdefinedas theleast-squaresdifferencebetweentherecordedrelativeacceleration u andtheonepredictedbythemodel u ,normalizedbytherecorded relativeacceleration:
(1) where θ isthesetofparametersthatgovernthemathematicalmodelof thestructure, Nsen isthenumberofsensorsaboveground, τ isthelength ofthedigitalrecords,and tΔ isthetimestepoftherecords.Thisobjectivefunctionprovidesanoverallmeasureof fitbetweenthecomputedandmeasuredrelativeaccelerationsacrossalltherecordand givingequalweighttoallsensors.Thepurposeofthenormalizationof thesquarederrorateachsensinglocationbyintroducingthedenominatorinEq. (1) istoprovideanequalweighttoeachsensorlocation. Pleasenoticethatifthisnormalizationisnotused,thesystemidentificationwouldconvergetowardparametersthatminimizethedifferencebetweencomputedandmeasuredrelativeaccelerationsinsensor locationsexperiencinglargerrelativeaccelerationswhichtendtoincreasewithincreasingheightandtherefore,ingeneral,wouldtendto
(2) where u t ¨ ( ) j isthepredictedrelativeaccelerationatlocation j attime t ; Γn isthemodalparticipationfactorofthe nth mode, ϕnj isthemode shapeofthe nth modeevaluatedatlocation j ; Nm isthenumberof modesconsideredintheanalysis,and Dt ( ) n istheresponseofasingledegree-of-freedomsystemofunitmass,period Tn ,anddampingratio ξn , whensubjectedtothegroundmotionaccelerationatthebase u t ¨() g . Thereasonforusingthismodelisthatcurrentlyitisthemost commonmathematicalmodelemployedinengineeringpracticeforthe seismicanalysisbuildings.Therefore,theidentificationresultscorresponddirectlytothemodaldampingratiosthatastructuralengineer shoulduseinordertoreproduce,asbestaspossible,themeasured structuralresponsewhenusingthegroundmotionrecordedatthebase asinput.Ifonly Nm modesareconsideredinthestructuralmodel,andif thestructureisassumedtobeatrestat = t 0 ,thentheparametersto identifyaregivenby:
where Tn and ξn aretheperiodanddampingratioofthe nth modeof vibration,respectively; ϕ Γn nj istheproductofthemodalparticipation factorandthemodeshapeofthe nth modeevaluatedatthelocation ofthe j th sensor,respectively.Formoredetailsontheoptimization problem,suchasinitialsetofparameters,oroptimizationconstraints, thereaderisreferredto [8]
4.BuildingLA-32:exampleofanactualbuildingsubjectedto severalearthquakes
Thissectiondescribesa32-storyresidentialbuildinglocatedin downtownLosAngelesthatwillbeusedasanexampleinthesubsequentsections.ThebuildingismonitoredbytheCaliforniaStrong MotionsInstrumentationProgram(CSMIPstationNo.24288)andwas selectedbecauseithasbeenshakenbymultipleearthquakes,butalso becauseitsseismicresponsehasanimportantcontributionfromhigher modes.Therefore,itprovidesanopportunitytoassessthereliabilityof dampingratiosofhighermodesinferredfromdifferentearthquakes. Thebuildingbasedimensionsare38mby27m,andhasatotalheight of103m.Theverticalcarryingloadsystemiscomposedoflightweight concreteslabs,supportedbysteelbeamsandcolumns.Thelateralload resistantsystemconsistsofsteelmomentresistantframeslocatedinthe perimeterofthebuilding.Althoughthebuildingwasdesignedin1967, itscurrentdigitalinstrumentationsystemwasinstalledin2005.The systemcomprises16accelerometersat5differentlevelsinthebuilding, andhasrecorded8differentearthquakes. Fig.2 showsschematicsof thebuildingandthelocationofthedifferentsensors.Duetospace limitations,onlytheresultsfortheEWref directionarediscussedhere.
Table4 showstheyear,magnitude,distancetoepicenter,andpeak groundaccelerationintheEWref directionofthedifferentearthquakes recordedbythisstation.
3.Systemidentification:parametricmodalminimizationinthe timedomain5.Reliabilitymetricsandscreeningtests
Tobeabletoidentifyanyparameterofthestructuralmodel,suchas amodaldampingratio,thentheparameterhastohaveanoticeable influenceinthemeasuredstructuralresponse.Inotherwords,itisnot possibletoreliablyestimateaparameterrelatedtoanaspectofthe dynamicresponsethatisnotclearlyobservable.Therefore,thereliabilityoftheidentifieddampingratioof,say,the nth mode,will dependonthelevelofcontributionofthe nth modetothetotal structuralresponse.Dampingratiosofmodesthatcontributesignificantlytothedynamicresponseofthestructurewillbeeasierto identifythanthosefrommodesthatcontributelesstothetotalresponse.Moreimportantly,understandingwhichmodesareprimarily participatinginthestructuralresponseallowstoquestionthereliability oftheidentifiedparametersofthemodesthatarenot.Asystemidentificationmethodwillyieldparametersofasmanymodesasspecified bytheuser,thatis,theparametersthatminimizetheobjectivefunction,butsomeoftheidentifiedparametersmaynotbereliableasthey maynotcorrespondtothoseinthestructure.Forexample,iftheseismic responseofagivenbuildingisprimarilygovernedbythe first3modes butthestructuralmodelemployedintheidentificationconsidered10
modes,thedampingratiosbeyondthethirdmodemaynotbereliable.
Thisinvestigationproposes3metricstomeasurethereliabilityof dampingratiosinferredfromtheseismicresponseofbuildings.These metricsevaluate3differentaspectsthatdeterminehowmuchamodeis participatinginthestructuralresponse.The firstmetric,namelythe DynamicAmplificationFactors,measuresthecapacityoftherecorded groundmotiontoexcitethe firsttwomodesofthebuilding.Thesecond metric,calledtheAriasModalContribution,measurestherelative contributionofthemodesincludedinthestructuralmodeltothetotal structuralresponse.Finally,thethirdmetric,ReliabilityIntervals, measuresthesensitivityoftheresponsetochangesinmodaldamping ratio,providinganintervalofdampingratiosthatislikelytobracket thetruedampingratioofthebuilding.

Oncethesemetricsarecomputedforalltheidentifiedmodal dampingratios,theycanbecomparedtothresholdvaluesthancanbe usedtoestablishscreeningtests.Ifallthemetricsarewithinacceptable values,andthereforepassallthreescreeningtests,thenthedamping valueisdeemedtobereliable.Thesubsequentsectionsexplainthe differentreliabilitymetricsandtheircorrespondinglimitingvaluesto beusedasscreeningtests.Pleasenotethatthesethresholdsarearbitrary.Theyweredefinedaftertheinspectionofnumerousdamping ratiosinferredfrommultiplebuildingsandearthquakes,butother limitingvaluescouldbeused.Aswithotherlimitingcriteria,thereisa tradeoff betweenusingarelaxedcriteriathatkeepsmoredatabutless reliable,andastricterthresholdthatyieldlessbutmorereliableresults. Thelimitsproposedinthisinvestigationweredefinedtohavestricter limitingvalues,asitwasdecidedthatitwasbettertorejectmodal dampingratiosthatmightbecorrectthantoacceptdampingratiosthat areincorrect.
Therearemanyotherfactorsthatareknowntoaffectthevariability oftheidentifieddampingratios,suchastheparametersinvolvedinthe digitalprocessingofthesignals,thetimewindowemployedtoperform theidentification,orerrorsinherenttothesystemidentification
Fig.2. BuildingschematicsandsensorlocationsforLA-32(after [34]). Table4techniqueemployed.Theinfluenceofthesefactorscanbefoundon severalotherinvestigationsonthesubject(e.g. [13,35–37]).Themetricsproposedhereinaimtoevaluatethereliabilityofdampingratios fromtheperspectiveofhowmuchamodeisparticipatinginthe structuralresponse,allothervariablesbeingequal.
5.1.Dynamicamplificationfactors
Itcanoccurthatanearthquakeisnotcapableofsignificantlyexcitingthe first,orsometimeseventhesecondmodeofabuilding,butit canstillexciteitshighermodesenoughtoinfertheirdampingratios. Forexample,forbuildingsonrockor firmsoils,therearetypically muchlargerspectralordinatesforperiodslessthan1sthanthoselarger than1s.Therefore,thedynamicresponseoftallbuildingstothiskind ofgroundmotionswillhaveasignificantcontributionofhighermodes, butaverysmallparticipationofthe first(andsometimesthesecond) mode.Thus,theparametersinferredforthe firstmodemaynotbereliable.
TheDynamicAmplificationFactors, Rn ,areareliabilitymetricthat areparticularlyeffectiveatquantifyingthelevelofexcitationofthe firsttwomodes.Itprovidesameasureoftheamplificationof1%damped floorspectralaccelerationordinatesaveragedinthevicinityof themodalperiodinquestionforthemotionrecordedattheroofwith respecttothoseofthemotionrecordedatthebaseofthebuildingas follows:
= R ST ST () () n arn abn (4)
where ST ( ) arn and ST ( ) abn aretheaverageofthe1%-damped floor spectralaccelerationordinatesofthemotionsrecordedattheroofand atthebaseofbuilding,respectively,withintheperiodrangedefinedby TT [0.9,1.1] nn ,plus0.01g.Thespectralaccelerationordinatesarecomputedusingaperiodinterval = TΔ 0.01 s.Thepurposeoftheincrement ofthespectralordinatesin0.01gistoavoidexcessivespectralratios whenvaluesareclosetozerointhedenominator.Althoughthismetric couldbeappliedtoanyothermodeofvibration,itwasfoundthatitwas particularlyusefulindiscriminatingreliablemodaldampingratiosof the firstandsecondmode.Forhighermodes,othermetrics,explained inthenextsectionswereshowntobebetter.Aftercarefulevaluationof variousalternatives,thecut-off criteriafor Rn wasestablishedtobe:
≥ R 2.2 1 (5)
≥ R 1.6 2 (6)
Fig.3 showstheroofandbase1%-dampedresponsespectraforall theearthquakesrecordedbybuildingLA-32initsEWreferencedirection.The figureindicatesthecomputed Rn valuesforeachearthquake. Also,theperiodwindowsthatdefine R1 and R2 havebeendelimited withverticaldashedlines,andtheroofandbasespectrawithinthese windowshavebeencoloredtohighlighttheamplificationofthespectralordinatesforthe firsttwomodes.Fromthe figure,itcanbeseen thatthegroundmotionsthatcausedadynamicamplificationfactorfor the firstmodelargerorequalthan2.2correspondtothe2010Borrego Springs,2010Calexico,2008ChinoHills,and2014LaHabraearthquakes.Theaveragefundamentalperiodidentifiedundertheseearthquakesis2.90s.Undermostearthquakes,theperiodwindowcorrespondingtothe firstmodeiscenteredroughlyat2.90s,exceptfor2012 LAAirportand2010WhittierNarrowsearthquakes,inwhichthe identifiedperiodsforthe firstmodewere1.82sand2.32s,respectively, andtheidentifieddampingratiowas30%inbothcases.Notethat30% correspondstotheupperboundoftheidentificationprocess,meaning thattheoptimizationalgorithmwillnotlookfordampingvalues greaterthan30%.Evidently,the firstmodeisbarelygettingexcited underthesetwogroundmotionsandthereforetheperiodsanddamping ratiosobtainedarenotcorrect.Thevaluesof R1 forthesetwoearthquakesare1.01and1.10,respectively,whicharewellbelowthe
thresholdof2.2,indicatingthatthedampingratiosobtainedforthe firstmodearenotreliable.
5.2.Ariasmodalcontribution
Theseismicresponseofabuildingcaninmostcasesbecorrectly reproducedbyconsideringonlyasmallnumberofmodes(e.g., [32,38]).Ifthestructuralmodelemployedinthesystemidentification problemshowninEq. (1) considersmodesthathaveanegligiblecontributiontotheseismicresponse,thentheresultsobtainedforthese modesmaynotbereliable.Thus,measuringtherelativecontributionof thedifferentmodestothecomputedseismicresponseatthedifferent instrumentedlevelsinthebuilding,andestablishingaminimumcontributionasacut-off criteriacanprovideawaytodetectdampingratios thatmaynotbereliable.Tothispurpose,theAriasmodalcontribution factor, MCn ofagivenmode(say,the nth mode)wasdefinedasthe relativecontribution,measuredintermsoftheAriasintensityofthe signal,ofthe nth modalresponsewithrespecttothatcalculatedwith Nm modes.Mathematically, MCn iscalculatedasfollows:
where MCn istheAriasmodalcontributionofthe nth mode; uij isthe relativeaccelerationcomputedforthe i th modeofvibrationat floor j ; tΔ isthedigitizationtimestepoftherecord; Nm isthetotalnumberof modesconsideredinthestructuralmodel; Nsen isthenumberofsensors abovegroundlevel;and τ isthenumberofdatapointsintherecord.As notedbyChopra [39] sd,modalparticipationfactors,bythemselvesdo notprovideinformationabouthowmuchaparticularmodeiscontributingtothetotalresponse.Pleasenotethatunlike,themodal contributionfactorsproposedbyChopra,thatcorrectlyaccountforthe factorsinthestructurethatcontributetothetotalresponse,theArias modalcontributionusedhereaccountforfactorsbothinthestructure andinthegroundmotionthatmakethecontributionofeachmodal responsetotheresponseparametersbeingmeasured.
Asanexample, Fig.4 showsthedeaggregationofthedifferent modalcomponentsofthecomputedrelativeaccelerationattheroofof buildingLA-32 – describedin Section4 – whensubjectedtotheEW componentofthe2008ChinoHillsearthquake.Forthiscase,itcanbe seenthatattheroofthethirdmodeprovidesthehighestrelativecontributiontotheresponse,followedbythesecond,fundamental,and fourthmodes.Thecontributionofthe fifthmodeisconsiderablysmaller thantherestofthemodes,butitisslightlylargerthan5%sothismode wouldbetakenintoaccount.Thesixthmode,however,contributesless than5%sotheinferreddampingratioforthismodewouldbediscarded inthiscasesincetheircontributiontothetotalresponseisrelatively small.PleasenotethattheAriasmodalcontributionsarecomputed consideringallthesensorsinthebuilding,notjusttheroof,butinthe figureonlytheroofresponseisdisplayed.Evenwhenthe fifthmode maynotbeseemtobecontributingtotheresponseattheroof,itmay becontributingtotheresponseinotherlocationsduetothedistribution ofthesensorsalongtheheightofthebuilding.Also,themodalcontributionswillbeaffectedbytheintensityandfrequencycontentofthe earthquakesothedifferentmodalcontributionswillchangefrom earthquaketoearthquake.
5.3.Sensitivityoftheobjectivefunction
5.3.1.Reliabilityintervals
Intheprevioussectionsithasbeenshownthatthevariabilityinthe identifieddampingratiosissignificantlyhigherthanthevariabilityin theidentifiedperiods.Inordertounderstandwhythisoccurs,itis necessarytoanalyzethesensitivityoftheobjectivefunctiontosmall variationsinperiodsanddampingratios. Fig.5 showsthevariationof theobjectivefunctionwithchangesinthefundamentalperiodandwith
0.15
0.10
0.20 2010 Borrego Springs T [s]
0.30
0.20
S a [g] Roof Base R1 = 2.22 R2 = 3.91 0 1 2 3 4 0.00
0.40 2010 Calexico T [s]
0.10
0.80
0.60
0.40
0.20
S a [g] R1 = 7.43 R2 = 3.77 0 1 2 3 4 0.00
1.00 2008 Chino Hills T [s]
0.15
0.10
S a [g] R1 = 5.14 R2 = 4.32 0 1 2 3 4 0.00
0.20 2014 Encino T [s]
0.05
0.15
0.10
0.05
0.20 2009 Inglewood T [s]
0.30
S a [g] R1 = 1.35 R2 = 2.06 0 1 2 3 4 0.00
0.20
S a [g] R1 = 1.88 R2 = 2.56 0 1 2 3 4 0.00
0.40 2014 La Habra T [s]
0.10
0.15
0.10
0.05
0.20 2012 LA Airport T [s]
S a [g] R1 = 1.10 R2 = 2.18
0.15
0.10
S a [g] R1 = 1.01 R2 = 1.12 0 1 2 3 4 0.00
S a [g] R1 = 4.52 R2 = 4.28 0 1 2 3 4 0.00
0.20 2010 Whittier Narrows T [s]
Fig.3. Roofandgroundaccelerationresponsespectrum(ξ =1%)fortheE-WdirectionofbuildingLA-32forallearthquakesrecordedbythisstation.
valueof J neartheminimumofthefunction,spacedatincrementsof 1%oftheminimumvalueof J .Itcanbeseenthat,neartheminimum, thecontoursareapproximatelyshapedaselongatedellipses,withtheir majoraxisorientedinthedirectionofdamping.Thecontourlevelthat is1%higherthantheminimumvalueofthefunctiondelimitsintervals indampingratiosandperiods,whichareshowninsegmentedlinesin 0.05
0.05
C.Cruz,E.Miranda EngineeringStructures184(2019)355–368 361
Fig.6.Anyvariationindampingratioorperiodbeyondoutsidethis contourwillcauseanincrementgreaterthan1%inthevalueofthe objectivefunction.Inthe figure,itcanbeseenthattherangeofperiods withinthiscontourcurveisapproximatelyfrom2.81to2.89s,andthat thedifferencebetweenthesetwoperiodsisjust0.08s,indicatingthat thecorrectvalueofthefundamentalperiodiswithin0.04sof2.85s,in otherwords,withinanerrorof ± 1.4%.Ontheotherhand,therangeof dampingratioswithinthe1%contourcurveisapproximatelyfrom 1.1%to3.4%,andthewidthofthisrangeisabout2.3%,indicatingthat thecorrectvalueofthedampingratioiswithin 0.9%and+1.4%of 2.0%,whichcorrespondstoanerrorof 45%and+70%.Inother words,incrementingthevalueofthefundamentalperiodby0.04s,an incrementofjust1.4%,producesthesamevariationintheobjective functionaswhenincreasingthedampingratioofthe firstmodefrom 2.0%to3.4%(anincrementof70%).Therefore,forthesameeffecton theobjectivefunction,anerrorintheidentificationofthedamping ratiocanbesignificantlyhigherthanthatofthefundamentalperiod.
ThelargersensitivityoftheobjectivefunctiondefinedbyEq. (1) to
changesinmodalperiods/frequenciescomparedtothatproducedby changesinmodaldampingratios,asillustratedin Fig.6,ispartlyinherentintheselectionofthisobjectivefunction.Ifagiventrialofa modalperiodisinaccurate(i.e.,itisshorterorlongerthantheoptimum parameter),anditisusedincombinationwiththeoptimal/correct modaldampingratio,thenthecomputedrelativeacceleration u t( ) j will beoutofphasewithrespecttothemeasuredrelativeacceleration u t ¨() j notonlythroughoutthewholehistoryoftherecordsbutalsoinall sensors,leadingtoalargeincrementintheobjectivefunction.Meanwhile,forlightlydampedstructures,whenusinganinaccurateestimate ofamodaldampingratiocombinedwithanaccurateestimateofa modalperiodthecomputedandmeasuredresponseswillbeinphase butwiththeincorrectamplitude.Thiswillleadtoamuchsmallerincrementintheobjectivefunctionthantheoneproducedbyaninaccuratemodalperiod.Thisexplainswhythevariabilityindamping ratiosinferredfromdifferentearthquakescanbesignificantlyhigher thanthevariabilityintheinferredperiods.Thewidthoftheseintervals canbeusedtomeasurethereliabilityoftheinferreddampingratios
functionforthedampingratioandperiodofthe firstmodefortheLA-32 buildingunderthe2010BorregoSpringearthquake,intheEWdirection.The starindicatesthelocationoftheminimumvalueoftheobjectivefunction.
sinceitisameasureoftheslopeoftheobjectivefunctionproducedby changesinthe i th modaldampingratio.Moreformally,thiswidthis ameasureofthepartialderivativeoftheobjectivefunctionwithrespecttothemodaldampingratiointhevicinityofthemodaldamping ratioproducingtheminimumintheobjectivefunction.
Table5 liststheidentifieddampingratios,reliabilityintervallimits, andintervallengthsforthe firstmodeobtainedforalltheearthquakes recordedinbuildingLA-32. Fig.7 showsthevariationoftheobjective functionwithchangesinthedampingratioofthe firstmodeintheEW directionwhilekeepingalltheotherparametersconstantandequalto theiroptimalvalues.Itcanbeseenthatthesensitivityoftheobjective functiontochangesinthedampingratioofthe firstmode,asmeasured bythereliabilityintervals,changesconsiderablyfromearthquaketo earthquake.Thesmallestreliabilityintervalwasobtainedunderthe 2010Calexicoearthquake(ξ1 =2.0%),indicatingthatthedamping ratioofthe firstmode,underthisspecificgroundmotion,hasthelargesteffectintheobjectivefunctionandthereforeisthemostreliable
Table5
Identified firstmodedampingratios,reliabilityintervallimits,andinterval lengthforalltheearthquakesrecordedinbuildingLA-32-EW.
Earthquake ξ1 [%] ξLower [%] ξUpper [%]Intervallength[%]
2010BorregoSprings2.01.13.32.2
2010Calexico2.01.92.00.1
2008ChinoHills2.41.93.01.1
2014Encino3.50.814.613.8
2009Inglewood2.31.34.22.9
2012LAAirport30.0* 19.7Capped –
2014LaHabra2.01.72.50.8
2010WhittierNarrows30.0* 10.3Capped
*30%wassetasanupperbound,alldampingratioslargerthan30%are consideredtobeunreliable.
estimationofthedampingratioofthestructure.Fromthe figure,there isanevidentcorrelationbetweenthelengthofthereliabilityinterval andtheconsistencyintheobtaineddampingratios.Forexample, dampingratiosobtainedunderearthquakeswithanintervallength smallerthan3%,inascendingorderare:2.0%dampingforthe2010 Calexico,2.0%forthe2014LaHabraevent,2.4%forthe2008Chino Hillsevent,2.0%forthe2010BorregoSpringsevent,and2.3% dampingforthe2009Inglewoodevent.Fromtheseresults,itcanbe concludedthatthedampingratioofthestructureisbetween2.0%and 2.4%.Theoppositeistrueforthoseearthquakeswithwidereliability intervals:3.5%(2014Encino),and30%(2012LAAirportand2010 WhittierNarrows),wheretheobjectivefunctionisnotverysensitiveto changesinthedampingratioofthe firstmodeandthereforeleadingto lesscredibleresultswithahigherdispersion.Thereliabilityintervals arerelatedtoboththelevelexcitationandtotherelativecontribution ofthemodebeinganalyzed.Ingeneral,modeswithlow MC valueswill tendtohavewidereliabilityintervals,whilemodeswithhigh R values willtendtohavenarrowerintervals.
5.3.2.Enhancedreliabilityintervals
Theprevioussectiondescribedamethodtoquantifythereliability oftheinferreddampingratiosbymeasuringthesensitivityoftheobjectivefunctiontosmallvariationsinthemodaldampingratios. However,inmostcasestheobjectivefunction,asdefinedinEq. (1),will bemoresensitivetoparametersthatgovernthefundamentalmode thanthosethatcontrolhighermodessimplybecausethefundamental modetypicallyhasalargercontributiontotheresponse.Therefore,itis necessarytoalsohaveaparameterthatismoresensitivetothespecific responseofthemodebeinganalyzed,ratherthantothesumofall modes.
Toobtainreliabilityintervalsthataremoresensitivetotheresponse ofhighermodes,itisnecessarytoredefinetheobjectivefunctionin ordertomakeitmoresensitivetosmallvariationsofmodaldamping ratiosinhighermodes.Awaytoachievethisistoperformanadditional systemidentificationwithasingleparametertobeidentified,correspondingtothedampingratioofthemodewhosereliabilityisbeing measured.Alltheotherparameters – periods,dampingratiosandmode shapes – arekeptconstantandequaltothoseinitiallyidentified.Since thereisonlyonevariableinvolvedinthisadditionalsystemidentificationschemeonlyoneoutputsensorlocationisrequired.Therecorded responseattheroofisselectedbecauseitalwayscontainsinformation abouthighermodes,avoidingpossiblenodelocations,andbecause practicallyallbuildingshavesensorslocatedattheroof.Toisolatethe contributionofthemodebeinganalyzed,theresponseattheroofwas filteredusingabandpass filterthatremovesthefrequencycontentof thesignalthatisnotwithinthevicinityofthemodalfrequencyidentifiedforthisparticularmode.Forthesamereason,thegroundmotion recordwasalso filteredwithinthesamefrequencyrange.Usingthe filteredgroundmotionasinput,anoptimizationroutinewasemployed to findthedampingratiothatwouldmakethesystembestreproduce

the filteredresponseattheroof.Pleasenotethatthisequivalentto findingthedampingratioofanSDOFsystemwithperiod Tn subjectedto the filteredgroundmotion,andhavingitsresponseamplifiedby ϕ Γn nroof ,thatwouldbestreproducethe filteredrecordedresponseatthe roof,where Tn and ϕ Γn nroof correspondtotheidentifiedperiodandeffectivemodeshapeattheroofforthemodebeinganalyzed.Theobjectivefunctionofthissimpleidentificationprocesswasplottedagainst themodaldampingratio,andanewreliabilityintervalwascomputed. Sincethereisonlyonevariableinvolved,theobjectivefunctionisnow verysensitivetochangesinthedampingratio.Forthisreason,the boundariesforthisnewintervalsweresetasthosedampingvaluesthat causeavariationoflessthan50%ofthisnewobjectivefunction,insteadoftheprevious1%.Thisintervalisdefinedastheenhancedreliabilityinterval(ERI)oftheinferreddampingratio.Notethatthe aforementionedprocedurewasonlyusedtoquantifythereliabilityof thedampingratiosidentifiedoriginally.Adetailed,step-by-stepguide onhowtocomputetheenhancedreliabilityintervalsisdetailedbelow.
5.3.3.Stepstocomputetheenhancedreliabilityintervals
i. Performthesystemidentification
Theidentificationwasdoneusingtheparametricminimization methoddescribedin Section3.Thenforeachoftheidentifiedmodal dampingratios,steps2to6werefollowed.
ii. Definethebandpass filter’scornerfrequencies
Thelowerandupperfrequencies( fL and fU ,respectively)ofthe bandpass filterweredefinedas:
fn istheidentifiedfrequencyofthe nth mode( = f T 1 n n ),and fL1 and fUNm aretheloweranduppercutoff frequenciesforthe firstand lastmodesbeingconsidered,respectively.
iii. Filtertherecordedgroundmotionandtherecordedaccelerationattheroof
AButterworthdigital filteroforder3,withpassband << f ff L U wasappliedtothegroundandroofaccelerationrecords.These filtered recordsatground g () androof R () levelsarefurtherreferredas ugF and uRF ,respectively.
iv. ComputetheresponseofanequivalentSDOF
Theresponseofanequivalentsingle-degree-of-freedomsystemwith period Tn anddampingratio ξn subjectedtothe filteredgroundmotion accelerationrecordwascomputed.Theresponsewastheamplifiedby theidentifiedeffectivemodeshape ϕ Γn nroof ofthemodebeinganalyzed. Thisresponseisdenotedas uR F .

v. Defineandsolvethesecondaryoptimizationproblem
Thesecondaryoptimizationproblemisdefinedbythefollowing
objectivefunction:
(12) where τ isthenumberofpointsintherecords,and tΔ isthetimestep. Giventhesmallnumberofparametersinvolved,thesolutiontothis problemisextremelysimpletoobtain,asitcanbequicklysolvedbythe followingbrute-forceapproach.Tosolveit,thedampingratio ξn ofthe SDOFsystemwasvariedoverawiderangeofvalues.Foreachvalueof ξn theobjectivefunctionofthesecondaryoptimizationproblem Js was evaluatedusingEq. (12).Theoptimalvalueof ξn wasfoundasthat minimizesthevalueof Js
vi. Computetheenhancedreliabilityinterval
Thevaluesof Js computedinstep(v)werenormalizedbyits minimumvalue Jsmin .Theenhancedreliabilityintervalswerethen computedastherangeofdampingratiosthatcaused Js tovaryinless than50%ofitsminimumvalue.
5.3.4.Maximumallowableenhancedreliabilityintervals
Theenhancedreliabilityintervals(ERI)quantifythecontributionof eachmodetothestructuralresponsebymeasuringthesensitivityofthe objectivefunctiontosmallvariationsofthemodaldampingratios.In thisscreeningtest,amaximumlengthoftheenhancedreliabilityintervalwasestablishedtodeterminewhichdampingratioswouldbe consideredinfurtheranalyses.Sincehighermodesinmostcaseswill haveasmallercontributiontothetotalstructuralresponse,thesensitivityoftheobjectivefunctiontomodaldampingratioswilltypically decreasewithmodenumber.Consequently,themaximumallowedintervallengthwassetasafunctionofthemodalfrequency.Sincelowrisestructurestendtohavehigherfundamentalfrequencies,thecutoff forthefundamentalmodewassettobestricterthanforhighermodes. ThemaximumallowedERIlengthsareshownin Fig.8.Pleasenotethat thelengthmeasuresthedifferencebetweenthedampingratiosthat causeanincrementof50%oftheminimumvalueontheobjective functionofthesecondaryoptimizationproblem Js definedinEq. (12), thereforetheintervallengthhasthesameunitsthanthedampingratio (i.e.,non-dimensionalorpercentage).Onlythedampingratiosof modeshavinganenhancedreliabilityintervallengthsmallerthanthe maximumallowedlimitswereconsideredinfurtheranalyses.
6.Example
Thissectionprovidesanexampleofhowthedifferentreliability screeningtestsareappliedaftertheinitialsystemidentificationresults areobtained.Forthisexample,theEWdirectionofbuildingLA-32 –describedin Section4
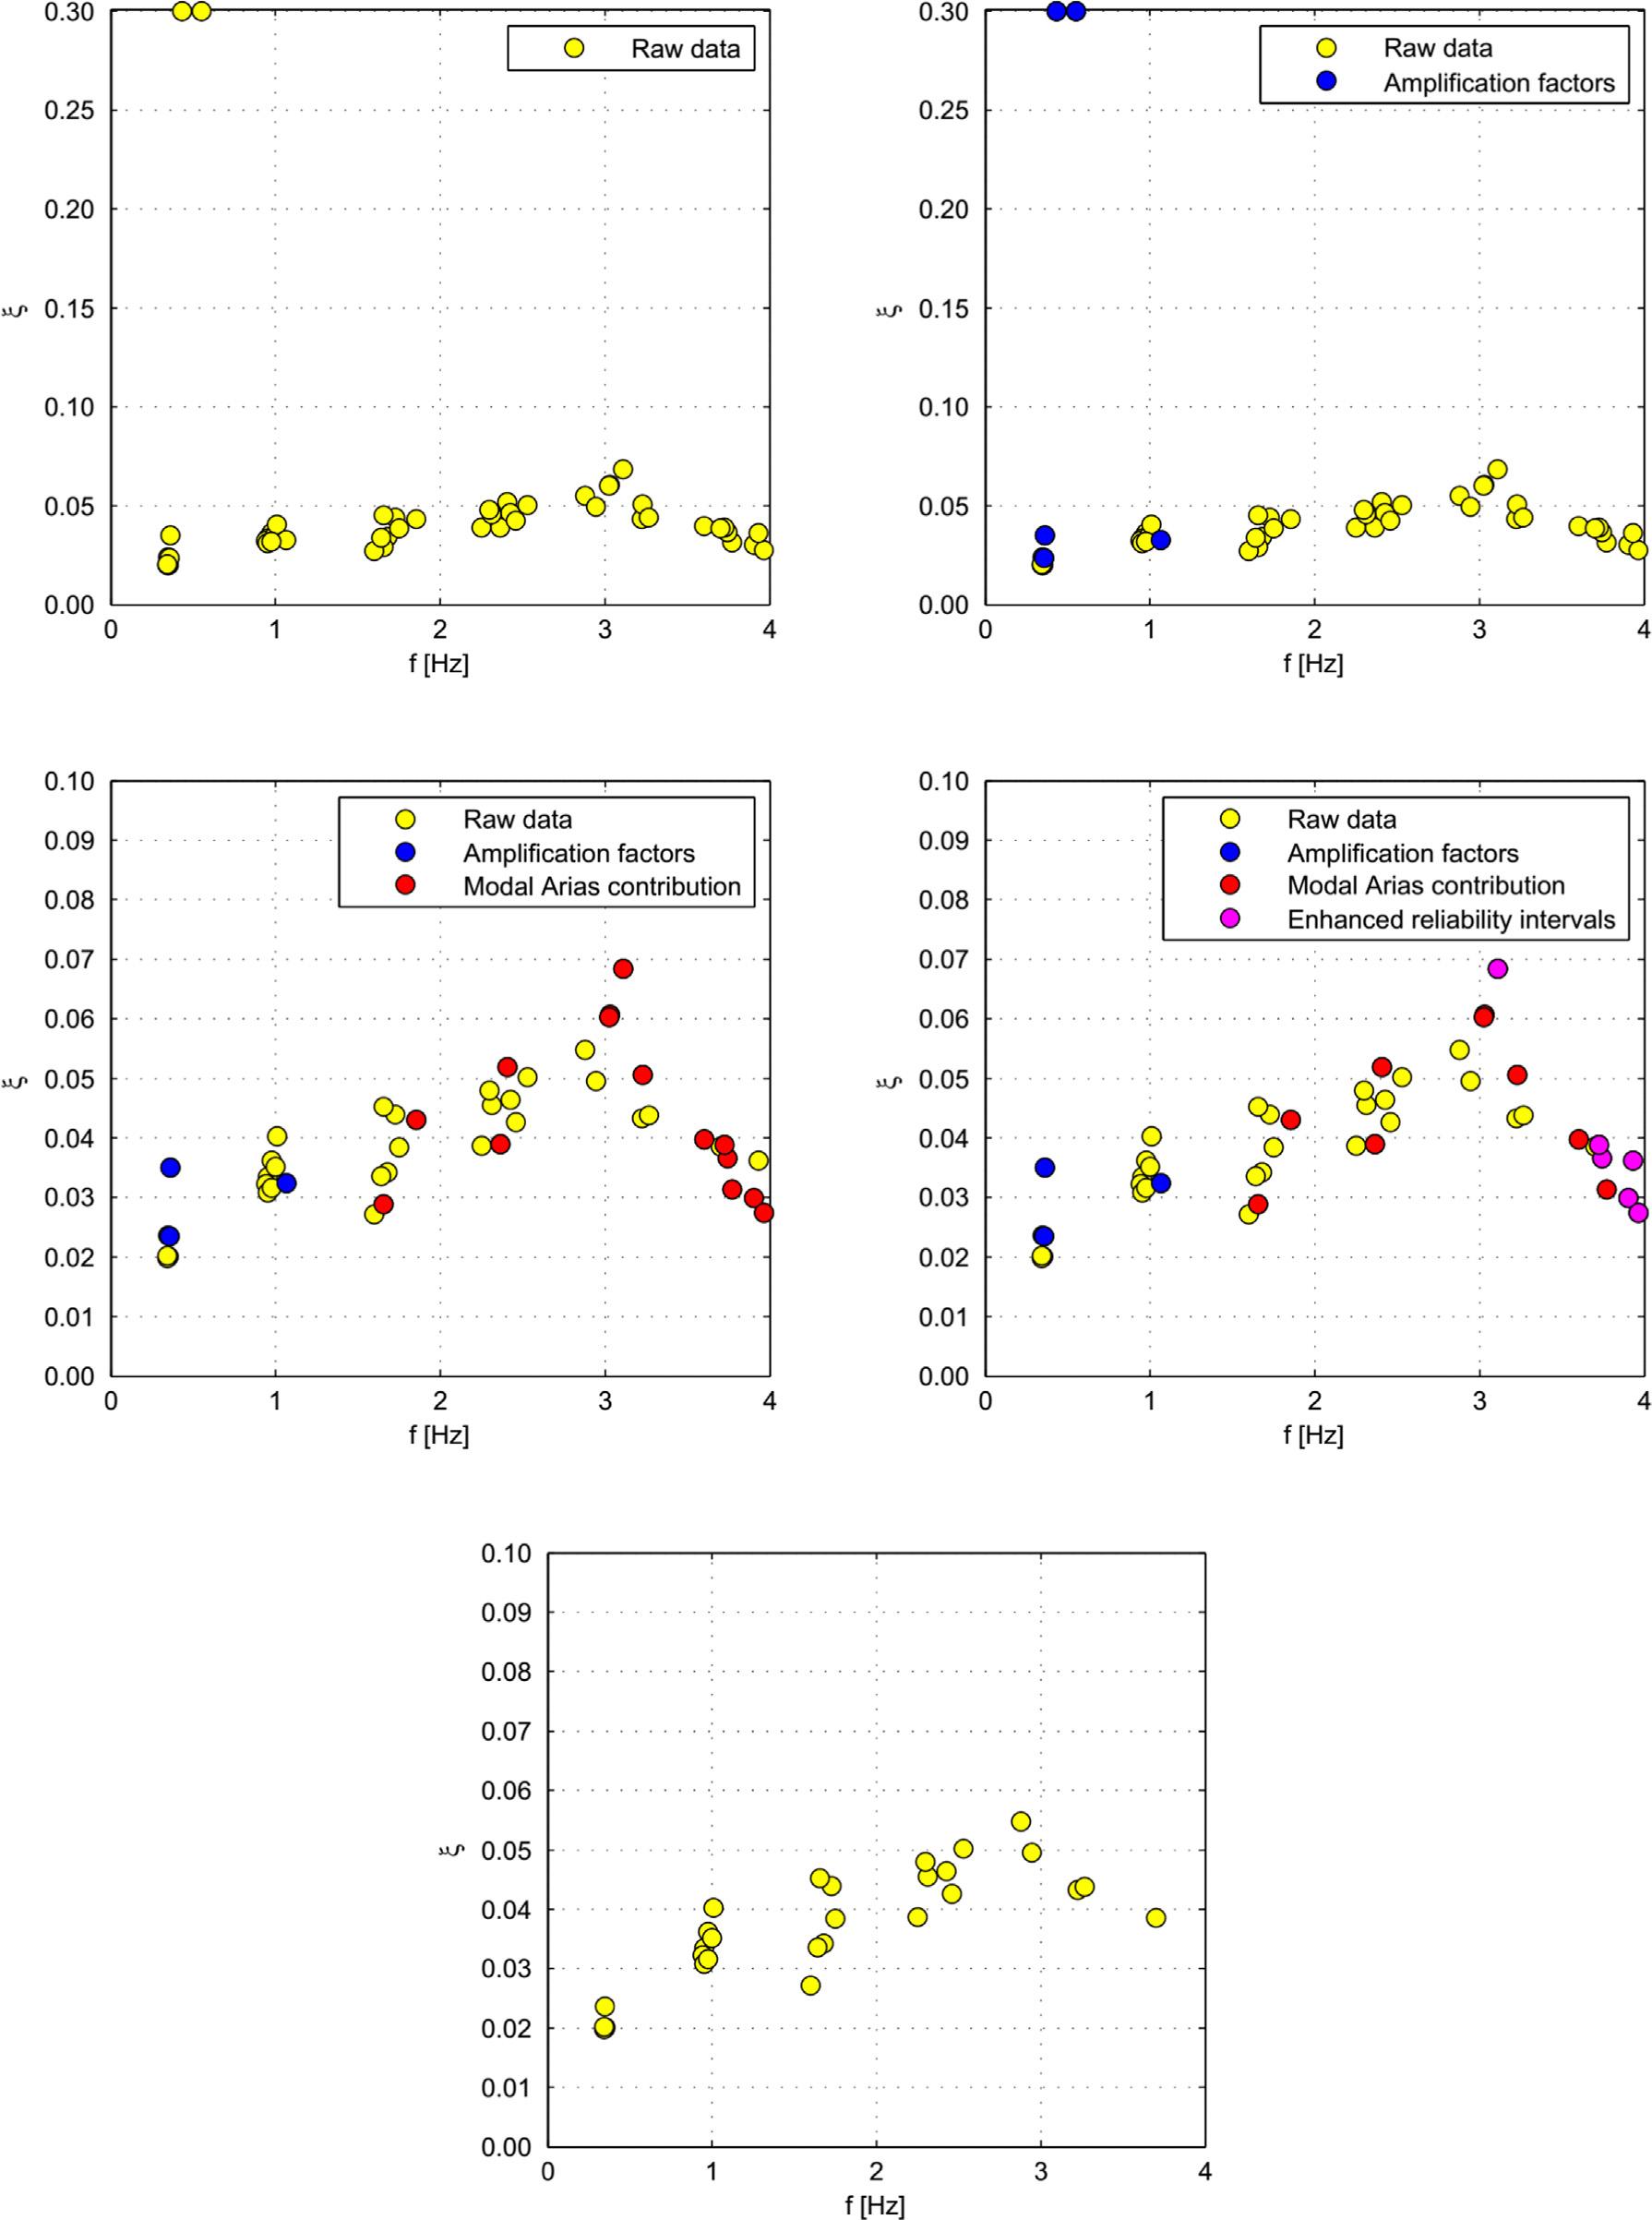
isused.Thedynamicpropertiesofthebuildings wereinferredusingtheparametricminimizationmethodalongwitha planarmodelofthebuilding.Theresultsoftheidentificationforallthe differentearthquakescanbeseenin Fig.9,whichplotstheidentified modaldampingratiosagainsttheircorrespondingmodalfrequencies. Theidentifiedmodalperiods,frequencies,anddampingratios,aswell astheircorrespondingamplificationfactors(R),Ariasmodalcontributionratios(MC),andenhancedreliabilityintervallengths(ERI), arelistedon Table6.
Fig.9ashowstherawdataobtainedfromtheidentification.Itcan beseenthatthereareclustersofdatapoints,correspondingtothe dampingratiosatthedifferentmodalfrequencies.Atabout0.5Hz, however,therearetwopointswithdampingratiosof30%,whichwere obtainedforthe2010WhittierNarrows,andforthe2012LAAirport earthquakes.Asmentionedin Section5.1,thisdampingvaluecorrespondstotheupperboundoftheidentificationprocess,meaningthat theoptimizationalgorithmwillnotlookfordampingvaluesgreater than30%.Obviously,thesetwovaluescannotcorrespondtothetrue

valueofthedampingratioofthefundamentalmode,astheyaremost likelythebyproductofthelowsensitivityoftheobjectivefunctionto variationsinthedampingratioofthefundamentalmodeforthose particularearthquakesbecausethefundamentalmodeispracticallynot excitedandatthefundamentalfrequencythebuildingexperiencesan almostrigid-bodybehavior.Thesetwoearthquakesarenotcapableof excitingthefundamentalmodeenoughtoinferareliabledamping valueoutoftherecords. Fig.9bshowsthesameinformationas Fig.9a, butinthiscasethosedatapointsthatdonotpasstheamplification factorreliabilitytestsarehighlightedinblue.Itcanbeseenthatthetwo aforementionedoutliersarecorrectlyidentifiedasnotreliableand screenedoutbythisreliabilityscreeningtest.Moreover,thedynamic amplificationfactorsscreeningtestalso filtersouttwomoredamping ratiosfromthefundamentalmodeandonefromthesecondmode – this isbetterappreciatedin Fig.9c,whereresultsareplottedatareduced verticalscale – significantlyreducingthevariabilityintheresultsofthe fundamentalmode. Fig.9calsohighlightsinred1 thosedatapointsthat donotpasstheAriasmodalcontributionscreeningtest.Thisscreening testidentifiesalltheresultsofallthosemodescontributinglessthan5% ofthetotalstructuralresponse.Itcanbeseenthatthisscreeningtest reducesthedispersionobtainedforthe fifthmodeandeliminatesalmostallthedatapointsobtainedforthesixthmode,mostofwhich visuallyappearstrange. Fig.9dhighlightsinmagentaallthosepoints thatdonotpasstheenhancedreliabilityintervalscreeningtest.Itcan beseenthatthistestremovesthereminderofpointscomingfromthe sixthmode,butone.Althoughnotshowninthe figure,thislasttestalso rulesouttheaforementioned30%dampedpointsforthefundamental mode.Finally,onlythosepointsthathavepassedallthereliability screeningtestsarereported(Fig.9e).
7.Summaryandconclusions
Thispaperevaluatedthereliabilityofmodaldampingratiosinferredfromthemeasuredseismicresponseofbuildingsusingparametricsystemidentificationmethods.Itwasshownthatdifferentauthorsoftenreportdifferentidentifiedvaluesforbuildingsbeing analyzedunderthesameearthquake,thatis,usingthesamedatabut usingdifferentidentificationmethods.Thesedifferencesweresignificantlylargerinthereporteddampingratiosthaninthereported modalperiods.
Threedifferentmetricstoassessthereliabilityoftheresultsandto
screenoutthosedeemednottobereliablewerepresented:Thedynamicamplificationfactors,Ariasmodalcontribution,andenhanced reliabilityintervals.Thedynamicamplificationfactorsprovideameasureoftheamplificationof1%-damped floorspectraaccelerationordinatesaveragedinthevicinityoftheidentifiedmodalperiodsforthe recordedresponseattheroofwithrespecttothoseofthemotion
recordedatthebaseofthebuilding.Thismetricprovidesinformationif theearthquakeprovidesenoughexcitationinthevicinityofaparticular modetogeneratearesponseofthatmodethatisstrongenoughtoallow areliableidentificationofthemodaldampingratio.Thismetriccanbe usedonanymode,butitwasfoundthatthisparticulareffectivefor identifyingdampingratiosofthe firstandsecondmodesofthe
 (a) Raw data.
(b) After dynamic amplification factors test.
(c) After Arias modal contribution test.
(d) After enhanced reliability intervals test.
(e) Final results after the application of all tests.
(a) Raw data.
(b) After dynamic amplification factors test.
(c) After Arias modal contribution test.
(d) After enhanced reliability intervals test.
(e) Final results after the application of all tests.
Table6
Identifiedperiods,dampingratios,andreliabilitymetricsforLA-32EW.
Earthquake T[s]f[Hz] ξ RMCERI
Mode1
BorregoSprings20102.850.352.0%2.2215.2%2.0%
Calexico20102.930.342.0%7.4374.7%1.2% ChinoHills20082.900.342.4%5.1119.6%1.0% Encino20142.780.363.5%1.3536.4%3.2%
Inglewood20092.810.362.4%1.8842.4%1.2%
LAAirport20121.820.5530.0%1.0159.2%23.8%
LaHabra20142.910.342.0%4.5222.8%1.0%
WhittierNarrows20102.320.4330.0%1.1044.0%39.0%
Mode2
BorregoSprings20101.030.973.6%3.9163.7%2.0%
Calexico20101.050.953.3%3.7719.8%2.2%
ChinoHills20081.060.943.2%4.3227.9%2.4%
Encino20141.001.003.5%2.0620.7%1.8%
Inglewood20090.991.014.0%2.5629.6%2.6%
LAAirport20120.941.063.2%1.1211.2%11.0%
aremoresensitivetotheresponseofhighermodes,calledenhanced reliabilityintervals,wasalsopresented.Reliabilityscreeningtestswere developedbasedonthesethreemetrics.Usinga32-storybuildingasan example,itwasshownthatthesetestsarecapableofdetectingand screeningoutunreliableresultsinordertokeepthosedeemedreliable.
Thethreemetricscanbeappliedtotheresultsofanysystem identificationtechniquecapableofdeterminingmodalperiods, dampingratios,modeshapes,andmodalparticipationfactors,provided thattheinputtothesystem(groundmotionatthebaseofthebuilding) hasbeenrecorded.PleasenotethatalthoughtheEnhancedReliability Intervals(ERI)metricisbasedonthe “ReliabilityIntervals” method –whichrequiresmeasuringthesensitivityoftheobjectivefunctionto changesindampingratiosandthereforeisapplicableonlytoPrediction ErrorMethods(e.g.,ModalMinimization [10],ARX [40],ARMAX [40], Discrete-TimeFilters [12],etc.) – ERIarecalculatedbasedonasecondarySDOFsystemandthereforecanbeappliedtotheresultsofany systemidentificationmethodthatsatisfiestheaforementionedrequirements.
Acknowledgements
TheauthorswouldliketoacknowledgeCONICYT – BecasChile,the BlumeEarthquakeEngineeringCenteratStanfordUniversity,andthe ShawFamilyFundforthe financialaidtothe firstauthorforconducting doctoralstudiesatStanfordunderthesupervisionofthesecondauthor. Groundandstructuralmotionsusedinthisinvestigationwereobtained fromtheCaliforniaStrongMotionInstrumentationProgramofthe CaliforniaGeologicalSurveyandfromtheUnitedStatesGeological Survey.Effortstoinstall,operate,andmaintainseismicinstrumentation inbuildingsaswellastoprocessanddisseminateearthquakerecordsby theseorganizationsaregratefullyacknowledged.
References
[1] Kijewski-CorreaTL.Full-scalemeasurementsandsystemidentification:atime-frequencyperspective.UniversityofNotreDame;2003
[2]StruttJW.Thetheoryofsound,vol.1,2nded.LondonandNewYork:Macmillan andCo.;1894.
[3] JacobsenLS.Steadyforcevibrationasinfluencedbydamping.TransAmSocMech Eng1930;52:169–81
[4] BeckJL.Determiningmodelsofstructuresfromearthquakerecords.ReportNo. EERL78–01.CaliforniaInstituteofTechnology;1978
[5] McVerryG.Frequencydomainidentificationofstructuralmodelsfromearthquake records.ReportNo.EERL79–02.CaliforniaInstituteofTechnology;1979
[6] SafakE,CelebiM.SeismicresponseofTransamericabuilding.II:systemidentification.JStructEng1991;117:2405–25
[7]CruzC,MirandaE.EvaluationoftheRayleighdampingmodelforbuildings.Eng Struct2017;138:324–36. https://doi.org/10.1016/j.engstruct.2017.02.001
[8]CruzC,MirandaE.Evaluationofdampingratiosfortheseismicanalysisoftall buildings.JStructEng2016;143:04016144. https://doi.org/10.1061/(ASCE)ST. 1943-541X.0001628
[9] BeckR.Fundamentalproblemsintheapplicationofstructuralidentificationprocedurestodamagedetection.ReportNo.EERL.CaliforniaInstituteofTechnology; 1991.p.91–103
[10] BeckJL,JenningsPC.Structuralidentificationusinglinearmodelsandearthquake records.EarthqEngStructDyn1980;8:145–60
structurethatmaynotbereliableinsituationswhentheyarenotsufficientlyexcitedbytheearthquake.TheAriasmodalcontributionratio usestheAriasintensityofamodalresponsetomeasuretherelative contributionofeachmodetothetotalresponse.Thismetricwasfound particularlyusefulinidentifyinghighermodesthatarenotcontributing significantlytothetotalresponseatthelocationofthesensorsand therefore,dampingratiosidentifiedforthesemodesmaynotbereliable.Finally,thereliabilityintervalsmeasurethesensitivityofthe objectivefunctiontosmallvariationsinthedampingratio.Itwasfound thattheobjectivefunctioncanbesignificantlymoresensitivetovariationsindampingratiosthantovariationsinthemodalperiods,which explainsthelargervariabilityintheresultsfordampingwithrespectto thatobtainedinperiods.Amethodtoobtainreliabilityintervalsthat
[11]McVerryGH.Structuralidentificationinthefrequencydomainfromearthquake records.EarthqEngStructDyn1980;8:161–80. https://doi.org/10.1002/eqe. 4290080206
[12] SafakE.Identificationoflinearstructuresusingdiscrete-time filters.JStructEng 1991;117:3064 –85
[13] GhanemR,ShinozukaM.Structural-systemidentification.I:theory.JEngMech 1995;121:255–64
[14] DiRuscioD.Combineddeterministicandstochasticsystemidentificationand realization:DSR-Asubspaceapproachbasedonobservations.ModelIdentif Control1996;17:193–230
[15] Safak E,CelebiM.RecordedseismicresponseofPacificParkPlaza.II:system identification.JStructEng1992;118:1566–89
[16] CelebiM.HighlightsofLomaPrietaresponsesforfourtallbuildings.TenthWorld ConfEarthqEng.Rotterdam:Balkema;1992.p.4039–44
[17] GoelRK,ChopraAK.Vibrationpropertiesofbuildingsdeterminedfromrecorded earthquakemotions.EarthquakeEngineeringResearchCenter,ReportNo.EERC97.Berkeley:UniversityofCalifornia;1997
[18]BernalD,DohlerM,KojidiSM,KwanK,LiuY.Firstmodedampingratiosfor buildings.EarthqSpectra2015;31:367–81. https://doi.org/10.1193/
101812EQS311M
[19]PridhamBA,WilsonJC.Identificationofbase-excitedstructuresusingoutput-only parameterestimation.EarthqEngStructDyn2004;33:133–55. https://doi.org/10. 1002/eqe.343
[20]GhahariF,AbazarsaF,GhannadMA,TacirogluE.Response-onlymodalidentificationofstructuresusingstrongmotiondata.EarthqEngStructDyn 2013;42:1221–42. https://doi.org/10.1002/eqe.2268
[21]GhahariF,TacirogluE.Identificationofdampingratiosforsoil-structuresystems fromseismicresponsesignals.In:11thUSNatlConfEarthqEng,LosAngeles,CA; 2018.
[22]LignosDG,MirandaE.Estimationofbasemotionininstrumentedsteelbuildings usingoutput-onlysystemidentification.EarthqEngStructDyn2014;43:547–63. https://doi.org/10.1002/eqe.2359
[23]PioldiF,FerrariR,RizziE.SeismicFDDmodalidentificationandmonitoringof buildingpropertiesfromrealstrong-motionstructuralresponsesignals.Struct ControlHealMonit2017;24:1–20. https://doi.org/10.1002/stc.1982
[24]PioldiF,RizziE.AFullDynamicCompoundInverseMethodforoutput-onlyelement-levelsystemidentificationandinputestimationfromearthquakeresponse signals.ComputMech2016;58:307–27. https://doi.org/10.1007/s00466-0161292-0.
[25]PioldiF,RizziE.Earthquake-inducedstructuralresponseoutput-onlyidentification bytwodifferentOperationalModalAnalysistechniques.EarthqEngStructDyn 2018;47:257–64. https://doi.org/10.1002/eqe.2947
[26]GerschW.Ontheachievableaccuracyofstructuralsystemparameterestimates.J SoundVib1974;34:63–79. https://doi.org/10.1016/S0022-460X(74)80355-X
[27]GerschW,NielsenNN,AkaikeH.Maximumlikelihoodestimationofstructural parametersfromrandomvibrationdata.JSoundVib1973;31:295–308. https:// doi.org/10.1016/S0022-460X(73)80274-3
[28]PintelonR,GuillaumeP,SchoukensJ.Uncertaintycalculationin(operational) modalanalysis.MechSystSignalProcess2007;21:2359–73. https://doi.org/10.
1016/j.ymssp.2006.11.007
[29]AuS.Uncertaintylawinambientmodalidentification PartI:theory.MechSyst SignalProcess2014;48:15–33. https://doi.org/10.1016/j.ymssp.2013.07.016
[30]HernandezE,PolancoN.Alowerboundforthevarianceoffrequencyanddamping ratioidentifiedfromnoisyvibrationmeasurements.StructControlHealMonit 2016;23:5–19. https://doi.org/10.1002/stc.1757
[31] Hart G,VasudevanR.Earthquakedesignofbuildings:damping.JStructDiv 1975;101:11–30
[32]ReinosoE,MirandaE.Estimationof flooraccelerationdemandsinhigh-rise buildingsduringearthquakes.StructDesTallSpecBuild2005;14:107–30. https:// doi.org/10.1002/tal.272
[33]CaugheyTK,O’KellyMEJ.Classicalnormalmodesindampedlineardynamicsystems.JApplMech1960;27:269–71. https://doi.org/10.1115/1.3643949
[34]USGS,CGS,ANSS.Centerforengineeringstrongmotiondata,< http:// strongmotioncenter.org >,lastaccessedon2015-08-012015.< http:// strongmotioncenter.org >(accessedAugust1,2015).
[35] StagnerJR,HartG.Dampingestimationanddigital filteringappliedtostructural motionstudies.ReportNo.UCLA-ENG-7181.LosAngeles:UniversityofCalifornia; 1971
[36]JearyAP.Dampingintallbuildings-Amechanismandapredictor.EarthqEng StructDyn1986;14:733–50. https://doi.org/10.1002/eqe.4290140505 .
[37] ShinozukaM,GhanemR.Structural-systemidentification.II:experimentalverification.JEngMech1995;121:265–73
[38] MirandaE,TaghaviS.Approximate flooraccelerationdemandsinmultistory buildings.I:formulation.JStructEng2005;131:203–11
[39] ChopraAK.Dynamicsofstructures:theoryandapplicationstoearthquakeengineering.4thed.UpperSaddleRiver,NJ:PearsonEducation,Inc.;2012
[40] LjungL.Systemidentification:theoryfortheuser.SaddleRiver,NJ:Prentice-Hall; 1999


