18 minute read
CHAPTER4 INSTRUMENTATION

from Technique of Determination of Structural Parameters From Forced Vibration Testing
by Straam Group

4.0 INTRODUCTION
This chapter details the instrumentation system which was developed during the course of this investigation. As common to any experimental investigation, the instrumentation system is very important because good results can not have been obtained without good quality measurements and which, in turn, can not have been obtained without good instruments.
Advertisement
Section 4.1 provides an overvtew of the architecture of the system and the general requirements imposed on it. Sections 4.2 describes in greater details the technical development, performance and calibration of the new excitation mechanism. Sections 4.3 to 4.5 describe in turn each of the other key components of the system: transducers, signal generation and processing. Section 4.5 in particular depicts the hardware and software details of a computer-aided-test system which is instrumental for enhancing the efficiency and sophistication in experimentation.
4.1 THE INSTRUMENTATION SYSTEM
The conclusions drawn from the literature survey, as described in Chapter 2, highlight the inadequacy and limitations of the existing methods. This prompts the need for new methods to be developed. However, this could not be materialized without a concurrent development in instrumentations. The instrumentation system used in this investigation was the result of several stages of development which were geared to provide: a. a functional excitation system capable of generating periodic, pseudo random and harmonic forces of sufficiently large magnitude to excite large structure, b. a fast and efficient data collection and recording system which allows direct digital processing and eliminates tedious, time-consuming analogue signal processing and c. a computer-controlled experimentation system offering programmability (i.e. customization of test procedures; fast and precise setting up of equipment for specific test requirements) and demanding minimum attention from an operator.
Before designing or building such a system, it was important to establish first what physical quantities should be measured and hence what instrument was to be used. In the field of structural dynamics, the influential physical quantities are excitation forces, kinematic or strain responses at some parts of a structure or, in some cases acoustic emission surrounding a vibrating structure. Force is usually measured with a piezoelectric force gauge or a resistive load cell. Kinematic response is measured with a linear voltage differential transformer (LVDT) for displacement, a seismometer for velocity, or an accelerometer for acceleration. Strain is conveniently measured with a strain gauge. And acoustic emission is measured with a microphone. It is a common practice of EMA to measure force and acceleration and hence these were chosen.
As common to the instrumentation used in most forced vibration tests, the system used included: an excitation mechanism movement response transducers a force transducer and signal conditioning, processing and recording equipment
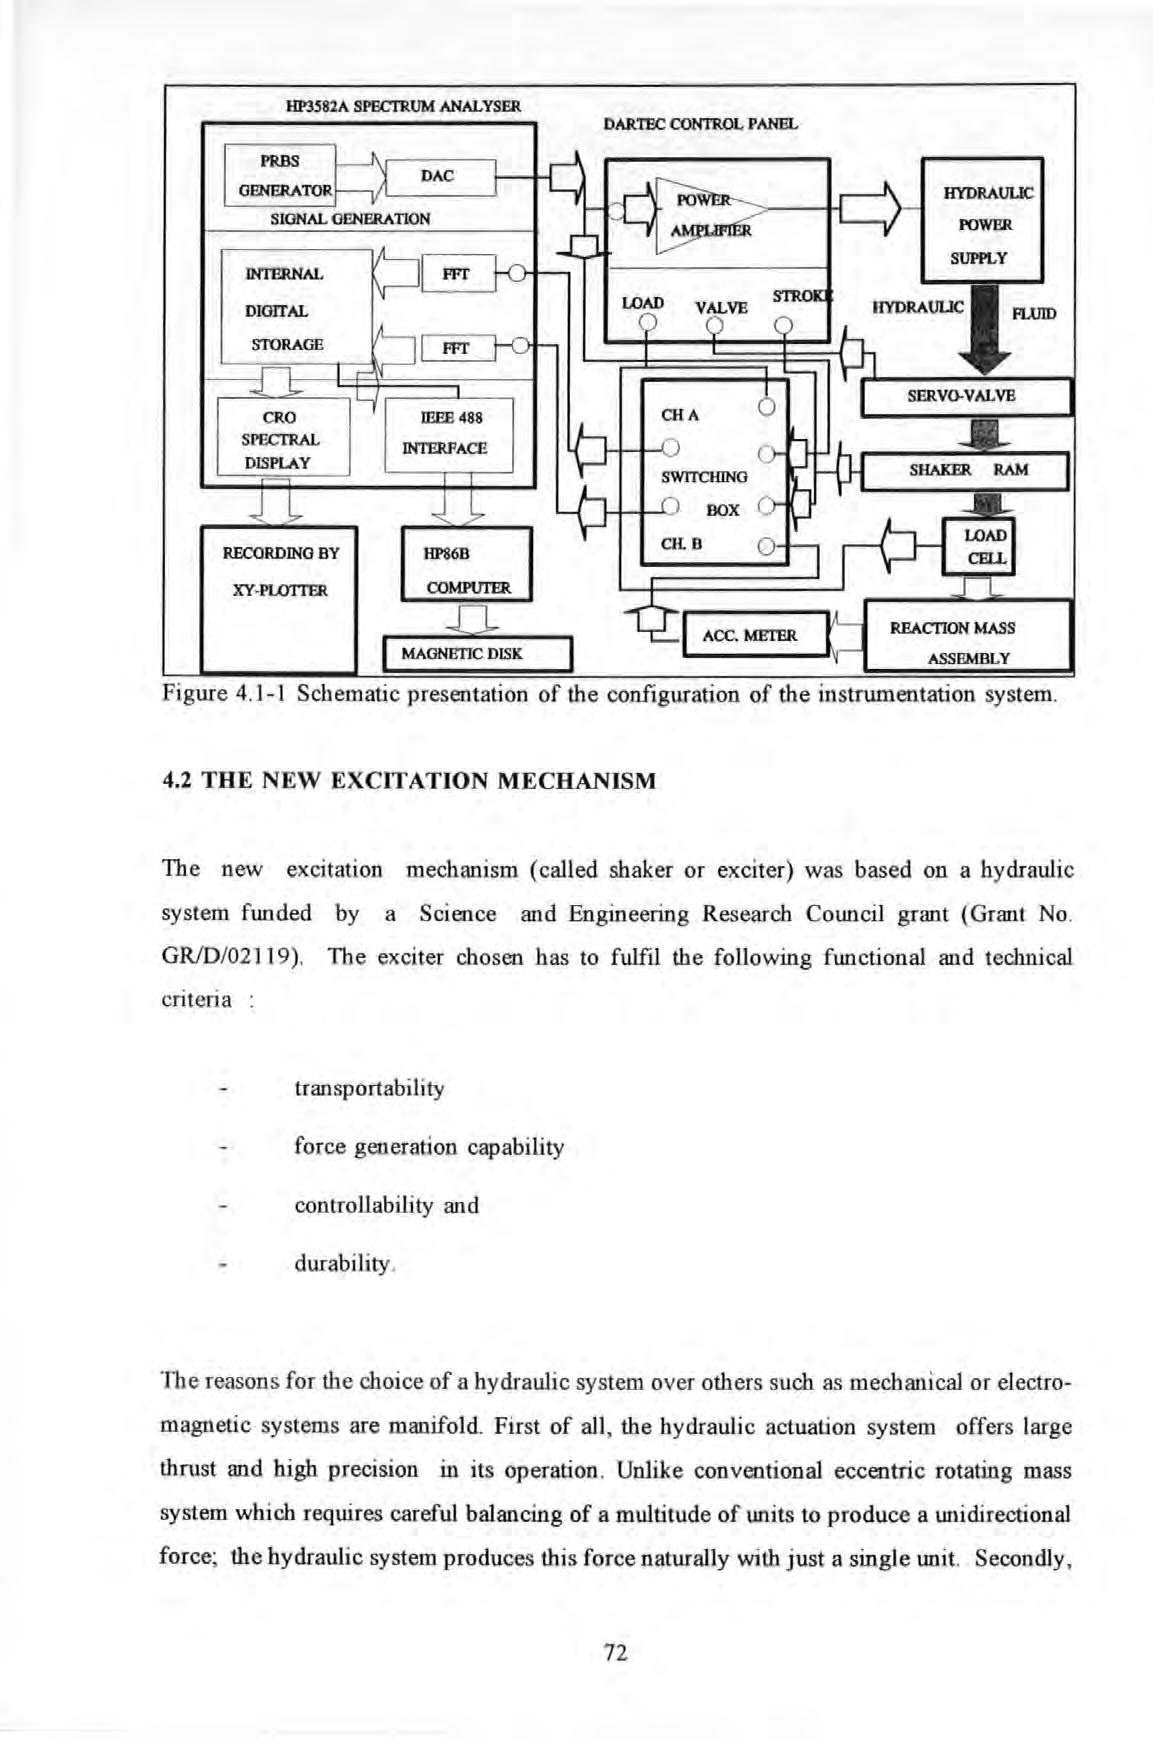
In addition to these basic components, this research utilized a desk-top micro-computer which was linked to a digital signal synthesizer and a spectrum analyzer to form a powerful experimentation system. Figure 4.1-l shows schematically the configuration of this system.
4
The new excitation mechanism (called shaker or exciter) wa s based on a hydraulic system funded by a Science and Engineering Research Council grant (Grant No GR/D/02 119) . The exciter chosen has to fulfil the following functional and technical criteria : transportability force generation capability controllability and durability
The reas ons for the choice of a hydraulic system over others such as mechanical or electrom agnetic systems are manifold First of all , the hydraulic actuation system offers larg e thrust and high precision in its operation . Unlike conventional eccentric rotating mass system which requires careful balancing of a multitude of units to produce a unidirectional the hydraul ic system produces this force naturally with just a singl e unit. Secondly , the hydraulic system can produce not only harmonic but also random forces. Thirdly, although an electro-magnetic actuation system can also be run rectilinearly and randomly, it has very small stroke capability. This is due to the limitation in the amount of movement of the moving armature allowed inside a fixed magnetized core. In contrast, the hydraulic system offers much larger stroke limits which are critical to producing forces of sufficiently large magnitudes at low frequencies.
4.2.1 BRIEF DESCRIPTIONS
The excitation mechanism was developed based on a proprietary hydraulic actuator manufactured and supplied by DARTEC (A schematic of the system is given in Figure
4.2.2.1 ). The excitation force is generated from the inertial reaction when the ram of the actuator propels and move a heavy 'dead mass'. A maximum stroke of 300 mm p.p. (peak-to-peak ) is permitted by this system.
The movement of the ram is a result of pressurized oil thrusting a double acting piston which is housed inside a cylinder jacket. The jacket is completely sealed by two high pressure hydrostatic seals situated at both ends of the jacket. An electronic servo-valve controls the amount and the rate of oil flowing in-and-out of a manifold which is connected to a number of isolated chambers inside the cylinder. Apart from the sealing function, the two balanced hydrostatic seals also serve as bearings which eliminate any metal-to-metal contact between the moving parts, maintain centring of and provide lateral stiffness to the ram.
This actuator is powered by a 'portable' DARTEC hydraulic system which is consisted of the following units : a electrical power supply and control unit two powerful motor pumps unit a blast cooling fan unit an oil reservoir, high pressure hydraulic hoses and other ancillaries.
The system was specially adapted so that each unit could be dismantled into separate smaller bits for ease of transportation (as shown in Figure 4.2.1-1 ). Re-assembling the units could also be done easily and quickly in the field .
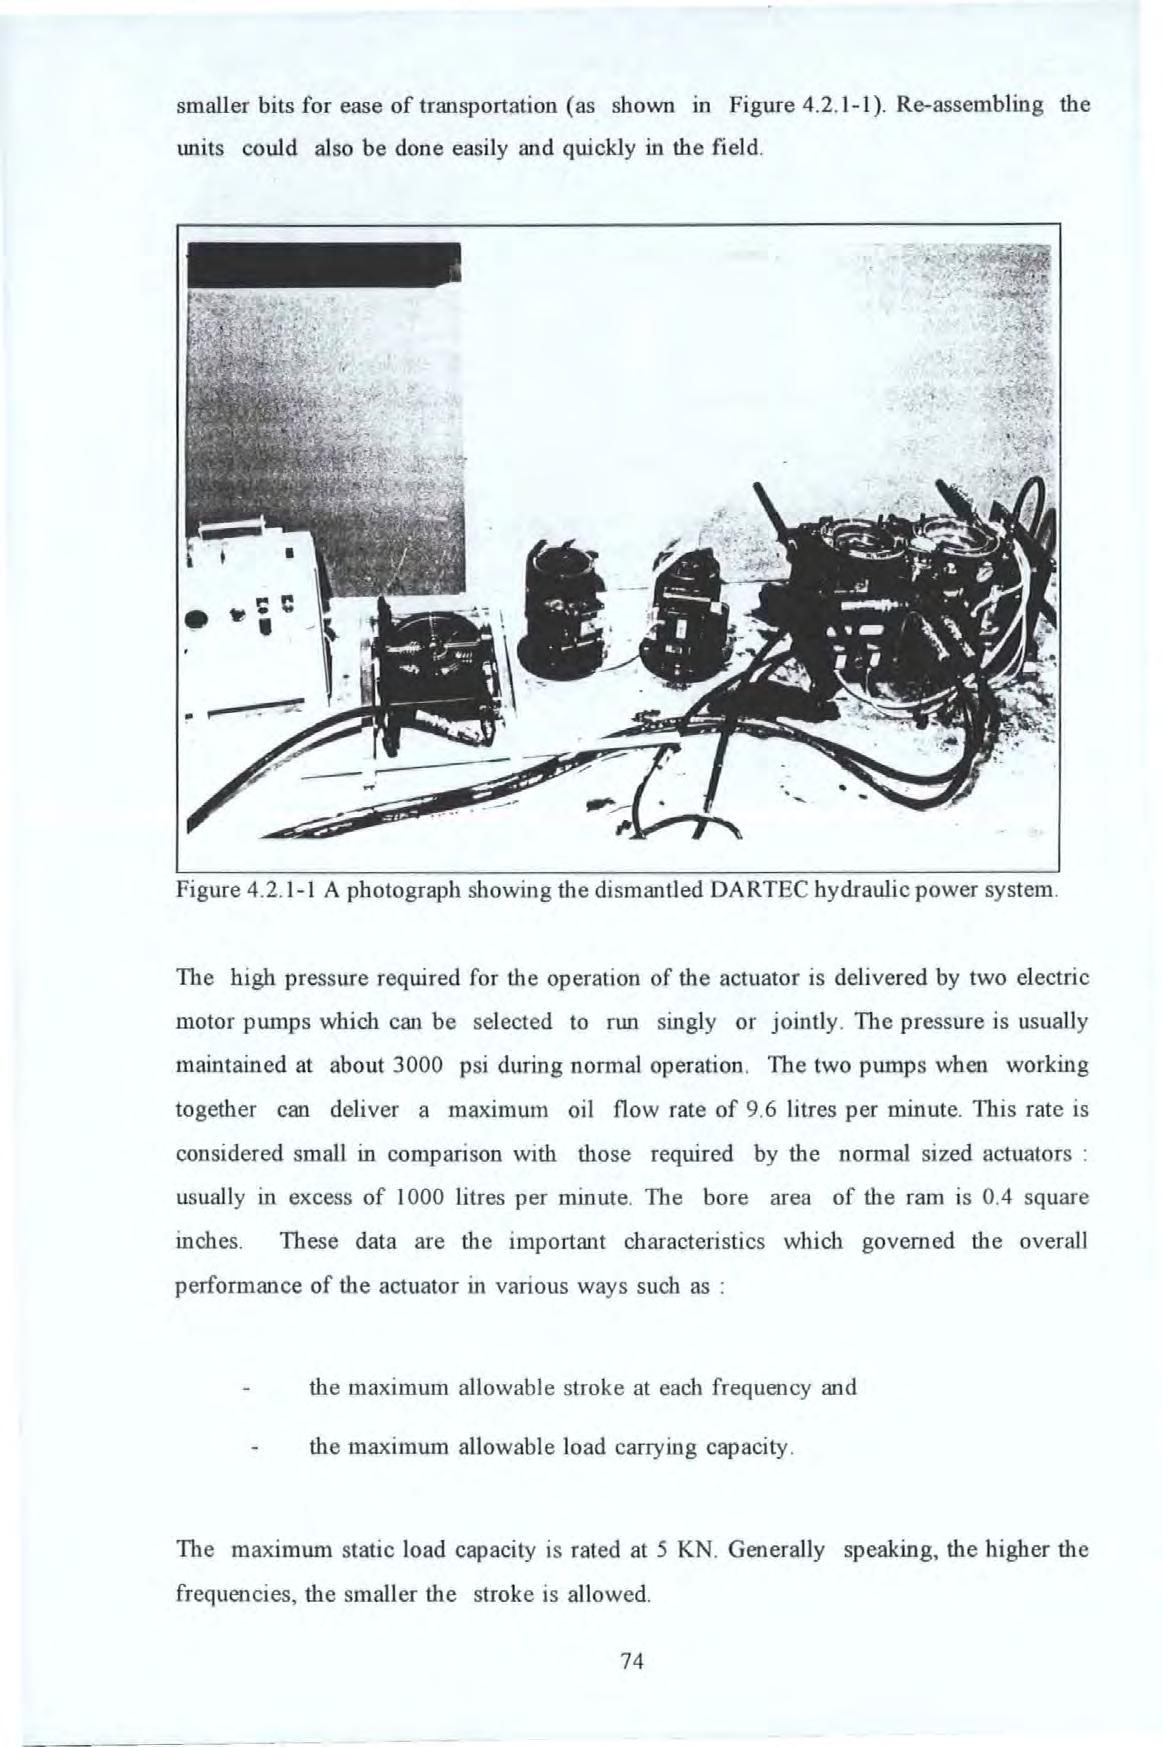
The high pressure required for the operation of the actuator is delivered by two electric motor pumps which can be selected to run singly or jointly . The pressure is usually maintained at about 3000 psi during normal operation The two pumps when working together can deliver a maximum oil flow rate of 9 .6 litres per minute. This rate is considered small in comparison with those required by the normal sized actuators : usually in excess of 1000 litres per minute. The bore area of the ram is 0.4 square inches . These data are the important characteristics which govemed the overall performance of the actuator in various ways such as : the maximum allowable stroke at each frequency and the maximum allowable load carrying capacity .
The maximum static load capacity is rated at 5 KN Generally speaking, the higher the frequencies , the smaller the stroke is allowed
The stroke of the ram is monitored with an L VDT an d the force measured with a resistive type load cell. Both transducers are powered electrically by the system's electronic control panel and their signals monitored with LED digital displays.
4.2.2 TECHNICAL DEVELOPMENTS
A schematic drawing and a photograph showing the hardware configuration of the excitation system are given in Figures 4 2.2-1 and 4.2 .2-2 respectively.
Actuator
UNIVERSAL JOINTS COUPLER
RAM DARTEC DBADMASS HYDRAUUC CYUNDBR LOAD r] WEIGHT CElL CARRIER I MOUNTING I ) ( ) l lNSlRON LOAD CBUJ I I I SUPPORT RAILS WOOD PLANK
Figures 4 2 2-1
A schematic drawing showing the hardware configuration of the excitation system .
Figures 4 2 2-2 A photograph showing the excitation system
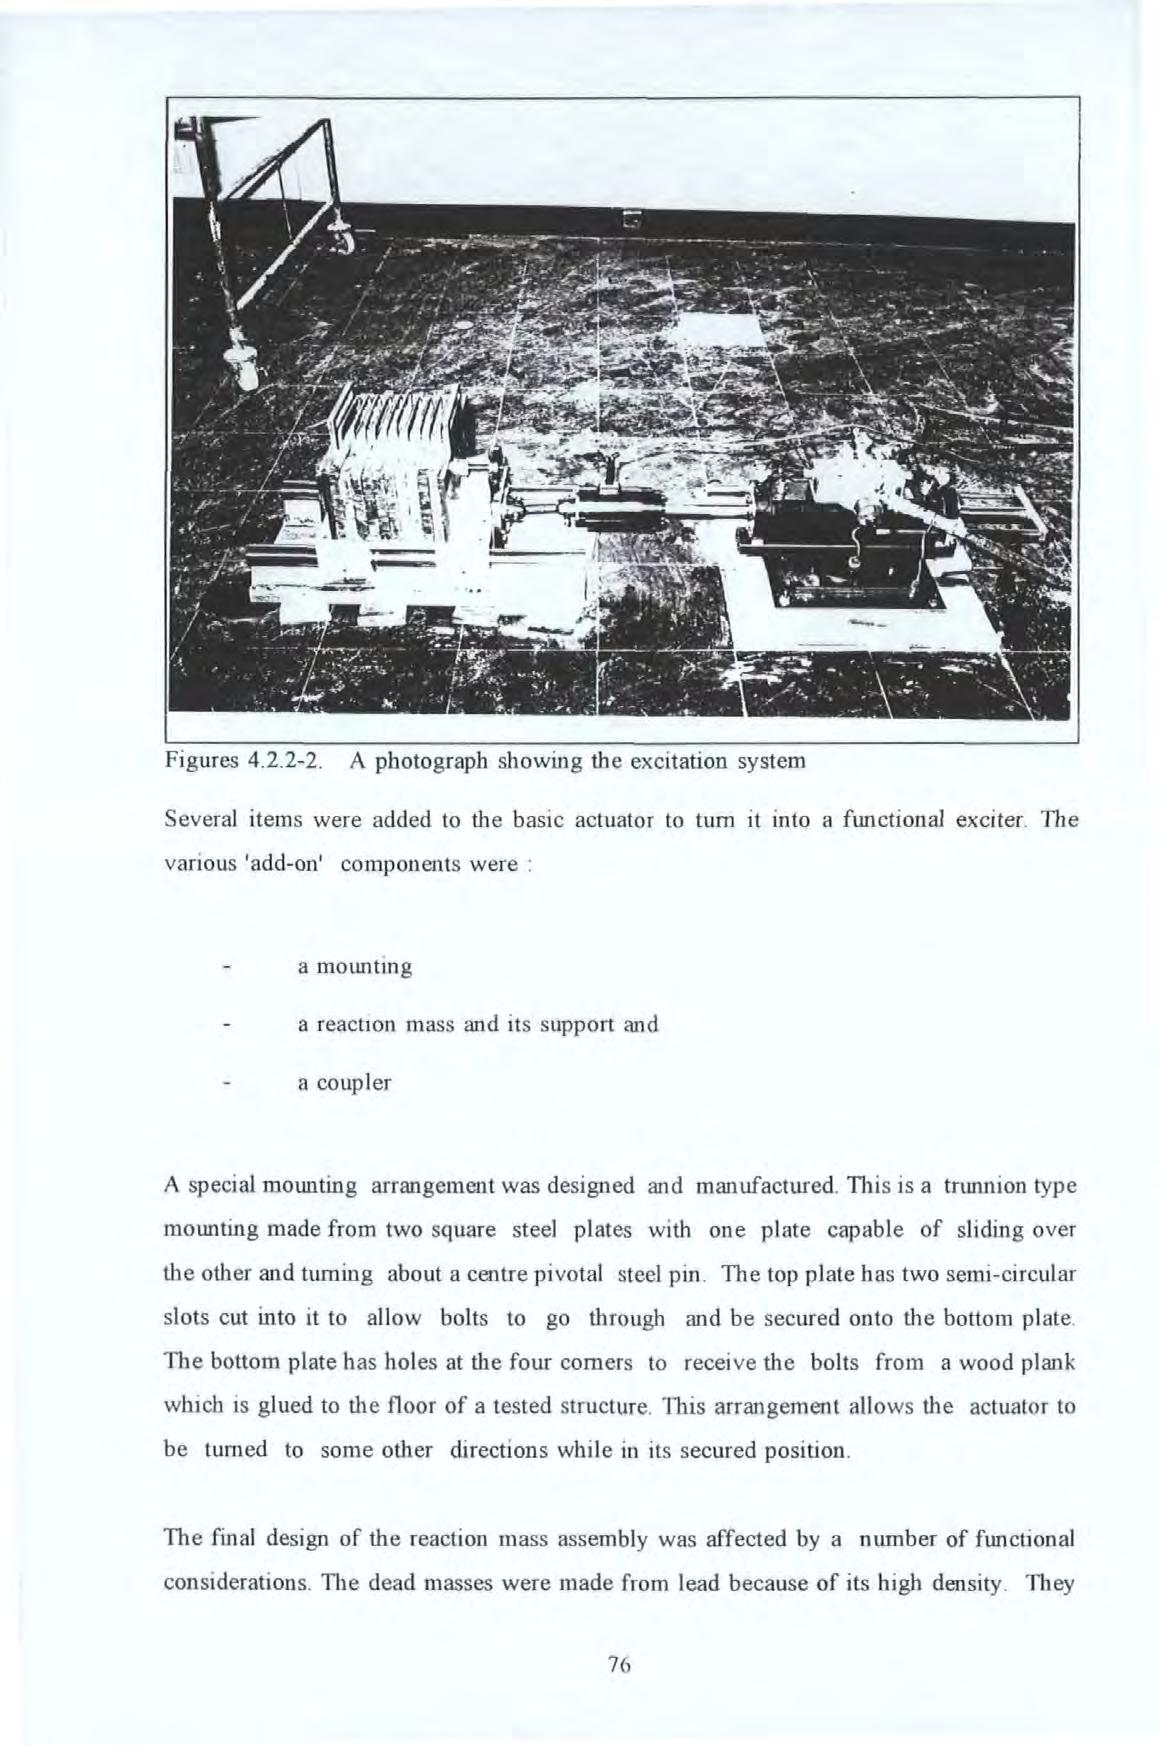
Several items were added to the basic actuator to turn it into a fllllctional exciter. The various 'add-on' components were : a mollllting a react10n mass and its support and a coupler
A special mounting arrangement was designed and manufactured. 1l1is is a trunnion type mounting made from two square steel plates with one plate capable of sliding over the other and turning about a centre pivotal steel pin The top plate has two semi-circular slots cut into it to allow bolts to go through and be secured onto the bottom plate . The bottom plate has ho les at the four corners to receive the bolts from a wood plank which is glued to the floor of a tested structure. This arrangement allows the actuator to be turned to some other directions while in its secured position
The final design of the reaction mass assembly was affected by a number of functional considerations. 1l1e dead masses were made from lead because of its high density . They were cast as flat plates of approximately 15.5 Kg weight each. A steel handle and a slot was provided for each plate for easy loading and unloading from a weight carrier.
The weight carrier used for carrying these lead plates was a very sturdy unit made in the form of an open-box trolley with two steel plates welded at the two ends. A threaded screw rod was welded to the two end-plates. The lead plates were slotted one by one along the rod and through the slotting hole when loading. Two steel backing plates sandwiched the lead plates and were secured by two nuts at each end. Different numbers of plates, up to a maximum of 12, could be placed in the carrier to fulfil different force requirements.
The carrier was supported underneath by four linear ball bearings which ran on two rails with high quality surface finishes. These arrangements were instrumental in reducing nonlinear Coulomb friction.
A 'flexible' coupling joint was introduced between the carrier and the ram in order to eliminate any lateral load introduced to the ram which could damage the hydrostatic bearings. This coupler is a short 'push-rod' with universal ball-and-socket joints welded at both ends. An attachment freed from backlash is achieved by using two fme precision slotting pins. This coupling arrangement allows some vertical and horizontal misalignments between the ram and the carrier.
4.2.3 PERFORMANCE TESTS
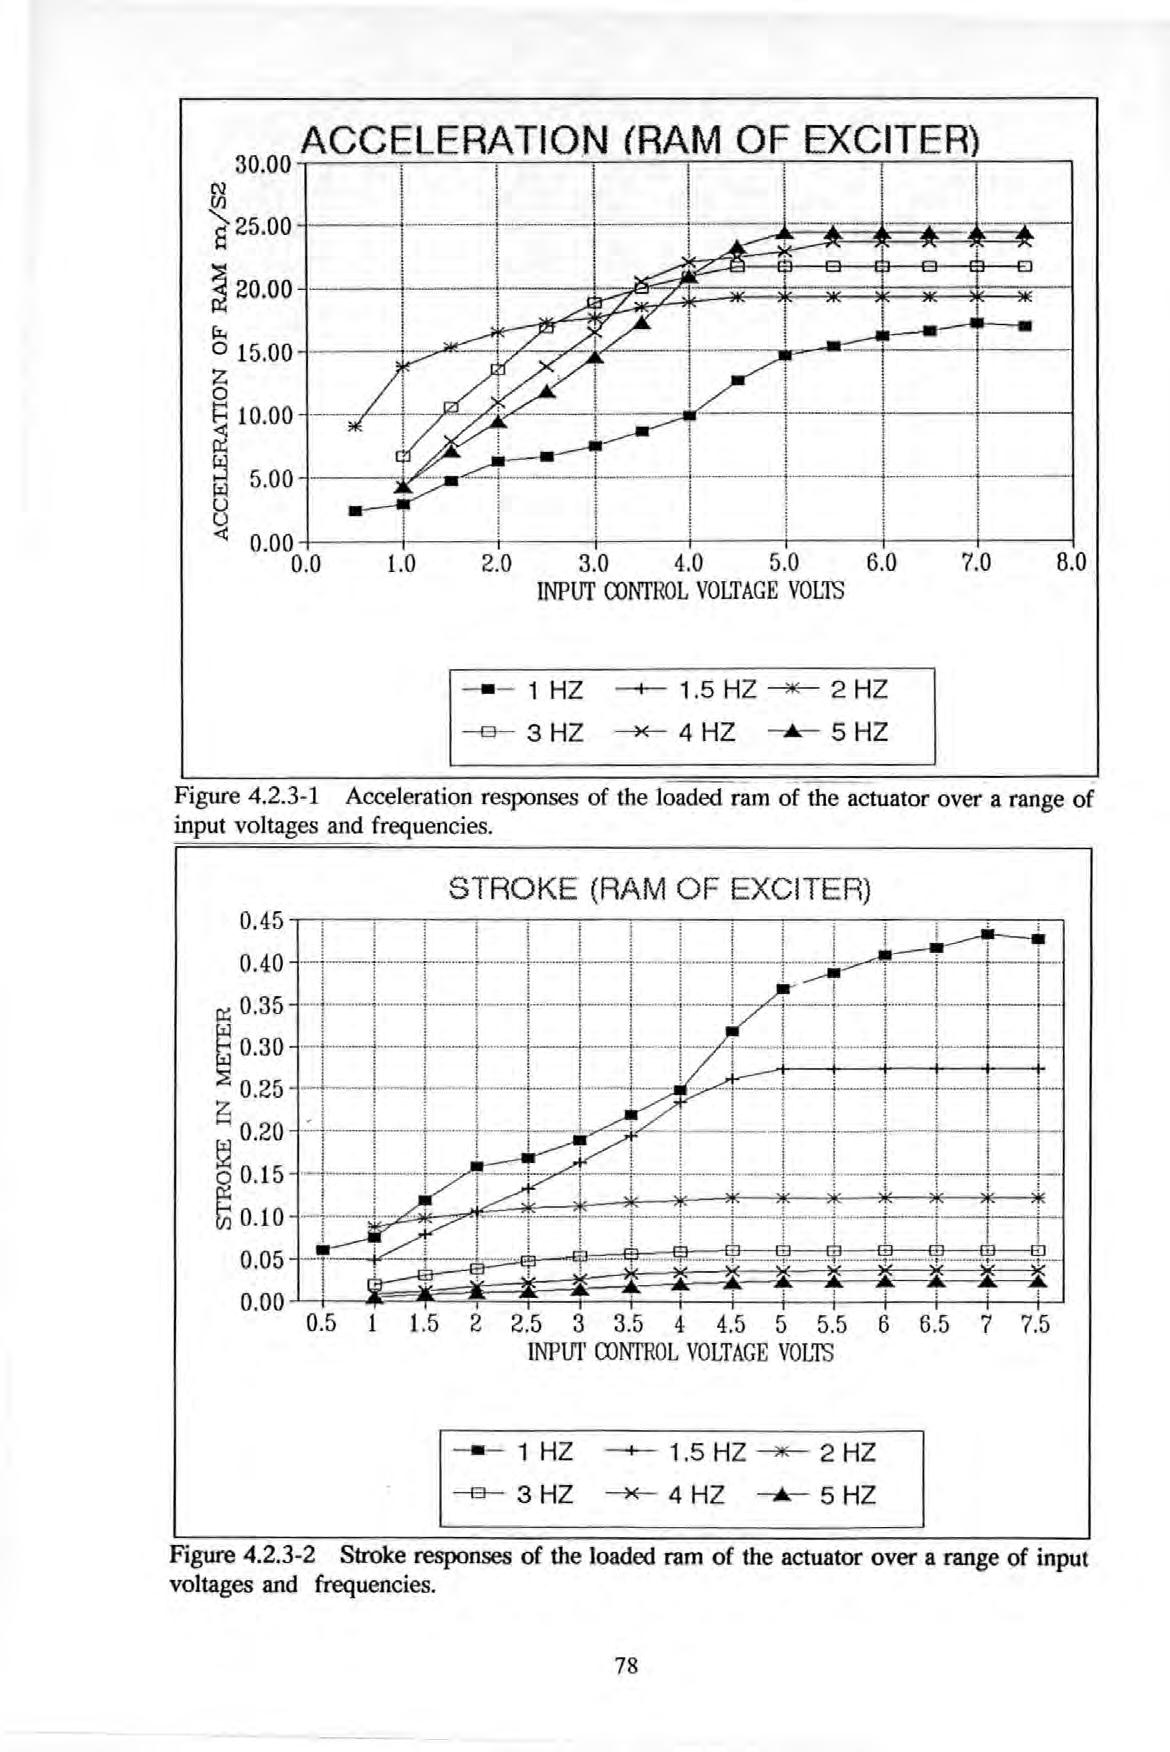
Tests were carried out to determine the performance of the entire system in the low frequency range (i.e. 5 Hz or below) : not only the actuator system itself but also the other attachments to it. Performance in terms of the maximum force produced, the practical limits in stroke, acceleration etc of the ram in relation to driving frequencies was investigated. To eliminate other possible influential factors which might affect the performance of the actuator, simple sinusoidal instead of random or transient driving signals were used. Although the actuator allowed two modes of operation under either load or stroke control, only the latter was used. Details of this control can be found in the manufacturer's operation manual 14 .q Some of the results from these tests are plotted in Figures 4.2.3-1 to 4.2.3-3.
Force Amplitude Generation By Exciter
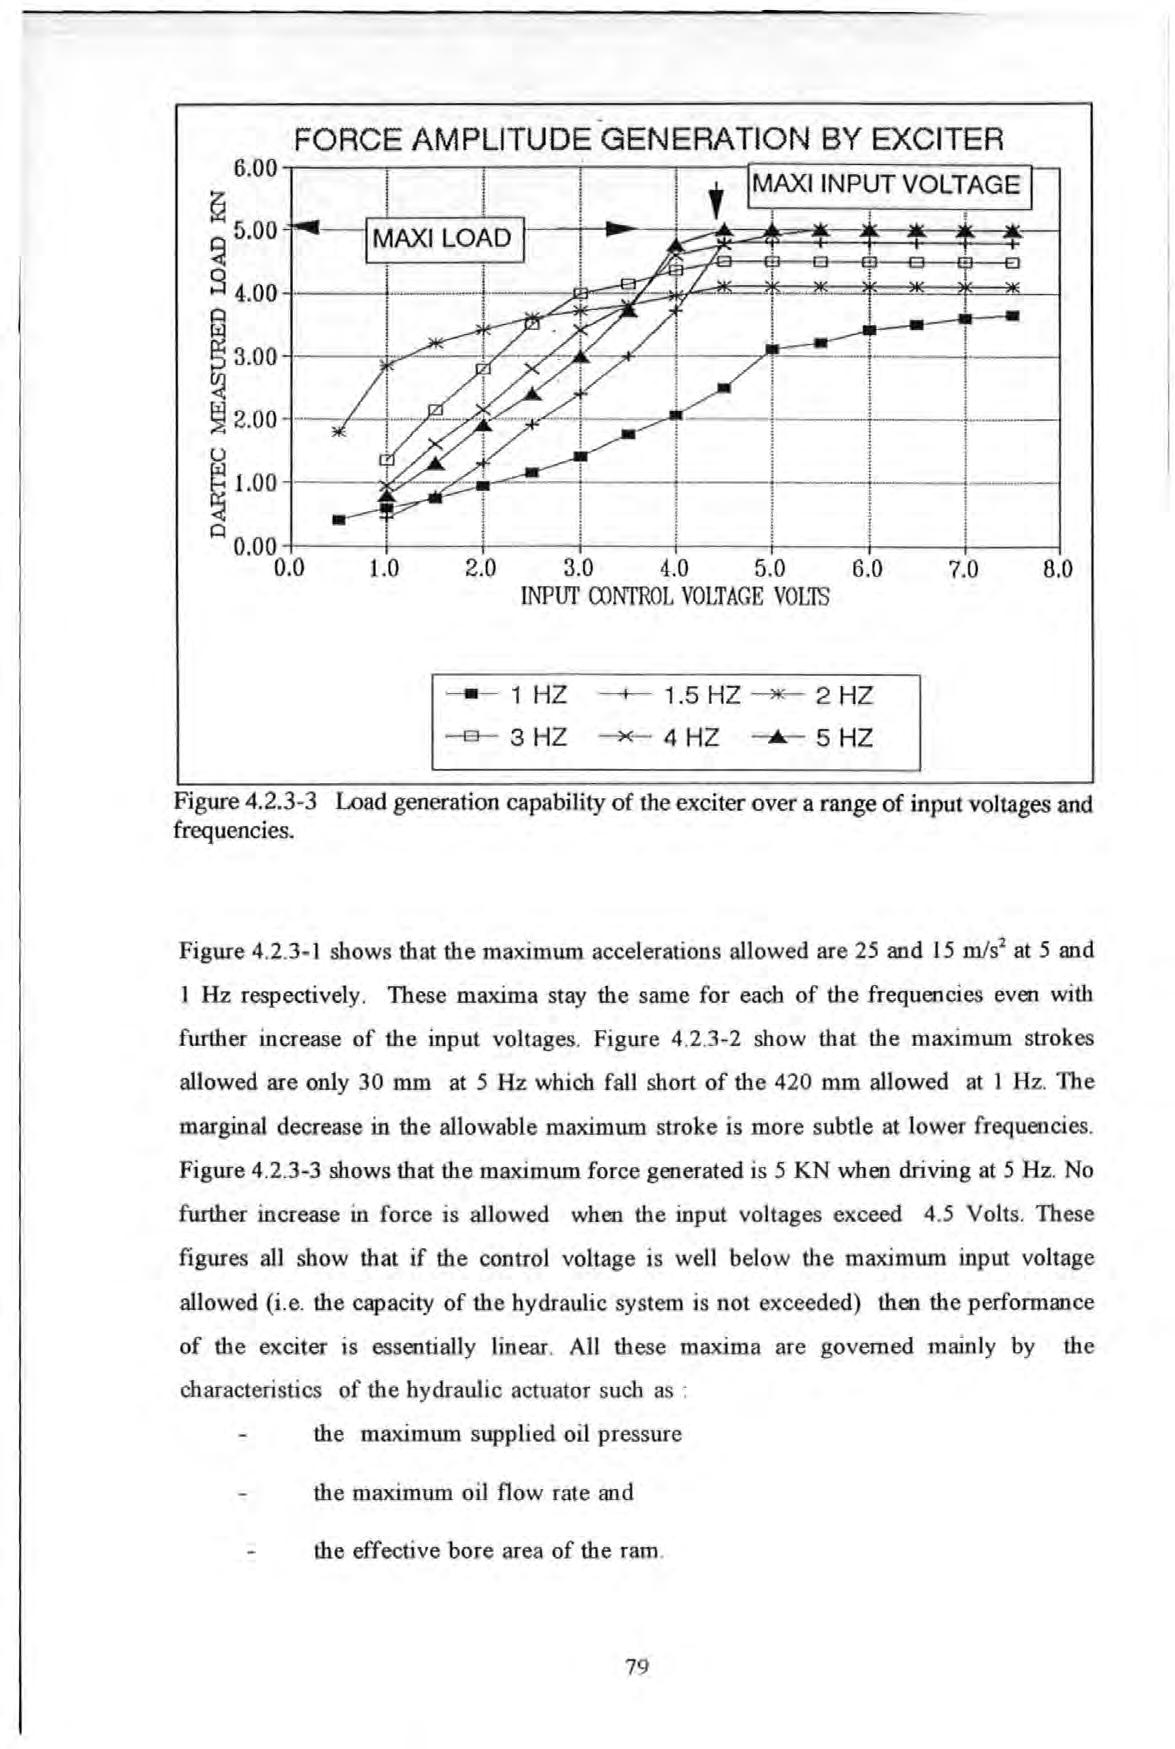
Figure 4 2 3-1 shows that the maximum accelerations allowed are 25 and 15 m/s2 at 5 and 1 Hz respectively . These maxima stay the same for each of the frequencies even with further increase of the input voltages . Figure 4 .2.3-2 show that the maximum strokes allowed are only 30 mm at 5 Hz which fall short of the 420 mm allowed at 1 Hz. The marginal decrease in the allowable maximum stroke is more subtle at low er frequencies.
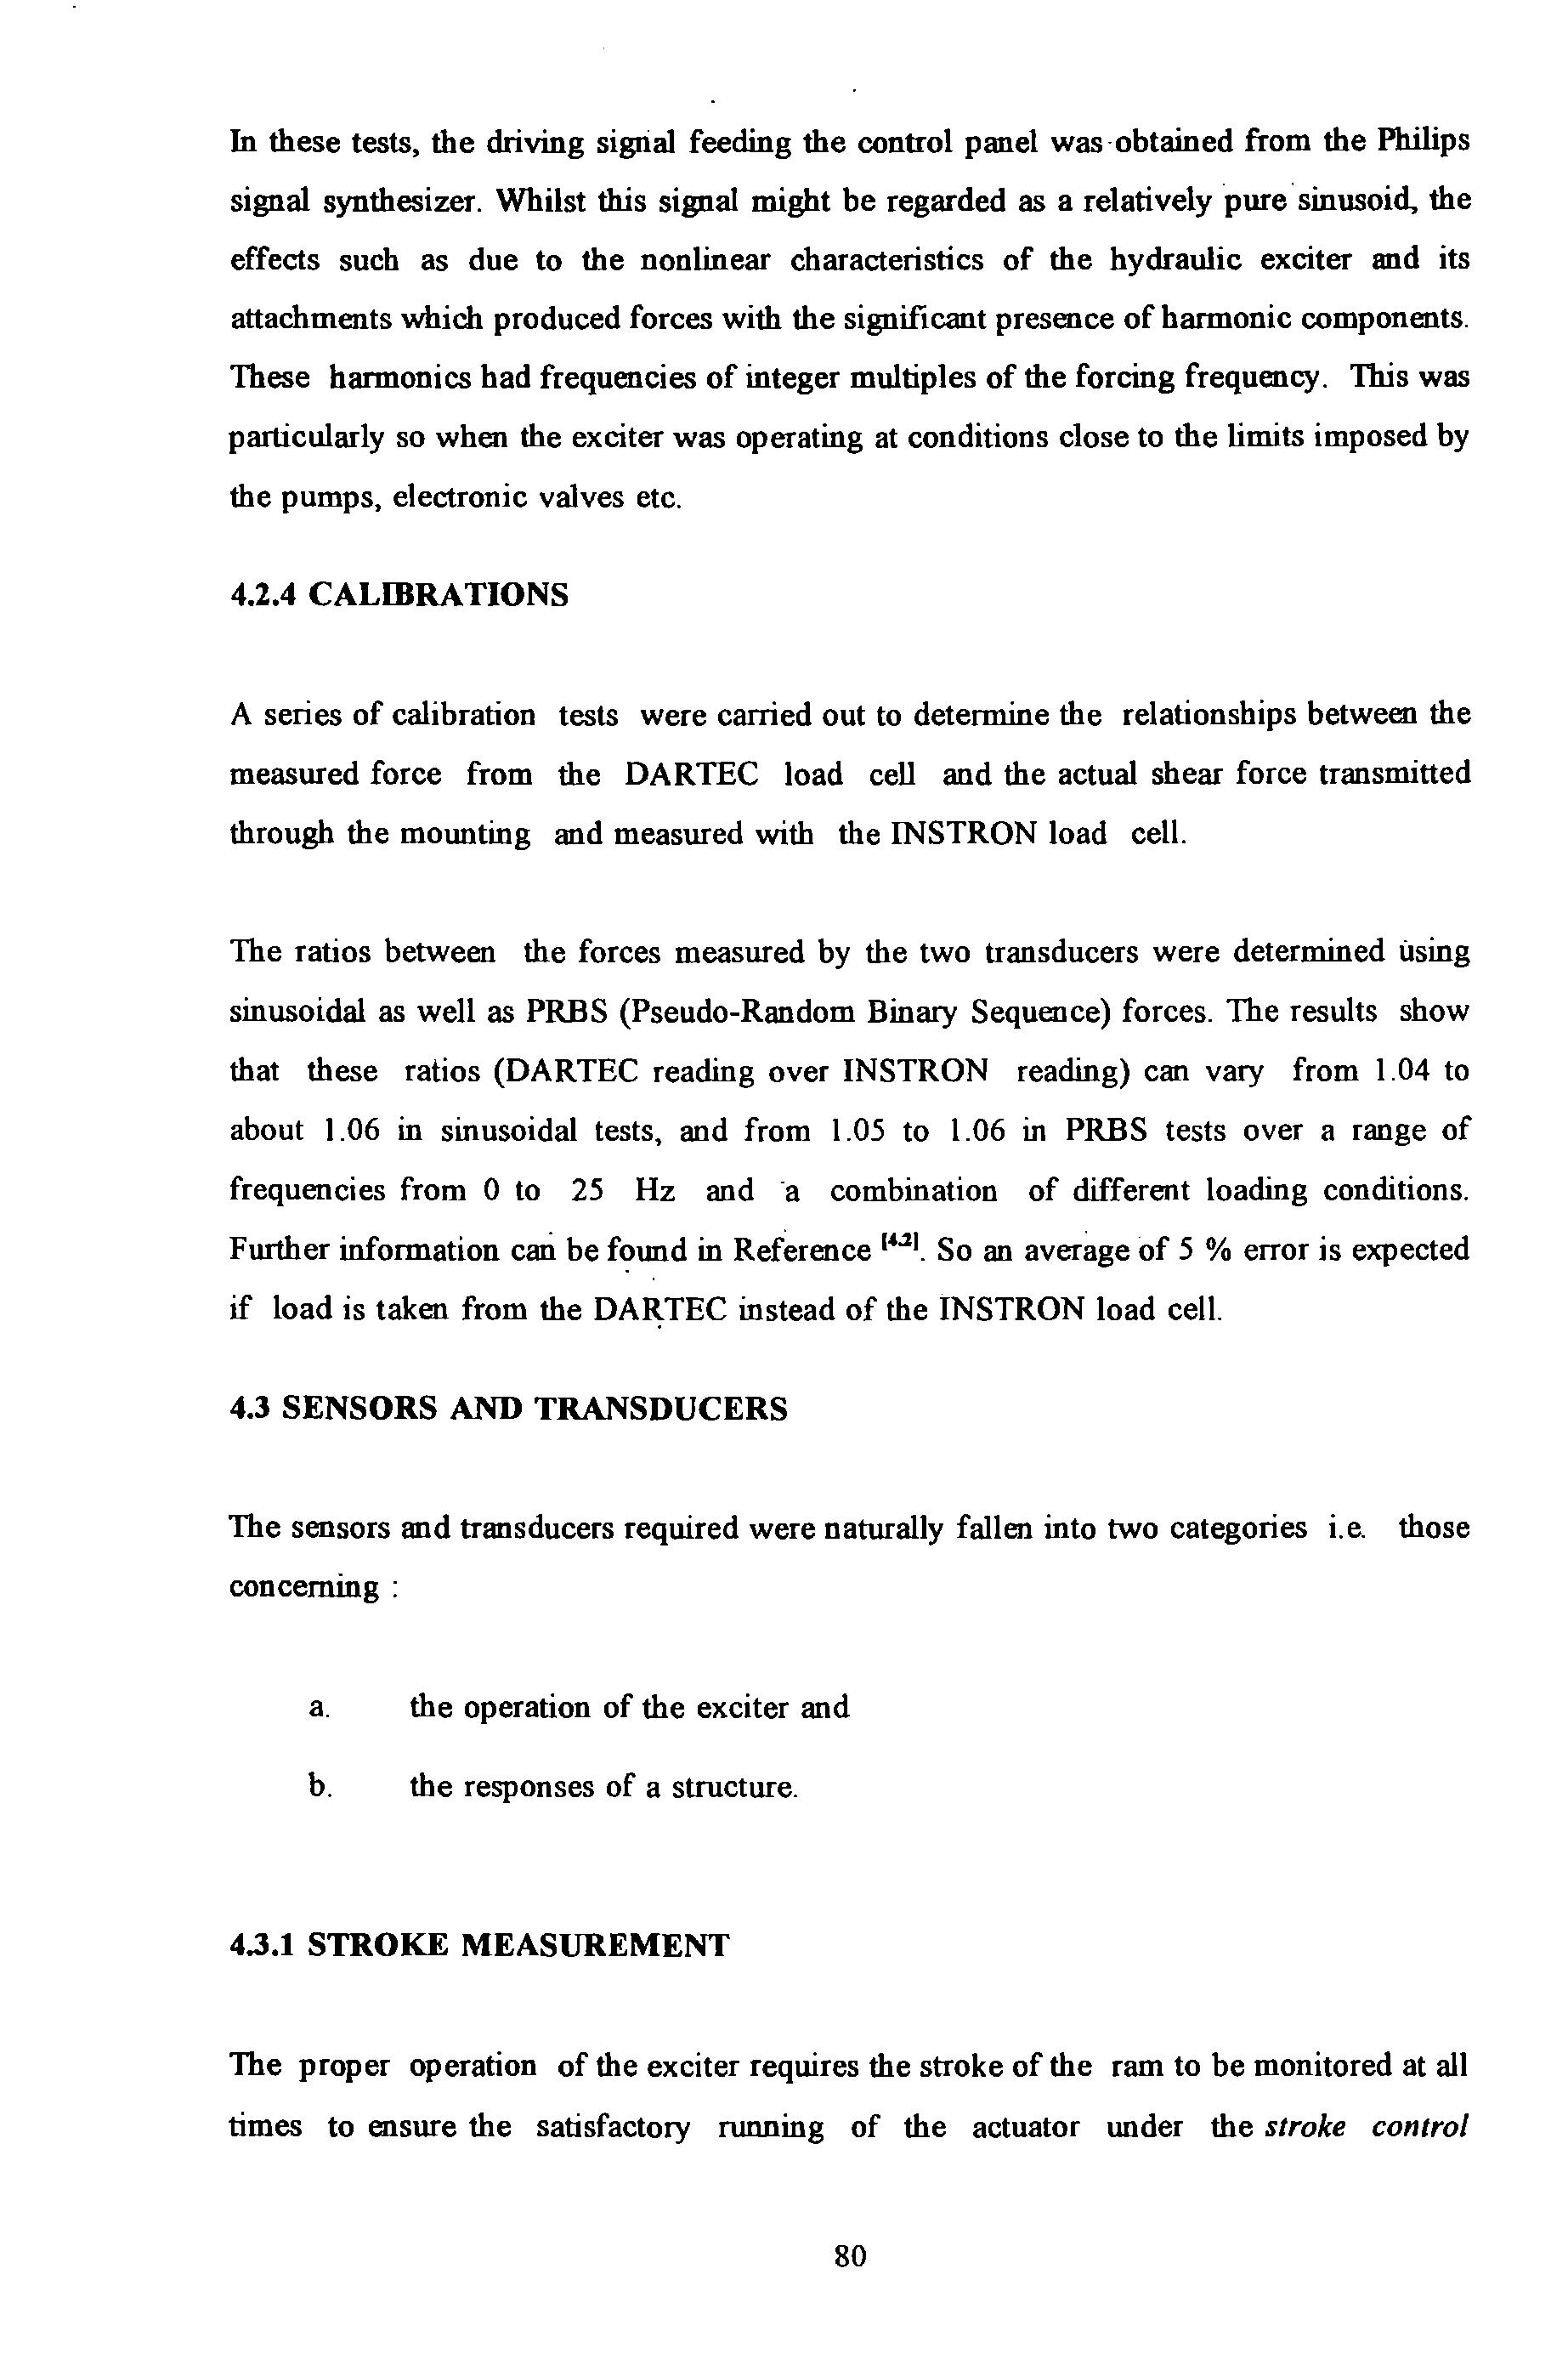
Figure 4.2 .3-3 shows that the maximum force generated is 5 KN when driving at 5 Hz. No further increase in force is allowed when the input voltages exceed 4.5 Volts. These figures all show that if the control voltage is well below the maximum input voltage allowed (i e the capacity of the hydraulic system is not exceeded) then the performance of the exciter is essentially lin ear All these maxima are governed mainly by the characteristics of the hydraulic actuator such as : the maximum supplied oil pressure the maximum oil flow rate and the effective bore area of the ram
In these tests, the driving signal feeding the control panel was obtained from the Philips signal synthesizer. Whilst this signal might be regarded as a relatively pure sinusoid, the effects such as due to the nonlinear characteristics of the hydraulic exciter and its attachments which produced forces with the significant presence of harmonic components. These harmonics had frequencies of integer multiples of the forcing frequency. This was particularly so when the exciter was operating at conditions close to the limits imposed by the pumps, electronic valves etc.
4.2.4 CALmRATIONS
A series of calibration tests were carried out to determine the relationships between the measured force from the DARTEC load cell and the actual shear force transmitted through the mounting and measured with the INSTRON load cell.
The ratios between the forces measured by the two transducers were determined using sinusoidal as well as PRBS (Pseudo-Random Binary Sequence) forces. The results show that these ratios (DARTEC reading over INSTRON reading) can vary from 1.04 to about 1.06 in sinusoidal tests, and from 1.05 to 1.06 in PRBS tests over a range of frequencies from 0 to 25 Hz and ·a combination of different loading conditions. Further information CaD be fc:>und in Reference 1431 So an average of 5 % error is expected if load is taken from the DARTEC instead of the INSTRON load cell.
4.3 SENSORS AND TRANSDUCERS
The sensors and transducers required were naturally fallen into two categories I.e. those concemmg: a. the operation of the exciter and b. the responses of a structure.
4.3.1 STROKE MEASUREMENT
The proper operation of the exciter requires the stroke of the ram to be monitored at all times to ensure the satisfactory running of the actuator under the stroke control mode. An LVDT (linear voltage differential transformer) was used for this purpose. The L VDT output signal is frequency modulated using a 5 KHz carrier. An LED digital display of the stroke is provided in the control panel.
4.3.2 ACCELEROMETERS
4.3.2.1 DESCRIPTIONS
The acceleration response of a structure was measured with servo-driven closed-loop torque balance SCHAEVITZ accelerometers. With the servo-control mechanism, these accelerometers are capable of working with DC signals which most piezoelectric types of accelerometers cannot. The transduction principle and details of the operations of these accelerometers can be found in Reference 1431 These accelerometers are externally powered so that they can be made very light and small. A special power pack and a junction box provide the required electrical power and cable connections. When used in the field, each accelerometer was screw-mounted on a heavy metal block for stability. Each accelerometer has a sensitivity axis which is to be aligned along the intended response direction. Apart from the sensitivity direction, each accelerometer has also got a cross-axis sensitivity which is usually only a small value and no special considerations are required.
4.3.2.2 CALffiRATIONS
The accelerometers were calibrated both statically and dynamically. As these accelerometers are designed to work with DC, static gravimetric calibrations were performed using the Earth's gravitational field. These were carried out by placing the accelerometers on a sine table which could be tilted about a base to very precise angles. The corresponding voltage outputs from the accelerometers at various angles were used to calculate their sensitivities.
Dynamic calibrations were carried out by placing all the accelerometers side-by-side on the weight carrier. The ratios of the corresponding voltage outputs from each of the accelerometers and those from the LVDT were used to calculate their sensitivities. In taking these measurements the exciter's ram was set to wide band random motion.
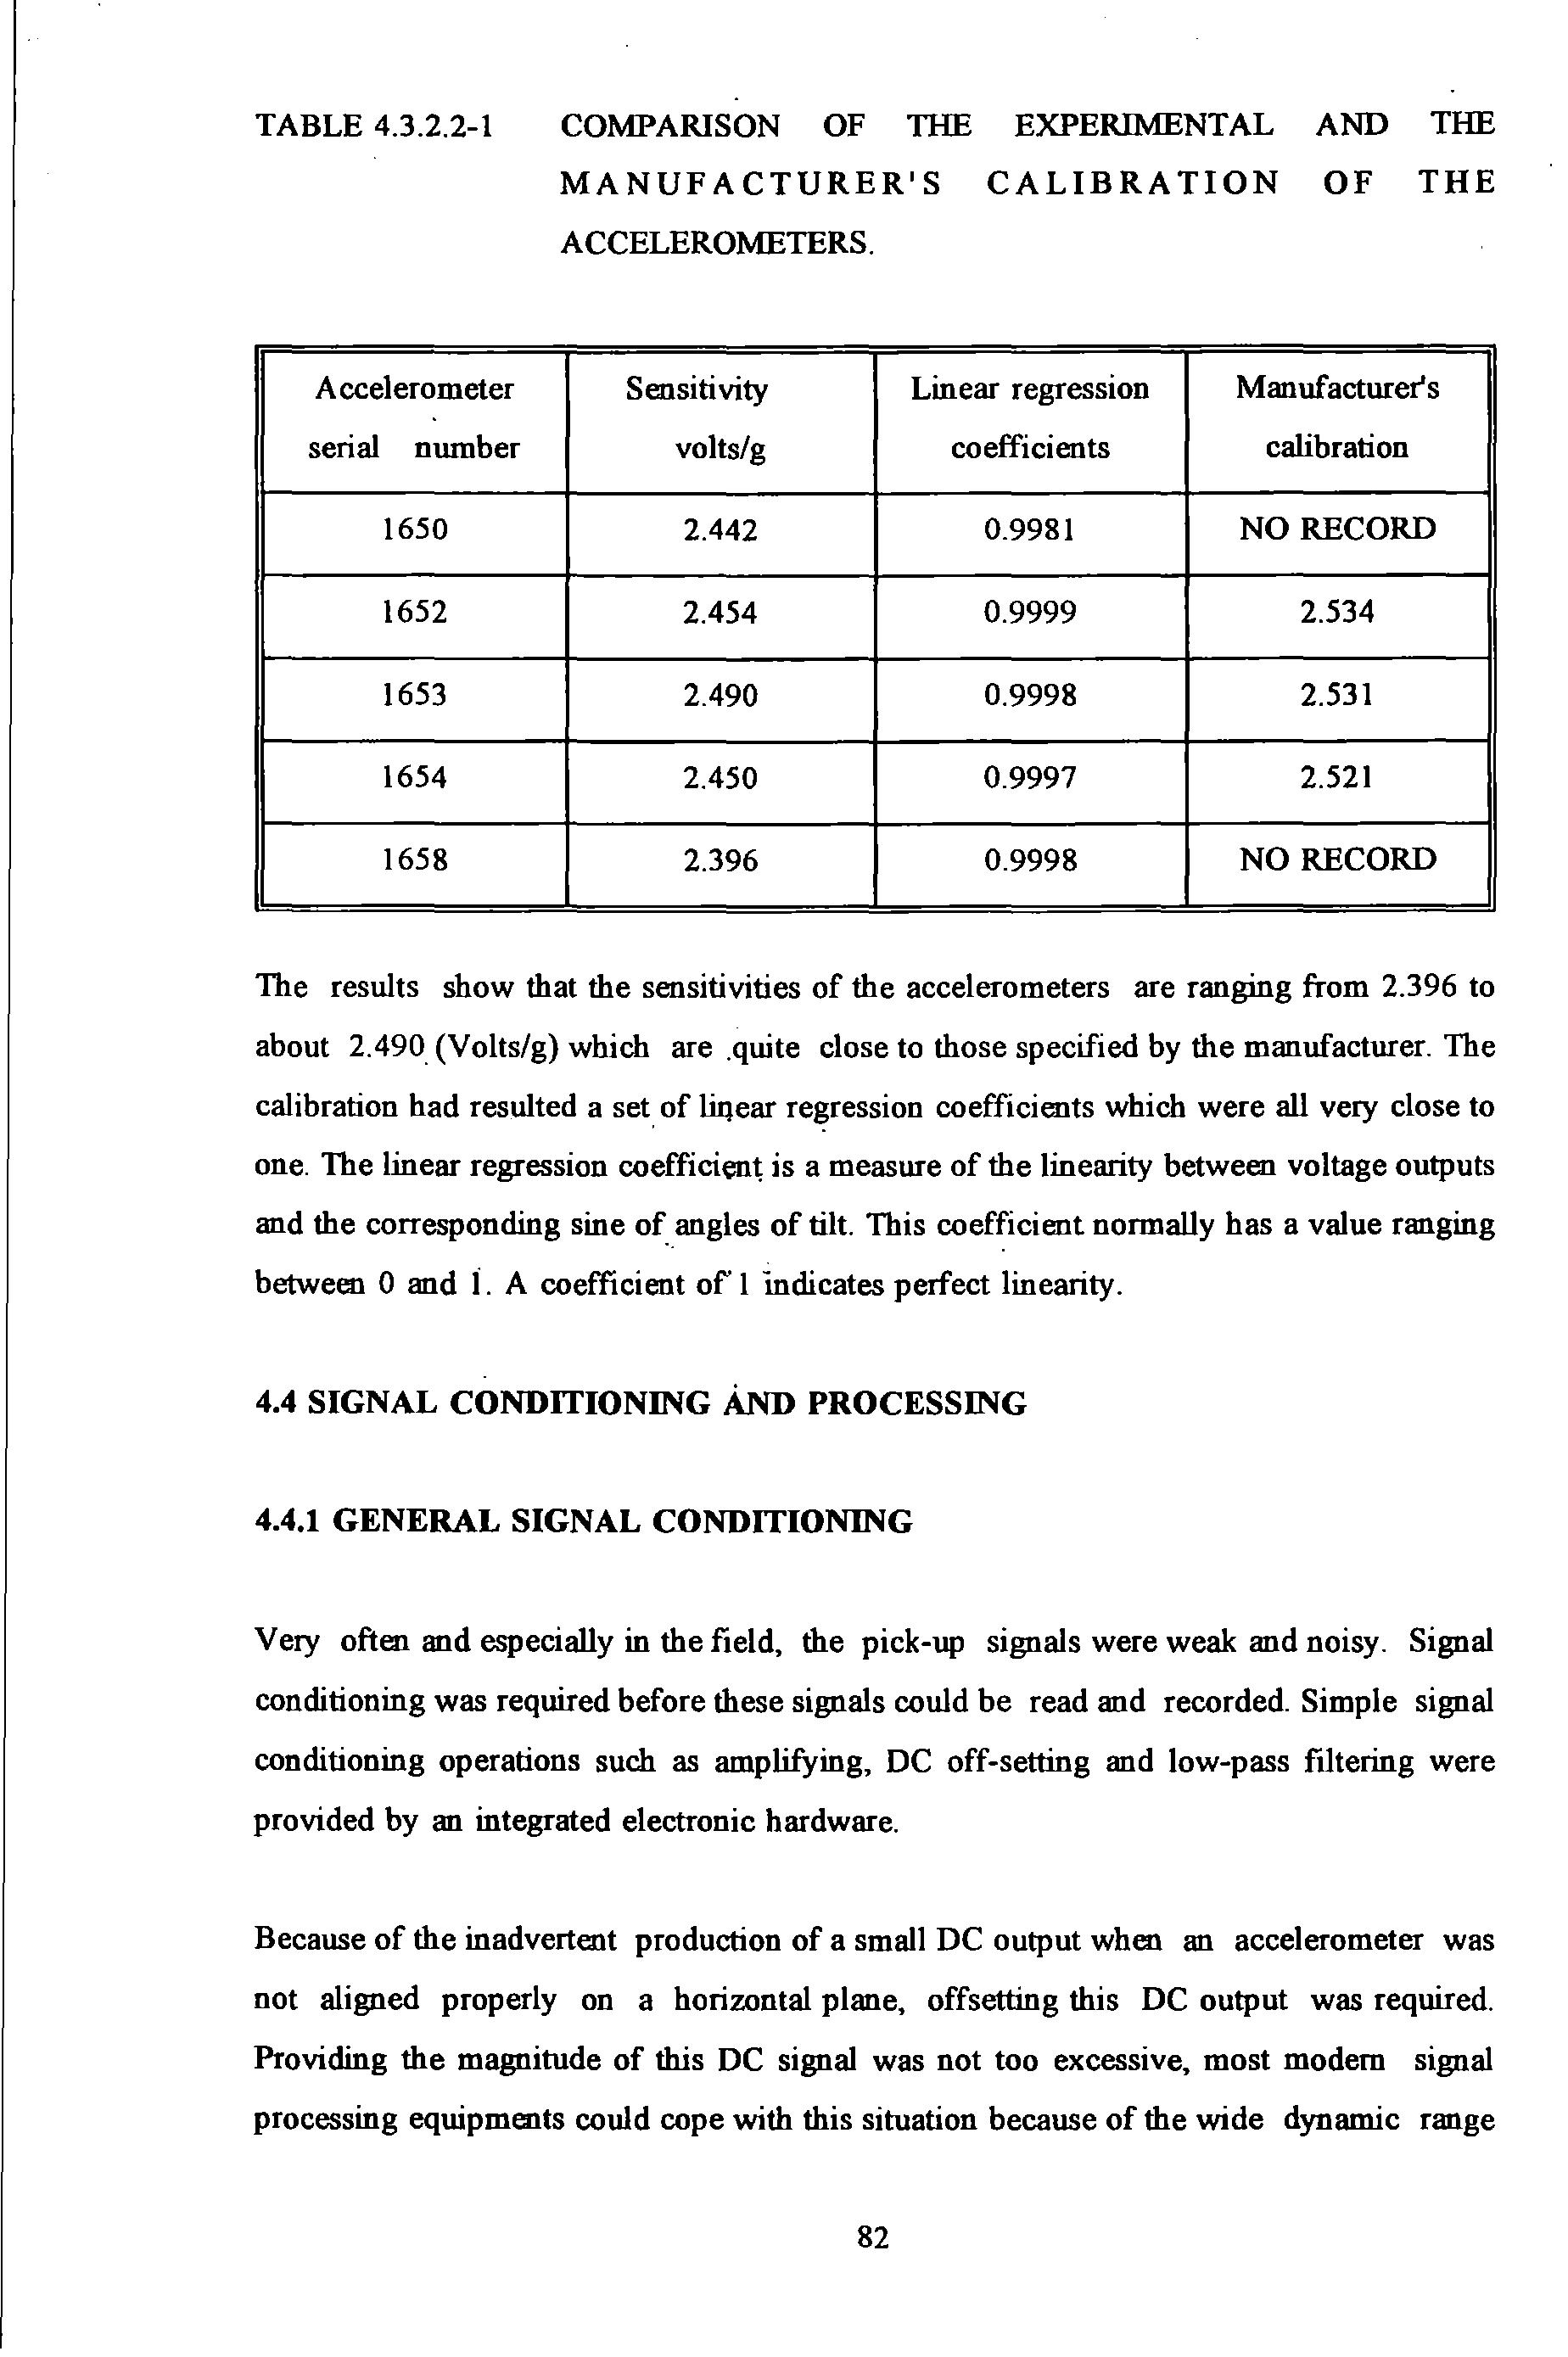
The results of the calibration are summarized in Table 4.3.2.2-1.
TABLE 4.3.2.2-1
COMPARISON OF THE EXPERIMENTAL AND THE MANUFACTURER'S CALIBRATION OF THE ACCELEROMETERS.
The results show that the sensitivities of the accelerometers are ranging from 2.396 to about 2.490 (Volts/g) whicb are .quite close to those specified by the manufacturer. The calibration had resulted a set of liqear coefficients which were all very close to one. The linear regression is a measure of the linearity between voltage outputs and the corresponding sine of angles of tilt. This coefficient normally has a value ranging ·. between 0 and i. A coefficient of 1 indicates perfect linearity.
4.4 SIGNAL CONDITIONING AND PROCESSING
4.4.1 GENERAL SIGNAL CONDITIONING
Very often and especially in the field, the pick-up signals were weak and noisy. Signal conditioning was required before these signals could be read and recorded. Simple signal conditioning operations sucb as amplifying, DC off-setting and low-pass filtering were provided by an integrated electronic hardware.
Because of the inadvertent production of a small DC output when an accelerometer was not aligned properly on a horizontal plane, offsetting this DC output was required. Providing the magnitude of this DC signal was not too excessive, most modem signal processing equipments could cope with this situation because of the wide dynamic range and high sensitivity they have. The HP 3582A spectrum analyzer has a 75 dB dynamic range to spare. So DC offset operation was often waived in return .for a speedy measurement.
4.4.2 SIGNAL RECORDING
4.4.2.1 ANALOG TAPE RECORDING
The outputs from various transducers were analog voltage signals and were recorded using a RACAL instrumentation tape recorder. The recorder was a four channels FM tape recorder with a range of selectable recording speeds. A speed of I 5/16 inches per second was chosen for most recordings. At this speed, the recorder has a useful bandwidth from DC to about 300 Hz. Details of the operation of the recorder can be found elsewhere 14 .41 Tape recording was used for backup only.
4.4.2.2 DIGITAL DATA RECORDING
Handling and processing data recorded as analogue signals was very troublesome and inefficient. Digital data which are not only easy to transfer from one recording medium to another but also provide high fidelity of transfer. In Section 4.5, the details on the digital processing and recording of data utilizing a desk-top computer will be described.
4.4.3 EXCITATION SIGNAL GENERATION
4.4.3.1 SINUSOIDAL SIGNALS
The ram's motion is under the control of the input signal fed into the DARTEC control panel. These signals, and hence the ram's motion, could be sinusoidal or random. An internal sinusoidal signal generator is provided as an integral part of the control panel for this purpose. However an external signal source, a Philips PM 5190 programmable Low Frequency signal synthesizer, was used instead. Sinusoidal signal generation in the synthesizer is based on digital algorithms rather than crystal oscillations. This equipment can either be controlled from the front-panel or remotely via an IEC 625 interface. Signal frequencies are selectable from l MHz to 2 MHz, and AC voltage levels are also selectable from 0 to just below 20 Volts. It also allows an option of imposing an intended DC bias voltage over the preset AC voltage levels . Details of the operation of the generator can be found elsewherel 4 .5J _
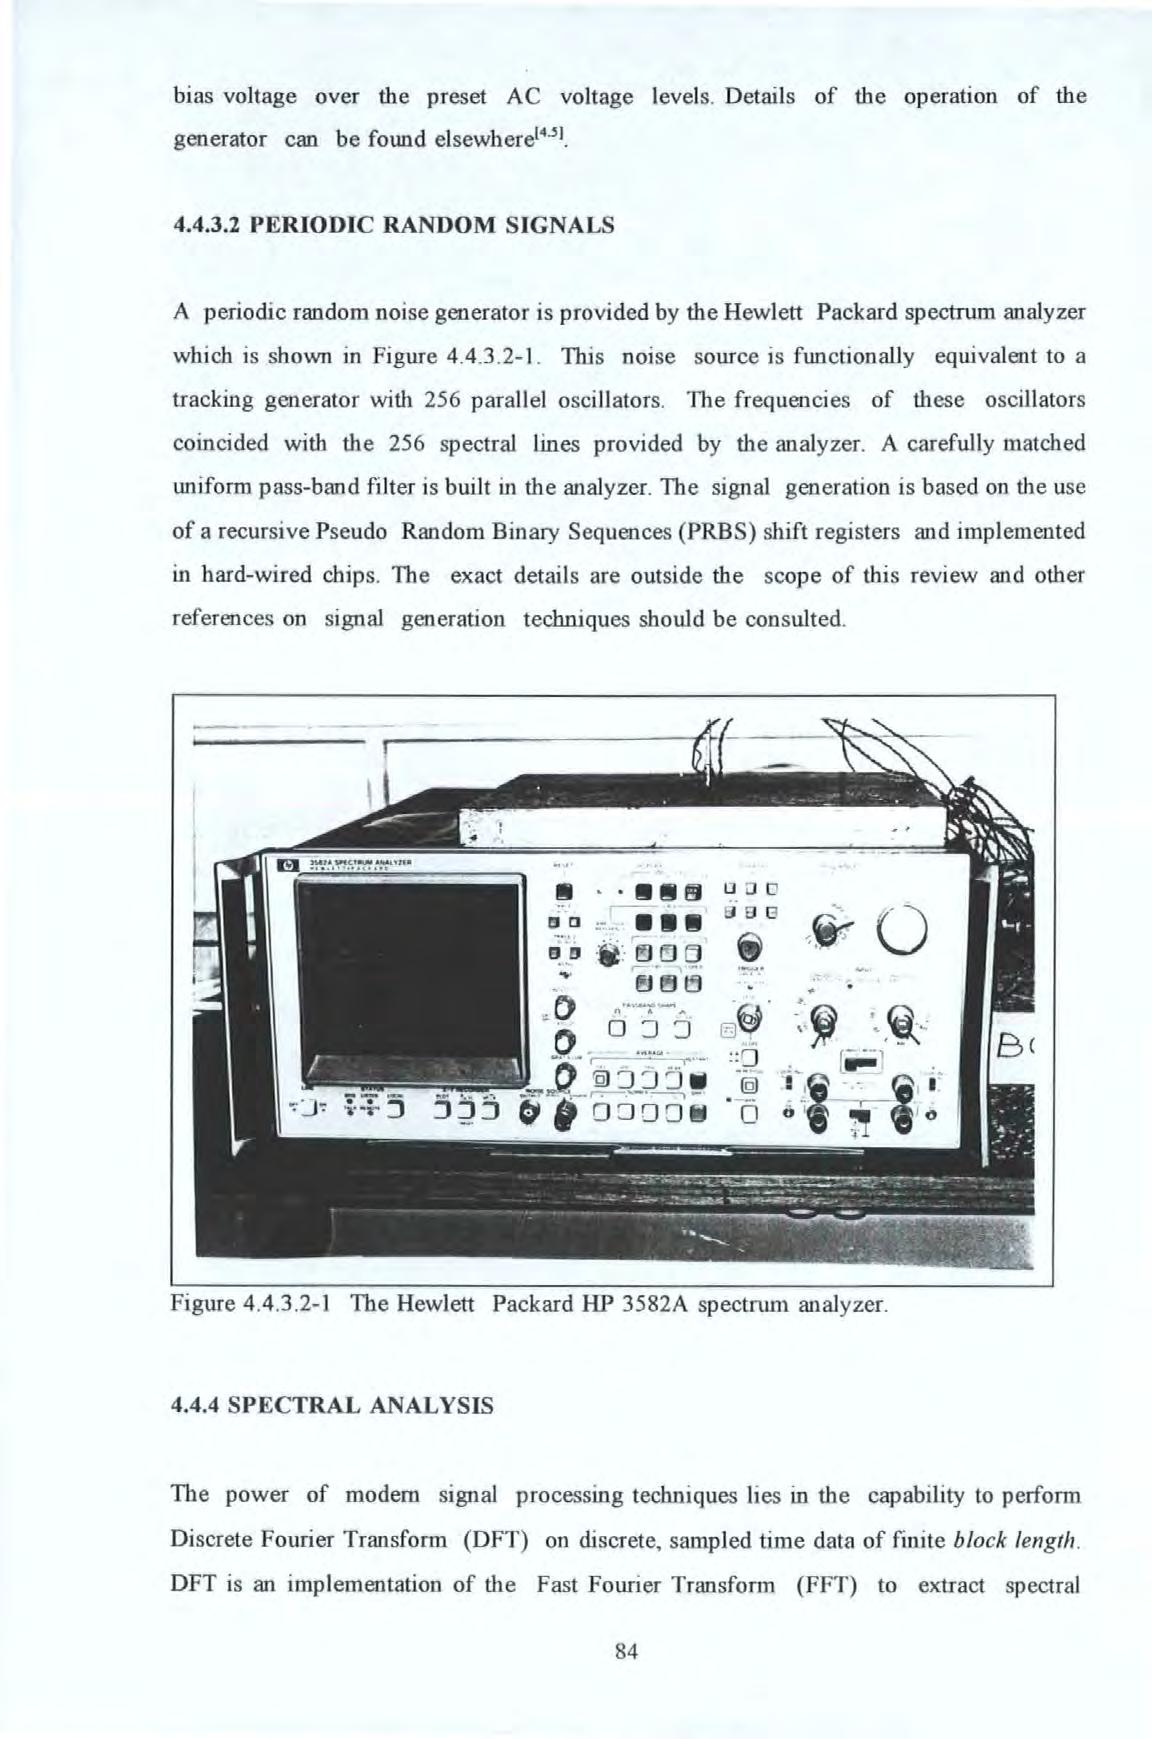
4.4.3.2 PERIODIC RANDOM SIGNALS
A periodic random noise generator is provided by the Hewlett Packard spectrum analyzer which is shown in Figure 4.4 3 2-1. This noise source is functionally equivalent to a tracking generator with 256 parallel oscillators. The f r equencies of these oscillators coincided with the 256 spectral lines provided by the analyzer. A carefully matched uniform pass-band filter is built in the analyzer. The signal generation is based on the use of a recursive Pseudo Random Binary Sequences (PRBS) shift registers and implemented in hard-wired chips The exact details are outside the scope of this review and other references on signal generation techniques should be consulted .
4.4.4 SPECTRAL ANALYSIS
The power of modem signal processing techniques lies in the capability to perform Discrete Fourier Transform (DFT) on discrete, sampled time data of finite block length . DFT is an implementation of the Fast Fourier Transform (FFT) to extract spectral information from sampled time data. Equipment with such capability is called a spectrum analyzer, or a Fourier analyzer. The analyzer used in this investigation was a Hewlett Packard HP 3582A dual channel real-time spectrum analyzer. A brief description of the signal processing performed in the analyzer is given below.
Incoming signals are first passed through an analogue 25 KHz low-pass filter. This filter eliminates any energy in the signals due to frequencies higher than the fastest sampling rate. Failure to do so produces aliasing (see Ewins 15 10 1 for a concise description). The filtered signals are then passed through an analogue-digital-converter (ADC) which has 12 bits precision of conversion.
Further digital filtering is performed by four Large Scale Integration chips which can be considered as a cascade of eight distinct filter stages as a close analogy. Each stage of the filter reduces the incoming signal bandwidth by a factor of 2 or 5. The ADC is set at a sampling rate of I 02.4 KHz i.e. 102400 samples per second. The filtered time sequences are then stored in the time buffer until a full I 024 data points (data block length for single channel) or 512 (for dual channels) are recorded.
The time domain data are then 'windowed' which can be considered as a process of 'point-by-point' multiplication of the digitized time data and the stored weighting functions appropriate to the window selected. A suitable window has to be selected in relation to the types of signals encountered. Windowing suppresses a signal processing problem known as leakage (see Ewins ''·10 1 for a concise description).
The DFT computation is performed by a 16 bits built-in micro-processor inside the analyzer. The computed spectral data are then stored in the frequency buffers and can be called up for display on the analyzer screen. Averaging is also performed to improve the quality and accuracy of the measurements. A good selection of different averaging facilities are provided by the analyzer : such as time or root-mean-square RMS spectral averaging. Further information regarding the operation of the analyzer can be found elsewhere f4.6f,f4.7) and f4.8l.
4.5 COMPUTER-AIDED-TESTING (CAT)
Labour and time intensive manual testing techniques are no longer adequate for the new advanced methods. The advent of instrumentation technologies, and the successful miniaturization of computer hardware bring CAT from the laboratory to the field. Automation in data acquisition and recording can now be carried out in the field. Many more commercial systems are now available from well known manufacturers such as: Bruel & Kjaer, Solartron or Structural Dynamic Research Corporation etc. However this research had not have the opportunity of obtaining any one of these systems. Instead a system of very low cost was developed in-house.
4.5.1 THE HARDWARE CONFIGURATIONS
Basically, the CAT system was built upon the integration of several stand-alone instruments with a Hewlett Packard HP 86B micro-computer (a schematic of this system is shown in Figure 4.1-1 ). The resulting costs were low if the costs of software developments were discounted. The extra costs on the hardware required was small.
The physical integration was achieved by interfacing the computer, its peripherals and other remotely controlled ('remote control' is used here as a contrast to local'front-panel' control) equipments via an IEEE 488 Interface, or otherwise known as the Hewlett Packard Interface Bus (HPIB). The IEEE 488 bus is one of the most popular universal interface standards which unify both the hardware and software interfacing requirements. This standard has been adopted by most instrument manufacturers in their products. Other standards such as the European IEC 625 or the RS 232 are also used.
Equipments with the same interface can simply be plugged together with suitable cables and connectors. Equipments complying with different standards can also be linked together provided suitable adaptors are used. These adaptors are more than just merely a device for mechanical compliance. A special adaptor was made to enable the interfacing of the PHILIPS signal synthesizer, which is based on the IEC 625 standard, to the IEEE 488 based bus.
On the HP 86 computer, this interface capability is supported by an input/output interface cartridge (an HP 82936A 1/0 ROM Drawer). In essence, this cartridge allows the computer: a. to address to each interfacing instrument, b. to perform controls and data input/output operations using high level programming languages rather than low level machine languages and c. to perform 'handshaking' according to the designated protocols during data transmission.
4.5.2 THE CONTROL PROGRAMS
The test sequences and the associated controls were coded as a computer program. This control program was written in extended HP BASIC and was designed and written in a modular structure so that future modifications and additions could be done easily. The running of the program was menu driven and an operator's intervention was kept to a minimum. This program was capable of the following tasks : a. Remote setting up of equipments (this was done by sending appropriate sequences of the HPIB interface commands from the computer to the various instruments via the IEEE 488 bus). b. Interrogation of the status of the measurement process, for instance to check if overloading had occurred (this was done by interrogating a particular bit in a special memory register chip inside the HP3582A analyzer) c. Recording digital data and spectral displays from the analyzer onto magnetic disks for storage {this was done by down-loading sequences of bits from the special memory registers inside the HP3582A analyzer which held the spectral and screen display data).
As a result, testing could be performed much more speedily than before and large quantities of useful data could be acquired with very little attention from the operator. Generally, this CAT system is beneficial to the experimentation process in a number of ways: a. It eliminates the tedious tasks of manual recording and switching. b. It increases the speed of data recording, retrieval and storage c. It makes immediate on-site processing possible for preliminary checking of data. d. It allows data transferability from one to another computing environments between micros, PC or main-frame computers. The latter is particularly useful for very large scale data processing and calculation.
Details and listing of the control program are given in APPENDIX 4.5.2.
4.6 SUMMARY
A new excitation mechanism was developed and its performance checked. Generally, the exciter has to be operated well within the operating limits otherwise non-linear distortions will result. The sensors were all calibrated so that measured data can be converted to their real physical units. The force read by the Dartec load cell have a +5% error relative to the load transmitted to the mounting. A low cost but powerful CAT system was successfully developed and could be put to use in the field.