12 minute read
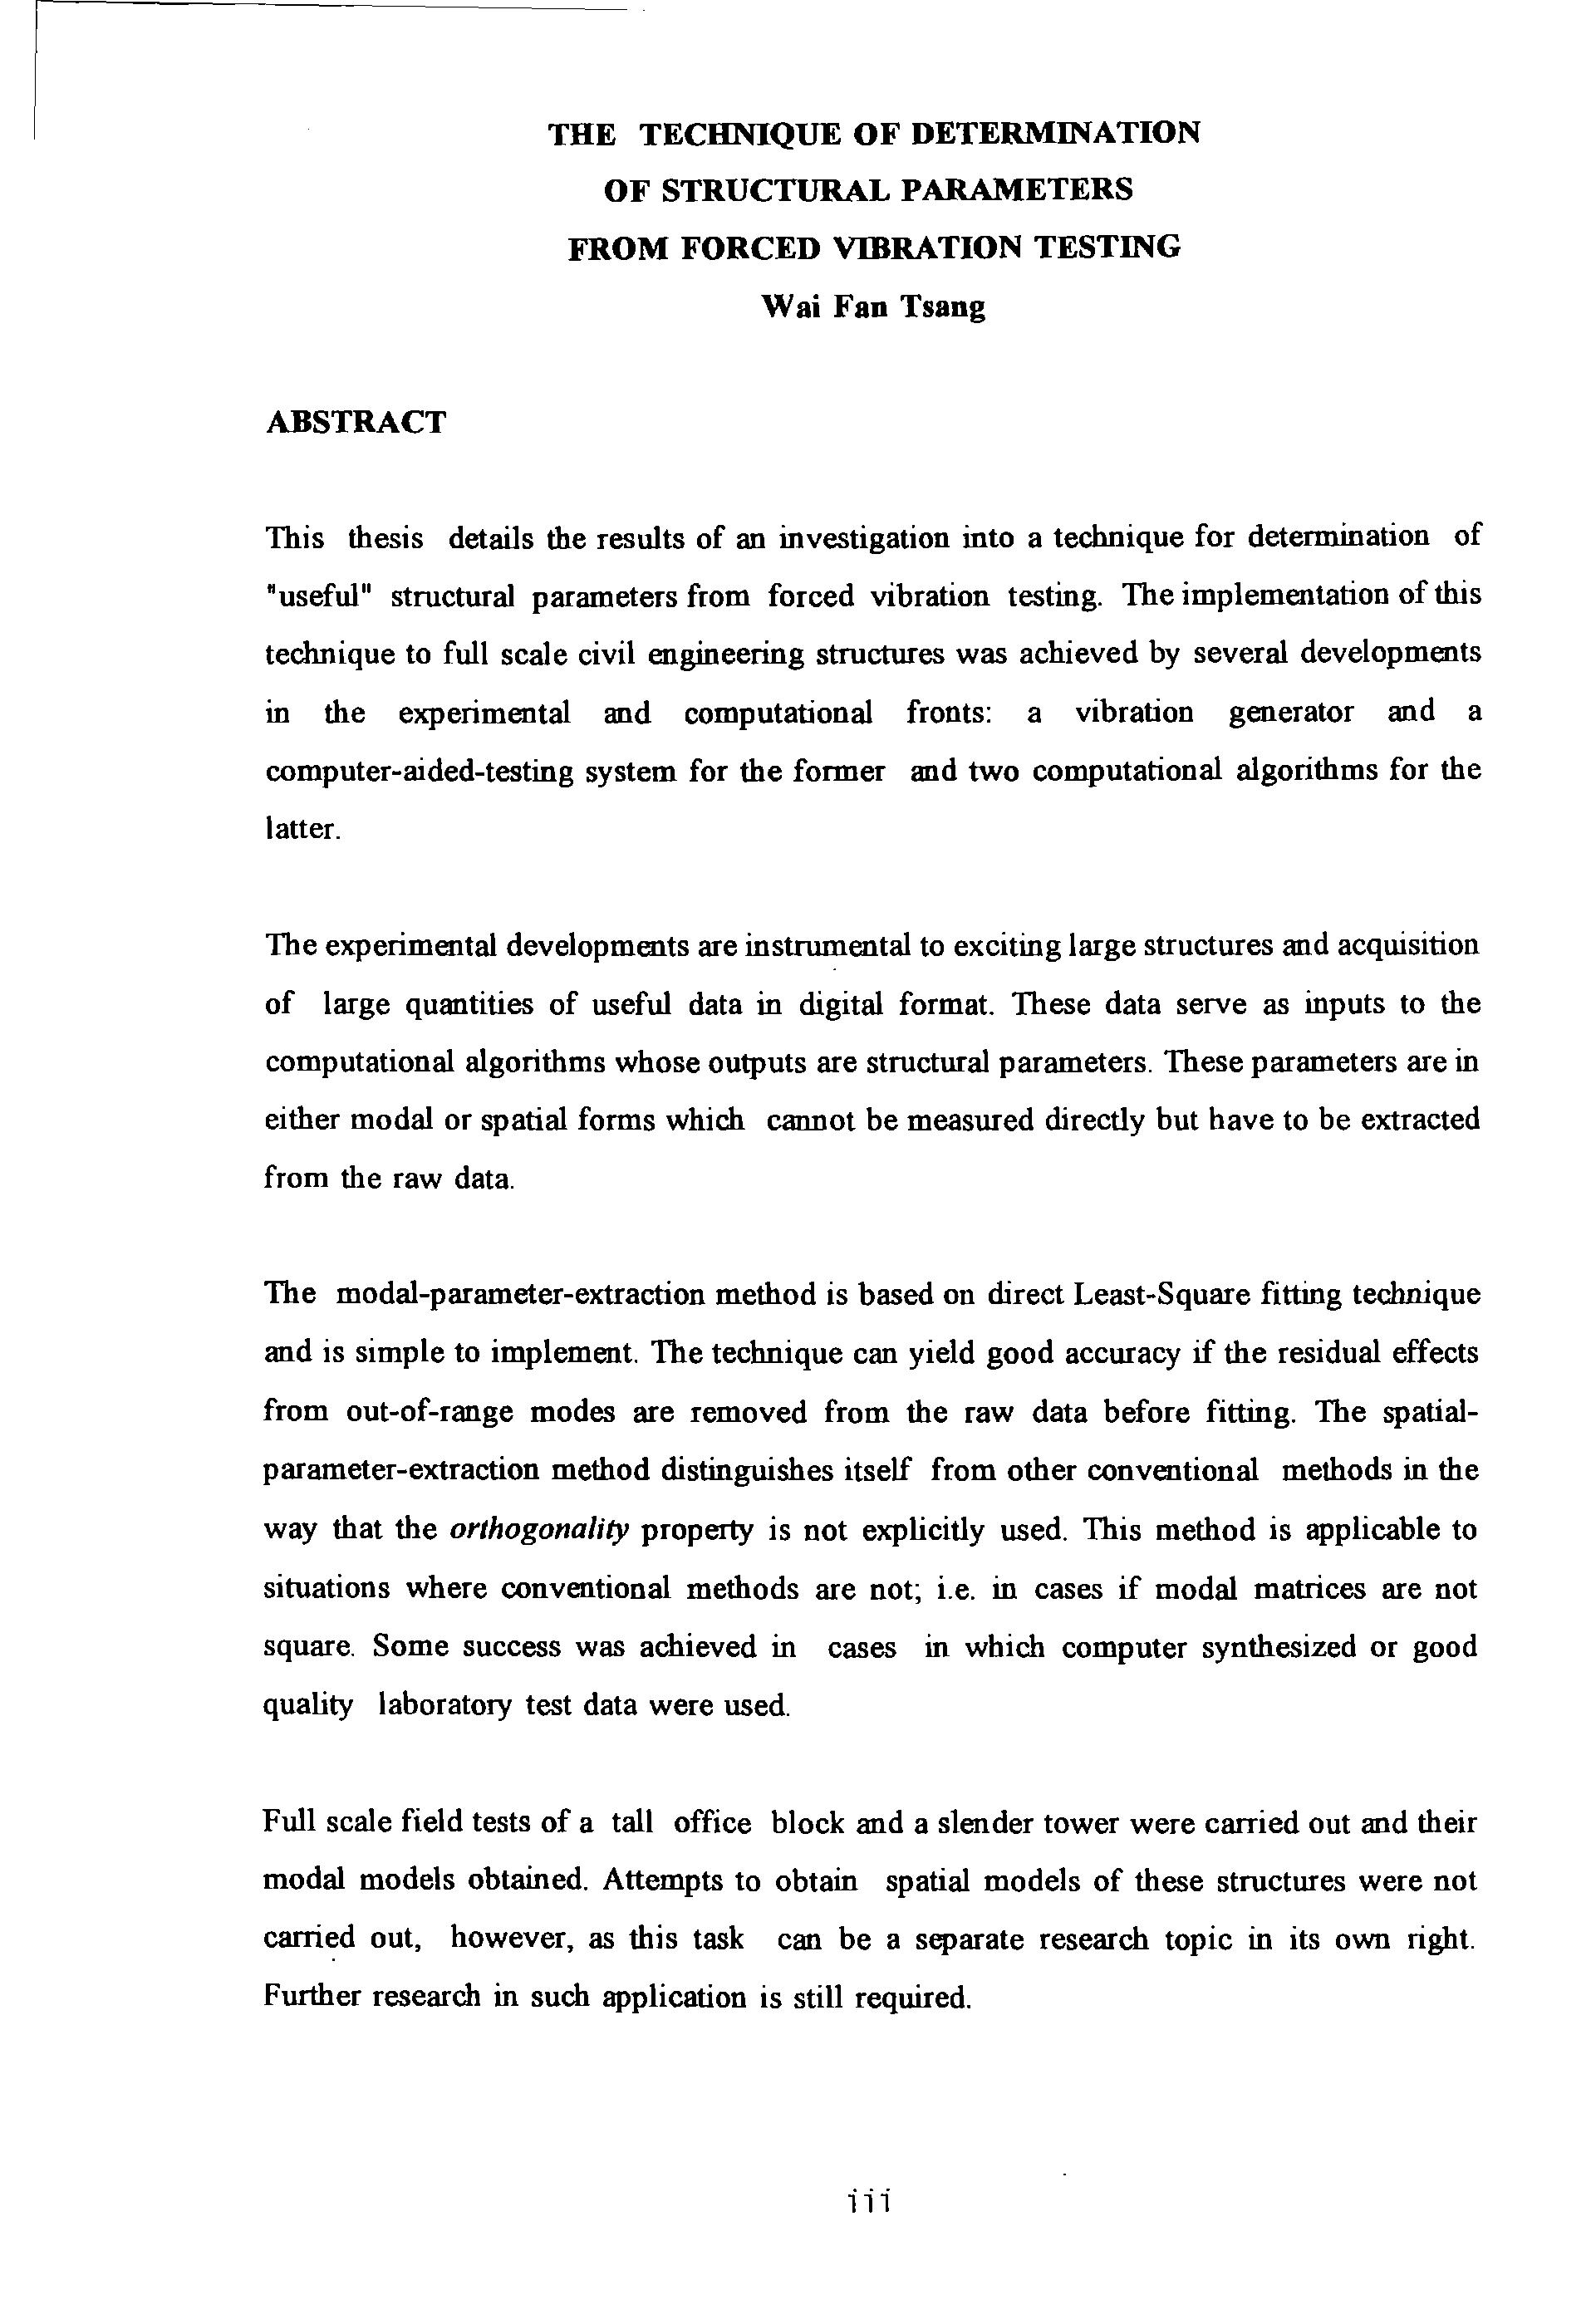
THE TECHNIQUE OF DETERMINATION OF STRUCTURAL PARAMETERS FROM FORCED VIBRATION TESTING

from Technique of Determination of Structural Parameters From Forced Vibration Testing
by Straam Group

Wai Fan Tsang
Abstract
Advertisement
This thesis details the results of an investigation into a technique for determination of "useful" structural parameters from forced vibration testing. The implementation of this technique to full scale civil engineering structures was achieved by several developments in the experimental and computational fronts: a vibration generator and a computer-aided-testing system for the former and two computational algorithms for the latter.
The experimental developments are instrumental to exciting large structures and acquisition of large quantities of useful data in digital format. These data serve as inputs to the computational algorithms whose outputs are structural parameters. These parameters are in either modal or spatial forms which cannot be measured directly but have to be extracted from the raw data.
The modal-parameter-extraction method is based on direct Least-Square fitting technique and is simple to implement. The technique can yield good accuracy if the residual effects from out-of-range modes are removed from the raw data before fitting. The spatialparameter-extraction method distinguishes itself from other conventional methods in the way that the orthogona/ity property is not explicitly used. This method is applicable to situations where conventional methods are not; i.e. in cases if modal matrices are not square. Some success was achieved in cases in which computer synthesized or good quality laboratory test data were used.
Full scale field tests of a tall office block and a slender tower were carried out and their modal models obtained. Attempts to obtain spatial models of these structures were not carried out, however, as this task can be a separate research topic in its own right. Further research in such application is still required.
List Of Figures
Figure 2.1.1.2-1
Figure 3.2.2.2-1
Figure 3.3.2.3.2-1
Figure 4.1-1
Figure 4. 2. 1-1
Figure 4.2.2-1
Figure 4.2.2-2
Figure 4.2.3-1
Figure 4.2.3-2
Figure 4.2.3-3
Figure 4.4.3.2-1
Figure 5.1.1.1-1
Figure 5.3-1
Figure 5.3-2
A photograph featuring the BRE's ERM exciter in the field
A simple bending beam subjected to shear and bending.
A schematic drawing showing the design, analysis, testing and redesign cycle
Schematic presentation of the configuration of the instrumentation system
A photograph showing the dismantled DARTEC hydraulic power system
A schematic drawing showing the hardware configuration of the excitation system. A photograph showing the excitation system. Acceleration responses of the loaded ram of the actuator over a range of input voltages and frequencies. Stroke responses of the loaded ram of the actuator over a range of input voltages and frequencies. Load generation capability of the exciter over a range of input voltages and frequencies.
The Hewlett Packard HP 3582A spectrum analyzer
A modal circle traced by consecutive FRF data points
Marking of resonant peaks with vertical lines on the modulus and imaginary lnertance FRF plots
Overlaid plots of original and regenerated Inertance FRF for the fictitious system with frequency resolution of 0.1 Hz and damping factor of 0.1 % of critical damping
Figure 5.3-3
Overlaid plots of original and regenerated Inertance FRF for the fictitious system with frequency resolution of 0.1 Hz and damping factor of 1 % of critical damping
Figure 5.3-4
Overlaid plots of original and regenerated Inertance FRF for the fictitious system with frequency resolution of I Hz and damping factor of 0.00 I % of critical damping
Overlaid plots of original and regenerated Inertance FRF for the fictitious system with frequency resolution of I Hz and damping factor of 0.01 % of critical damping Overlaid plots of original and regenerated Inertance FRF for the fictitious system with frequency resolution of I Hz and damping factor of 0.1 % of critical damping Overlaid plots of original and regenerated Inertance FRF for the fictitious system with frequency resolution of 2.5 Hz and damping factor of 0.001 % of critical damping Overlaid plots of original and regenerated Inertance FRF for the fictitious system with frequency resolution of 2.5 Hz and damping factor of I 0 % of critical damping A schematic showing how the proposed method bypasses the conventional modal procedures to obtain the spatial matrices
Receptance spectrum for the 3 DOF fictitious system at spatial point No. I
Receptance spectrum for the 3 DOF fictitious system at spatial point No. 2
Receptance spectrum for the 3 DOF fictitious system at spatial point No. 3
Overlaid plots of original and regenerated Receptance spectra for spatial point I from a reduced model of order 6
Overlaid plots of original and regenerated Receptance spectra for spatial point 2 from a reduced model of order 6
Overlaid plots of original and regenerated Receptance spectra for spatial point 3 from a reduced model of order 6
Overlaid plots of original and regenerated Receptance spectra for spatial point 4 from a reduced model of order 6
Figure 7.4-1 a
Figure 7.4-1 b
The autospectrum obtained in the ambient vibration tests from accelerometer A Another autospectrum obtained in the ambient vibration tests from accelerometer B
A Coherence spectrum obtained from ambient tests.
A Phase spectra from ambient tests.
The Inertance FRF spectrum from SS tests with the exciter aligned in the NS direction. The Inertance FRF spectrum from SS tests with the exciter aligned in the EW direction.
A typical time history record of the PRBS excitation force (load) and the resulting responses from the two accelerometers
The NS 1 mode shape determined from the SS and PRBS tests.
An overlaid plot of the NS 1 mode shapes of the BR building.
The EW 1 mode shape of the BR building.
An overlaid plot of the EW 1 mode shapes of the BR building
The T1 mode shape of the BR building. The NS2 mode shape of the BR building.
The EW2 mode shape of the BR building. The finite element wire-framed model of the BR building.
A 3 dimensional perspective view of the EW 1 mode shape from the finite element model of the BR building
A side view of the EW l mode shape from the finite element model of the BR building.
A 3 dimensional perspective view of the T1 mode shape from the finite element model of the BR building
A side view of the Tl mode shape from the frnite element model of the BR building.
Figure 7.5-4
The EW2 mode shape from the finite element model of the BR building.
A photographic view of the Camel's Head fire drill tower.
Locations of the exciter and designation of the grid points
Modulus inertance FRF spectrum using SS tests
Change of acceleration and inertance of the mode at 2.34 Hz with increase magnitude of force using SS excitation
Change of acceleration and inertance of the mode at 2.48 Hz with increase magnitude of force using SS excitation
Modulus and phase inertance FRF plot using SS excitation. Measurement was made at 5A I with exciter acting in the EW direction and force amplitudes of 0.05 KN (r.m.s.)
Modulus and phase inertance FRF plot using SS excitation. Measurement was made at 5A I with exciter acting in the EW direction and force amplitudes of 0.1 KN (r.m.s.)
Modulus and phase inertance FRF plot using SS excitation. Measurement was made at 5A I with exciter acting in the EW direction and force amplitudes of 0.15 KN (r.m.s.)
Modulus inertance FRF plot using SS excitation
Measurement was made at 5A 1 with exciter acting in the EW direction.
Modulus inertance FRF plot using SS excitation
Measurement was made at 5A I with exciter acting in the NS direction.
Inertance FRF spectra from PRBS excitation (EW) test (R2304007) zooming in at 2 Hz lnertance FRF spectra from PRBS excitation (EW) test (R2304006) zooming in at 5 Hz
Inertance FRF spectra from PRBS excitation (EW) test (R2304003) zooming in at 10Hz
Table 4.3.2.2-1
Table 5.3-1
Table 5.3-2
Table 5.3-3
List Of Tables
Comparison of the experimental and the manufacturer's calibration of the accelerometers
Table illustrating the mechanics of the calculation using the proposed algorithm
Assumed modal parameters for a four-modes fictitious system
Results of modal parameters determined using iterative mode subtraction for the four-modes fictitious system
Table 5.3-4
Table 5.4-1
Table 6.2.3 .1-1
Table 6.2.3.1-2
Table 6.2.3.1-3
Table 6.2.3.3-1
Table 6.2.3.3-2
Effects on QF Factors by using various mode combinations
Percentage errors in the modal parameters determined using author's method
Specified spatial parameters of the 3 DOF system used in the computer simulation studies
The specified mass matrix of the I 0 DOF system used in the computer simulation studies
The specified stiffness matrix of the I 0 DOF system used in the computer simulation studies
The reduced order 6 x 6 mass matrix of the l 0 DOF fictitious system determined by the algorithm
The reduced order 6 x 6 stiffness matrix of the l 0 DOF fictitious system determined by the algorithm
Table 6.2.4-l
Table 6.2.4-2
Table 6.2.4-3
Table 6.2.4-4
The derived spatial matrices of the torsional system (undamped model)
The derived spatial matrices of the torsional system (damped model)
Details of analysis conditions to derive the spatial model of the beam
The spatial matrices of order 6 derived for the beam (undamped model) with selected data points covering all six modes (model A)
260487008R (from 25 Hz PRBS tests with exciter acting NS and measurements made at grid point 4A2 in the NS direction)
Modal parameters set determined from test data
R25X021X (from 25 Hz PRBS tests with exciter acting EW and measurements made at grid point 5A2 in the EW direction)
Modal parameters set determined from test data
R25Y023Y (from 25 Hz PRBS tests with exciter acting NS and measurements made at grid point 5B2 in the NS direction)
Modal parameters set determined from test data
R 25Y021X (from 25 Hz PRBS tests with exciter acting NS and measurements made at grid point 5A2 in the EW direction)
Modal parameters set determined from test data
R 25YO 17Y (from 25 Hz PRBS tests with exciter acting NS and measurements made at grid point 4A 1 in the NS direction)
Modal parameters set determined from test data
R 25Y001Z (from 25 Hz PRBS tests with exciter acting NS and measurements made at grid point OA 1 in the Vertical direction)
Definition Of Terms And Abbreviations
Modal parameters
Computer-Aided-Testing
Finite Element Modelling
Boundary Element Modelling
Experimental Modal Analysis
Frequency Response Function
A set of parameters (natural frequencies, modal damping factors and modal constants) which characterise the modes of vibration of a physical structure
Spatial parameters
A set of parameters (mass, damping and stiffness) which characterise the inertial, energy dissipation and elastic properties of a physical structure
Impulse Response Functions
Rectilinear motion hydraulic inertial exciter Eccentric rotating mass exciter
Step-sine excitation
Pseudo-Random-Binary-Sequence technique to generate random wave
Earthquake Engineering Research Laboratory in USA
California Institute of Technology, USA.
Building Research Establishment in UK
Earthquake Engineering Research Centre in USA
Central Electricity Generating Board three dimensional xix
Finite Element wall ratio (the total length of all walls divided by the sum of the floor areas of all floors). the natural frequency of vibration (in Hz) natural period of vibration (in seconds) number of storey of a building height of a building width of a building
Engineering Science Data Unit
Degree of freedom
Strain and stress tensors respectively in indicia) notation spatial displacement vector in rectangular Cartesian coordinates the internal body forces the surface traction a function of differential operators a fourth order elastic constants tensor the Young's modulus and Shear modulus respectively the two Lame constants mass density of material dilatation
Laplacian operator
Finite Element Methods
Boundary Element Methods a true solution of displacement u a symbol denoting the domain an expression denoting the essential boundary conditions an expression denoting the natural boundary conditions denoting the total boundary a set of linear independent functions to approximate a set of oodetermined parameters used to approximate Uo residual error a set of weighting fooctions displacement in the y-direction along the length of the beam x arbitrary constants used to specify the deformation field of a beam a polynomial matrix as a function of x used to specify the deformation fteld of a beam nodal displacements strain energy kinetic energy
Yooog's Modulus of a material moment of inertia of a beam section axial and torsional displacement respectively mass density of materials angular frequency of vibration
Volume length of a beam mass matrix stiffness matrix damping matrix displacement, velocity, acceleration vectors respectively in arbitrary Cartesian coordinates displacementt, velocity, acceleration vectors respectively in natural coordinates the modal matrix and is a matrix whose columns are eigenvectors is the transpose of modal matrix are the diagonal Generalised mass, stiffness and damping matrices respectively are the rtb row stb column elements of the matrices [K*] and [M*] respectively are the two proportional parameters used in the Rayleigh's damping model the forcing vector is a diagonal matrix of modal damping factors is the spectral matrix and is a diagonal matrix of the eigenvalues ro,1 is the undamped natural frequency denotes the rlh mode when used in conjunction with modal parameters modal damping factor is eigenvectors (or natural mode shape) of the rlh mode is the diagonal matrix of modal damping factors are the amplitude and phase angle respectively used in defming the manifestation of a mode shape is a vector of phase angles c:p, the characteristic detenninant equals ro,( l - 1;1 , and is the damped natural frequency a damping matrix where the subscript nd denotes non-diagonal a damping matrix where the subscript re denotes it is a reconstruction a diagonal damping matrix which is obtained by retaining only the diagonal terms of the matrix [C.d] is a diagonal matrix constructed from known modal damping factors !;, and undamped natural frequencies ro, a proportional constant independent of frequency of harmonic oscillation used in describing energy dissipated by hysteretic damping is the amplitude of displacement oscillation is the frequency of harmonic oscillation is the viscous damping coefficient the coefficients of structural damping hysteretic damping matrix complex stiffness a superscript denotes complex quantities are complex eigenvectors a complex modal matrix denotes a complex conjugate of a vector
Single-Input-Single-Output
Single-Input-Multiple-Output
Multiple-Input-Single-Output
Multiple-Input -Multiple-Output
Frequency Response Function receptance defined as a ratio of the spectral displacement response at coordinate i and the force applied at another coordinate j of a structure
Transfer Function
Discrete Fourier Transformation denotes the Fourier Transform operator
Power Spectral Density function a complex valued PSD function the Cross PSD functions of response x and force f the Auto PSD functions of force f and response x respectively a coherence spectral function receptance defmed as a ratio of the spectral displacement response at coordinate i and the force applied at another coordinate j of a structure mobility defmed as a ratio of the spectral velocity response at coordinate i and the force applied at another coordinate j of a structure accelerance or inertance defmed as a ratio of the spectral acceleration response at coordinate i and the force applied at another coordinate j of a structure
Manufacturer of the hydraulic actuator
Manufacturer of the load cell used in calibration
Manufacturer of the accelerometers
Signal with constant amplitude and zero frequency
Frequency Modulation
Discrete Fourier Transform
Fast Fourier Transform
Analogue-to-digital converter
Time Domain methods
Frequency Domain methods is a hysteretic damping loss factor denotes the ilh mode of vibration when used in conjunction with modal parameters bysteretic damping matrix is the undamped natural frequency are the real and complex modal constants respectively magnitude of the complex modal constant is the total number of degree of freedom
(or modes) of the system denotes response at coordinate s and force at coordinate r is the imaginary unit ./-1 single-degree-of-freedom multi-degree-of-freedom are quantities corresponding to any two neighbouring points (one on each side of the data point corresponds to ro; ) on a modal circle as shown in Figure 5 .1.1.1 -1. is the diameter of a modal circle unknown parameters used in the rational fraction polynomial method receptance FRF and is a function of angular frequency ro ktb pole and its conjugate residue of the ktb pole and its conjugate damped natural frequencies (the imaginary part of a complex eigenvalue) damping coefficients (the real part of a complex eigenvalue) angular frequency are respectively the Fourier Transforms of displacement {x(t)} and force vectors {f(t)} and are functions of angular frequency ro. undamped modal matrix natural (or modal) coordinates is the diagonal modal or generalised mass matrix. is the diagonal modal or generalised stiffness matrix. is the diagonal modal or generalised damping matrix. the element of the stb row, itb column of the Wldamped modal matrix effective mass effective stiffness effective damping is receptance (a complex quantity) and is a function of angular frequency ro reciprocal of receptance (or dynamic stiffness) the real and imaginary part of receptance respectively accelerance or inertance and is a function of angular frequency ro are the real and imaginary part of dynamic stiffness respectively
A'., (ro) and B'.,(ro) are the real and imaginary parts of the inverse of accelerance respectively the modal damping factor of the ilh mode an indicial notation devised and defined to illustrated the mode subtraction operations where r is the mode number s is the number of iterative cycles performed quality-of-fit factor which quantifies the degree of correlation between two sets of data
Deriving Spatial Parameters from Experimental Data
US National Astronautical and Space Administration
Laplace Transformation operator
Laplace Transformation variable
Transfer Matrix the real part of the vector {X( ro )} the imaginary part of the vector {X( ro )} the real part of the vector {F( ro ) } the imaginary part of the vector {F( ro )} the real part of a( ro ) the imaginary part of a( ro ) the British Rail building
East West direction
North South direction
Root-Mean-Square
Name of a commercially available fmite element analysis software
Name of a powerful network computer manufactured by IBM one-dimensional root-mean-square
Test Identification used to encode different tests carried out attenuator dial reading
Motion Transmissibility
Name of a generally available graphics plotting software