CONSTRUCTION COST REPORT
Corporate Interior Market Data Februar y 202 4
PUBLISHED BY STO BUILDING GROUP GLOBAL SERVICES
Lead Author: Stephen Dennis, Account Executive, Global Services
ABSTRACT
STOBG actively engages with regional construction professionals to monitor cost and construction trends as they develop and seeks to inform and engage with others in the commercial real estate industry so that we may all better understand the daily reality of our markets. Through our global network of operating companies and Strategic Alliance Partners, STOBG collects and analyzes data from actual projects across our geographic platform to generate timely reports that represent the market as it stands.
The following data represent median construction costs from actual projects under construction recently procured interior fit-out projects spanning from Q3 2023 to Q1 2024 by our family of companies within these specific locales. We hope this bulletin helps you understand the current cost trends and strategically plan your company’s growth into the upcoming quarters.
Page | 1 Construction Cost Report: Corporate Interior Market Data Survey Update - February 2024 (revised as of 2/22/24)
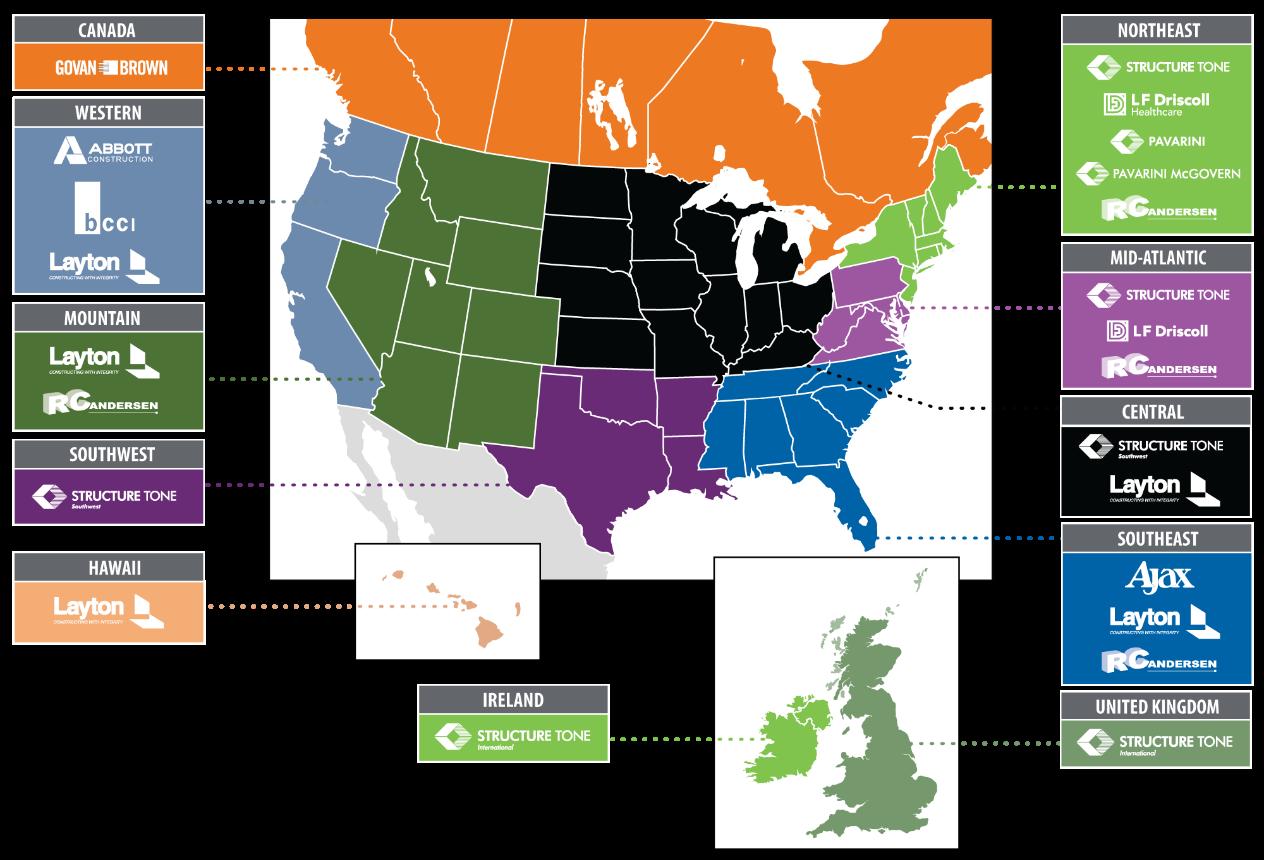
▪ Atlanta, GA ▪ Augusta, GA ▪ Austin, TX ▪ Bala Cynwyd, PA ▪ Boise, ID ▪ Boston, MA ▪ Charleston, SC ▪ Dallas, TX ▪ Denver, CO (2) ▪ Fairfield, NJ ▪ Fort Myers, FL ▪ Gainesville, FL ▪ Honolulu, HI ▪ Houston, TX ▪ Irvine, CA ▪ Jacksonville, FL ▪ Lihue, HI ▪ Los Angeles, CA ▪ Mountain View, CA ▪ Nashville, TN STOBG US OFFICE LOCATIONS ▪ Calgary, Canada ▪ Edmonton, Canada ▪ Kitchener, Canada ▪ Ottawa, Canada ▪ Toronto, Canada ▪ Vancouver, Canada ▪ Dublin, Ireland ▪ London, United Kingdom ▪ New York, NY ▪ Orlando, FL (2) ▪ Pasadena, CA ▪ Philadelphia, PA ▪ Phoenix, AZ ▪ Sacramento, CA ▪ Salt Lake City, UT ▪ San Antonio, TX ▪ San Diego, CA ▪ San Francisco, CA ▪ San Jose, CA ▪ Sarasota, FL ▪ Seattle, WA ▪ Stamford, CT ▪ Tacoma, WA ▪ Tallahassee, FL ▪ Tampa, FL ▪ Windham, NH ▪ Woodbridge, NJ STOBG INTERNATIONAL OFFICE LOCATIONS
Boston, MA
CT Hartford, CT New Jersey (Northern) New York, NY Philadelphia, PA Baltimore, MD Washington, DC
Charlotte, NC Raleigh, NC
† Charleston, SC † Atlanta, GA † Tampa, FL
TRADE SPECIFIC BREAKOUT COSTS
Costs (local currency) Per SQFT.
OH
San Francisco, CA Palo Alto, CA
Los Angeles, CA
*Calgary, CAN
*Edmonton, CAN
*Ottawa, CAN
*Toronto, CAN
*Vancouver, CAN
*Kitchener, CAN
London, UK
Ireland
Figure 1: The graph above represents average key trade costs across major cities in North America as of the close of Q4 2023. The availability of skilled labor, tightening subcontractor backlog, declining fossil fuel pricing, and the resilient yet uncertain macroeconomic environment were the primary drivers for construction hard costs in the latter half of 2023. STOBG recommends that project teams engage with local resources early and consider key subcontractor assignment and material procurement as methods of managing cost. Costs are in local currency.
* HST tax not included (13%)
As supply chains slowly return to prepandemic normalcy, local labor availability and subcontractor backlog are critical factors in the cost of work.
† Due to restrictions in the labor market these regions are experiencing higher variability in project values at all levels. Engaging with a local professional is highly recommended prior to preliminary budget and schedule forecasting.

Page | 2 Corporate Interior Market Data Survey Update - February 2024 (revised as of 2/22/24)
97 85 85 73 50 127 88 83 38 63 126 126 110 126 87 82 97 76 72 65 70 57 62 42 93 114 109 113 65 66 99 123 67 44 181 99 25 12 12 18 40 18 9 10 18 10 18 18 15 18 15 8 8 7 10 14 25 23 15 12 22 18 18 15 18 17 13 15 38 21 5 12 40 25 25 24 38 20 15 16 29 22 36 36 35 36 21 15 13 17 28 24 30 35 20 18 15 36 36 26 18 19 18 21 25 30 32 16 15 8 8 8 20 15 5 5 6 6 40 40 35 40 2 5 3 6 8 7 20 20 10 8 6 12 12 9 14 14 11 13 17 18 3 10 40 25 25 35 60 30 25 30 25 22 18 18 18 18 20 14 26 15 20 20 30 40 30 25 44 28 28 28 35 34 14 15 26 21 16 31 18 20 20 12 30 15 8 9 15 15 22 22 22 22 10 10 0 12 0 15 15 15 18 14 0 32 32 14 15 15 10 11 15 16 0 21 0 50 100 150 200 250 300
Stamford,
†
†
† Houston,
† San
Cleveland,
Columbus,
† Miami, FL
Austin, TX
Dallas, TX
TX
Antonio, TX Minneapolis, MN Chicago, IL
OH Denver, CO Salt Lake City, UT Seattle, WA
Dublin,
Northeast Mid-Atlantic Southeast Southwest Central Mountain Western Canada Intl.
Locations
Balance of Trades Millwork Drywall & Ceilings Plumbing & Fire Prot. Electrical Lighting
*
Figure 2: The graph
COMMERCIAL INTERIOR RENOVATION CONSTRUCTION COSTS
Building Standard Finish Medium Finish High Finish
Locations
the median costs of commercial tenant interior construction across major cities in North America, as well as select international markets for spanning from Q4 2023 to Q1 2024. Our prior analysis in early 2023 suggested that pace of construction escalation was abating in many markets compared to 2022; and our latest response shows that this trend continued through 2023 with most markets reporting level or slightly reduced construction hard costs year on year. While the broader markets remain modestly escalatory; decreasing subcontractor backlog, a stabilized supply chain, and a decrease in fossil fuel costs have generally stabilized construction costs. Some specific market outliers persist, such as Los Angeles, Seattle, and Salt Lake City, and can largely be associated with the inception or completion of specific projects or programs and their rippling influence on regional values.
Decreasing subcontractor backlog, a stabilized supply chain, and a decrease in fossil fuel costs have generally stabilized construction costs.
Page | 3 Corporate Interior Market Data Survey Update - February 2024 (revised as of 2/22/24)
above represents
GST/HST
included
tax not
0 50 100 150 200 250 300 350 † Boston, MA Stamford, CT Hartford, CT New Jersey (Northern) † New York, NY Philadelphia, PA Baltimore, MD Washington, DC Charlotte, NC Raleigh, NC Charleston, SC Atlanta, GA Tampa, FL Miami, FL Austin, TX Dallas, TX Houston, TX San Antonio, TX Minneapolis, MN Chicago, IL Cleveland, OH Columbus, OH Denver, CO Salt
Seattle,
San Francisco,
† Palo Alto,
Los Angeles, CA *Edmonton, CAN *Calgary, CAN *Ottawa, CAN *Toronto, CAN *Vancouver, CAN *Kitchener, CAN Dublin, Ireland London, UK Northeast Mid-Atl. Southeast Southwest Central Mtn. Western Canada Intl. Costs (local currency) Per SQFT.
† Boston, New York, San Francisco, and Palo Alto exhibiting large ranges in high finish costs; refer to following tables for more information
Lake City, UT
WA †
CA
CA

Page | 4 Corporate Interior Market Data Survey Update - February 2024 (revised as of 2/22/24) TRADE-SPECIFIC BREAKOUT COSTS COST PER SQUARE FOOT (*BASED ON MEDIAN COST FROM MEDIUM FINISH PROJECT COST RANGES) Cost Values Do Not Include Traditionally Owner-Provided Trades Such as AV, Tel/Data, Security, and Furniture. City High Finish Medium Finish Building Standard Permitting Process Atlanta, GA $285 – $345 $235 – $285 $180 – $235 16 Weeks Austin, TX $190 – $250 $130 – $180 $90 – $120 8 Weeks Baltimore, MD $175 – $195 $130 – $170 $105 – $130 8-12 Weeks Boston, MA $300 – $480 $195 – $275 $145 – $170 4-6 weeks Charleston, SC $285 – $345 $235 – $285 $180 – $235 16 Weeks Charlotte, NC $151 – $210 $111 – $150 $95 – $110 2 Weeks Chicago, IL $175 – $240 $130 – $160 $115 – $130 3-4 weeks self-certification, 4-8 weeks standard Cleveland, OH $215 – $275 $165 – $215 $100 – $165 3-4 Weeks Columbus, OH $225 – $275 $155 – $225 $115 – $155 4-5 Weeks Dallas, TX $160 – $255 $105 – $160 $80 – $105 4-16 weeks depending on the city (Dallas is closer to 16 weeks) Denver, CO $170 – $220 $140 – $170 $100 – $130 12 Weeks Hartford, CT $210 – $300 $150 – $200 $125 – $150 4-6 Weeks Houston, TX $190 – $250 $134 – $160 $120 – $130 16 Weeks Los Angeles, CA $235 – $300 $175 – $235 $140 – $175 12 Weeks Miami, FL $285 – $345 $235 – $285 $180 – $235 16 Weeks Minneapolis, MN $165 – $185 $125 – $150 $80 – $125 4 Weeks New Jersey (Northern) $190 – $210 $155 – $185 $130 – $150 6-8 Weeks New York, NY $250 – $300 $225 – $250 $200 – $225 3-4 Weeks Palo Alto, CA $280 – $465 $190 – $280 $150 – $190 12-16 Weeks Philadelphia, PA $250 – $300 $200 – $250 $150 – $200 City 2 weeks, Suburbs 4-6 weeks Raleigh, NC $150 – $200 $125 – $150 $80 – $125 8-12 weeks Salt Lake City, UT $136 – $161 $110 – $126 $76 – $102 7 Weeks San Antonio, TX $160 – $249 $105 – $160 $80 – $105 4-8 Weeks San Francisco, CA $285 – $475 $195 – $285 $155 – $195 3-4 weeks Over The Counter; +/-32 weeks Intake Seattle, WA $216 – $252 $167 – $192 $120 – $164 24 - 48 Weeks Stamford, CT $225 – $300 $150 – $200 $125 – $150 4-6 Weeks Tampa, FL $260 – $315 $205 – $265 $155 – $210 15 Weeks Washington, DC $170 – $210 $135 – $170 $110 – $135 DC - 10-12 weeks; Virginia - 8- 12 weeks; Maryland - 12 weeks Calgary, CAN C$180 – C$220 C$150 – C$180 C$110 – C$150 4-6 Weeks Edmonton, CAN C$180 – C$220 C$150 – C$180 C$110 – C$150 5 Weeks Kitchener, CAN C$180 – C$295 C$120 – C$180 C$95 – C$120 4-5 Weeks Ottawa, CAN C$190 – C$320 C$140 – C$190 C$110 – C$140 6 - 8 Weeks Toronto, CAN C$235 – C$395 C$160 – C$235 C$130 – C$160 6 - 8 Weeks Vancouver, CAN C$225 – C$365 C$150 – C$225 C$120 – C$150 10-22 Weeks Dublin, Ireland €205 – €273 €172 – €205 €130 – €162 18 Weeks London, UK £241 – £324 £205 – £270 £121 – £197 13 Weeks
Page | 5 Corporate Interior Market Data Survey Update - February 2024 (revised as of 2/22/24) City Millwork Drywall & Ceilings Plumbing & Fire Protection Electrical *Fire Alarm N.I.C. Lighting & Controls Balance of Trades Atlanta, GA $18 $36 $40 $18 $22 $126 Austin, TX $15 $21 $2 $20 $10 $87 Baltimore, MD $9 $15 $5 $25 $8 $88 Boston, MA $25 $40 $15 $40 $18 $97 Charleston, SC $18 $36 $40 $18 $22 $126 Charlotte, NC $18 $29 $6 $25 $15 $37 Chicago, IL $14 $24 $7 $20 $15 $65 Cleveland, OH $25 $30 $20 $30 $15 $70 Columbus, OH $23 $35 $20 $40 $15 $57 Dallas, TX $7 $15 $4 $13 $10 $82 Denver, CO $15 $20 $10 $30 $18 $62 Hartford, CT $12 $25 $8 $25 $20 $85 Houston, TX $7 $13 $3 $26 $0 $97 Los Angeles, CA $15 $26 $9 $28 $14 $113 Miami, FL $18 $36 $40 $18 $22 $126 Minneapolis, MN $10 $28 $8 $20 $0 $71 New Jersey (Northern) $18 $24 $8 $35 $12 $73 New York, NY $40 $38 $20 $60 $30 $49 Palo Alto, CA $18 $36 $12 $28 $32 $109 Philadelphia, PA $18 $20 $15 $30 $15 $127 Raleigh, NC $10 $22 $6 $22 $15 $62 Salt Lake City, UT $12 $18 $8 $25 $14 $4 San Antonio, TX $7 $17 $6 $15 $12 $75 San Francisco, CA $18 $36 $12 $28 $32 $114 Seattle, WA $21 $15 $6 $44 $0 $92 Stamford, CT $12 $25 $8 $25 $20 $85 Tampa, FL $15 $35 $35 $18 $22 $110 Washington, DC $10 $16 $5 $30 $9 $82 Calgary, CAN C$18 C$18 C$14 C$35 C$15 C$65 Edmonton, CAN C$17 C$19 C$14 C$34 C$15 C$66 Kitchener, CAN C$21 C$30 C$18 C$21 C$16 C$44 Ottawa, CAN C$13 C$18 C$11 C$14 C$10 C$99 Toronto, CAN C$15 C$21 C$13 C$15 C$11 C$122 Vancouver, CAN C$38 C$25 C$17 C$26 C$15 C$66 Dublin, Ireland €12 €15 €9 €31 €20 €99 London, UK £5 £32 £3 £16 £0 £181
Costs Change in Key Cities
CONCLUSION
Our latest market data analysis has revealed a largely positive trend that emerged during 2023 in tenant interiors projects across the nation. Median TI construction costs in many regions are suggestive of price stabilization in commercial office delivery. This return to predictability is due in part to a softening in commercial real estate demand as well as a reduction in energy costs for manufacturers and transportation throughout 2023. A shortage of skilled labor, for both manufacturers and subcontractors, remains a primary cause of price uncertainty for most of our responding markets and some isolated supply chain snarls linger. As economic uncertainty remains and subcontractor backlogs grow tighter, STOBG does advise ongoing and robust due diligence in sourcing and vetting capable, qualified, and reliable trade partners. STOBG has pioneered and rigorously upheld an industry-leading prequalification process which remains our primary tool to help clients manage risk and uncertainty.
A shortage of skilled labor, for both manufacturers and subcontractors, remains a primary cause of price uncertainty and some isolated supply chain snarls linger .
ABOUT OUR GUIDE
Our Cost Report is intended to offer a snapshot of current costs in the markets we operate in, helping you gain clarity on pricing trends. For tailored budgeting assistance, please get in touch with your local STOBG representative or reach out to Stephen Dennis at STOBG Global Services.
Page | 6 Corporate Interior Market Data Survey Update - February 2024 (revised as of 2/22/24) KEY CITIES
COSTS CHANGE SINCE Q4 2023
ANALYSIS
Costs – Key Cities City Change New York, NY - 12% Dublin, Ireland - 5% Stamford, CT - 2% Tampa, FL 0% Cleveland, OH 0% Washington, DC 0% Miami, FL 0% Atlanta, GA 0% Minneapolis, MN 0% Baltimore, MD + 3% Chicago, IL + 9% Salt Lake City, UT + 21% -30% -20% -10% 0% 10% 20% 30% New York, NY Dublin, Ireland Stamford, CT Tampa, FL Cleveland,
Washington,
Minneapolis,
OH
DC Miami, FL Atlanta, GA
MN Baltimore, MD Chicago, IL Salt Lake City, UT