SPATIA SPATIA SPATIA’23 SPATIA’23
From Blue Planet to silver Globe
“Geospatial

Mapping Unites Us All”
 Dr. D. Thirumalaivasan
 Director and Professor, IRS
The Society of Geoinformatics Engineers (SGE) was founded in 2004 and since then the society has grown exponentially in creating exposure, nurturing students and bringing in innovative ideas and technologies in the domain of Geoinformatics. This year ’ s GeoHorizon’23 opens up new windows of opportunity for the future Geomatics Engineers to hone their core knowledge and skills, learn from the best, showcase their talents and interests, and carry on the legacy that this Society has held on for so many years.
This year ’ s edition of SPATIA takes learnings from the previous editions, and adds on with the new set of technology and minds in the fields of Remote Sensing and GIS. With innovative ideas and useful insights from both the current as well as the alumni student community, SPATIA’23 holds a holistic point of view and aims to inculcate in the minds of its readers, the vitality of integrating theoretical knowledge with practical skills to solve real-world problems
As a Professor and Director of Institute of Remote Sensing (IRS), Anna University, I commend the entire student community of Geoinformatics at IRS for working together tirelessly in making this edition of SPATIA a worthwhile and enriching repository of Geoinformation. My sincere and abundant gratefulness goes towards the professors and faculty of IRS for their constant support and guidance to the students in making GeoHorizon’23 a successful and memorable event
There is never a limit to learning, it’s about the passion that drives us towards achieving higher goals I wish the student community to aim big and work towards it with utmost sincerity and effort.
DIRECTOR’S NOTE
I
Dr. S. Jayalakshmi, President,

SGE
Associate Professor, IRS
It gives me immense pride and pleasure to be the President of the Society of Geoinformatics Engineers (SGE), a society filled with unique and innovative minds I feel proud to be leading a versatile group of geomatics engineers, who have put in maximum efforts to bring about yet another successful edition of Geohorizon’23, our annual inter-college Symposium.
A 3-day symposium comprising both events and workshops, GeoHorizon’23 aims to enhance the students’ interest and exposure in the field of Geoinformatics. The annual magazine, SPATIA, brings about tons of information in remote sensing and GIS sectors. This year ’ s edition strives to inculcate various dimensions of content, including articles by students highlighting the course ’ s significance to solve real-time problems, insights from alumni, future career opportunities and the like.
With the untiring efforts and contribution from the student community at Institute of Remote Sensing (IRS), GeoHorizon’23 with SPATIA’23 will surely create a better understanding of Geoinformatics, and motivate many young minds to pursue their career and research in this field and provide their bit to the community
PRESIDENT’S NOTE
II
TREASURER’S NOTE
Mrs. M. Navamuniyammal
 Assistant Professor, IRS Treasurer, SGE
As the Treasurer of the Society of Geoinformatics Engineers (SGE), I am thrilled for the commencement of GEOHORIZON’23, an annual inter-college symposium. With untiring participation and efforts from both the student community and faculties at Institute of Remote Sensing (IRS), this year ’ s GeoHorizon undoubtedly creates an indelible impact in the field of Remote Sensing and GIS. The annual magazine, ‘SPATIA’ has progressively tried to cover all dimensions of geoinformatics at IRS and beyond This year ’ s SPATIA too goes with the same vision, but has expanded its reach and inculcated various aspects of Remote Sensing and GIS and their practical applications.
Geoinformatics is a fresh, unique and exponentially growing field of study, which finds work and use in almost every domain of engineering, technology and the sciences. Our students here at IRS have many windows of opportunity for them to build their career. There’s always room for conducting events, workshops, lectures or seminars that give better exposure to students in this field and train them well to face the competitive world. This is the main objective of the Society of Geoinformatics Engineers (SGE) and I hope that the students keep showing their efforts consistently and come out as skillful geomatics engineers.
III
ABOUT IRS
Anna University blossomed to its present status from a humble beginning in 1978, as the first ‘Survey School’ in the country to produce land surveyors The Institute of Remote Sensing (IRS) was established in 1982 by Anna University with the funds provided by the Government of Tamil Nadu IRS is the State Remote Sensing Application Centre for the Government of Tamil Nadu. From its establishment back in 1982 to recent times, the infrastructural facilities at IRS have seen outstanding developments primarily through development grants received mainly from Ministry of Human Resources Development, University Grants Commission, Federal Republic of Germany, Government of India and Department of Agriculture of Government of Tamil Nadu.
Institute of Remote Sensing, Anna University, Chennai, is one of the best of its kind in providing quality education, exposure and facilities in the fields of Remote Sensing, GIS and Large- Scale Mapping. It is one of the very few institutes in India providing undergraduate B E degree in Geoinformatics, along with postgraduate and PhD programmes too IRS has been transferring Remote Sensing and Geoinformation Technology to Government Departments and various users through Pilot Projects/ Operational Projects.

The Institute functions as an autonomous unit of Anna University, governed by an executive committee headed by the Vice-Chancellor and the recurring grants for maintenance are provided by the Government of Tamil Nadu As an externally assisted project, Federal Republic of Germany has provided assistance worth 7 million DM towards equipment, exchange of staff and for conducting a 4year engineering Under-Graduate program, B.E. (Geoinformatics). The Royal Norwegian emphasis as a part of Indo Norwegian Institutional Cooperation Programme has supported the institute to a tune of 1 1 crores for selected research projects and infrastructure development IRS is also a member of UNGGIM Network (The United Nations initiative on Global Geospatial Information Management).
The Institute has always aimed at producing skilful Geomatics Engineers, capable of operating in the industry as well as continuing research. With a versatile and diverse set of alumni, IRS stands as the finest hub of Geoinformatics in the country, with notable recognition across globe.
IV
The Institute of Remote Sensing (IRS), Anna University, focusses on Remote Sensing and GIS and its crucial role towards real-world problem solving A component of IRS that helps fulfil the institute’s visionary objectives is the Society of Geoinformatics Engineers (SGE) Founded in 2004, the Society of Geoinformatics Engineers is the face of IRS. SGE is a culmination of a diverse community of students, professors, faculty members and the alumni network SGE aims at inculcating the momentousness of Geoinformatics and giving adequate exposure to students It follows a holistic approach by not only focussing on Remote Sensing and GIS courses, but provides students the opportunity to utilise their Geoinformatics skills into practical applications . SGE has portrayed the vitality of Remote Sensing and GIS in varied ways – through events, workshops, annual symposiums and the Annual Society magazine

SPATIA
Annually, SGE conducts two signature symposiums – National Level Technical Symposium, GEOHORIZON, and at an intra-college level, CELESTIA A variety of technical and non-technical events are organized in these symposiums, including Paper and Poster Presentation, programming and coding events and many informative workshops The annual magazine of SGE – SPATIA is published annually during GEOHORIZON Symposium SPATIA covers various domains of Geoinformatics and integrates the efforts of the entire student community. Student articles, annual newsletter, words from the Alumni and various other sections of the magazine provide a 3600 exposure to the reader in the field of Remote Sensing and GIS SGE also has been conducting events and interactive sessions during Space Week since a couple of years With the collective efforts of all its members, SGE strives to be at the core of Geoinformatics research.
V
–
ABOUT SGE
Director’s Note I President’s Note II Treasurer’s Note III About IRS IV About SGE V An IOT platform for Air quality by Remote Sensing 1 Geospatial AI 2 3D Face Reconstruction by Close-range Photogrammetry 3 Accounting Blue carbon ecosystems: RS approach 3 Bhuvan: The Indian Geo-Platform 4 Freshers’ viewpoints 5 Role of Generative Adversarial Networks in Classification Algorithms 6 Crime Analysis using GIS 7 Life Beyond Earth 8 Cybersecurity in Geospatial World 8 Words from the Alumni 9 RS and GIS in assessing forest fires 13 Remote Sensing in Volcanology 14 Air Pollution: The Crisis 15 Spatial Data Mining 16 Seismic Wave Prediction 16 Opportunities after B.E. in Geoinformatics 17 Climate change analysis by Remote Sensing of Glaciers 20 Archaeology using Ground Penetrating Radar (GPR) 21 Indian Remote Sensing Satellites 22 Newsletter 24 Previous Happenings at IRS 25 Our Sponsors 28 Credits 31 CONTENTS
An Internet of Things Platform based on FIWARE for Air Quality Remote Sensing and Smart Monitoring
~ Jeevitha B., 3rd year, B.E. Geoinformatics
Air pollution is currently receiving huge attention by international governments and organizations Air pollution can seriously affect people’s health, worsening certain illnesses or even causing death to specific vulnerable groups. Our primary aim henceforth, should be to alert the vulnerable population and vehemently encourage them to act upon it However, this kind of personalized services can become complex in Internet of Things (IoT) applications because of the large quantum of data required to be analysed in order to perform a suitable customization of such services
The major limitation imposed in other methods of air quality assessment is impossibility of processing data in Near Real-Time (NRT) for remote sensing approaches In order to tackle such challenges, IoT platform based on FIWARE can be used for remote sensing and smart monitoring of air stations. FIWARE is an open-source initiative that works towards building a set of standards to develop FIWARE provides novel software components available through Application Programming Interfaces (APIs), known as Generic Enablers (GEs), that allow us to reduce the time needed for developing the whole solution, as well as increasing the scalability, modularity and flexibility of the solution The FIWARE-based smart platform has the ability to process and correlate big data coming from multiple air information sources and to notify users in real-time when a health risk for their particular context is detected In addition, a mobile application benefits from the platform since it allows users to register and receive air quality alerts depending on their situational context
The major functions of FIWARE based systems include: (1) air quality information and alerts updates to be given in real time; (2) the information has to be actively provided to citizens in a clear and userfriendly way; (3) the information provided to users, in particular to “at-risk” groups, needs to be adapted to their specific characteristics and (4) the system should also take into account the type of activity the user is going to carry out and adapt notifications accordingly.FIWARE based IoT systems make use of Complex Event Processing (CEP) Complex Event Processing (CEP) is a cutting-edge technology that allows us to correlate and analyse huge amounts of data in real time The platform is divided into many layers namely, Data Producers, Data Collector, Data Processing and Data Consumers
Air quality surveillance can be done using air sensor networks Particles Matter smaller than 10 or 2.5microns (PM2.5 and PM10), Sulphur Dioxide (SO2), Nitrogen Dioxide (NO2), Carbon Monoxide (CO) and Ozone (O3) are some of the major pollutants monitored by such sensor networks. The sensors located in these stations send the information collected for each pollutant to a main server by General Packet Radio Service (GPRS) or Internet, every 10 minutes as CSV files This system integrates a lowcost air quality sensor, temperature and humidity sensors, a single -board computer (Raspberry Pi 2microprocessor) and cloud storage This system provides Realtime air quality reading, transfers the data through a wireless network to the Internet and displays the data in dedicated webpage. Furthermore, it stores records in cloud storage and sends message to the user when unhealthy condition is met The same Iot based approach can be done with other cloud-based platforms such as open-source platforms like OpenMTC and SiteWhere, and by the proprietary ones like Amazon Web Services The most relevant difference between these platforms and FIWARE is that none of them deals with the user’s particular situational context nor do they provide recommended air quality notifications based on citizen’s personal, spatial as well as physical contexts
1
Geospatial AI: Enhancing Insights and Transforming Industries
~ Sabari Karthick, 3rd year, B.E. Geoinformatics
From primitive methods of documenting our surroundings to developing detailed paper maps for specific geographical features using cartographic symbols, and now to constructing comprehensive digital geographic information systems (GIS), our mapping techniques have advanced exponentially They have undergone a significant transformation by blending with Artificial Intelligence and Machine Learning - the buzzwords that have been dominating conversations in recent years. GeoAI is the result of this blend
Geospatial Artificial Intelligence is a concept that combines Geospatial Analysis and advances in Artificial Intelligence. By utilizing the power of supercomputing, Geospatial AI can extract and provide significant insights through inputs from satellite imagery and remote sensing The use of AI in GIS analysis predicts a region's "future"
Technologies like Geospatial artificial intelligence (GeoAI) allows for the analysis of spatial data and the generation of maps and simulations to anticipate future outcomes a cross various scenarios New York City has implemented a GeoAI-powered algorithm that assists garbage collectors in determining the optimal route based on the fullness of trash cans. In Utah, a Geospatial AI algorithm that utilizes Machine Learning has been developed to forecast car accident hotspots along specific road segments. Google Flu Trends also utilizes AI to quickly identify areas of high flu activity in the United States These are merely a few examples from a vast array of spatial analytic applications
In the upcoming decade, the quantity of satellites revolving around the earth is expected to increase five-fold These satellites will be equipped with sensors that gather data regarding diverse environmental factors such as temperature, precipitati on, wind, soil conditions, and more This means that there will be even more geospatial data available from satellites and at a much lower cost. GeoAI could be used to harness this data to drive insights for decision-makers to tackle a bigger threatclimate change The cloud-based Google Earth Engine (GEE) combines a multi-petabyte catalogue of satellite imagery and geospatial datasets with planetary-scale analysis capabilities, enabling scientists, researchers, and developers to detect changes, map trends, and quantify differences on the Earth's surface. The knowledge gained from these perspectives assists us in more effectively utilizing resources, comprehending potential hazards, forecasting transformations, reacting to calamities, and delivering Earth-based data in decision-making scenarios as we tackle the predicament of climate change
GeoAI offers businesses the ability to make projections and predictions about various aspects of an area, such as human movement patterns, economic conditions, natural resource usage, pollution levels, and much more. These insights are valuable in developing business strategies, including market planning, site selection, product selection, and asset maintenance. In the healthcare industry, GeoAI is utilized to map our environment, linking the places we frequent with environmental, social, and other factors that may have an impact on our health During natural disasters, GeoAI analyses rapidly changing geospatial data to assess damage levels and provide direction for relief efforts
As technology continues to advance, we can expect to see more innovative uses for GeoAI, and it will undoubtedly play a critical role in shaping our understanding of the world around us
2
3D Face Reconstruction by Close Range Photogrammetry
~ By Rishi, 2nd Year, B.E. Geoinformatics
In present scenario, crimes are a common visual So, it is important to identify the face of the victim to proceed the investigation to regulate the crime rates. Photogrammetry helps the forensic domain in this problem. The science of photogrammetry is defined by collecting reliable information about the object by recording and interpreting the photogrammetric images. For this process, we require three components - photographs of the skull, Facial Soft Tissue Thickness (FSTT) data table and a software to deploy the data. Photographs are obtained by the method of Close-Range Photogrammetry (CRP) owing to its accuracy Using a high-quality digital camera, multiple photographs of the skull are recorded covering all the angles, sides and surfaces with a diffused light to avoid shadowing Black background is preferred usually Many software are available for this purpose, the most efficient and used being the AgiSoft Photoscan This software makes it easy to build a 3D model based on the input photographs and export in any desirable file format Blender software is used hand-in-hand with the Photoscan software to classify various structures and landmarks covering the face and the cranium (craniofacial) The data so generated is analysed with the FSTT dataset and the average is used to create the facial reconstructions. In this way, photogrammetric tools and techniques assist in a vital way for forensic applications involving face reconstruction and recognition.
Accounting BC ecosystems: Remote Sensing approach
Blue carbon - for carbon captured by the world's ocean and coastal ecosystems. Sea grasses, mangroves, and salt marshes along our coast capture and hold carbon, acting as something called a carbon sink. These ecosystems take up the carbon in the atmosphere and store them beneath the ground where it is not visible to the naked eye, but does exist. Healthy blue carbon ecosystems also provide habitat for marine species, support fish stocks and food security and sustain coastal communities When these systems are damaged, an enormous amount of carbon is emitted back into the atmosphere, where it can then contribute to climate change So, protecting and restoring coastal habitats is a good way to reduce climate change and conserve the coastal vegetation.
Remote sensing-based approaches have been proven effective for mapping and monitoring mangrove, seagrass, and salt marsh ecosystems by many studies. In addition to the satellite data, aerial photography has also been used for coastal monitoring Landsat data is by far the most widely used dataset to map and monitor tidal wetlands, operating from the visible to the near infrared portion of electromagnetic spectrum. Recent developments in drone technology, or UAVs (unmanned aerial vehicles) have opened up new possibilities in the field of remote sensing. Remote sensing technology, hence, provides a powerful tool for monitoring and accounting for carbon stocks in BC ecosystems By enabling efficient, accurate and cost-effective monitoring of these ecosystems, remote sensing can support global climate change mitigation. However, to use remote sensing for blue carbon accounting, careful data acquisition, processing and validation are required, and regular improvisations are required as and when new data is acquired
3
~ Srivarshini, 1st year, B.E. Geoinformatics
Bhuvan is marketed as an Indian Geo-Platform by ISRO (Indian Space Research Organization), initially released in the year 2012 It features services in three major domains, namely: Satellite Data, Thematic Services and Mobile Applications.

Bhuvan’s data catalogue comprises largely of Earth Observational (EO) satellite imagery, acquired by Indian satellites at a relatively high frequency, implying that the data has both spatial and temporal frames of reference. The data is made analysis ready through conformance to a set of native standards, centred around standardizing parameters such as spatial resolution, radiometry, ortho -rectification, spatial reference and image display among others That enables interoperability and analysis of the datasets within the platform The platform also seeks to implement crowd-sourcing of spatial data through its Mobile Application based services, which enables a stream of non-EO spatial data of increased granularity.
The platform features explicit metadata generation for the stored datasets, once again based on native standards for metadata. Targeted retrieval of datasets is enabled through means of ‘Bhuvan Data Discovery’ function on the platform. The thematic products on the platform, offer a wide range of products catering to terrestrial, atmospheric and ocean sciences This reflects capacity to perform ‘Exploratory Analytics’, with limited user involvement User-based analytics is limited to basic functionalities such as shapefile creation, colour composite generation or choropleth map creation The analytics infrastructure of the platform continues to be localized, with data being moved to the source of analytics
The platform supports 2D and 3D visualization, apart from time-series visualization of select historic datasets. The visualization platform is powered by a Cesium API.
In terms of ‘Intelligence Generation’, the platform hosts a good array of functionalities required for a minimum level of inference generation, although higher levels of ‘Intelligence Generation’ in the form of incorporating machine intelligence are yet to be reflected
Source: https://bhuvan nrsc gov in/home
4
Bhuvan – The Indian Geo-Platform
~ Ajan Sendhil, 4th year, B.E. Geoinformatics
Taking a life decision that is unconventional can be intimidating, and that's how I felt about choosing B.E. Geoinformatics. Although I didn't have a specific interest in this field, I recognized that the university was reputable and had its strengths in each department While exploring different courses during the admission process, I came across this program A friend of my father who holds a PhD in geoinformatics shared valuable insights with me about the course and the various job opportunities that would be available to me I also reviewed the course curriculum and found it fascinating and distinctive. My preference is to enjoy what I do rather than doin g what I like. Therefore, I am eagerly looking forward to learning new things and gaining exposure during my four years at IRS.
Environmental studies, geography, and maps have always been areas of interest to me My sister, who is an environmental engineer, recommended geoinformatics to me, even though it is not directly related to environmental studies I wanted to pursue something different from the standard core courses like CSE, IT, and ECE, which led me to explore the syllabus of GI I found it to be captivating and engaging Now, having completed almost two semesters, I can confidently say that I am delighted with my decision to pursue this course During my time at college, I have observed many seniors working with surveying instruments on the college ground. Learning beyond the confines of the classroom is enjoyable, and we are fortunate to be able to engage in practical fieldwork to gain hands-on experience I hope to have a productive and enlightening experience during my four years of study
There were two reasons why I chose the Geo Informatics course at CEG Firstly, I have always been fascinated by nature The curriculum of this course got me inclined towards it Secondly, it is believed thatthe most popular and preferred streams include IT, CSE and streams like Mechanical Engineering are believed to provide greater career opportunities. However, I wanted to challenge this notion by choosing a peculiar and lesser-known stream, and then excel in it
This course combines both theoretical sciences and technology, making it an appealing option for me Pursuing this B E degree would enable me to comprehend both engineering technology and geographic components. Growing up in a family of geologists, particularly in the mining sector, I gravitated towards studying earth sciences Initially, my primary expectation from this course was to secure a good job However, after attending the CELESTIA symposium, I gained a deeper understanding of what this field has to offer beyond just career opportunities. I aspire to learn as much as possible from this course and apply my skills to contribute to society
~ S. Vishwapriya 1st year, B.E. Geoinform atics
~ Sri Varshini, 1st year, B.E. Geoinform atics
~ Krithika, 1st year, B.E. Geoinform atics
5
~ S.JothiKarunya, 1st year, B.E. Geoinform atics
FRESHER’S VIEWPOINT S…
Role of Generative Adversarial Networks in Classification Algorithms
~ Chameli R., 3rd year, B.E. Geoinformatics
Remote sensing image classification involves understanding satellite or aerial images and identifying the land cover types present in the images. This is a challenging task due to the complexity involved, including variations in terrain, vegetation, and atmospheric conditions. Deep learning models have been successful in achieving high accuracy in remote sensing image classification tasks. These models are trained on large datasets of labelled images and use techniques such as data augmentation and transfer learning to improve their performance.
The accurate classification of remote sensing data using machine learning models largely depends on the accuracy of the training data and validation sets. Traditionally, such validation has been possible by ground-truth data. However, there is a lack of diverse/representative ground-truth data because collecting ground-truth data is an expensive, cumbersome task
To battle this, the remote sensing community finds itself a new saviour, Generative Adversarial Networks (GANs) GANs are a class of deep learning models capable of generating synthetic data They are trained with some real data which is used to learn important features that can then help synthesize data that looks like real data. This is important as GANs have shown to be powerful models in different computer vision tasks which are also common in RS.
A common example of a data deficient scenario is that of wetland mapping. With limited ground data, GANs can artificially generate the training data for classes of wetlands. The data generated from GANs and the real time observation is then used for testing the classification model This reduces the cost and the time spent in acquiring a large quantity of data and increases the accuracy of the model as an even number of data samples can be considered for different classes.
Besides wetland mapping, GANs can be used to assist a wide range of feature classification such as building extraction, roads extraction, object detection and scene classification. It is also widely used to reconstruct and restore images and finds applications in digital image processing and analysis. As drone images and aerial images become more common, it is imperative that we understand a way to process this high-resolution imagery as accurately as possible using an integrated approach of remote sensing, machine learning and deep learning techniques.
6
“LOCATION”- The Super Weapon
~ Gopika S.R., 3rd year, B.E. Geoinformatics
We never know what happens behind the scenes Not in case of crimes! GIS, as we know today, uses geography and computer-generated maps as an interface for integrating and accessing massive amounts of location-based information It has found its application in crime mapping and crime analysis which is a powerful visualizing and processing tool for the professionals involved. This article will provide an interesting insight to the analysis of the dynamic nature of the criminal world.
In olden days pin maps were used to identify the crime locations With the increasing number of crimes recently all over the world, it is very hard for the conventional techniques to be followed GIS has played an important role in revolutionizing crime mapping and analysis techniques. With GIS, the ability to access and process information quickly while displaying it in a spatial and visual medium allows agencies to allocate resources quickly and more effectively.
Crime mapping gives a new dimension for crime analysis and proves to be invaluable in specific cases GIS can process huge amount of data simultaneously which also invariably finds relationships between the datasets. For example, finding links between the suspect and the victim which has proved to be one of the most effective techniques in criminology. These attributes can be linked to the crime to understand the crime scene better. Maps can be produced at any geographic level to aid in the analysis of crime patterns. Shade grid cell maps can be generated by differentially shading each region according to frequency of crimes. The darker the shade, the more frequency of events within the response area.
Crime analysis is a set of evidence-based analytical techniques and processes used to quantitatively analyse crime and security data to support the planning. GIS can be used to perform radial analysis to measure the extent of crime. We usually prefer radius to determine the extent so that it covers all directions around a particular point. When the threshold value for the radius is set, GIS eliminates all the redundant information. Crime hotspots can be identified using GIS, which are the places of high crime density which demand special police attention. These areas can be outlined on the base map. Hotspots of violent crime, robbery etc. can be calculated on a regular basis for each police station area. Hotspots of different offence types can be displayed to identify where they overlap
Relationships between the variables also play a significant role in the analysis which would indicate the strength and direction of the relationship between the two variables. Regression analysis is used to predict the value of a dependent variable such as violent crime rate based on the values of independent variables such as the poverty level within an area The geographic area where the next crime is most likely to occur can also be predicted by models, the accuracy of which can be further enhanced using GIS.
7
From the discovery of exoplanets to the detection of microbial life on Mars, search for life beyond Earth is rapidly gathering momentum Planetary Remote Sensing has played a significant role in our understanding of the Red Planet and the search for life on its surface Scientists use spectrometry, Radar and high-resolution imagery to analyse the Martian surface In 2013, NASA’s Mars Reconnaissance Orbiter discovered large deposits of water ice on Mars providing evidence of past presence of liquid water on the planet The Mars Exploration Rover has also found evidence of past habitability on Mars, including presence of minerals Titan, the largest moon of Saturn has been a subject of interest for planetary scientists for decades. To study the surface of Titan, planetary scientists rely on remote sensing techniques that use infrared, Radar and other methods to penetrate the haze and observe the moon’s surface and atmosphere The high-resolution images provided by Cassini spacecraft show a diverse landscape with evidence of lakes, rivers, seas fil led with liquid methane as well as dunes and mountains composed of ice. In this environment, Infrared spectroscopy has revealed the presence of organic compounds on Titan’s surface including ethane, acetylene and benzene Additionally, Titan’s stable climate and long-term stability of liquid methane raises question of whether life could exist in this environment. In conclusion, planetary remote sensing has greatly advanced our understanding of the potential for life beyond Earth. While we may not have found conclusive evidence of extra-terrestrial life so far, the data collected by these missions provide hope and continues to drive the search for life in our solar system and beyond With continued advancements in technology, we may one day answer the age-old question of whether we are alone in the universe
Cybersecurity in Geospatial World
In today’s world, with such a vast expanse of data, a natural question arises: how safe is our data?
Each day, we are stepping towards an exponential advancement The onset of Internet and its subsidiaries has made human lives far easier than the realms of imagination. But is this ever-growing technology really safe? There has been an increasing number of data breaches across the world, raising concern among the public and leading to ask us questions related to internet privacy, means to safeguard it and what role Geo Informatics can play in dealing with cybersecurity
Geospatial data is being used widely in almost every domain Some companies use geospatial data to create a virtual boundary around an individual feature or device. For example, an authorized person might have permission to access a database of confidential information at work, but not from home or even five miles away from the workplace Geographic information system (GIS) influences cybersecurity When cybersecurity practitioners connect online activity to a geospatial layer, they get a clearer picture of network activity and its sources. Such information has proven to be vital for mission-critical networks, such as those associated with communications, energy supplies or disaster recovery
GIS alerts end-users regarding possible cyberattacks, helps in data recovery and even prevention of data loss. Moreover, they can reveal which aspects of a network have the most unaddressed issues, enabling cybersecurity professionals to prioritize their work. Hence geospatial data is an excellent tool for cybersecurity planning and can bring in a new era of ‘spatial cybersecurity ’
8
LIFE BEYOND EARTH
~ Akshith, 1st year, B.E GeoInformatics
~ Neha, 2nd year, B.E.Geoinformatics
Perspective of Current Final Years and Alumni…

As part of my Mitacs Globalink Research Internship, I had the opportunity to work with the supervision of Dr Gordon Osinski at the University of Western Ontario, Canada. During this time, I conducted research in the field of planetary science, with a specific focus on the emplacement and mineralogy of impact melt on the planets Mars and the Moon using satellite imag y
I observed that one common trait among all those who were selected for the internship was that they had prior experience in the same field they applied for Hence, having a strong CV with relevant research experience is crucial. To this end, I ensured that I had conducted research in my field of interest before I started applying While your academic record is important, your CV and research statement are more crucial, as they demonstrate your interest in and aptitude for the field. Moreover, I selected projects that were pertinent to my interests and experience, allowing me to acquire the necessary skills and knowledge to excel in my field. This approach not only helped me stand out as a candidate but also provided me with a competitive edge during the selection process.
The rigorous 12-week program provided an immersive research experience, as well as exposure to the diverse and compelling research conducted at the university. The atmosphere of intellectual curiosity and academic excellence, with PhD and master's students surrounding me, fostered a deepened interest in me to pursue graduate studies in the field of planetary science. During the program, I made valuable professional contacts in research that will expand my network and provide opportunities for collaborations. In addition to the research experience I gained, I also had the chance to explore Canada The opportunity to travel and explore the country provided a much-needed respite from the demands of work, and enriched my overall experience. Through this internship, I gained essential skills in self-reliance and independence, skills that will undoubtedly serve me well in my future career Overall, this experience has deepened my passion for research.
9
Sharini Sureshbabu, Summer Intern, Mitacs, University of Western Ontario, Canada
Perspective of Current Final Years and Alumni…
I am currently a postgraduate student at University

College
London (UCL) specialising in Finance Probably it might seem to be weird for a person with undergraduate specialisation in B E Geoinformatics to pursue a masters in finance but then it is all for a quest and efficient utilisation of plethora of opportunities in the geospatial industry. Geospatial technology as an economic industry is at a faster growth trajectory in India thanks to the governmen space liberalisation policy It has opened many new avenues for young entrepreneurs and business enthusiasts as 80% of decisions in any business has a location dimension.
The manufacturing sector, retail sector, banking, financial services, insurance industry, travel and logistic sectors are a few among many who intensively rely on the geospatial services The right business model along with shrewd financial skills would be the most promising combines to make sustainable venture into this industry and that has paved me to further enlarge my educational boundary
May it be pursuing masters or choosing any career path the right decision should be firmly made whilst being in the second year Master’s programme either in India or Abroad requires specific screening tests which should be taken well in advance before making applications. Specifically for India, GATE is the most preferred entrance exam for getting into any degree of choice This requires a year-long preparation and taking a firm decision during the second year would be the wisest of all Students aspiring to study abroad would have to take GRE and English Language exams (IELTS, TOEFL etc.). Screening for Universities and courses would be the first but tedious task You can probably start doing that during the summer break after the third year and familiarise with the entry requirements Restrict yourself to the top 100 universities in the world rankings. The applications usually start rolling out as you enter your final year. They are usually both country and university specific. For Universities in the UK, it runs from September through October end Having your required test scores before starting your application would be preferred.
Institute of Remote Sensing has been instrumental in moulding me for the way I am today Looking down the lane, there has been a phenomenal leap for what I was in the first year to that at the end of my undergrad Professionally being the top tier Institute in the country, they give a highly specialised masters depth of content in the undergrad level Probably it’s this factor which has made me fluent academically. On the personal front it has made an introvert like me to come out, take responsibilities and unravel the unexplored potential. I had a cherished time during my final year heading the contents team, SPATIA magazine and hosting several events for the Society of Geoinformatics Engineers. The confidence in me wouldn’t have come out for if I had not been a part of IRS!!
Godson George, pursuing Masters at UCL, London in finance
10
Perspective of Current Final Years and Alumni…
I feel quite grateful that I had the opportunity to walk this path, and that could not have happened without the help of many truly wonderful people. Landing my first job at ESRI India in itself was a stroke of luck – an opportunity afforded to me by my fellow friends and batchmates from IRS, Abinesh and Rajaram, who referred me and took me along for the ride.

I came across the opportunity at Swiss Re through a friend from school, Kavinaya, who contacted me because I was a “maps guy”.
My growth within Swiss Re is a result of the mentorship and trust relationship I have with my manager, Thomas, someone who gave me the opportunity to grow into a role in which I can drive change and lead. But most importantly, the exposure I gained during my time at IRS was what kickstarted this wonderful journey, and for that, I am forever indebted to every person on the staff. To me, that is the key – you do not undertake the journey alone. It’s only possible because of all the people around you who help you, trust you and elevate you. The only way to pay everyone back for their support is to give your 100% and more
I had an absolute blast during my time at IRS I have to admit, I was probably not the most serious, career-focused individual when I joined I still remember the day of the orientation program – that was the first time I actually understood the full scope of the Master’s program and was introduced to the world of GIS and Remote Sensing. Learning new concepts, having conversations with the professors, wandering the halls, and getting to interact with researchers gave me a very good knowledge base that I could later build on. Starting out with my thesis, I definitely struggled to get into “focus mode” and actually work on my project with commitment The conversation I had with Jayalakshmi Ma’am (my project guide) and Srinivasaraju Sir when presenting phase one of my thesis is one, I clearly remember – that was the point where I found the motivation to get “serious”. I carry that motivation to this day; it drives me to perform sincerely day in and day out
When I hire new people into our team, I like to tell them that they will find that up to 80% of what they do will be learnt on the job, and that can sometimes be shocking This is not applicable only to freshers but sometimes also to experienced professionals who are changing jobs.
That does not mean that you spend 14+4+2 years preparing for only 20% of the job, not at all Those formative years help establish who you are as a person, and give you the foundation and mental agility to scale that 80% sharply and quickly in a highly competitive environment.
I am honoured to be given this platform although I am not sure if I have the pedigree to answer this, considering all the illustrious alumni that IRS has contributed to the field! But if I have to convey a message to the current set of students, I’d ask all of you to first find your motivation. The only targets that you will find yourself attacking with full gusto are the ones that you set for yourself
11
Perspective of Current Final Years and Alumni…

Once you find that motivation, apply yourself and attack every problem with a solution-forward approach. Learn continuously, improve consistently, and never let pride get in the way of your learning – to lead properly, one must learn to accept help even from those who they lead.
This is especially true for all of you as the geospatial domain is fast growing, it’s an industry that is booming as we speak So, accept that you will always be learning, no matter how old you are or what position you hold
To end my message, I’d like to add a quote from Steve Jobs that I draw inspiration from to this day: “Stay hungry, stay foolish”!
Hezron Philip Jebakumar, Vice-President, Head Geospatial Risk Insights India, Swiss R
I'm currently working in ESRI, we develop GIS applications and Software The base of curriculum, B E Geoinformatics here at Institute of Remote Sensing (IRS) is GIS, so we learn how to solve real world problems using GIS and Remote Sensing Also, through our lab sessions we learn to handle some GIS and Image Processing software which eventually helps in building a strong CV and standing out in the recruitment process. Even though our syllabus is updated, still it is not enough to survive or shine in the corporate industry
More importance should be given to programming To the current undergrad students, I want to say that expand your knowledge in Information Technology and work on your programming skills So, one advice I would like to give is to learn a programming language other than the one in the curriculum Have a good grasp over it and try to learn to integrate GIS and Machine Learning. Above all, improve your communication skills, as these will help you to mingle as well as shine out of the box at your workspace or even in interviews.
12
Madhubala, working in ESRI, GIS applications and software development
REMOTE SENSING AND GIS IN DETECTING FOREST FIRES
~Raaga Tarunya A, 3rd year, BE Geoinforma�cs
Forest fires, also known as wildfires, are uncontrolled fires that occur in forests, grasslands, or other natural areas They can be caused by both natural and human factors, such as lightning strikes, hot and dry weather conditions, intentional or accidental human activities, and other factors They have devastating impacts on ecosystems, wildlife, and communities in and around affected areas They can destroy forests and other vegetation, damage soil quality, and release large amounts of carbon dioxide and other greenhouse gases into the atmosphere, contributing to climate change. This emphasizes the importance of detecting and managing fires in real-time to lessen their effects on the environment.
Various techniques are utilized to detect forest fires, which encompass ground stations, airborne mechanisms, and remote sensing systems The ground stations involve human supervision and automatic detection systems on the ground, utilizing cameras installed on buildings and towers Similarly, the airborne method also relies on human monitoring from planes These two methods, however, have limitations in terms of their coverage and costs of the detection and monitoring system. Detecting fires through satellites is more advantageous from both operational and financial viewpoints as it helps to monitor vast areas. Satellite systems provide data at a lower cost and have a higher frequency of data acquisition, which is vital for real-time monitoring of fires.
Remote sensing can be utilized to monitor forest fires through the utilization of polar-orbiting and geostationary satellites. Polar-orbiting satellites such as MODIS, AVHRR, ASTER, and Landsat are used for fire detection and monitoring However, these satellites have limited temporal resolutions, which makes it difficult to detect active fires in real-time In contrast, geostationary satellites such as GOES and MSG are more appropriate for near-real-time fire detection and monitoring These satellites provide continuous data over the same location on Earth within a brief timeframe, making them more suitable for the task
Remote sensing techniques are instrumental in identifying, monitoring, and mapping areas affected by forest fires, and are both cost-effective and time-saving. One way to identify active fires from satellite images is through direct visual methods, with infrared bands proving useful in mapping the burned areas by revealing differences between them and unburned areas. Each feature on Earth has a unique reflectance value, which can aid in detecting forest fires Different techniques, such as Burn Area Index (BAI), Normalized Burn Ratio (NBR), and Mid-Infrared Burn Index (MIRBI), are utilized to assess forest fire and burned areas Segmentation methods using ENVI or ArcGIS software, which includes supervised and unsupervised classifications, are also available to assess and map the affected areas
As the amount of multi-resolution remotely sensed imagery and multisource data becomes more accessible, the capacity to produce forest composition and structure maps with accuracy and timeliness will also increase. The forest attribute mapping operational capabilities are progressing and can now accurately reflect forest management scales.
13
~ Tejasveena R, 3rd year, B.E. Geoinformatics
Remote sensing, which involves the collection of data from a distance using various imaging and sensing technologies, has revolutionized the study of volcanoes in several ways.
Here are some of the ways remote sensing has transformed volcano research:
Monitoring volcanic activity: Remote sensing provides a safe and efficient way to monitor volcanic activity from a distance By using remote sensing techniques such as satellite imagery and thermal sensing, volcanologists can detect changes in volcanic activity, such as changes in temperature and gas emissions.
Mapping and modelling: Remote sensing has enabled researchers to create detailed maps of volcanic features, including the structure of volcanoes, distribution of vent, ash and other substances These maps are used to create 3D models of volcanic structures, which can be used to simulate volcanic eruptions and assess potential hazards
Early warning systems: By monitoring changes in volcanic activity using remote sensing techniques, volcanologists can provide early warnings of potential eruptions This can help to reduce the risk of loss of life and property damage in areas surrounding the active volcano
Identifying hazards: Remote sensing can identify and monitor a range of volcanic hazards, including lava flows, lahars, and pyroclastic flows This information can be used to develop hazard maps and plans for emergency response
An instance of remote sensing being used to study a volcanic eruption is that of the Taal volcano in the Philippines in January 2020 Taal is a complex volcano that is located on an island in a lake, about 50 km south of the capital city of Manila. The phenomenon was characterized by explosive eruptions of lava fountains, and pyroclastic flows. Around 1lakh locals had to be evacuated from the region. Continuous monitoring of the following parameters was carried out using remote sensing:
Volcanic gas measurements: Remote sensing instruments, such as thermal cameras and gas sensors, were used to measure the temperature and composition of the volcanic emissions t o better study the volcano and its potential impacts
Ash plume tracking: Satellite sensors and radar data were used to track the movement of the ash plume from the eruption in order to predict the path of the ash plume and assign appropriate warnings for the local communities
Ground deformation: The dynamics of the volcanic eruption was studied and assessed using Interferometric Synthetic Aperture Radar (InSAR), by measuring ground deformation
Impact assessment: Lastly, satellite imagery and drone footage, were vital in assessing the impacts of the eruption on the environment and human populations so as to implement relief efforts and future rehabilitation and recovery planning
Overall, the use of remote sensing in the study of the Taal volcano eruption highlights the importance of this technology for monitoring volcanic activity and assessing its impacts on the biodiversity and environment of the region. By providing detailed information on the behaviour of the volcano, remote sensing enables authorities to make more informed decisions and take action to protect the affected population.
14
Remote sensing in Volcanology
AIR POLLUTION - THE CRISIS
~ Swarnamuki P., 3rd year, B.E. Geoinformatics
New Delhi has one of the worst air quality in the country primarily due to motor vehicle emissions, wood-burning fires, exhaust from diesel generators, dust from construction sites etc. Delhi developed a Pure Oxygen Zone, India's first ever Oxygen bar, providing fresh air to breathe, but at some expense Hence, air pollution needs to be studied accurately and adequate measures has to be taken Air pollution is mainly caused by anthropogenic activities such as burning of fossil fuels, industrial processes, and automobiles (motor vehicles). Harmful pollutants like particulate matter (PM) and nitrogen dioxide exist in the atmosphere and cause air pollution To ensure good air quality, the U S Environmental Protection Agency created AQI (Air Quality Index). It is an index for reporting air quality daily and measures how air pollution affects one's health within a short period of time. The higher the AQI value (in a value range from 0 to 500), the greater the level of air pollution
Remote sensing and GIS contribute to air pollution monitoring Classically, monitoring of air pollution and its quality has been done using ground-based instrumentation that are designed to monitor specific pollutants. These instruments are quite expensive, and the coverage is limited by the number of air pollutant stations in each area So, they cannot provide a good spatial distribution of air pollutant readings Remote Sensing is an invaluable tool for data acquisition for integration into a Geographic Information System (GIS). Geographic Information Systems (GIS) have been identified as important tools for integrating and analyzing spatial information from different disciplines and sources
GIS integrates common database operations such as query and statistical analysis with the unique visualizations and the geographic analysis benefits offered by maps Satellite imagery provide large spatial coverage and reliable and repeated measurements, which would be helpful to monitor aerosols and their transport patterns and air quality on a local and global scale. There are numerous satellite data that can indicate criteria for air pollutants (e g, PM2 5 and NO2 ) The selection of satellite data to address specific air quality issues depends on data accuracy and spatial and temporal resolution, among others. Remote sensing offers a platform for creating an inventory database and thematic map for air pollution studies The four major satellite remote sensing techniques used to determine air quality in urban areas are as follows The first and most prominent method is measuring the aero sol thickness in the atmosphere, the second is black particle measurement, the third is a visual inspection of satellite imagery and the fourth is land-use/land-cover change analysis Current remote sensing systems for air pollution monitoring uses mainly infrared or ultraviolet light to detect pollutants that cause air pollution WHO has worked to ensure that health-relevant indicators of household and ambient pollution exposure and disease burden are included in the formal system of SDG indicators It includes, SDG target 3 9 1, which calls for a substantial reduction in deaths and illnesses from air pollution, SDG target 7 1 2, which aims to ensure access to clean energy in homes, SDG target 11.6.2, which aims to reduce the environmental impact of cities by improving air quality. To control air pollution, as a common man, one should plant more trees, implement carpooling to reduce the carbon monoxide content in the atmosphere etc Electrostatic precipitates (ESP's), like air filters, should be used to collect and remove particulate matter, such as dust, from industrial emissions and exhaust. Hence, in assessing, controlling and managing air pollution, Remote Sensing and GIS is a very powerful aid to achieve good quality of air, safe to all life forms as well as the environment
15
Spatial Data Mining
~ Sakthi, 2nd year, B.E. Geoinformatics
Have you ever wondered how the engineers recover files that have been deleted from our phones? They use a technique known as data mining. Data mining is the process of extraction of useful, implicit and previously unknown data from large databases. In the recent years databases have gone through tremendous advancements. One such advancement is spatial database. They are complex databases in which data are represented by spatial data types and associated by means of spatial relations Along with the improvements in data mining, spatial data mining has also had developments like spatial reasoning, spatial data structures, computational geometry and so more. Other than just extracting knowledge from large spatial databases, the spatial data mining methods is also primarily used to understand those databases and the spatial relationships among those objects One of the widely used approaches for spatial data analysis is the Statistical approach It has been well researched; thus, many algorithms exist that efficiently handle numerical data and come up with realistic models of spatial phenomena. But these modelling processes are so complex that only experts with good statistical knowledge are able to work with them. Furthermore, this approach is not able to model nonlinear data properly Hence the need for more efficient data mining techniques was felt and machine learning is the result of that It is the technique of training a system to learn from the examples and solve problems on its own It’s highly effective when systems are trained to extract spatial data from very large and complex datasets by feeding it examples of known spatial objects along with some of the spatial relationships between them Another popular approach is the Spatial Cluster Analysis which has also been modified for use of data mining Apart from these, there are image databases, mostly obtained through remote sensing techniques Spatial data mining algorithms are also used here to analyse the grid arrays in one or more spectral ranges. Data mining is a new field that began only after the 1980s. Currently spatial data mining is done by considering the databases as relational databases But advanced approaches like Object Oriented database approach are refining them, so suitable methods for spatial data mining should also be developed in due course of time
LET’s QUAKE THE PLATES: Seismic wave Prediction
When dark night sky rumbles, floor beneath your shoes begins to shake and structures fall upon you. You can’t hear anything; you can’t see anything It’s just you, struggling to survive, waiting for someone to save you This is not just a nightmare; it happens in real – an earthquake An Earthquake is caused by a shift in tectonic plates These plates have been moving for millions of years, but when they struck at their edges due to friction, a stress occurs at the edge. When stress overcomes friction, it causes an earthquake, resulting in immense release of energy. Earthquakes can be a result of anthropogenic activities too Mining activities result in disruption of the crust, leading to seismic movements Gallons of water stored in dams and reservoirs create pressure along the fault line and reach the magma, creating vapour pressure beneath the crustal plates These phenomena cause instability in mass balance of tectonic plates. Geographic Information System (GIS) can be used henceforth to analyze the instability in mass distribution and tectonic activities over the plates. This instability in plates also causes foreshock (aseismic slip), a mini earthquake (magnitude around 3 4 in Richter Scale) that precedes a larger earthquake in the same location, like a caution signal GIS mapping and satellite data can assist in collecting useful data related to foreshocks, strains/stress on the plates and some previous tectonic activities in the fault line, using which an algorithm can be generated to model earthquakes and predict them in near future. Hence, Remote sensing and GIS is the need of the hour for earthquake prediction and disaster management
16
~ Bala, 1st year, B.E. Geoinformatics
If you’re a current B.E. Geoinformatics student, get good exposure beyond regular classes and exams; look out for the various opportunities that you can explore. This column might guide you with finding the right internships in India as well as in abroad, that you can pursue during your undergraduate course.
Internships can be taken primarily in the 2nd and the pre-final year of undergraduate, with major internship opportunities available for the pre-final years.
WITHIN INDIA
● Hexamap Solutions
● M S Swaminathan Research Foundation (MSSRF, Tharamani)
● National Centre for Coastal Research (NCCR), National Institute of Ocean Technology (NIOT)
● Red Networks Telecom Pvt Ltd
● IIT Bombay – Center of Studies in Resources Engineering (CSRE)
● Indian Institute of Remote Sensing (IIRS), Dehradun –minimum project duration: 3 months
● IIT Kanpur – Students Undergraduate Research Graduate Excellence (SURGE) summer program
● IIT Roorkee – SPARK summer internship
● IISER Kolkata – Summer Student Research Programme (GI Application-oriented research work, particularly earth sciences)
● Indian Academ y of Sciences – Summer Research Fellowship Programme (SRFP) – for both engineering and theoretical sciences
INTERNSHIPS ABROAD
• Globalink Research Internship – MITACS: 12-week research internship with Canadian University facult y member guides


• DAAD, German y
• Lunar and Planetary Institute, Houston, Texas, USA –specificall y for Planetary Remote Sensing
• Nan yang Technological University (NTU), Singapore Summer internship program
• RIPS, University of California Los Angeles (UCLA) – Program, Research in Industrial Projects for Students (RIPS)
• California Institute of Technology – SURF programme (Summer Undergraduate Research Fellowship)
• Charpak Internship Program, France – for duration of 1 to 2 months at a French University/Institution
Go outside curriculum, dig deeper into core Geoinformatics!
17
What’s in store after undergraduate?
Following the undergraduate course, there are broadly two ways to go – placements or higher studies. Getting jobs is further categorized as getting placed in core Geoinformatics industries, or in IT or other field companies The scope of SPATIA is restricted to giving exposure for Geoinformatics, hence focus is on placement opportunities in course-core companies.
PLACEMENT DOORS: - Geoinformatics course holds a lot of job opportunities in the industry, some of them are listed here:
• Environmental Systems Research Institute (ESRI) – core GIS compan y, mapping and anal ytics; HQ in California, USA
• Hexagon, HQ in Stockholm, Sweden
• Hexamap Solutions
• RedLeaf Technologies Pvt Ltd – providing geospatial products and solutions to various sectors


• L&T Mindtree – HQ at Bangalore
• BIRDSCALE, Chennai – particularl y for inspection, airborne LiDAR mapping, customized drone manufacture and software development
• Swiss Re
• Trimble - HQ in Colorado, USA
• kCube, Chennai – application development services, professional training in GIS and remote sensing
• Infomap
HIGHER STUDIES: - Unique courses like Geoinformatics have tremendous scope in research areas, with applications in almost every field of study. With such a vast window of opportunity to excel, pursuing higher studies (Masters and preferably a PhD) is surely an excellent way to go:
Masters in India: Masters in India primarily requires the clearing of entrance exams like GATE, TANCET and other university-specific entrance exams
• M.E. Remote sensing and Geomatics, Anna University –through TANCET exam
Through GATE exam,
• IIT Bombay – CSRE, M.Tech.
• IIT Delhi – Centre for Atmospheric Sciences
• IIT Kanpur – M Tech Geoinformatics
• IIT Roorkee – M.Tech Geomatics Engineering
• IIT ISM Dhanbad – M Tech Geomatics
• IIST Thiruvananthapuram – M Tech in Geoinformatics
• NIT Surathkal – Dept of Water Resources and Ocean Engineering – Remote sensing and G IS
• Delhi Technological University (DTU) – M Tech in Geoinformatics (Dept. of Civil Engineering)
18
Masters Overseas:
• University of Twente, ITC, Netherlands – Facult y of Geo-information Science and Earth Observation
• Georgia Institute of Technology, Georgia, USA
• Stanford Universit y, USA – Civil and Environmental Engineering, School of Earth, Energy and Environmental Sciences
• Massachusetts Institute of Technology, USA – Dept of Civil and Environmental Engineering

• ETH Zurich, Switzerland
• University of Michigan, USA – Rackham Graduate School – good for RS and GIS along with atmospheric sciences
• University of Toronto, Canada
• University College London – Core GIS
• Ohio State University, USA – specificall y good for pursuing Geodes y
Higher studies in abroad requires a couple of entrance exams, aptitude tests and English proficiency tests to be taken, which differs with each universit y’s guidelines The common exams include: TOEFL and IELTS (For English Proficiency), GRE (General and Subject), assessing one’s logical and anal ytical abilities along with a bit of subject knowledge
CLIMATE CHANGE ANALYSIS BY REMOTE SENSING OF GLACIERS
~ Aditi R, 3rd year, B.E. Geoinformatics
Unpredictable weather, changing precipitation patterns, uncalled disasters – all these are various issues that our world is currently facing. There is a single root cause for all – Climate Change. Climate change is no more a problem of the future, but something that we can feel around us today, in various forms Causes of climate change are both anthropogenic and even natural, but the aim of this article is to understand how remote sensing and GIS technologies can help detect this climate change.
Glaciers – large moving mass of ice, are found majorly in the poles and in mountain ranges like the Himalayas, the Andes, the Alps etc. Glaciers are the primary indicators of climate change. Even the slightest change in climate is vastly depicted in glacial environments in the form of glacier retreat, ice melt, sea-level rise, wildlife and ecological imbalance and the likes Glacier retreat refers to the reduction in the area and volume extent of glaciers in a particular region over a span of some years. This is monitored by continuous time-series satellite data. The glacier boundary describes the extent of the glacier and glacier terminus refers to the endpoint of a glacier downhill, i e , the lowest elevation point, until where the glacier ice is present These two factors help in delineating glacial extent and using overlay analysis of different satellite images covering a time span of a few years, the glacier retreat can be estimated This in turn would describe the climate change impacts realized in that particular region
An instance of this is depicted in these two Landsat 8 Operational Land Imager (OLI) images acquired on October 13, 2020 and January 17, 2021 respectively, showing glacier retreat in the yellow-marked regions.


Source: https://landsat.visibleearth.nasa.gov/
Glacial environments are not easily feasible to be studied physically, hence remote sensing of glaciers is a vital tool and the need of the hour Delineating glacial boundary in a satellite imagery with respect to other land features is an easy task, due to the high spectral reflectance of snow/ice Hence, remote sensing and GIS for glacier dynamics studies is a vital area of study to better understand climate change patterns, and move towards a safe future.
20
Archaeology using Ground Penetrating Radar (GPR)

~ Aravindh Subramanian. S, 3rd year, B.E. Geoinformatics
Archaeologists, familiar only with the traditional methods of collecting material with a shovel and trowel, are increasingly marginalized in this changing environment In today's environment of widespread ethics, non-invasive subsurface exploration and mapping methods are increasingly important. New geographic information technologies have recently had a transformative impact on landscape archaeology, particularly by facilitating the collection and analysis of high-resolution data over large areas
Ground Penetrating Radar (GPR) is a non-destructive electromagnetic (EM) geophysical technique that uses radio waves in the frequency range of 10MHz to 2GHz to map the earth's surface The working principle of GPR is simple A transmitter at the surface sends short, highfrequency pulses that "travel" along the earth's surface until it encounters a boundary of different materials and picked up by the receiving ante nother boundary, where it will be has absorbed all the energy *This properties of the surface materials ave low ground clearance because ks, etc should be removed from the over it, your GPR probably can't get res and highlight others. Noise is in sers to reduce or remove noise to h that it is severely limited by less-th nd silt) are often problematic becau or heterogeneous sediments can sca neous noise
Depending on the se GPR to help uncover several buried buildings and foundations, forgotten infrastructure underground tunnels and cavities, buried military equipment, bones of humans or other creatures, missing and unmarked graves, coffins, various cultural relics etc Ground-penetrating radar has been used to identify buried structures and tombs in the ancient UNESCO World Heritage city of Petra in Jordan It has been used to uncover buried stones and other objects around Stonehenge in England, providing new insights into the construction and use of Stonehenge. It has been used to explore the underground structures and tunnels at the Inca city of Machu Picchu in Peru, revealing the architectural and engineering methods used by the Incas It has been used to identify the underground structures and canals of the Angkor Wat temple complex in Cambodia. Ground-penetrating radar (GPR) offers many advantages for assessing archaeological potential in frozen and semi-frozen environments in high latitudes and alpine regions These are just a few examples of the many archaeological sites identified using GPR This technique has proven to be an invaluable tool for archaeologists, allowing them to look below the surface and uncover new information about the past.
21
INDIAN REMOTE SENSING SATELLITES (Currently operational)
Satellite Launch date Sensors Application
EOS-04 Feb 14, 2022
Radar Imaging Satellite
Nov 07, 2020 Imaging microwave radars
EOS-1
Earth Observation, Applications such as Agriculture, Forestry & Plantations, Soil Moisture & Hydrology and Flood mapping
Earth Observation, Applications in agriculture, forestry and disaster management support.
RISAT2BR1
RISAT-2B
Dec 11, 2019
X-Band Radar Cartosat-3
Nov 27, 2019
Panchromatic camera, Multispectral VNIR
Earth Observation, Addresses the increased user’s demands for large scale urban planning, rural resource and infrastructure development, coastal land use and land cover etc
May 22, 2019
Synthetic Aperture Radar (X-band)
Disaster Management System, Earth Observation, Monitors the Earth day and night, in any weather conditions.
HysIS
Nov 29, 2018
Hyper Spectral Imaging Spectrometer
Earth Observation, Primary goal is to study the earth’s surface in the visible, near infrared and shortwave infrared regions of the electromagnetic spectrum, particularly for vegetation processes
CartoSat-2F Jan 12, 2018
CartoSat-2E Jun 23, 2017
Panchromatic Camera, High-Resolution MultiSpectral, Event Monitoring Camera
CartoSat-2D Feb 15, 2017
CartoSat-2C Jun 22, 2016
CartoSat-2B Jul 12, 2010
Panchromatic Camera
Earth Observation, the imagery sent by satellite will be useful for cartographic applications, urban and rural applications, coastal land use and regulation, utility management like road network monitoring, water distribution, creation of land use maps, change detection to bring out geographical and manmade features and various other Land Information System (LIS) as well as Geographical Information System (GIS) applications
22
CartoSat-2B Jul 12, 2010
CartoSat-2A Apr 28, 2008
ResourceSat2A Dec 07, 2016
ResourceSat2 Apr 20, 2011
Panchromatic Camera
Advanced Wide Field Sensor,Linear Imaging Self-Scanning Sensor –4 , Linear Imaging SelfScanning Sensor - 3
Earth Observation,Resource Monitoring
INSAT-3DR Sep 08, 2016 Data Collection Service, Advanced Aided Search and Rescue, INSAT Imager, INSAT Sounder
INSAT-3D Jul 26, 2013
Climate & Environment, Disaster Management System
SARAL
(Status: Orbit drifting) Feb 25, 2013
Advanced Data Collection System (also called "Argos-3")
Laser Retroreflector Array, Ka-band Altimeter, Doppler Orbitography and Radiopositioning Integrated by Satellite, Laser Retroreflector Array
Climate & Environment, Earth Observation
OceanSat-2 Sep 23, 2009
OceanSat Scatterometer, Ocean Color Monitor, Radio Occultation Sounder of the Atmosphere
Climate and Environment, Earth Observation, Oceanographic applications
RISAT- 2 Apr 20, 2009
Synthetic Aperture Radar (X-band)
Earth Observation, Disaster Management applications
23
GEONEWS around the Globe: Recent advancements in Geoinformatics


NEWSLETTER
24
SPACE WEEK
World Space Week 2022 – 4th to 10th October’22, was celebrated at Institute of Remote Sensing, Anna University on 6th and 7th October’22, following the theme – “Space and Sustainability” The 2-day event was conducted with active participation from the student community Plenary session on ‘Geospatial Technology for Climate Studies’ was conducted by Emeritus Professor, Dr. A. Ramachandran, Centre for Climate Change and Disaster Management, Anna University The second day of Space Week went on with a workshop on ‘Mental Health Awareness and Coping Skills for Students’ by Dr Sandhya Rani, Organization and Counselling Psychologist An online lecture on ‘Space Law and Policy Matters at ISRO’ was also organized by Mr. V. Gopalakrishnan, Advisor in the VS Mani Centre for Air & Space Law at GNLU, Gandhinagar Other informal events were also organized to bring in more exposure into the essentials of Space Week


25
PREVIOUS HAPPENINGS AT IRS
From September 6 to September 8, 2022, the 9th Digital Earth Summit was held successfully in Chennai, India. The theme of the summit is “Digital Earth to Bridge Digital Divide for Attainment of Sustainable Development Goals”. The Institute of Remote Sensing at Anna University in Chennai, India, served as the host for the Summit, which was organized by the International Society for Digital Earth (ISDE). The inauguration was presided over by Dr. Alessandro Annoni, President of ISDE in Italy. VC of Anna University in Chennai, Dr. Velraj; Director of the NIAS, Dr. Shailesh Nayak, who was previously secretary of the MoES, GoI; VP-ISDE Dr. Zaffar Sadiq Mohamed Ghouse and Director-IRS at Anna University in Chennai, Dr. D. Thirumulaivasan. During this three-day summit, more than 200 people from various institutes participated. In three plenary sessions, prominent academics and researchers gave six plenary talks on a variety of topics, including Earth observation, remote sensing, big data, digital resilience, and so on. During this summit, which lasted three days, researchers presented 45 technical papers in eight technical sessions on various subthemes. The large number of young people who are actively participating, most of whom have completed bachelor's or master's degrees in geospatial technology, is one of the Digital Earth Summit's special draws. To raise awareness of the Digital Earth technology among the youth in the community, Youth volunteers organized exclusive events for these young people. Digital Earth technologies like satellite data, spatial analysis, and geolocations are used to solve simple problems a cussion about how to inspire young minds with events like Geopreneur.


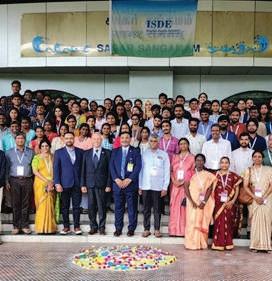
DIGITAL EARTH SUMMIT 2022 26
CELESTIA 2022
GEOHORIZON 2022


PREVIOUS HAPPENINGS AT IRS 27
OUR SPONSORS
India's most trusted real estate developers providing Retail, Residential, Commercial and Hospitality projects with residential projects and IT parks in Chennai, Mumbai and even Pune.
DCKAP is one of the world's foremost digital commerce specialists. They power digital commerce for innovative brands, manufacturers, and distributors across the globe with a suite of leading products, allowing businesses of every nature to unleash their full potential

Kumar Builders are premium construction hub, expanding as a core of building complexes.


ALLTERRA is a group of passionate professionals skilled at GIS and surveying. AllTerra partners are closely aligned with Trimble’s long-term vision of ‘Transforming the Way the World Works’ It acts as Trimble’s globally trademarked brand for distributing Geospatial Technology.

Trimble is an industrial technology company transforming the way the world works by delivering solutions that enable the customers to thrive Industries like agriculture, construction, geospatial and transportation are transformed by purpose-built products and enterprise lifecycle solutions

BIRDSCALE works with the aim to get airborne to visualise the world Their underlying objective is to get in dynamic drone technology with applications in Solar, Wind turbine inspections, LiDAR mapping,

28
Construction, Survey Mapping and Progress Monitoring for Real Estate, Mining and Agriculture Sectors
They provide versatile exposure when it comes to nano drones, AI enabled drones, Level 6 Pilots, Long range multirotor drones and even drones for cinematic purposes
Established in 1989, Skyline Builders have maintained the dignity of their construction works across Kerala It has created 154 architectural symphonies till date, and takes into account the goals of Sustainable Development too They also make sure to design their projects methodically enough to possess the Indian Green Building Council (IGBC) Green Home Certification.

Hexamap Solutions act as a firm GIS services provider. Their GIS services are not general, but customized according to the business requirements of the potential user Hexamap Solutions provide quality solutions to problems using their GIS services, keeping in mind five value virtues – Quality, Objective, Trust, Integrity, Commitment.

Red Planet Consulting Inc , is a premier provider of GIS software consulting services to Electric, Gas, Water and Telecommunications utilities At Red Planet, they strive to help our customers optimize and enhance their business processes by implementing enterprise -based solutions used to manage distribution networks and assets

Aditya Environmental Services Pvt Ltd (AESPL) is an environmental services company based out of Mumbai, Maharashtra, India It provides complete techno-legal assistance to its clients in the environmental sphere

Indomer Coastal Hydraulics (P) Ltd. is the leading Oceanographic Consultancy Company in India, offering full-fledged multi-disciplinary oceanographic services under one roof Their personnel are experts in varied domains including Marine Geology, Ocean Engineering, Environmental Engineering, Marine Geophysics etc It offers unique solutions for Port Design, Seabed Surveys, Seawater intakes, to name a few.

29
EnviroFootprints is an environment consultancy company that provides solutions to real-world environmental problems.

Welcome Technologies, based in Chennai is a new and unique wholesaler, trader and solutions provider of a broad cluster of Laser Distance Meters, Theodolites, Total Stations, GPS, GNSS and GPR

Another one of our sponsors is the Aswathi Company, who act as a vital consultancy brand.


LCT was established to provide services in Civil Engineering Surveying, GIS aping, GPR surveying, Land Surveying, LIDAR, Photogrammetry, Drone Mapping and much more
Roots Pvt Ltd works with the vision of safeguarding the environment and provides environment-friendly solutions.
Reliable Consultants are the pioneers in Civil and Architectural Design They have expert Land Surveyors providing comprehensive, reliable HR services

30
EDITORS:
Aditi R, Aravindh Subramanian S, Nithish M
CONTENT WRITERS:
Jeevitha B, Sabari Karthick S, Rishi, Srivarshini,
Ajan Sendhil, Chameli R, Gopika S.R., Neha, Akshith, Raaga Tarunya.A, Tejasveena R, Swarnamuki
P, Sakthi, Bala, Aditi R, Aravindh Subramanian S
CHEIF DESIGNER:
S S Shri Darshini
DEPUTY DESIGNER:
Amirtha A, Harine K, Aravindh Subramanian S


