

SUSTAINABLE SYSTEM IN A CITY ASSIGNMENT 1 TUTOR: MS. KEN YING GROUP T AISHATH RUZAINA ABDULLA (Ruzy) CHEE YEE CHENN (Vano) JADEN LIM KAI JIE LEONG JHEN LENG (Shawn) 336184 336412 337132 336054

tropical climate. With three distinct seasons: summer (March – May), monsoon (June –September), and winter (October –February).
Cultural diversity
• 16 major languages.
• 2 out of 3 Mumbai residents identifying as Hindu.
• 42% of the population is made up of Maharashtrians and 19% of Gujaratis.
Mumbai's sex ratio
• decline in child sex ratio
• For every 1,000 boys, there are just 899 girls.
20.6
Hindu Muslim Buddhist Jain Christian others
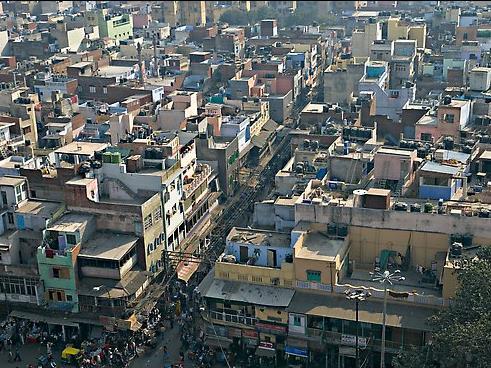
LAND USE
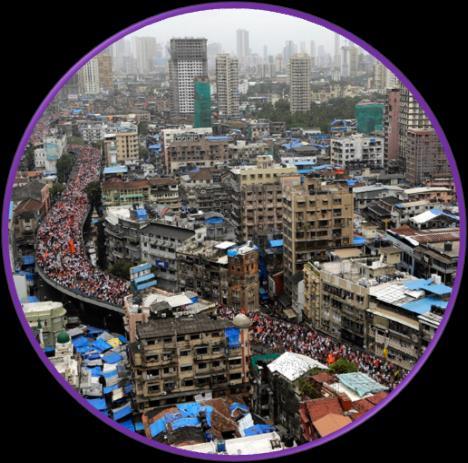
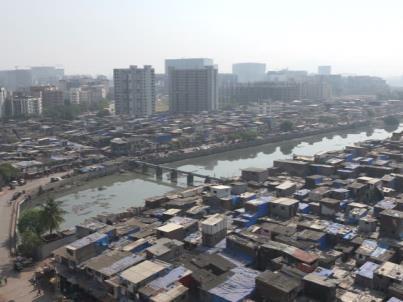
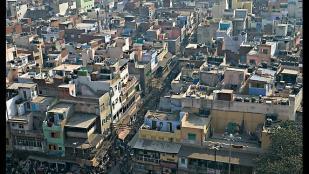
Slums
• Alpha global city.
• Financial, Commercial, and entertainment capital of India.

• Top 10 centers of commerce for global financial flow.
• Generates 6.16% of India's GDP.
• 8th highest number of billionaires in the world.
Industrial export and transactions
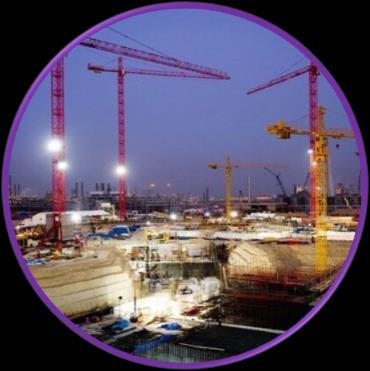
• 25% of industrial output
• 70% of maritime trade in India
• 70% of capital transactions to India's economy.
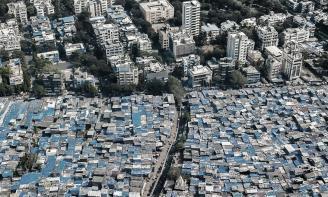
• 41.3% of inhabitants are living in slums.
• Dharavi is the largest slum with 1 million inhabitants.
• sex imbalance is due to sex-selective abortions.
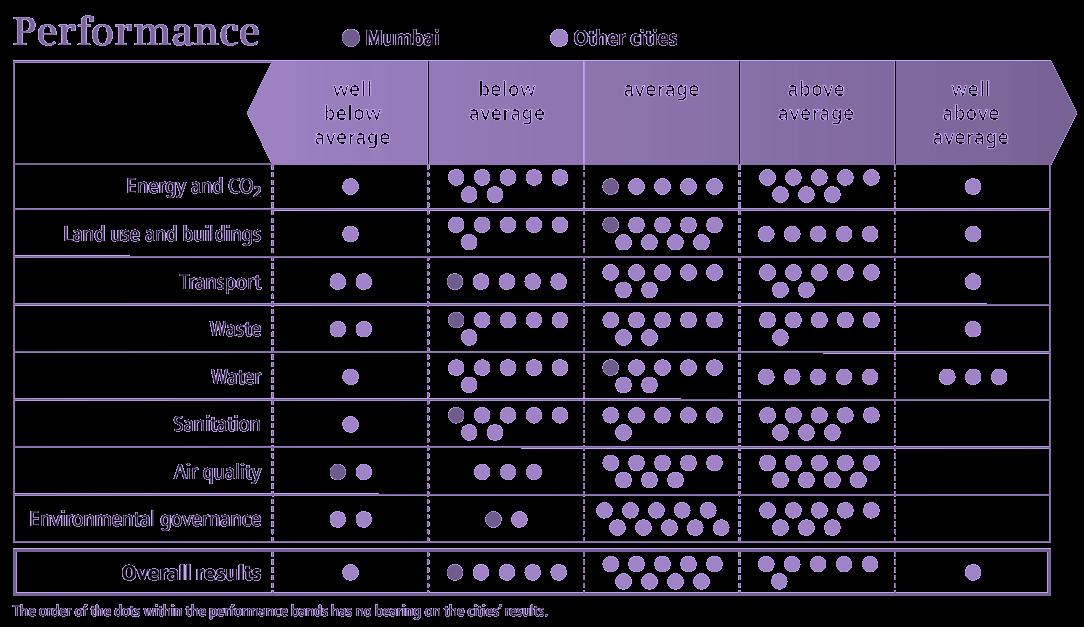
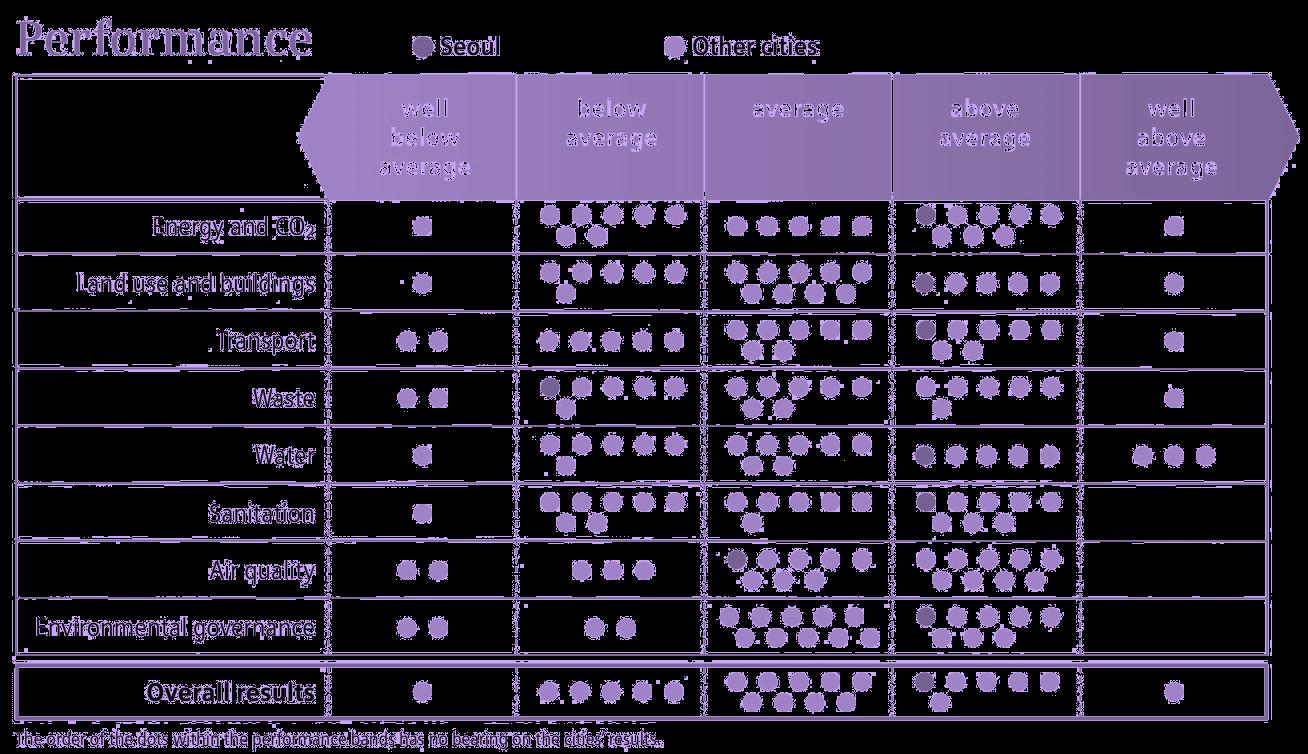
ASIAN GREEN CITY INDEX
URBAN PLANNING ISSUES

Mumbai is below average compared to other Asian green cities.
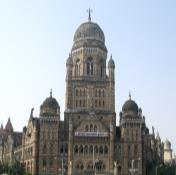
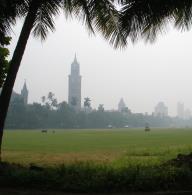
UNESCO HERITAGE SITES
Victorian Gothic and Art Deco
Ensembles of Mumbai
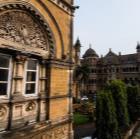
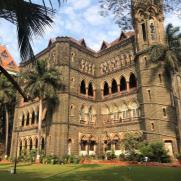
• collection of 19th-century Victorian neo-Gothic public buildings and 20th -century Art Deco
• 2nd century BC
• UNESCO Site Id: 1480
The loss of green cover, mangroves and other wetlands due to development
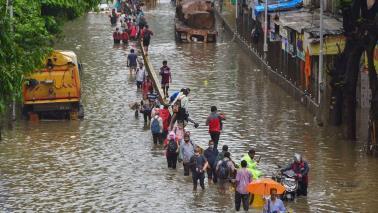
Mumbai’s drains, streets, local train tracks and homes flood, causing hardship, destruction
Chhatrapati Shivaji Terminus (Victoria Terminus)
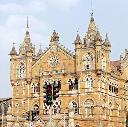
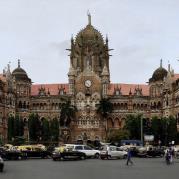
• historic terminal train station
• Built in 1878
• UNESCO Site Id: 945
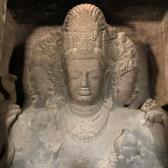
Elephant Caves
• a collection of cave temples predominantly dedicated to the Hindu god Shiva.
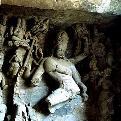
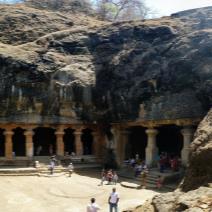
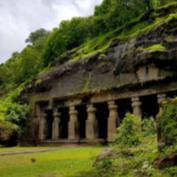
• UNESCO Site Id: 244
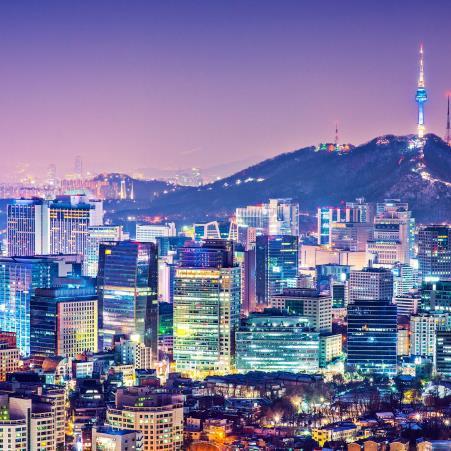
• Alpha global city.
• 13th largest economy in the world by GDP.
• The world's 4th largest metropolitan economy in 2014.
• Asia's most livable city in 2015.
• 2nd highest quality of life in 2015.
• Home of Samsung and LG.
• 2 of the largest technology companies in the world.
• Most sustainable city in Asia on the 2015 Sustainable Cities Index.
Temperate climate with four distinct seasons; Winter, summer, autumn, and spring.
• largely ethnically homogeneous country
• Majority are of Korean ethnicity.
• 2 million foreign citizens in 2016.
• 1 million of them came from China
• Native Seoulites tend to speak the Gyeonggi dialect of Korean.
RELIGION
• The two major religions
• Christianity
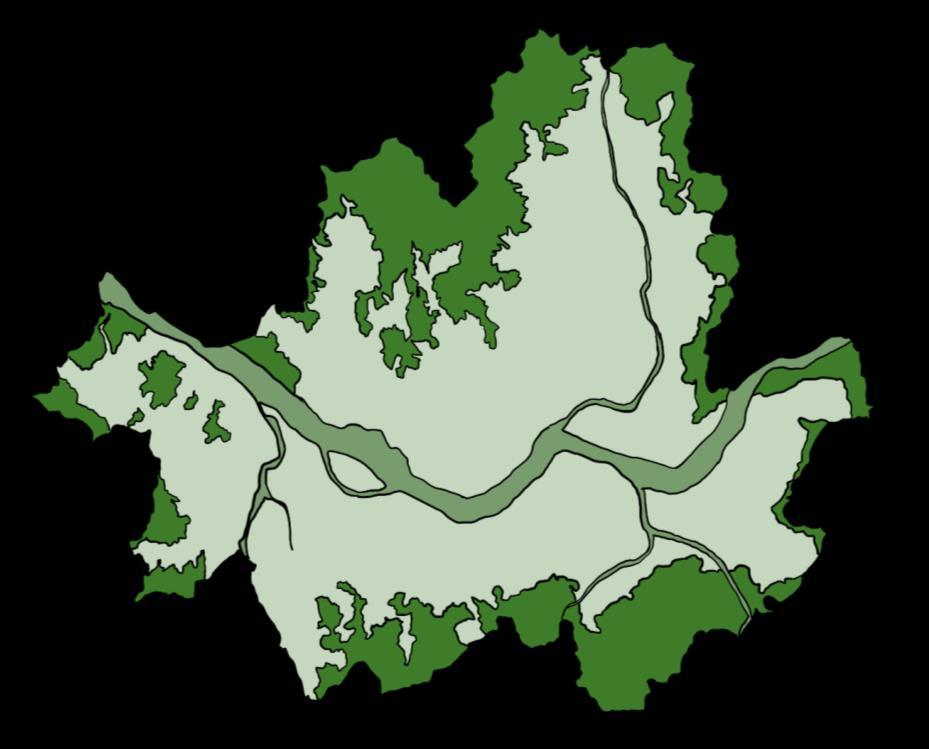
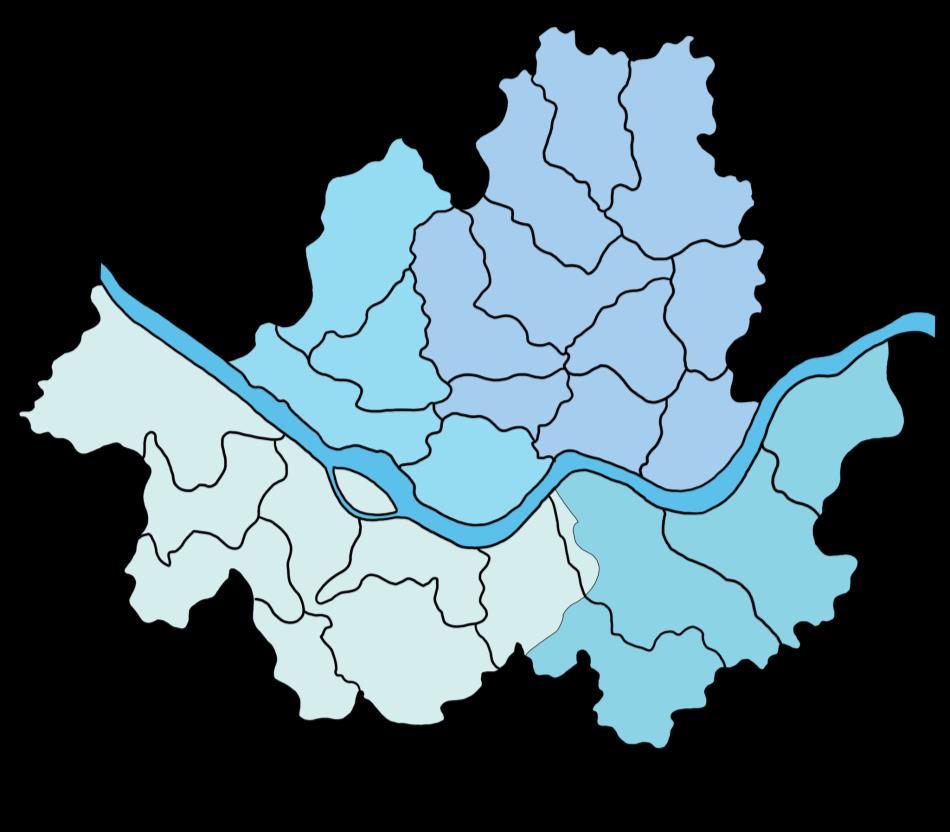
• The whole of Seoul is classified as urban regions and subdivided into;

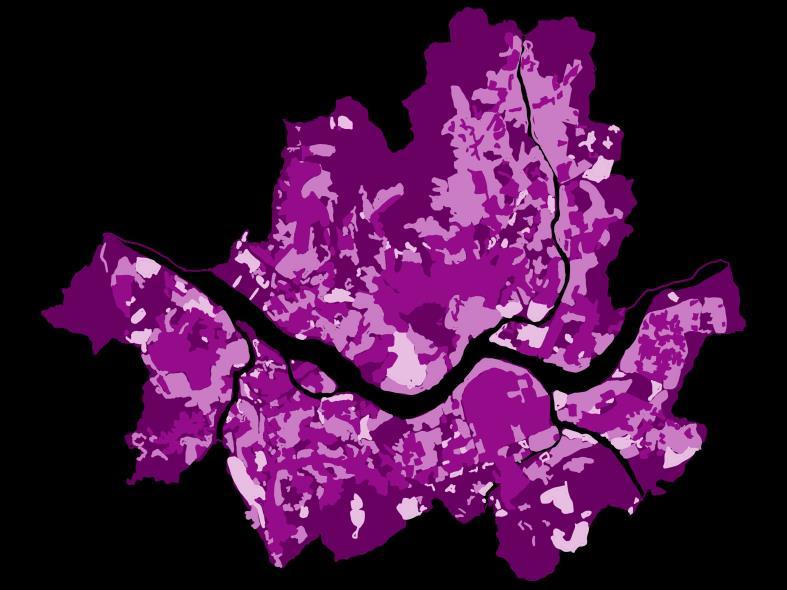
• residential regions (51.6%),
• Commercial regions (4.3%),
• industrial regions (4.5%)
• Natural regions (39.6%).
• Buddhism.
• Other religions include Muism and Confucianism.
18 2 Protestants Buddhists
45 35
Catholics
Others
Seoul performs above average in most categories with only waste and air quality below average and average, respectively.
There are 15 in south Korea
Changdeokgung Palace
• One of the "Five Grand Palaces" built by the kings of the Joseon Dynasty (1392–1897).
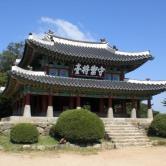
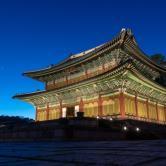
• UNSCO Site Id: 816
Namhansanseong
• Historical mountain fortress city 25 km southeast of Seoul
• UNSCO Site Id: 1439
Jongmyo
• A Confucian shrine dedicated to memorial services for the dead royalty of the Joseon Dynasty.
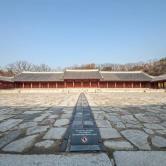
• UNSCO Site Id: 738
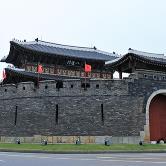
Hwaseong Fortress
• Fortification surrounding the centre of Suwon, the provincial capital of Gyeonggi-do.
• UNSCO Site Id: 817
POPULATION GROWTH RATE
The population of India grows by approximately 5% annually. Increase of 1 million people every year.

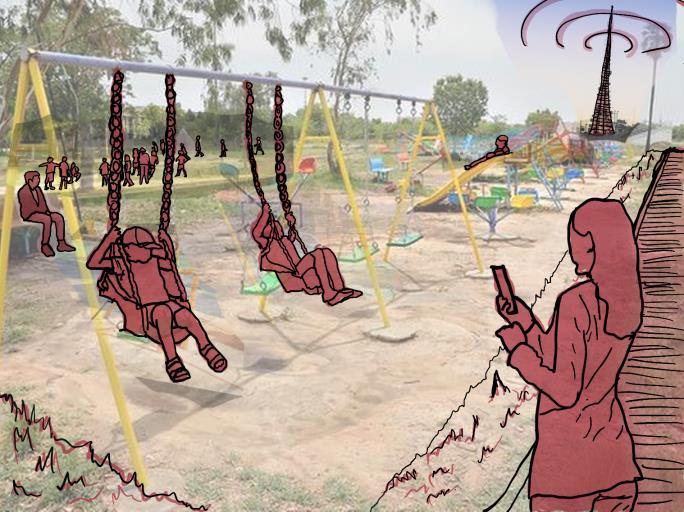
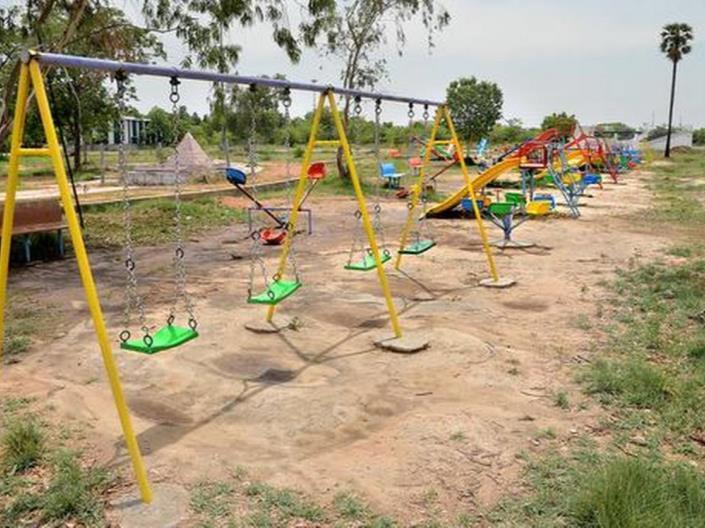
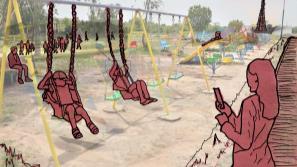
Mumbai has 15.37 sq/km of accessible open space.
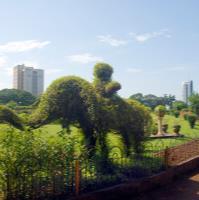
Plans for an open space standard of 4Sq/m per capita.
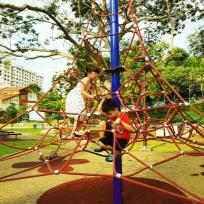
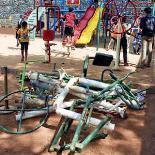
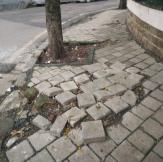
ILL- MAINTAINED
gardens playgrounds recreation grounds
Considers six characteristics to rank countries on overall happiness:
• GDP per capita
• social support,
• life expectancy
• freedom to make choices
• generosity
• Perception of corruption
India was ranked 144 out of 156 countries surveyed.
Overall perceived happiness, laugh and enjoyment has reduced
While overall perceived worry, sadness and anger has increased
The percentage of the population which is literate is 74% (2011)
Female literacy is 22% lower than the global average.
Molestation cases doubled from 388 to 751 from 2013 to 2017. in 2018, from January till September, 651 cases have been registered.
Quality of Life Index is an estimation of overall quality of life by using an empirical formula which considers:
• Purchasing power index
• Pollution index
• House price to income ratio
• Safety index
• Health care index
• Traffic commute time index
• Cost of living index
• Climate index
2-child policy
• people with more than 2 children: ineligible for state government jobs
• exclude them from the benefits of 77 government schemes.
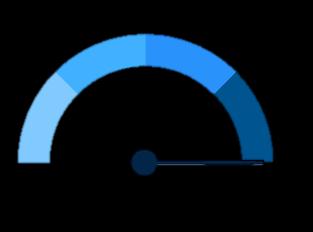
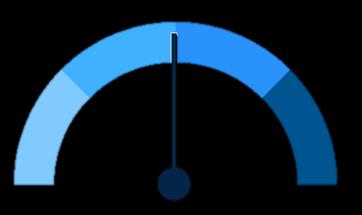
77.64
The quality-of-Life Index barely reaches moderate at a measly 77.64
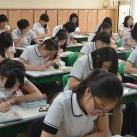
43% of Maharashtra’s children missed regular schooling or were unable to attend school at all during the pandemic.
Disparity of 20% between male and female. households pay for 61.8% of their total health expenditure.
5 times more compared to the US.
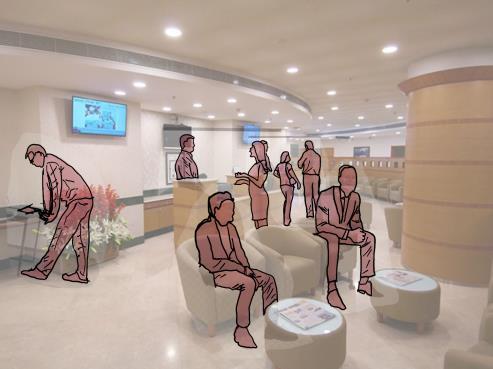
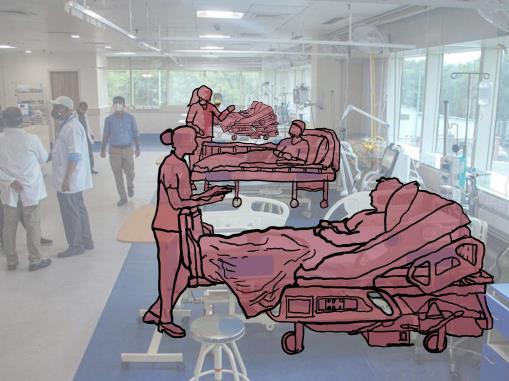
Only 37% of the population was covered by any health coverage in 2018.
Government employees following the twochild policy will be eligible for incentives:
• 2 additional increments during their service
• subsidies on purchase of land or house.
• 3% increase in Employee Provident Fund.
Those with one child:
• 4 additional increments in their jobs
• FREE healthcare till the age of 20.
• FREE education for their child till the age of 20.
Those who are not in government service but follow the two-child policy get rebates on:
• water and electricity bills
• housing tax
• home loans from banks
A large percentage of children missed schooling during the pandemic.
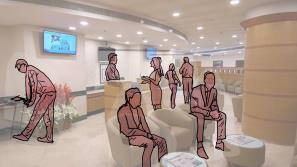
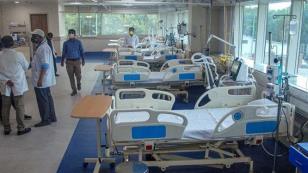
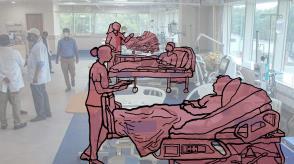
Healthcare is too expensive in Mumbai Low % of Indians covered by health coverage
Public spaces are ill maintained with broken infrastructure and unsafe for women
The 2 child policy is not impactful enough as the population is still increasing at a high rate
The population of South Korea grows by approximately 0.14% annually with a birthrate of 0 98 births per woman

There are 2,868 parks in Seoul alone.
17 sq/m of green area per person (2020).
Seoul has provided free Wi-Fi access in outdoor spaces through a 47.7 billion won project.
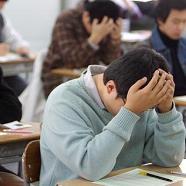
Excessive demands on individuals.
• Long working hours,
• Social pressure for excellence
• Stress and fear of failure among people. As a result, many Koreans choose not to have children.

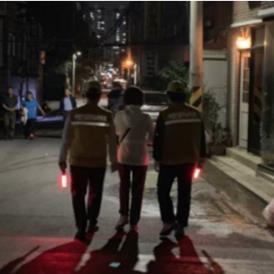
• They created “Ansimi”
One of the top-performing OECD countries in reading literacy, mathematics and sciences. placed 9th in the world. The percentage of which the population is literate is 97.9 (2011)
• a smartphone app that connects with 32,597 CCTVs and smartphones to monitor in real-time and provide rescue support.
FEMALE LABOR FORCE
More women entered university
• Growth in the female workforce
• Postponed marriage to pursue improvement of their standard of living.
In the World Happiness Report 2020, South Korea was ranked 83 out of 156 countries surveyed.
PERFORMED WELL IN:
Life expectancy - 9th
Per-capita GDP - 27th
Generosity - 40th
After the 1950-53 Korean war there was a baby boom, The government launched a campaign encouraging women to have no more than 2 children.
The total fertility was reduced from 6.0 to 1.6 children per women
The government implemented an anti-natalistic policy in the 1960s. This program mandated that Korean healthcare centers provide a family planning consultation by introducing:

• Traditional contraception methods

99.7% of South Korean households had full access to the internet.

Over 90% of all children attended school
• Intrauterine devices (IUDs)

• Vasectomies
• Condoms

There is a strong sex preference for a son
On average, residents only need to cover 32.50% of their medical treatments,
• A daughter cannot carry the family name
• Prioritize children’s education
• relationship between higher education and socioeconomic status.
FAILING BEHIND IN Freedom - 144th Corruption - 100th Social support - 91st
Quality of Life Index is an estimation of overall quality of life.
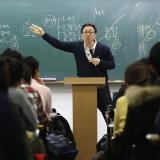
Faster and wider internet coverage. Provide free education for elementary and middle school students.
Compulsory social insurance. The government covers 80% of their medical treatments.
Refurbishment of parks.
Using app “Ansimi” to provide rescue support.
Provide family planning consultation. Introduction of contraceptives.
PROBLEM IN MUMBAI
• Disparity between male and female
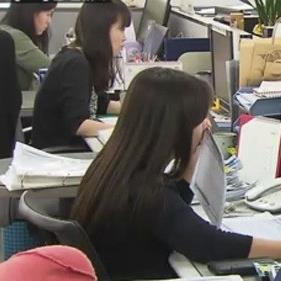
• Children missed classes due to internet issues.
SOLUTION FROM SEOUL
• Implement faster and wider internet coverage.
• Provide free education for elementary and middle school students
PROBLEM IN MUMBAI
• Pay for a large % of their healthcare
• Low % of Indians covered by health coverage
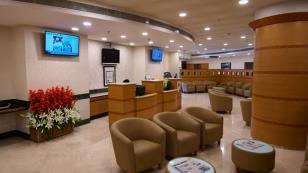
SOLUTION FROM SEOUL
• The government covers 80% of their medical treatments
• 97.2% of the population was covered by NHI in 2018.
PROBLEM IN MUMBAI
• Ill maintained
• Broken infrastructure
• Prominent street harassment.
SOLUTION FROM SEOUL
• Refurbishment of parks
• Using technological advancement app
“Ansimi” to provide rescue support.
PROBLEM IN MUMBAI
• The 2-child policy is not thorough enough as the population is still increasing at a high rate.
SOLUTION FROM SEOUL
• Korean healthcare centers provide a family planning consultation
• Introduction of contraceptives
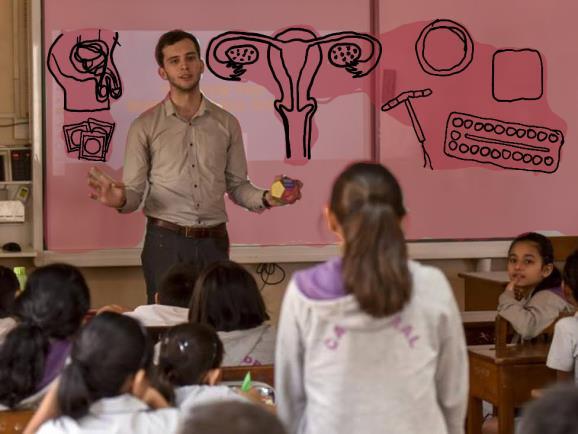
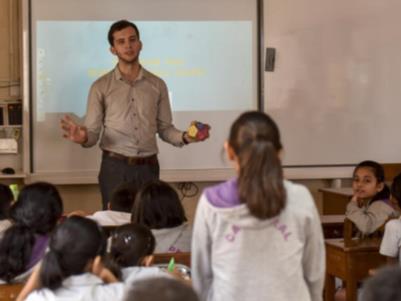
Not enough awareness of contraceptives and consultations
Implementation
Schools do not educate the children on the subject as it is a taboo subject

The ratio of green spaces to total area fell from 46 7% in 1988 to 26.67% in 2018, with most significant changes observed during 1988-1998, when around 14% of green spaces had transformed due to development activities.
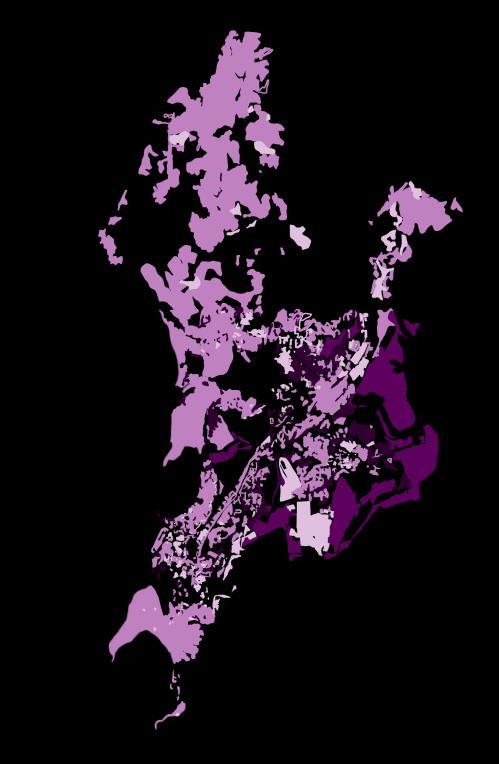
Of all of India’s city, Mumbai has least greenery with just 12.3% of the city classified as green, providing only 4.4 square meters per person. And the overall loss of green cover in 3 decades is 42.5%
Vibrant food processing sector is increasingly becoming evident that it can lead to the increase of farm gate prices which in turn increase income levels, reduce wastages and increase job opportunities.
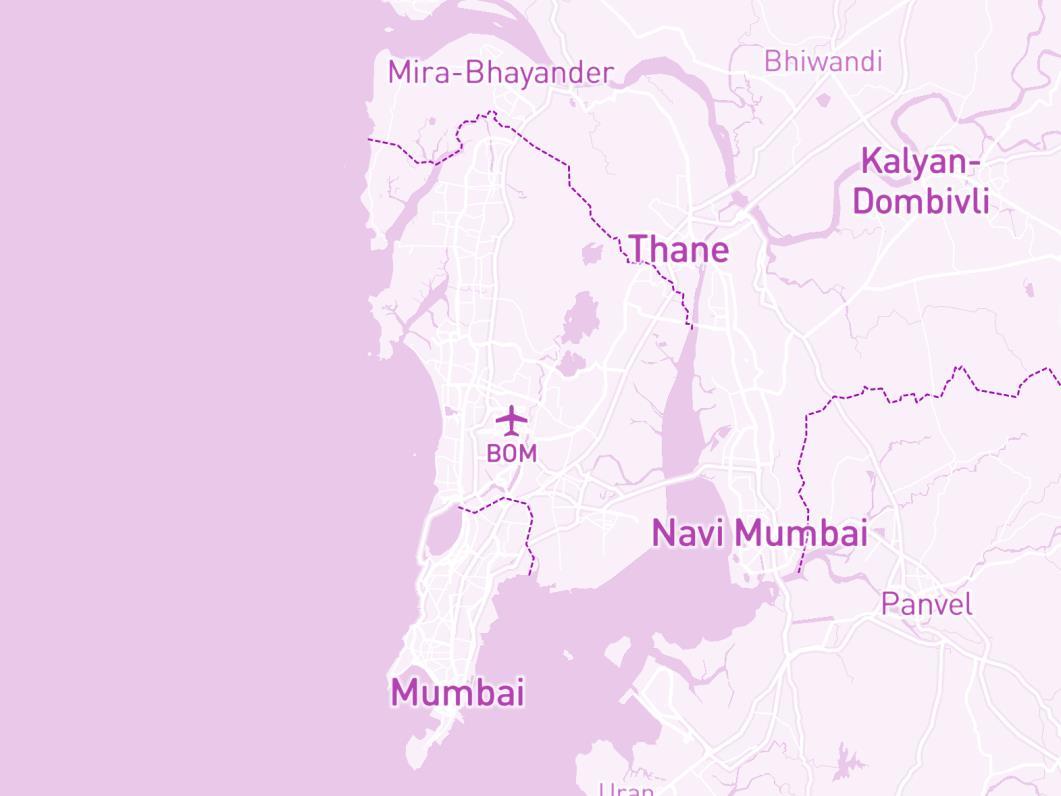
Mumbai is a coastal town with tropical, wet and dry climate It also experiences three distinct seasons of winter, summer, and monsoon The average temperature of Mumbai in recent years is 24° – 34°.
With the rapid urbanization, more and more green areas are being replaced. The landslides, and floods also causes to the number of unusable spaces increase which destroys the wildlife habitat.

With the rapid urbanization of Mumbai, the city experiences urban heat island effects. While Mumbai’s land surface temperature is lower along the coast, the center is heated due to the amount of building present.


In the presence of the current pandemic, the amount of electricity that is consumed in Mumbai is around 1,500-1,900 MW. It varies on the time of day and the city’s consumption is around 3,0003,200MW.
The inefficient use of land, causes the lost of biodiversity of Mumbai which in turn making the ecosystems unstable and slowly degrade.
The Maharashtra government has produced a new Renewable Energy Policy aiming at implementing 17,360 MW of transmission systemconnected power projects by 2025
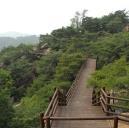
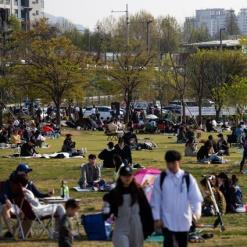
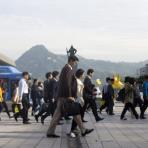
10 minute walking

The Seoul Metropolitan Government have introduced 197 new green spaces in downtown Seoul from 2012 - 2016. The number of parks now are located within 10 minutes of walking distance from residential areas and implemented various measures to reduce green service exclusion areas.
Average High Temp Average Low Temp
Seoul has temperate climate with four distinct seasons of spring, summer, autumn, and winter. The average temperature of Seoul in recent years is 0° - 30°.
According to a survey in 2020, around 26.6 percent of households spent between 30,000 and 50,000 South Korean won each time they went grocery shopping.
As of December of 2018, the forest area accounted is the largest share of the total land area in South Korea with over 59 percent followed by an agricultural area with 18 percent.
With the issues in hand, Seoul has implemented solutions in which to lessen or remove the amount of impact it has to the city by promoting green growth policy as a strategy to simultaneously promote economic growth and environmental protection while gaining a competitive advantage of converting each industries value chain into a low-carbon and eco-friendly industry, thus creating new market. The main contents of green growth policy are as follows:
making a basis for green economy expansion of clean energy use
vitalizing carbon markets and establishing green finance infrastructure
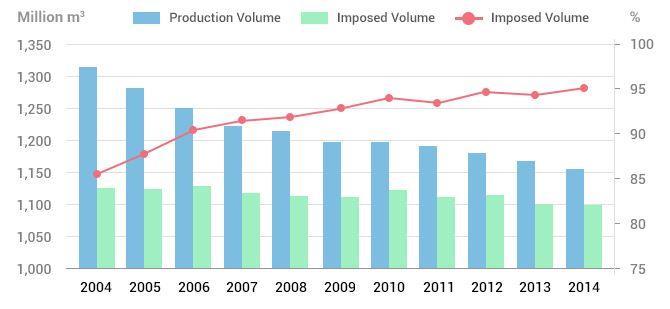
The total area amounts to 1,880,000m2, Seoul has a total of 2,278 green spaces (146.22km2). The green cover loss from 1960 (70%) to 2015 (29%) is about 41.43%.
capacity building for climate change adaptation.
making green national land through resource-recycling development of the region.

PROBLEM IN MUMBAI
• Land Erosion, heavy rain, subsequent flooding
SOLUTION FROM SEOUL
• Restoration
• Drainage system
IMPLEMENTATION OF SOLUTION
PROBLEM IN MUMBAI
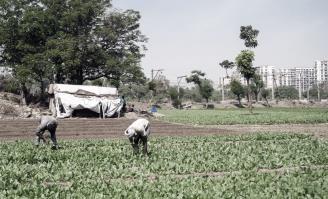
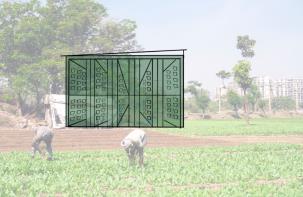
• Reduction in the amount of open green space for agriculture due to urbanization
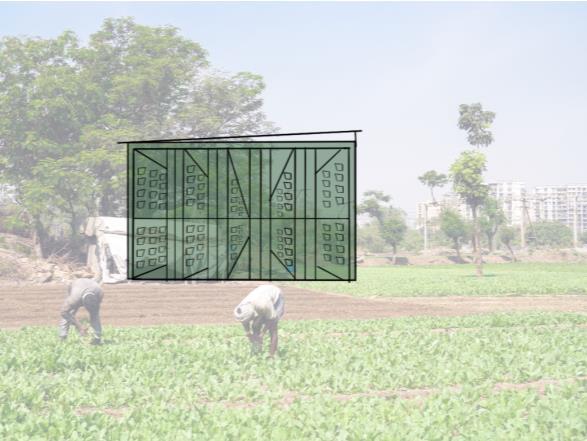
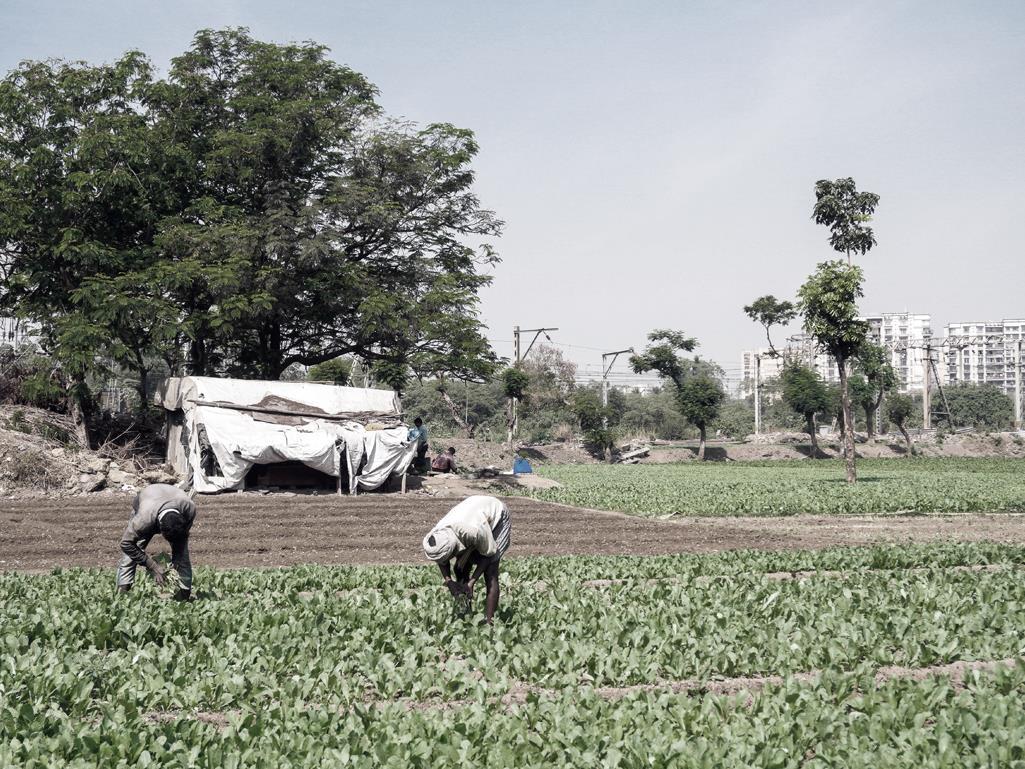
SOLUTION FROM SEOUL
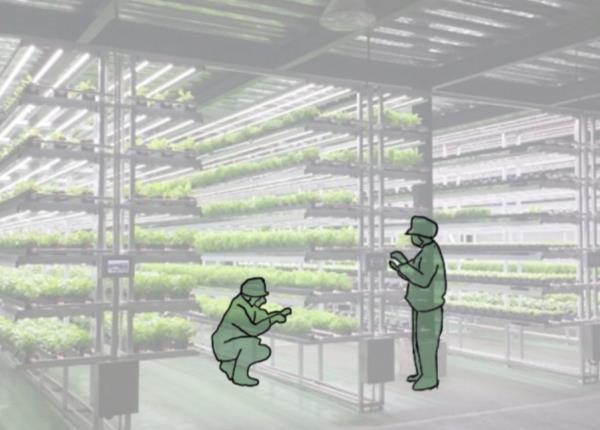
• Utilization of vertical farming
IMPLEMENTATION OF SOLUTION
PROBLEM IN MUMBAI
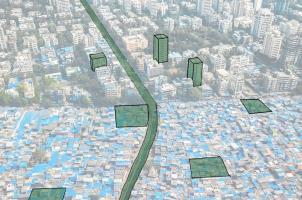
• Rapid urbanization (spaces)
• Urban heat effect
SOLUTION FROM SEOUL
• Introduction to more green spaces
IMPLEMENTATION OF SOLUTION
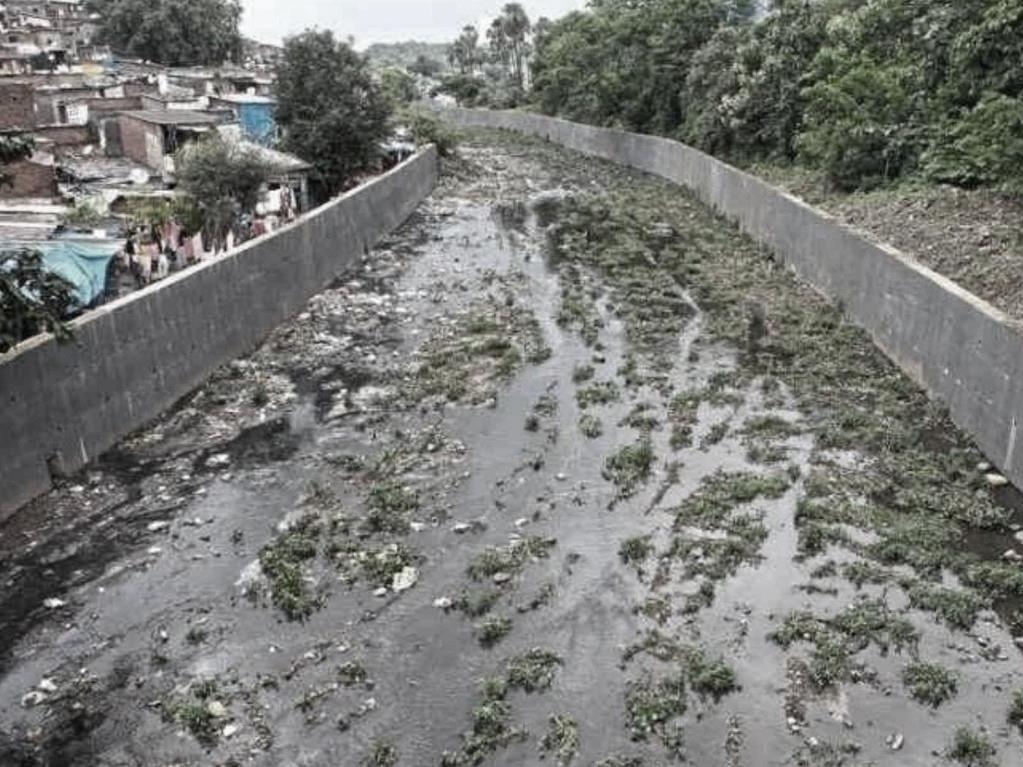
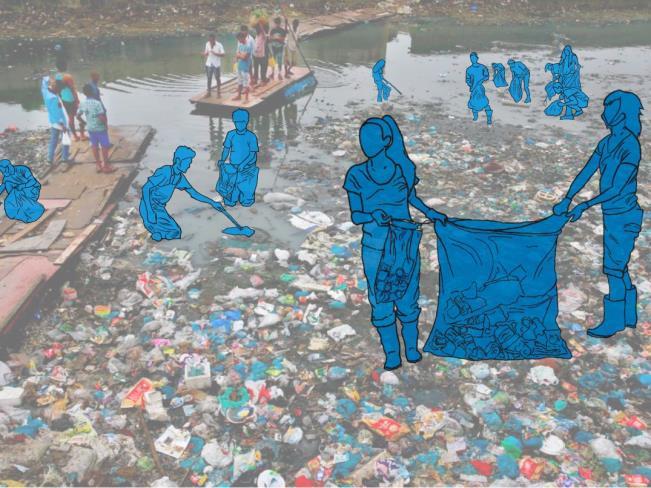
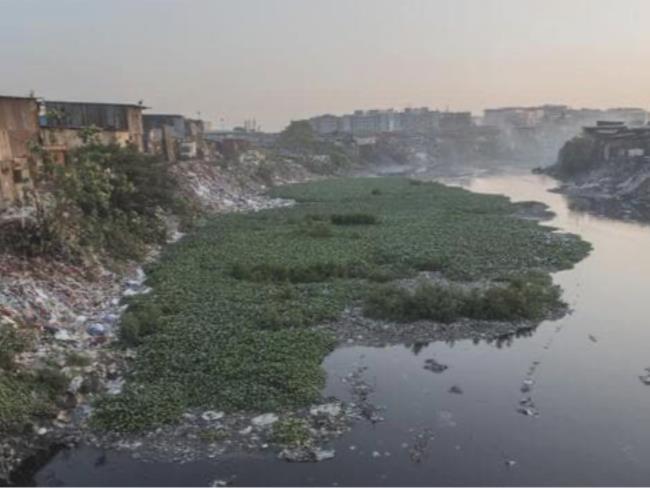
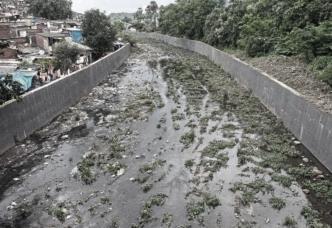
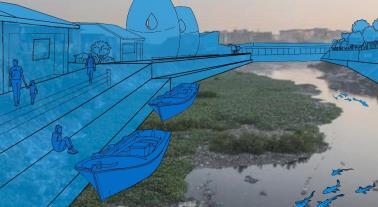
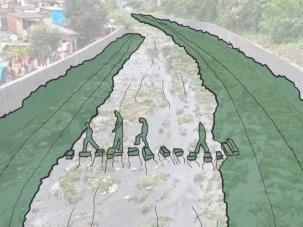
Mithi River
Disconnection of two sides of the river
Destroy wildlife habitat
BEFORE AFTER
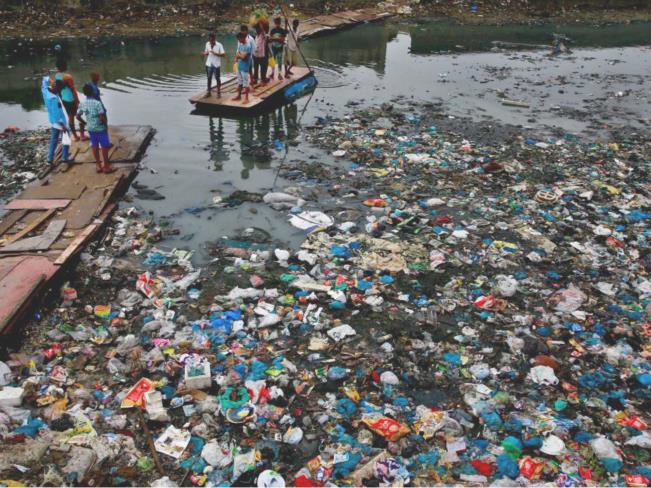
Further encouragement littering to the river.
Simple solution to landslide
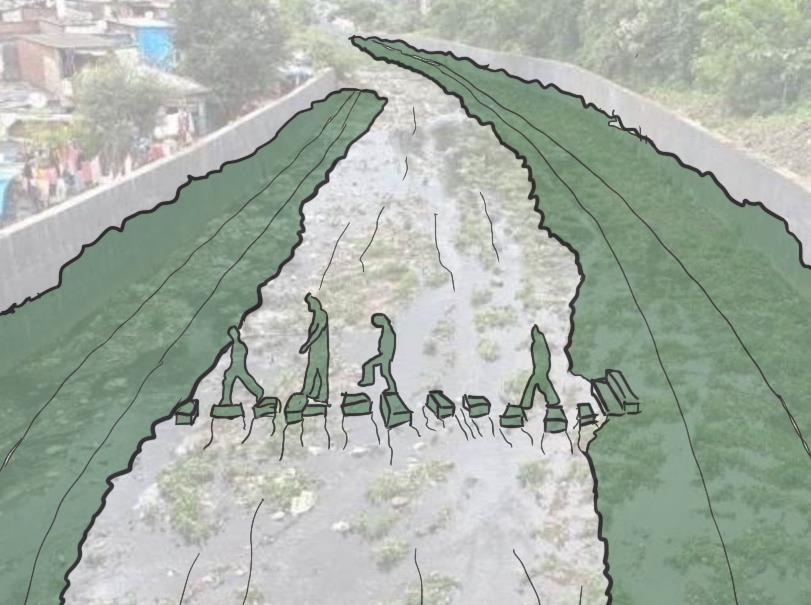
Utilization of restoration projects
Connect green spaces to encourage biodiversity
Increases more green space for user to indirectly enjoy due to circulation
Farm
BEFORE AFTER
Requires higher quality control
Restricted to the amount of available land
Less efficient in overall process of farming
Introduce combination of vertical farming and traditional farming
Maximize the amount of crops from farming
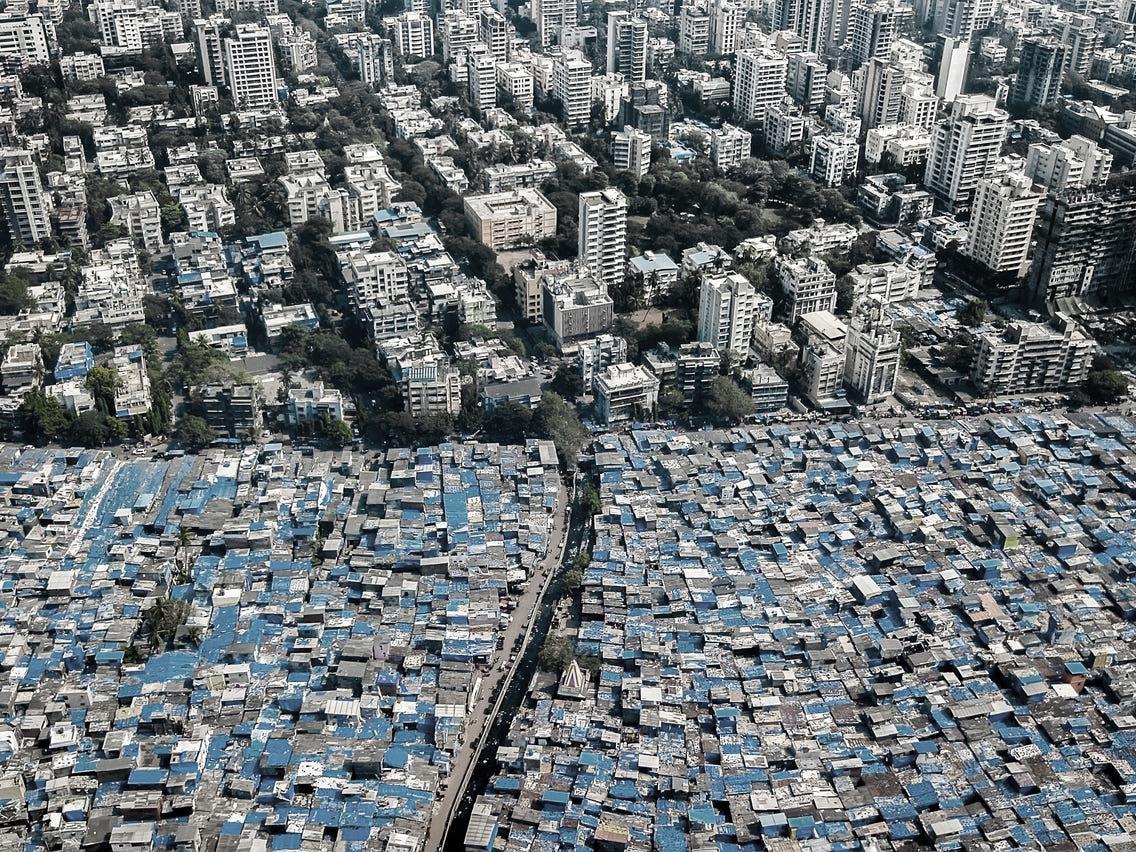
Mumbai
BEFORE AFTER
Not enough green spaces for the citizen
Urban heat island effect, causing more energy usage for cooling
Maze like circulation, making it difficult to navigate in the slums
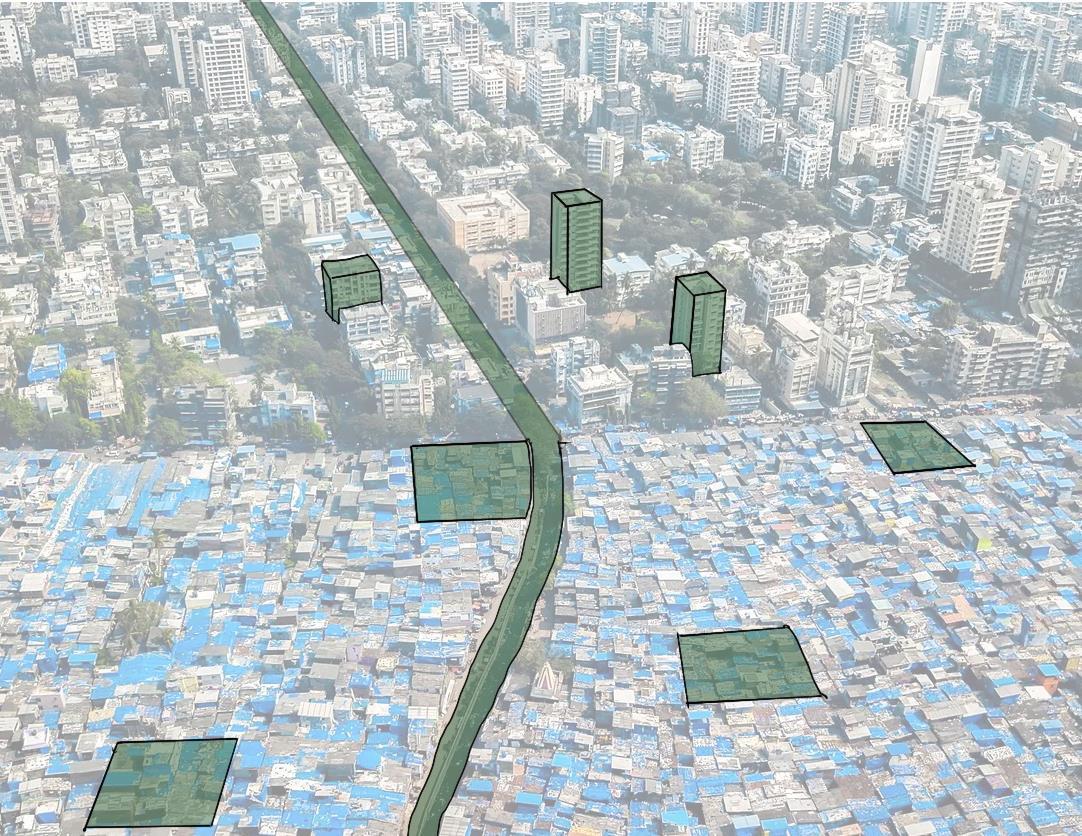
Introduction to of green architecture
Think twice before littering Would lessen crime rate.
Flexible in location
Highly Efficient in taking care of the quality of the crop
Increase more public parks within walking distance.
Inlay plantings at roadside

14,47,363ML
evaluation of spatial and temporal variation of land use and land cover change in a major coastal urban catchment of Mumbai City, India, called Mithi River catchment.
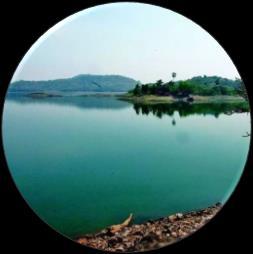
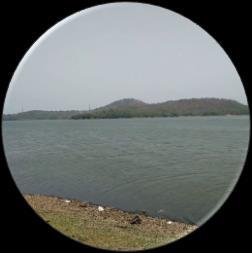
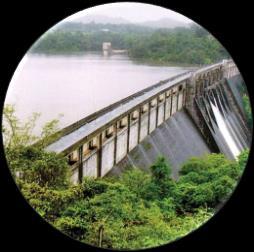
WATER SOURCE

Total Capacity of all lakes
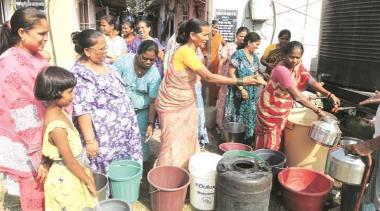
As per the central Pubic Health and Environment Engineering Organization standards, BMC supplies 135 litres of water per person in buildings and and 45 litres per person in slums

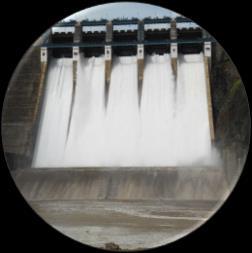
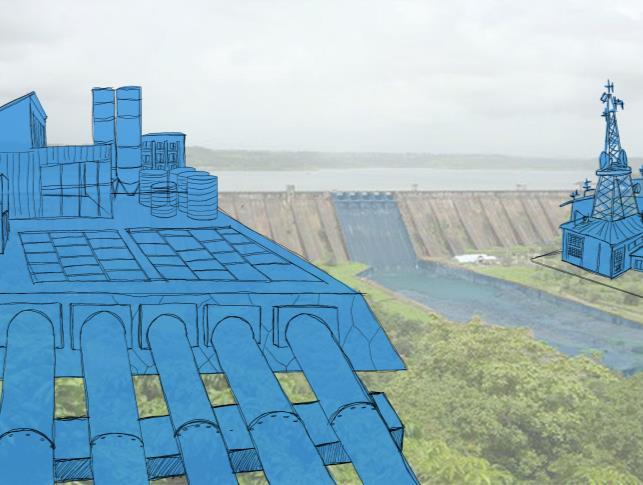
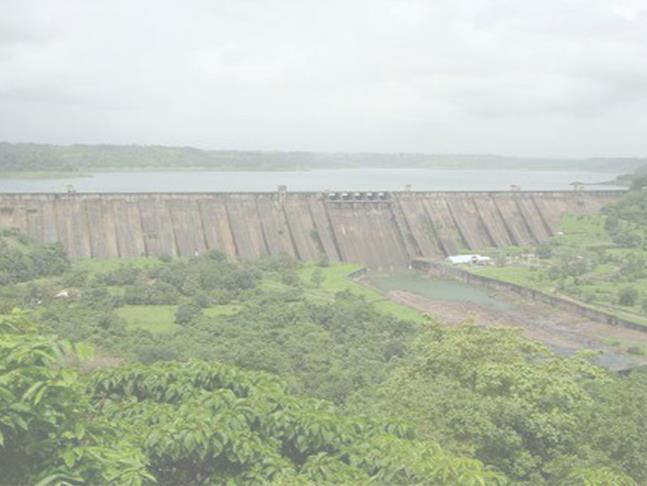
Mumbai gets 575700 ML from Bhatsa Dam, which has been built by the state govt

2 main types of water supply connections are found. Group connections are usually shared by 5-10 neighbourhood households together pays BMC(municipality) for the water connections


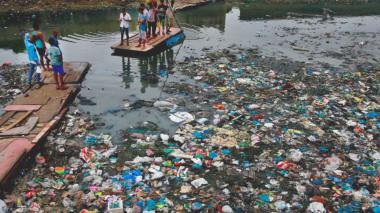
High water pollution rate
Many wastes are thrown into the water ways causing water pollution
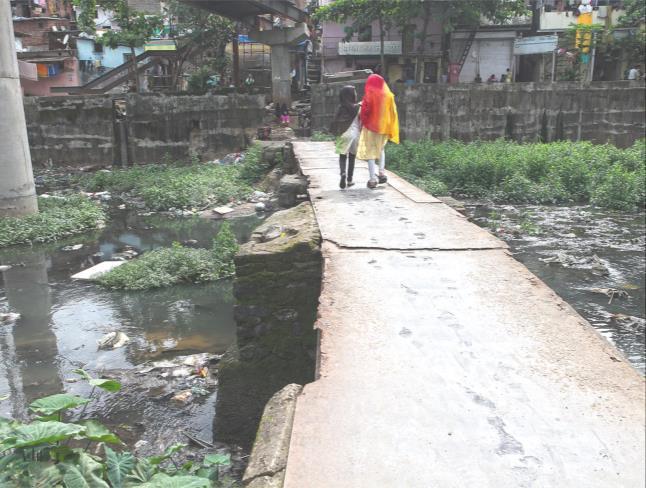
Flooding issue

Flooding occurs through bad drainage systems
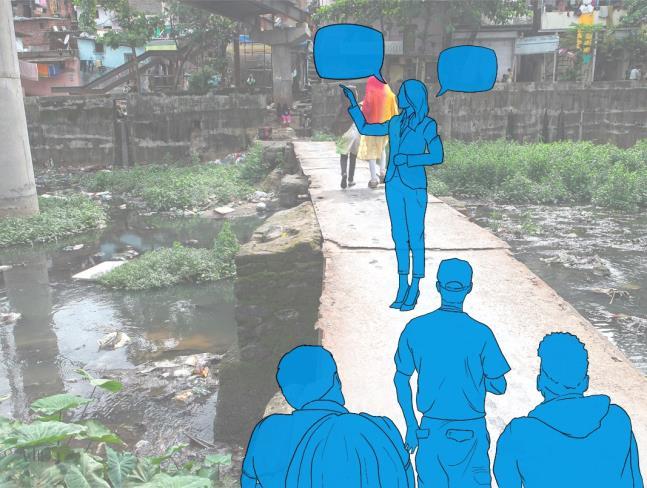
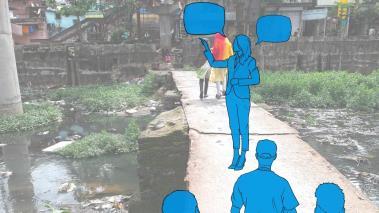
Rural Sanitation Issue
With around 50% of its population living in slumps.
Due to insufficient drainage facilities in the slum and the proximately of water pipeline to open sewage Almost 1 out of every 3 households reported an illness during this season
AVERAGE
response were affirmative towards unhygienic conditions of areas surrounding the water tap and 84% people claimed leakages in their water pipe connection as they received contaminated water everyday
20%

Loss in transportation
High water loss rate due to regular leakage from the cities of Mumbai. The leakage happens through theft and damaged pipelines.
Vihir lake Talsi lake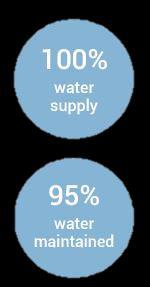
the average scores of the seven categories. The Blue City Index, the geometric mean of all 25 indicators, is 7.3.
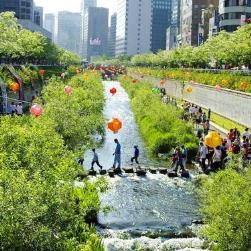
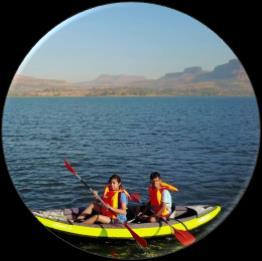
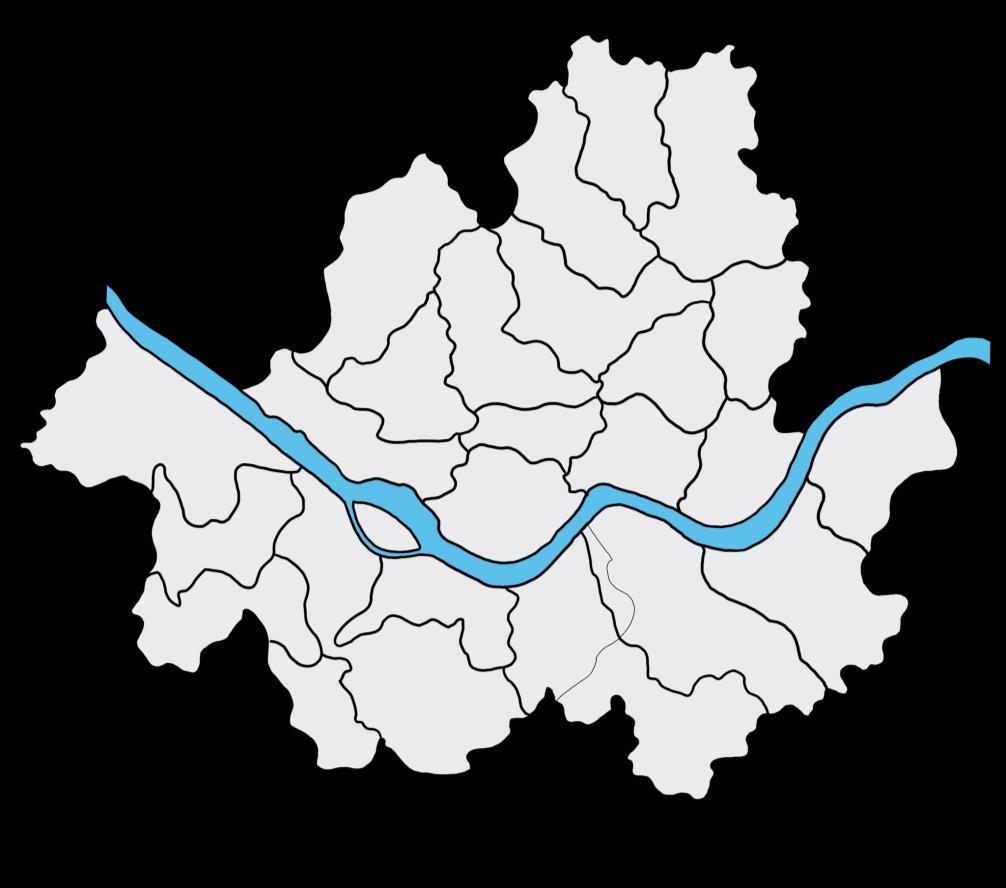
The lower stretches of the Han River are lined with pedestrian walkways, bicycle paths, public parks and restaurants, particularly in Seoul. In a 2011 survey conducted by Seoul Development Institute of 800 residents and 103 urban planning and architectural experts, 51.3 percent of residents and 68.9 percent of experts voted the river the second most scenic location in the city, following Mount Namsan in the top spot.
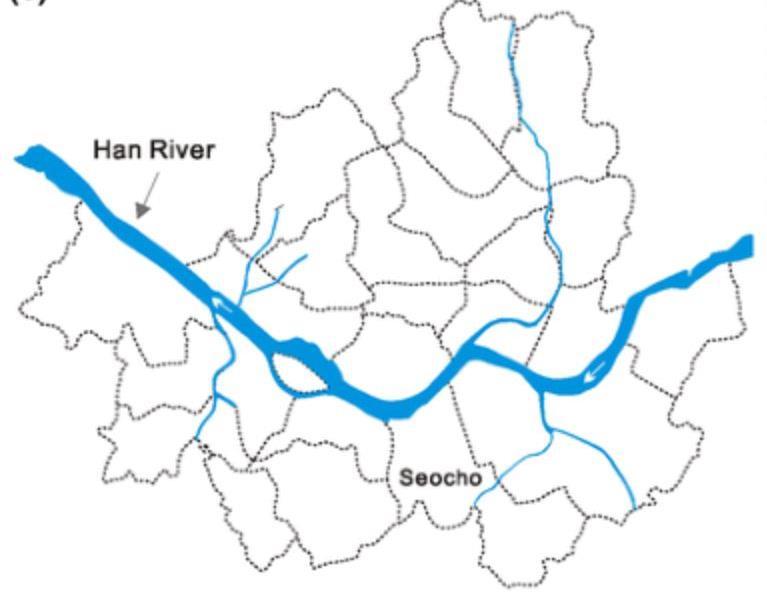
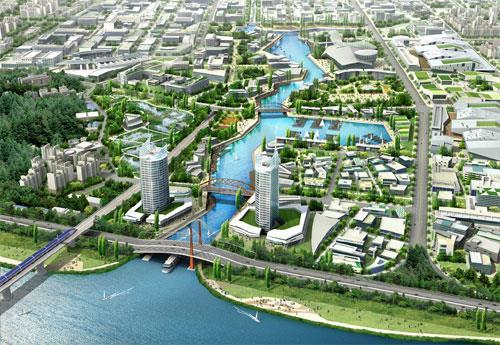
the city government conducted the Han River Renaissance Project. It has greatly contributed to recovering the river by planting trees and creating an attractive habitat for many flora and fauna


a scientific river operation system which links the rivers in the connecting watersheds was constructed by K-water. This included a Hydro Intelligent Toolkit (K-HIT) to provide an ICT-led integrated water management system
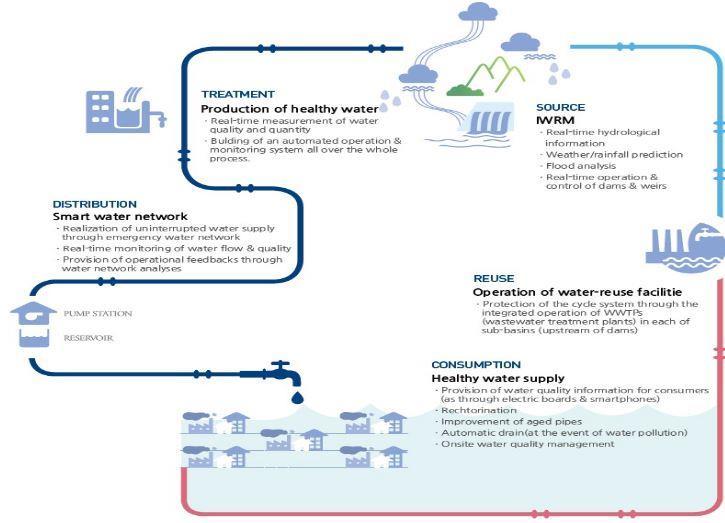
hydrological data acquisition
precipitation forecasting flood analysis reservoir water supply generation

provide a more resilient and efficient water supply system, reducing costs and improving sustainability. High-technology solutions for the water sector include digital meters and sensors, supervisory control and data acquisition (SCADA) systems, and geographic information systems (GIS).

PROBLEM IN MUMBAI
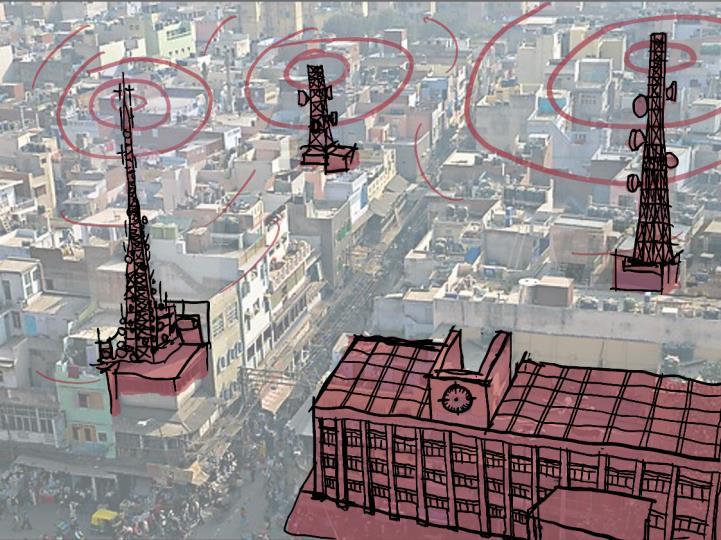
• Insufficient water supply
• Flooding
SOLUTION FROM SEOUL
• Implement smart water management(swm) to become a smart water city
• Introducing hydro intelligent toolkit
IMPLEMENTATION OF SOLUTION
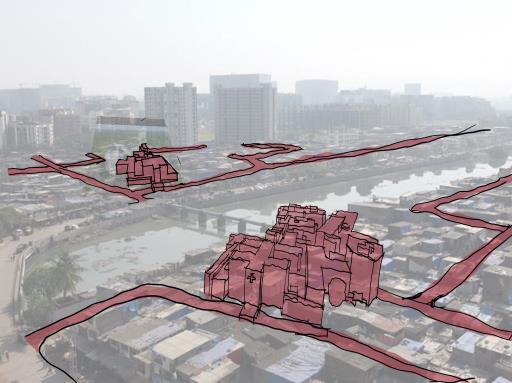
Before (Dharavi Mumbai)
PROBLEM IN MUMBAI
• Poor sanitation
• High water pollution Rate
• Water Leakage
SOLUTION FROM SEOUL
• Implementing Sewage treatment center
• Implement smart water management(swm) to become a smart water city
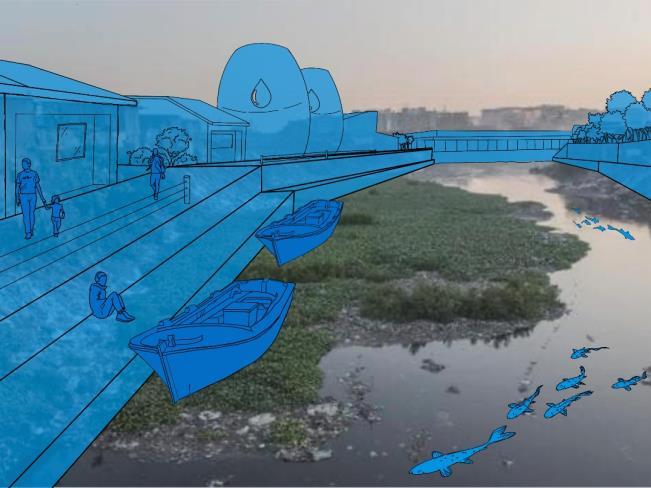
After (Dharavi Mumbai)
Implementing sewage treatment Plants
Implementing (SMW)
Household water waste
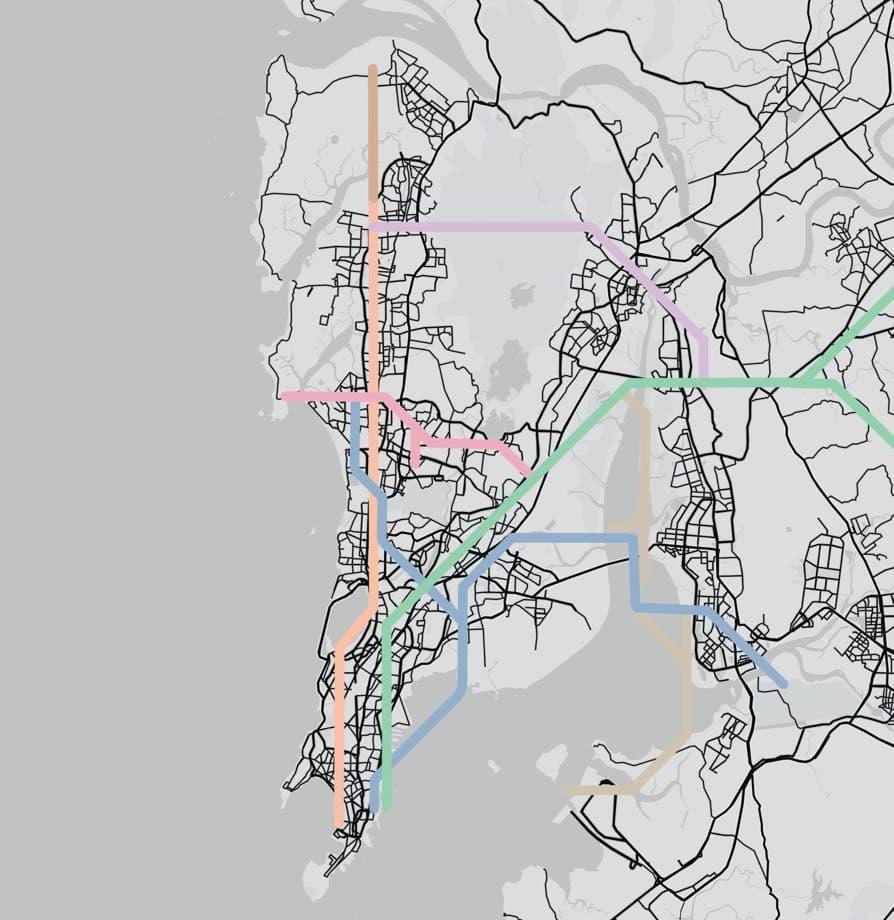
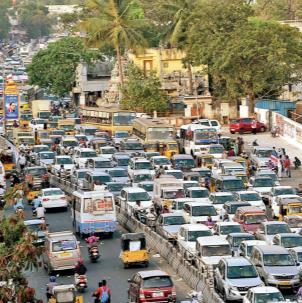
Mumbai is the hub for the Western and Central railways trains from the city carry goods and passengers to all parts of the country. Mumbai’s public transport system consists of;
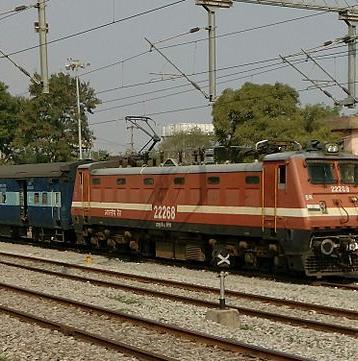
• 8 million commuters use the 2900 trains
• Congested to almost four times the network’s capacity during peak hours
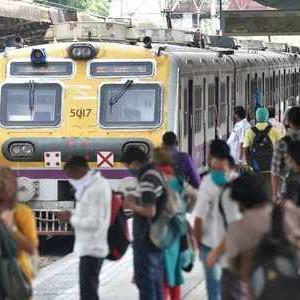
• Suburban electric train systems provide the main public transportation
• rail system • private taxis
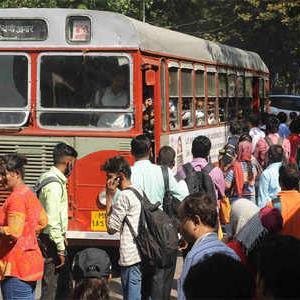
• public bus system

• autorickshaws

Most locals use bicycles and walk to work or run their errands. The most popular mode of public transportation is the rail.
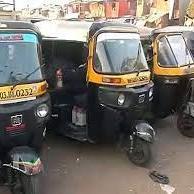
• With over 200,000 autorickshaws, Mumbai has the highest number of autorickshaws in India
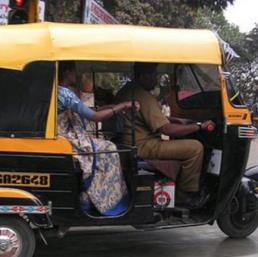
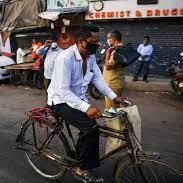
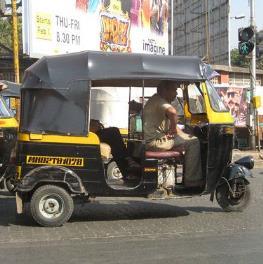
• Operating hours are 10 hours per day
• mainly carries locals to work
• 98% use compressed natural gas
• 2% use petrol
• Became popular as it was a faster way to travel compared to tramcars
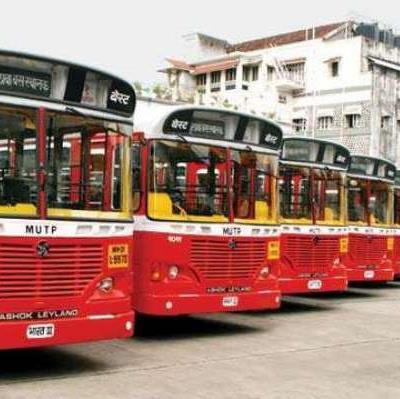
• BEST (Brihanmumbai Electric Supply & Transport) has been one of the major modes of transportation in Mumbai since they added new fleets of buses in the earlier years
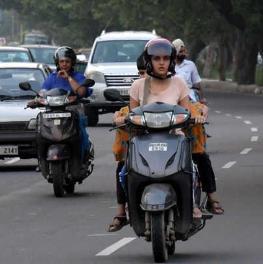
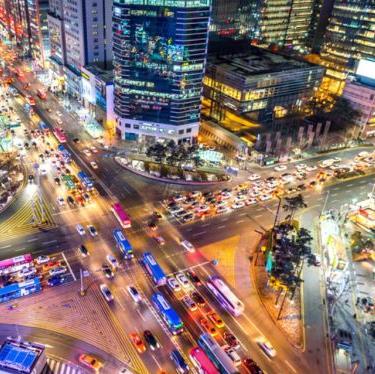
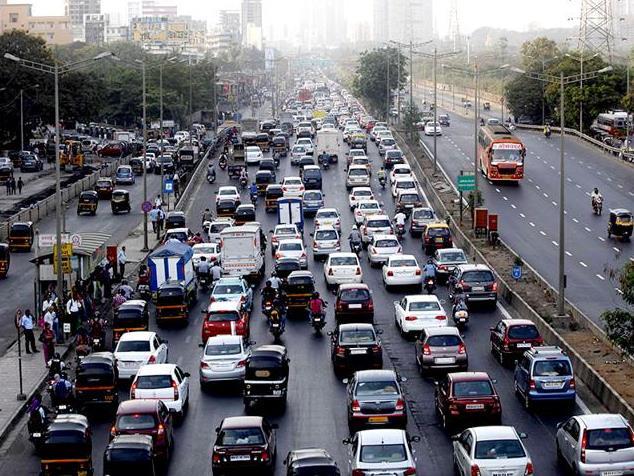
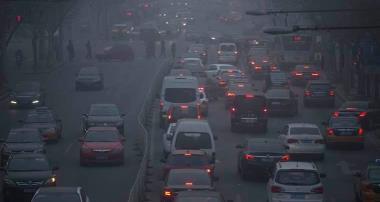
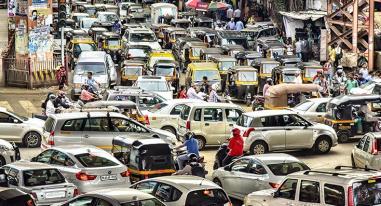
• Mumbai has been among the world’s most polluted megacities for years
• The road space share of private vehicles in the city has gone up from 59% to 77% in two decades.
• The road space share of buses have gone down from 6.2% to 2.2%.

• 15% of the city’s roads are occupied by public transport including autorickshaws, buses and taxis
• Numerous taxi services have been in use in Mumbai over the years

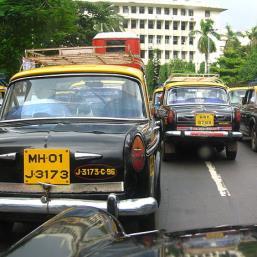
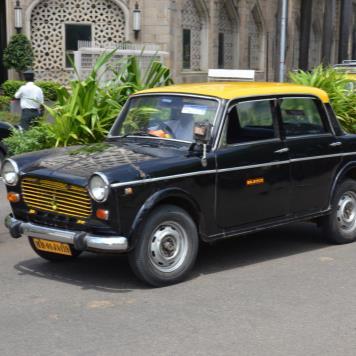
• Cab service apps have recently been introduced
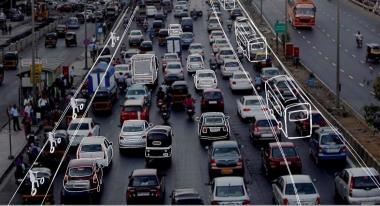
Vehicular emissions have become the biggest contributor to Mumbai’s poor air quality, leading to serious health issues as well
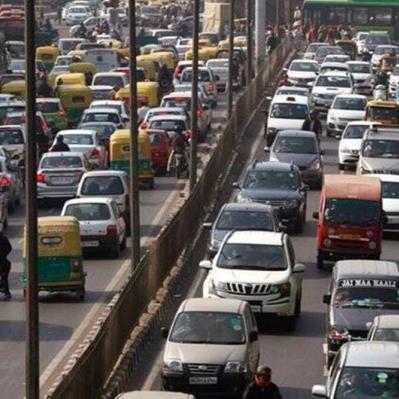
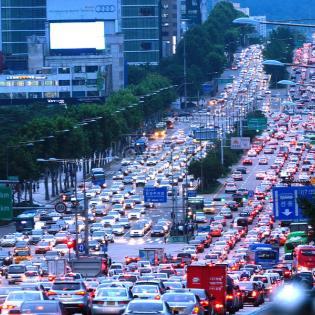
Traffic & Congestion: Lack of traffic signage and insufficient road lengths lead to heavy traffic on the streets of Mumbai
Atmospheric Pollution: Nitrogen Oxides (NOx) from roadside construction and traffic emissions are the main sources of pollution in Mumbai
Poorly Maintained Pedestrian Infrastructure: Accidents are prone to occur at intersections in Mumbai. Poorly developed pedestrian infrastructure is one of the main causes of road accidents in Mumbai
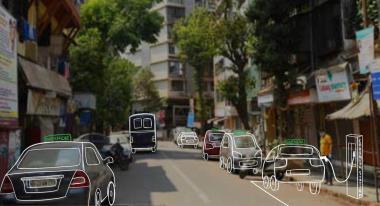
Petrol Pump Residential Commercial Industrial Traffic Intersection
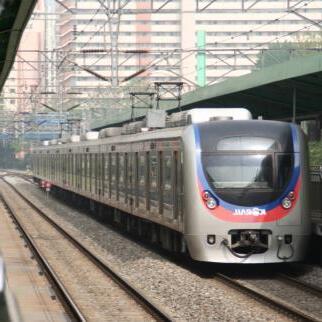
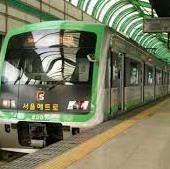
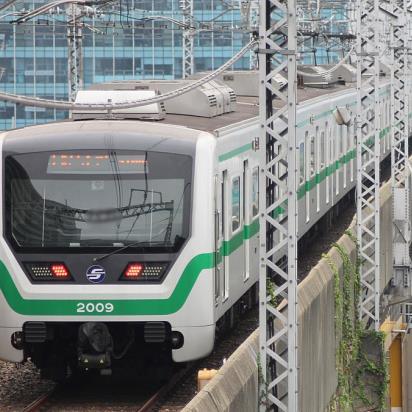
Seoul is the central point of railway lines connecting it with most provincial cities and ports. Seoul’s public transport system consists of:
• Metropolitan Subway System
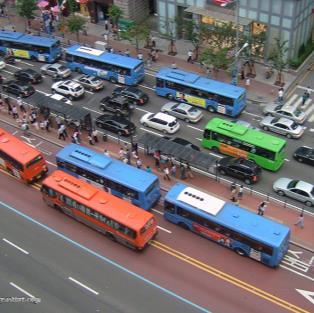
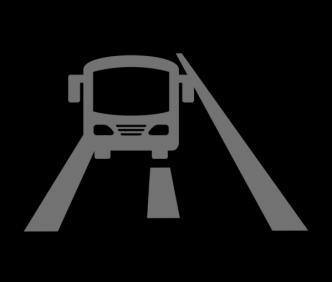
• Seoul’s bus service has become much faster since the exclusive median bus lane system was introduced
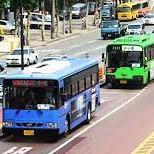
• The extensive bus network of Seoul consists of approximately 400 bus routes with 8,500 buses
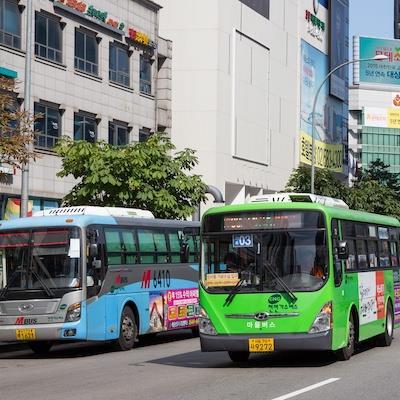
• The buses are divided into 4 categories and color-coded to help people easily identify them
• Buses

Blue Bus – Trunk Lines Green Bus – Feeder Lines Red Bus – Inter-regional Lines Yellow Bus – Circular Lines

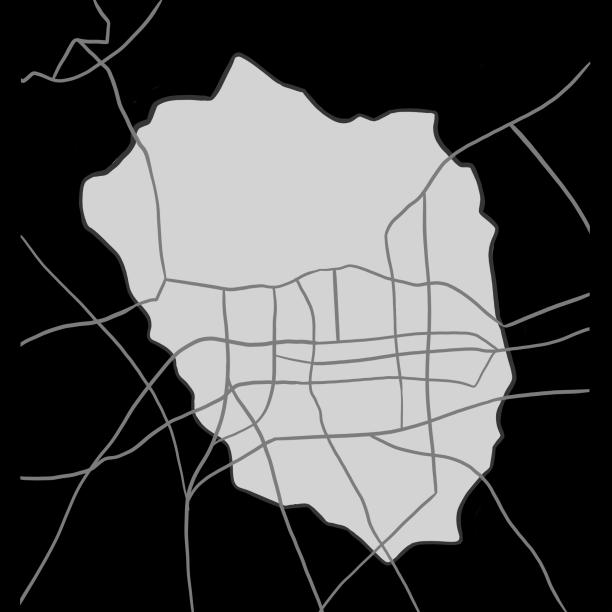


• The subway connects Seoul with the metropolitan areas
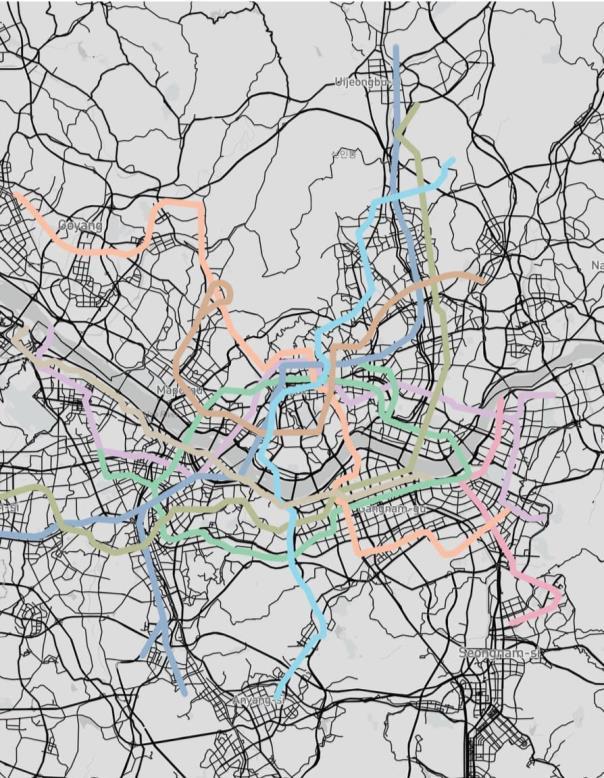
• The total length of the subway system is 965.5km with Seoul and Incheon government running 353.6km and the central government and private companies operating 611.9km
Reduced Planned
The South Korean government established air quality standards and ensured adequate maintenance of air quality in Seoul in order to:
• prevent the environmental damages
• promote public health
• create a comfortable living environment.
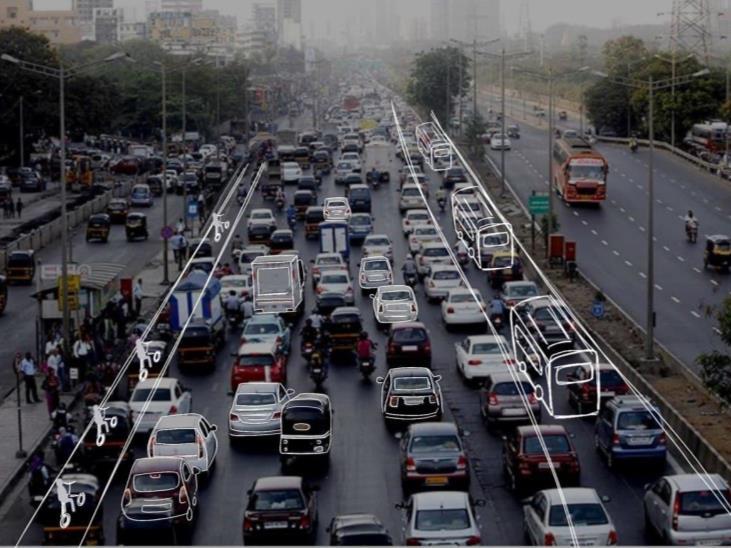
Seoul’s green transport zone
Designated Bus Lanes: The implementation of exclusive lanes for buses help with traffic congestion by avoiding vehicular conflicts.
• There are numerous taxis in Seoul, with cheaper fare prices in comparison to other megacities in the world

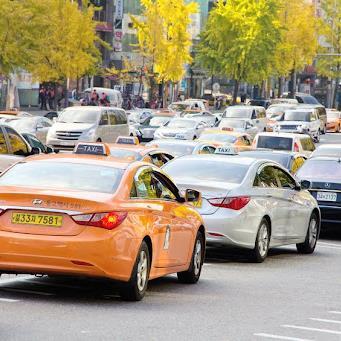
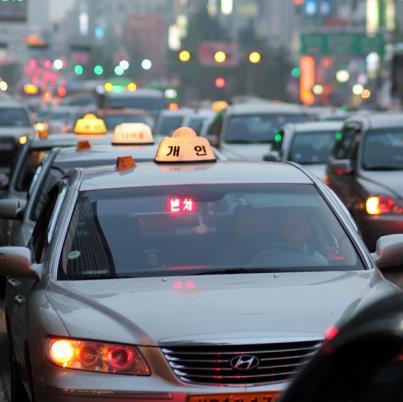
• Deluxe taxis are distinguished by their black and gold design. They’re about twice as expensive as standard cabs, and most locals see them as necessary only if no regular taxis are available.

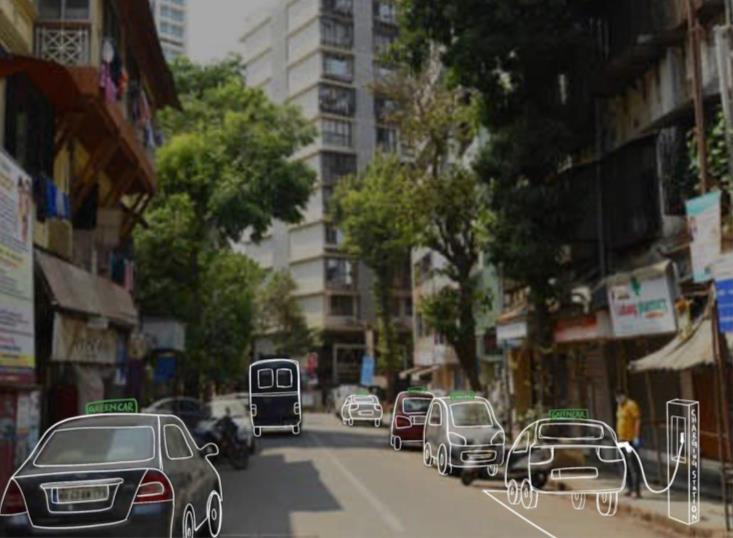
Emission Free Transportation: The transition from vehicles that use fossil fuels to electric vehicles will help reduce the city’s emission of greenhouse gases.
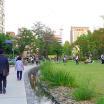
Wider Pedestrian Footpath: Wider pedestrian lanes improve walkability and provides a safer space for people to walk
ISSUE (MUMBAI)
• Traffic & Congestion
• Lack of traffic signage
• No designated bus/bike lanes
SOLUTION (SEOUL)
• Designated bus and bike lanes
• Track for cyclists, allowing pedestrians and children to use the area for recreational purposes
• Increase the frequency of the buses
• Improved traffic signage
IMPLEMENTATION OF SOLUTION
ISSUE (MUMBAI)
• Increase in vehicular emissions
• Environmental Impact
• Atmospheric Pollution
SOLUTION (SEOUL)
• Emission free transportation
• Use of electric bus stations
• Charging stations for electric vehicles
ISSUE (MUMBAI)
• Poorly Maintained Pedestrian Infrastructure
• Lack of footpath availability
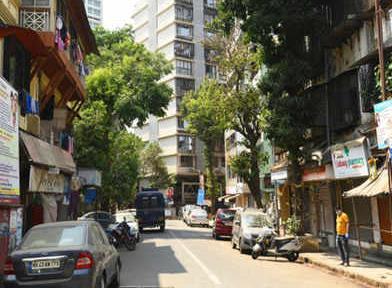
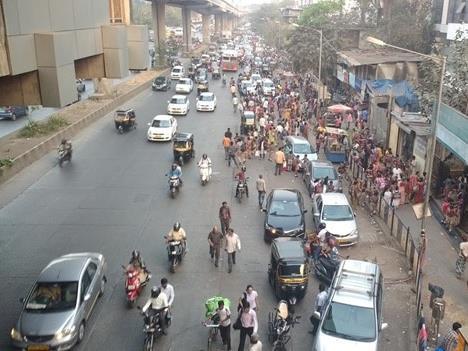
• Unshaded walkways
SOLUTION (SEOUL)
• Pedestrian walkways to allow people to take leisurely strolls
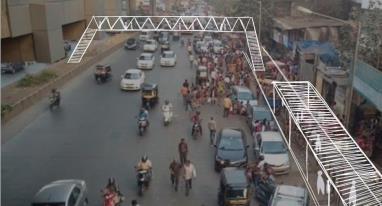
• Pedestrian overpass bridges ensure better safety for people to cross the streets
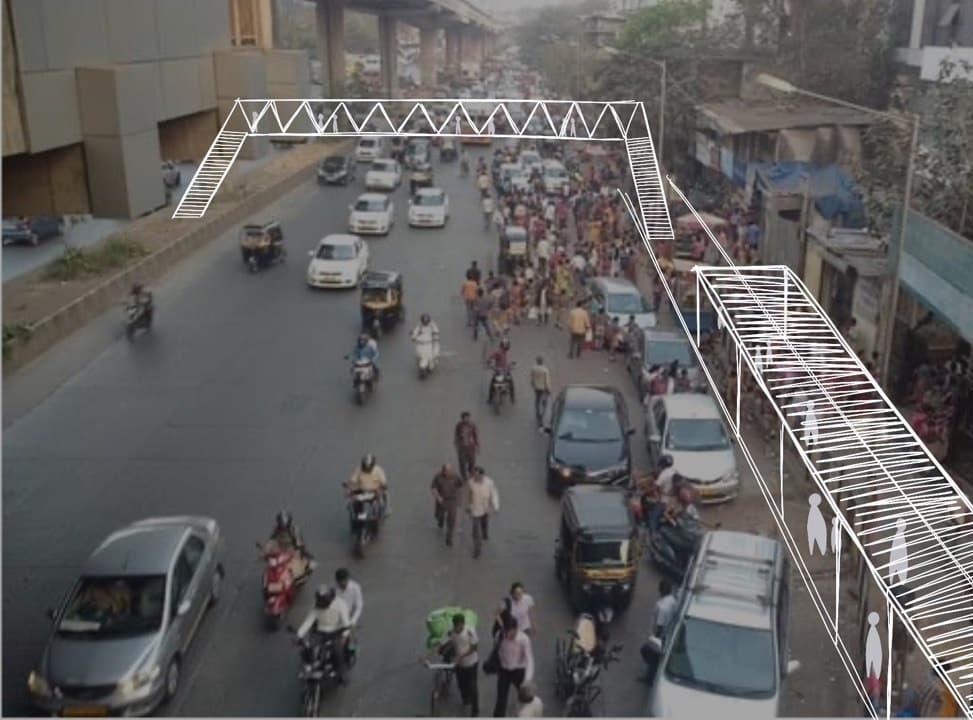
• Shaded pedestrian footpaths
IMPLEMENTATION OF SOLUTION
IMPLEMENTATION OF SOLUTION
Children missed school due to the pandemic

Implement free education & better internet coverage
Bad maintenance that leads to corrosion and landslide. Restoration of land to increase usable green spaces.
Low % of Indians have health coverage
Government subsidies and wider healthcare coverage.
Parks are Ill maintained with street harassment rampant.
Refurbishment and implementation of technology.
Traditional farming that is limited.
Hybrid farming for efficiency of crop farming.
Weak population policies
Introduction of contraceptives and educate the young.
Lack of green spaces that creates urban heat effect.

Parks within 10 min. walking distance to cool the city.
Insufficient water supply
Government should conduct a project which aims to improves community health, and water resources.
Lack of signage and designated lanes leading to traffic and congestion
Designated bus and bike lanes to avoid vehicular conflict
Poor sanitation and high water pollution rate
Promote hygiene education and behavior change communication strategy for risky hygiene behaviors.


Atmospheric pollution due to vehicular emissions
Emission free transportation to minimize the impact of vehicular pollution
Flooding
Implement water sewage treatment plants and smart water management system.


Poorly maintained pedestrian infrastructure increases chances of accidents
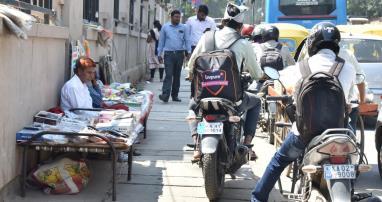
Wider pedestrian footpaths to provide safer space to walk on
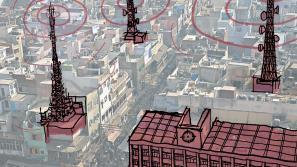
Red Infrastructure
1. (2021). Retrieved 4 October 2021, from https://happiness-report.s3.amazonaws.com/2020/WHR20.pdf
2. Data Warehouse - UNICEF DATA. (2021). Retrieved 4 October 2021, from https://data.unicef.org/resources/data_explorer/unicef_f/?ag=UNICEF&df=EDUCATION&ver=1.0&dq=PRK...ISCED11_2+ISCED11_3+ISCED11_02+ISCED11_01+ISCED11A_1+ISCED11A_2+ISCED11A_3+ISCED11A_4+AGG_2_3+AGG_0_1+AGG_3S_H+_T+ISC ED11A_0_G23+NSC+AGG_1T3+ISCED11A_0.Q4+Q3+Q2+Q1+Q5..&startPeriod=1970&endPeriod=2021
3. Guide to Health Insurance and Healthcare System in South Korea | InterNations GO. (2021). Retrieved 4 October 2021, from https://www.internations.org/go/moving-to-south-korea/healthcare
4. Home. (2021). Retrieved 4 October 2021, from https://www.oecd-ilibrary.org/sites/6e005d47-en/index.html?itemId=/content/component/6e005d47-en
5. India | Commonwealth Fund. (2021). Retrieved 4 October 2021, from https://www.commonwealthfund.org/international-health-policy-center/countries/india
6. invitado, A. (2021). Responding to COVID-19 in South Korea: Discovering Online Education as a Key for Future Education - Enfoque Educación. Retrieved 4 October 2021, from https://blogs.iadb.org/educacion/en/covid19southkorea/
7. Life, Q., & Indices, A. (2021). About Quality of Life Indices At This Website. Retrieved 4 October 2021, from https://www.numbeo.com/quality-of-life/indices_explained.jsp
8. Life, Q., & Korea, S. (2021). Quality of Life in Seoul. Retrieved 4 October 2021, from https://www.numbeo.com/quality-of-life/in/Seoul
9. Mumbai Population 2021 (Demographics, Maps, Graphs). (2021). Retrieved 4 October 2021, from https://worldpopulationreview.com/world-cities/mumbai-population
10. Mumbai’s suburbs top literacy ranking in state. (2021). Retrieved 4 October 2021, from https://www.hindustantimes.com/mumbai/mumbai-s-suburbs-top-literacy-ranking-in-state/story-qiCNUYX2RJsSnOb0HABviM.html
11. , A., & Korea…, P. (2021). Public libraries in South Korea increase to 1,134 nationwide in 2019. Retrieved 4 October 2021, from https://librarylearningspace.com/public-libraries-south-korea-increase-1134-nationwide-2019/
12. Prasad, P., Naraharisetty, R., Kalia, S., Rakshit, D., & Team, T. (2021). India's Literacy Rate Is Increasing, But The Male-Female Literacy Gap Isn't Closing. Retrieved 4 October 2021, from https://theswaddle.com/india-male-and-female-literacy-rate/
13. South Korea: population density by province 2020 | Statista. (2021). Retrieved 4 October 2021, from https://www.statista.com/statistics/1112322/south-korea-population-density-by-province/
14. Topic: Health care in South Korea. (2021). Retrieved 4 October 2021, from https://www.statista.com/topics/5598/health-care-in-south-korea/
15. Udas Mankikar, S. (2021). Formulating open-space policies for India’s cities: The case of Mumbai | ORF. Retrieved 4 October 2021, from https://www.orfonline.org/research/formulating-open-space-policies-for-indias-cities-the-case-of-mumbai-65007/
Green Infrastructure
1. Brand India. (n.d.). Retrieved from https://www.ibef.org/industry/indian-food-industry.aspx
2. Open Mumbai: Re-Envisioning Open Spaces. (n.d.). Retrieved from https://www.smartcitiesdive.com/ex/sustainablecitiescollective/open-mumbai-re-envisioning-city-and-its-open-spaces/171156/
3. Sriharsha Devulapalli, V. P. (2019, October 28). Which is India's greenest metro? Retrieved from https://www.livemint.com/news/india/which-is-india-s-greenest-metro-11572280645457.html
4. Published by L. Yoon, & 5, M. (2021, March 05). South Korea: Distribution of land area by category 2018. Retrieved from https://www.statista.com/statistics/1168069/south-korea-distribution-of-land-area-by-category/
5. Physical Features. (n.d.). Retrieved from https://allaboutseoul.weebly.com/physical-features.html
6. Seoul City to Open Three Urban Parks on Expanded Green Space -. (2017, March 21). Retrieved from http://english.seoul.go.kr/seoul-city-open-three-urban-parks-expanded-green-space/
7. (n.d.). Retrieved from https://www.novonordisk.com.cn/content/Global/AFFILIATE/cities-changing-diabetes/english/cities/seoul.html
Blue Infrastructure
1. (2021). Retrieved 5 October 2021, from http://watermanagement.ucdavis.edu/files/6313/8255/4520/05_Group_Final_Report_Scott_Bhardwaj_Ali_.pdf
2. (2021). Retrieved 5 October 2021, from https://www.safewaternetwork.org/sites/default/files/Safe%20Water%20Network_Mumbai%20City%20Report.pdf
3. (2021). Retrieved 5 October 2021, from http://indiaenvironmentportal.org.in/files/Water%20consumption%20patterns.pdf
4. (2021). Retrieved 5 October 2021, from https://www.metropolis.org/sites/default/files/seoul_tap_water_arisu_english.pdf
5. (2021). Retrieved 5 October 2021, from http://susa.or.kr/en/content/water-management?ckattempt=1
6. Land Use, Han River Basin, Seoul: Keeping Pace with Population Growth -. (2021). Retrieved 5 October 2021, from https://savethewater.org/lad-use-han-river-basin-seoul-keeping-pace-population-growth/
7. Revival of Han River by 2030 : Coexistence of Human and Nature. (2021). Retrieved 5 October 2021, from https://seoulsolution.kr/en/content/revival-han-river-2030-coexistence-human-and-nature
8. Sanitation Issues – Sustainable Sanitation in Mumbai. (2021). Retrieved 5 October 2021, from https://blogs.ubc.ca/sustainablesanitation/urban-sanitation-a-wicked-problem/
9. Sanitation planning for squatter settlements as urban water management in Mumbai. (2021). Retrieved 5 October 2021, from https://www.tandfonline.com/doi/abs/10.1080/1573062X.2018.1509100?journalCode=nurw20
10.Seoul tap water arisu. (2021). Retrieved 5 October 2021, from https://www.slideshare.net/simrc/seoul-tap-water-arisu
11.Seoul’s Flood Control Policy. (2021). Retrieved 5 October 2021, from https://seoulsolution.kr/en/content/seoul%E2%80%99s-flood-control-policy
12.South Korea’s Experience with Smart Infrastructure Services: Smart Water Management | Publications. (2021). Retrieved 5 October 2021, from https://publications.iadb.org/publications/english/document/South-Koreas-Experience-with-Smart-InfrastructureServices-Smart-Water-Management.pdf
13.Water Management Policy of the City of Seoul. (2021). Retrieved 5 October 2021, from https://www.seoulsolution.kr/en/node/3575
14.Water Quality & Solutions in Dharavi, Mumbai. (2021). Retrieved 5 October 2021, from https://www.slideshare.net/WaterWalla/water-quality-solutions-in-dharavi-mumbai
Grey Infrastructure
1. Retrieved 4 October 2021, from https://core.ac.uk/download/pdf/51177913.pdf
2. Retrieved 4 October 2021, from https://www.metropolis.org/sites/default/files/seoul_public_transportation_english.pdf
3. Foundation, P. (2020). Bringing sustainability to Mumbai's urban planning starts with ensuring fair access to basic infrastructure-India News Firstpost. Retrieved 4 October 2021, from https://www.firstpost.com/india/bringing-sustainability-to-urban-planning-inmumbai-begins-with-ensuring-equity-in-access-to-basic-infrastructure-8988231.html
4. Koh, J. (2017). Transition from the Vehicle-oriented City to the Pedestrian-friendly City. Retrieved 4 October 2021, from https://seoulsolution.kr/en/content/6307
5. Mumbai. (2021). Retrieved 4 October 2021, from https://sites.ontariotechu.ca/sustainabilitytoday/urban-and-energy-systems/sustainable-development/sustainability-status/mumbai.php
6. Mumbai Set To Become a Sustainable City in 3 Years | Sustainability Next. (2017). Retrieved 4 October 2021, from https://sustainabilitynext.in/mumbai-set-to-become-a-sustainable-city-in-3-years/
7. Pimputkar, S. (2019). 5 ways to make Mumbai more environment friendly. Retrieved 4 October 2021, from https://www.freepressjournal.in/cmcm/5-ways-to-make-mumbai-more-environment-friendly
8. Raghavan, C. (2021). Mumbai - Transportation. Retrieved 4 October 2021, from https://www.britannica.com/place/Mumbai/Transportation
9. Transportation. Retrieved 4 October 2021, from https://english.visitseoul.net/transportation
10.Varshney, M. (2018). Mumbai Transportation System Transformation | IGLUS. Retrieved 4 October 2021, from https://iglus.org/mumbai-transportation-system-transformation/
11.World Environment Day: 10 environmental problems that affect Mumbai. (2015). Retrieved 4 October 2021, from https://www.hindustantimes.com/mumbai/world-environment-day-10-environmental-problems-that-affect-mumbai/storyE1txmRXU7wGieA6Qe63cML.html