
Yasin Delavar
University of Florida
Amirhossein Delavar
Shahid Beheshti University
Kianoush Suzanchi
Tarbiat Modares University
Karla Saldaña Ochoa
University of Florida
Yasin Delavar
University of Florida
Amirhossein Delavar
Shahid Beheshti University
Kianoush Suzanchi
Tarbiat Modares University
Karla Saldaña Ochoa
University of Florida
Urbanization destroys green areas, prompting the need for eco-friendly policies. This study proposes “GreenPlotter,” an algorithm that combines low-carbon design and artificial intelligence (AI) for sustainable urban development. The study introduces carbon sequestration in trees as a green measurable factor in automated land development. Integrating size, access, fixed facilities, and carbon of land at the urban block scale, GreenPlotter uses genetic algorithms to optimize proposed design solutions for road access networks and land partitioning. The results of the low-carbon design scenario options proved the algorithm’s success in generating greener solutions. This article demonstrates that AI implementation has accelerated the design process while effectively incorporating carbon stored in trees as a measurable parameter that responds to a low-carbon design approach.
Keywords: Intelligent Land Partitioning, Sustainable Development, Low-Carbon Design, Genetic Algorithm, Artificial Intelligence, Generative Design, Carbon Sequestration, Urban Planning, Decision Support Systems, Urban Green Areas
1. Introduction
Our study proposes an innovative approach to carbon mapping, leveraging AI tools to quantify the carbon storage capacity of green areas, thus informing land partitioning decisions. Central to this approach is developing a “carbon degree map,” a raster-based representation of land carbon values. This map utilizes an RGB color coding system to assign values to trees based on their carbon storage capacity, thereby integrating a measurable green factor into decision-making processes. Our primary objective is to estimate the environmental impact of development projects, particularly in green regions. We developed the 'GreenPlotter,' an algorithm implement in Python to achieve these goals for eco-friendly urban planning. The GreenPlotter algorithm analyzes RGB bitmap images (maps) to generate land development maps (RGB images), considering factors such as land size, accessibility, fixed facilities, and carbon storage. Comprising two core modules—Road Creation and Land Partitioning—the algorithm optimizes urban development while minimizing carbon footprint and preserving green spaces.
Preliminary results indicate the efficacy of the low-carbon mode, demonstrating reductions in road construction volume and the preservation of larger parcels while satisfying other developmental requirements. This method could promote sustainable urban development practices that prioritize environmental conservation and minimize ecological impact.
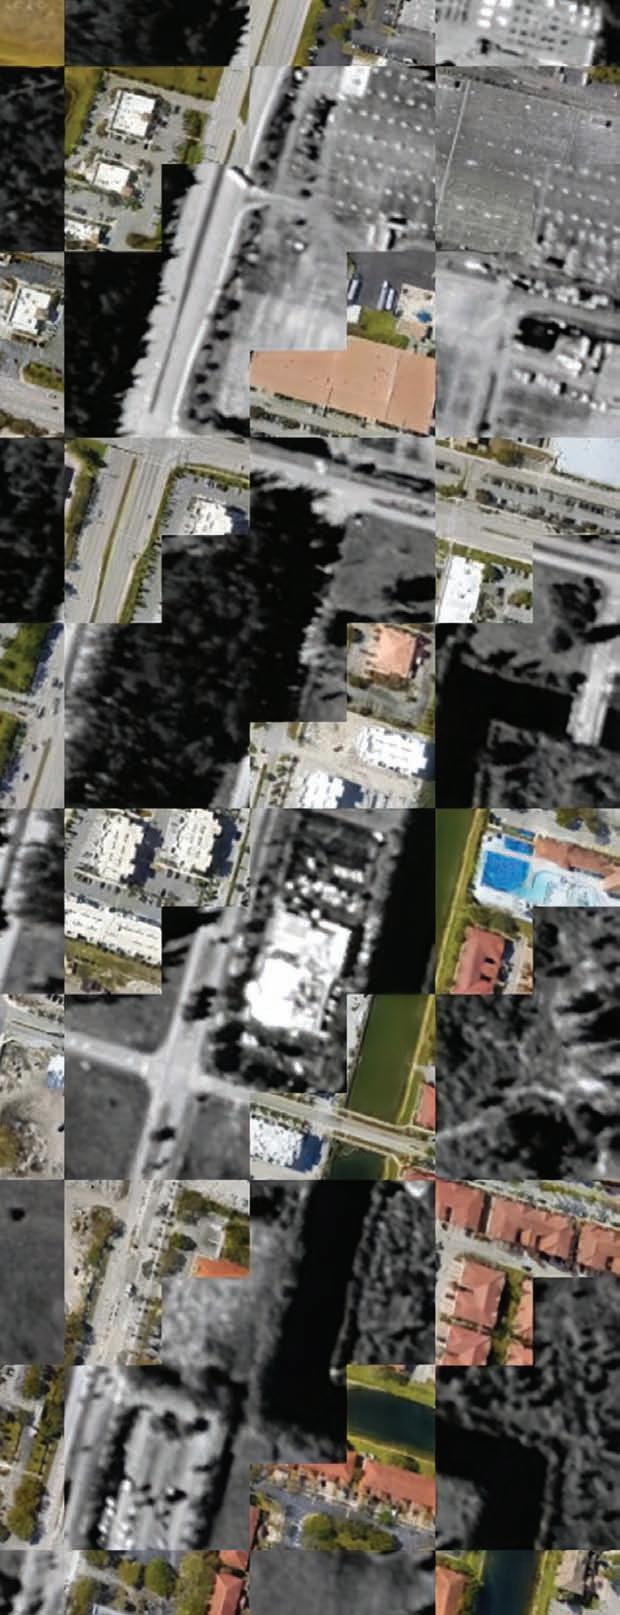
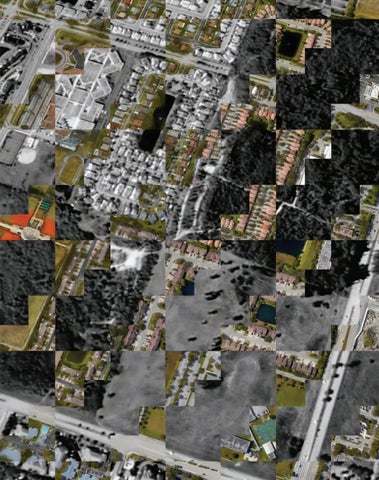
An assessment of global urbanization over the past few decades reveals that despite aiming for policies to preserve green space addressing conservation and development of urban areas, the existing urban development regulations largely failed to achieve these goals (Baycan-Levent and Nijkamp 2009). This failure led to the destruction of ecological spaces, with many green areas disappearing due to fragmentation and division. This trend happens in various cities worldwide, including Accra, Ghana’s capital city (Puplampu and Boafo 2021); Istanbul, Turkey, where the construction of a third airport destroyed thousands of hectares of forested land (Karacor and Korshid 2015); Jakarta, Indonesia, where rice fields are being converted into urban district (Rustiadi et al. 2021); Mumbai, India, where natural mangroves are disappearing (Hindustan Times 2017); Houston, US, where wetlands are destroyed (Khan 2005); and Tehran, Iran, where Kan gardens are deforested (Figure 1).
Understanding the intricacies of urbanization necessitates an examination of the multifaceted forces shaping cities and contemporary urban planning practices. Urban development is influenced by a multitude of factors, including market dynamics, governmental policies, sociocultural influences, zoning regulations, accessibility to services, and demographic trends (Boujari et al. 2024; Delavar et al. in press). The growing
recognition of this necessity, coupled with the advancing capabilities of computational design tools, has spurred researchers to explore innovative approaches to addressing urban planning issues’ complex and multiobjective nature. A subsequent section elaborates on this discussion.
Researchers conclude that the underlying causes of the loss of urban green areas stem from inadequate codes regarding environmental considerations in urban planning and management (Baycan-Levent and Nijkamp 2009). Just as building codes establish constraints, environmental limitations are a form of coding for land development. Historically, urban planners prioritized the growing population, economic activities, and car-centric design, often at the expense of ecological integrity—which later invites contemporary practices to prioritize sustainability, social equity, and mixed-use development (Zagow 2020). This shifting trend will benefit society and pave the way for architects to contribute more effectively to sustainable development by integrating green infrastructure into their designs.
Land partitioning is typically followed by site selection for facility construction. In this stage, designers consider principles like building orientation and earthwork efficiency, proximity to utilities, etc., to define proper spots in the land to construct the building. Eco-friendly land partitioning and ecological assessment beforehand will enable the designer to implement passive heating and cooling strategies into the design. Moreover, it allows designers to minimize excessive digging or filling, material transport, fuel consumption, etc., which saves costs, protects the environment, and speeds up construction while both functional and environmentally responsible.
Since the advent of computer programs emulating drawing techniques, computer-aided design (CAD) tools have been an integral part of design professions. Computer-aided design uses computer programs with graphical user interfaces to model geometric objects. The former requires designers to have programming and coding skills as a new type of literacy (Guo 2021). Using CAD in the design space offers two approaches: the logistics-based approach (rule-based or expert system approach) and the probabilistic-based approach. The logisticsbased approach uses a set of rules and logical reasoning to make decisions, which design experts in a particular field create based on their knowledge and experience (Burry & Burry 2010). The probabilistic-based approach uses data as an underlying reference for prediction; examples of this approach are Machine Learning algorithms (Guo 2021). This approach learns patterns from data and uses probability distributions to model the relationship between the learned data and the design outcomes. It generates many potential design solutions, each with a different probability of success, and can be used to identify the most likely solution (Ochoa 2021).
Regarding the current land development trend, tree clearance is a common research focus. However, it is understood that tree removal may be an inevitable consequence of partitioning and development. In such situations, estimating the amount of destruction can be critical. With digital mapping, data analytics, AI, and Machine Learning, previously hidden ecological factors can now be explored, parametrized, and integrated into urban design (Tehrani et al. 2024).

while providing a semiautomated solution, may require manual adjustments and lacks optimization features. Additionally, the complexity of algorithms like Parcel-Divider by Dahal and Chow (2014) may require some advanced coding knowledge for users.
Computational design approaches to land partitioning have been studied in urban and agricultural contexts. These studies aim to translate variables into code language by parameterizing the forces that shape land division. The integration of CAD and land partitioning initially focused on automating urban land development, later shifting towards optimizing the process with more studies on agricultural subjects.
Despite recent efforts towards eco-friendly practices in agricultural land partitioning, there remains a noticeable lack of integration of green parameters in urban studies. Additionally, while the logistics-based approach dominates the field, there is a research gap regarding the probabilistic approach to this issue. The following sections delve into greater detail by discussing the mechanisms, pros, and cons of reviewed models. Furthermore, we highlight the research gap, demonstrating the novelty of this study within the existing body of knowledge.
Initially, automated models aimed to streamline land partitioning for both urban and agricultural development. These models, implemented within Geographic Information Systems (GIS), parameterized factors like land value, size, and shape to generate subdivision layouts. For instance, Wakchaure (2001) introduced a tool for parcel-scale layouts, simplifying lot and street arrangements. Similarly, Stevens et al. (2007) developed an algorithm for urban block subdivisions based on development levels, increasing efficiency and consistency in urban planning. Wickramasuriya et al. (2011) further advanced this field by seeking to optimize partitioning to minimize resource consumption and maximize land utility ( Table 1).
However, while these automated models offer considerable benefits, they are not without limitations. Wakchaure’s tool,
Recent studies focus on optimization models. The ALP-GA algorithm by Hakli and Harun (2017) exemplifies this trend by streamlining the subdivision process for agricultural lands through automated parcel division based on user-defined criteria. However, a fundamental limitation of this approach is the primary focus on urban design factors, overlooking crucial agricultural considerations, such as soil quality and irrigation needs. Addressing this concern, the MOABC-LP algorithm by Bijandi et al. (2021) adopts a holistic approach, integrating multiple agricultural factors into its optimization framework and recognizing the need for sustainable land management. However, this approach introduces additional complexities and raises questions about balancing ecological concerns and land allocation decisions.
While recent optimization models have made significant progress, they often lack a direct method for assessing the environmental impact of land development decisions. Furthermore, their emphasis on agricultural factors limits their applicability to urban land partitioning contexts. The present study bridges this critical gap by introducing a novel tool called the “carbon degree map.” This map, created using GreenPlotter, offers a way to quantify the ecological value of land and can seamlessly integrate into existing computational models. By incorporating this mapping approach, land planners can make more informed decisions, prioritizing areas with lower ecological value for development and thereby minimizing the environmental footprint of projects.
The increased levels of atmospheric CO 2 and other greenhouse gases (GHGs) have caused the Earth’s temperature to rise by absorbing specific wavelengths of radiation in the atmosphere, as evidenced by research (Graedel and Crutzen 1989; Hamburg et al. 1997). Trees are considered carbon sinks
Table 1. Comparing automated land partitioning and development models. Model
Wakchaure (2001) Size Shape
Road accessibility
Stevens et al. (2007): i-City Growth rate Proximity score
Wickramasuriya et al. (2011) Shape Size
Demetriou et al. (2012b): LandParcelS (2012) Size Shape
Land value
Road accessibility
Dahal & Chow (2014): Parcel-Divider Shape Size
Hakli et al. (2016) Size Shape
Land value
Road accessibility
Hakli & Harun (2017) Size Shape
Land value
Road accessibility
Bijandi et al. (2021) Size Shape
Road accessibility Irrigation efficiency Topology
a: Green Factor
b: Urban Land Partitioning
c: Thiessen Polygon
d: Genetic Algorithms
Rectangular Grid Layout
High/Mid/Low Density Urban Development Scenarios
Rectangular Grid Layout
Common Urban Development Layouts
ArcGIS Visual Basic.NET C++ Java Python
e: Binary Search
f: Delaunay Triangulation
g: Agriculture Land Partitioning
h: Artificial Bee Colony Algorithm
because they store carbon in their biomass during growth, which can help reduce atmospheric carbon dioxide. In addition, carbon sinks both inside and outside city boundaries have been suggested as a means of mitigating their global GHG impacts, making the importance of this characteristic for cities more significant (Dhakal 2010; Shigeto et al. 2012; Lazarus et al. 2013; Paloheimo and Salmi 2013).
Carbon storage in urban forest ecosystems comprises three components: vegetation carbon storage, soil carbon storage, and litter carbon storage (Sun and Liu 2020). This review focuses on the methods used to estimate vegetation carbon storage levels. Three basic types of estimation methods have been identified: inventory-based, satellite-based, and process-based (Piao et al. 2009).
Inventory-based estimation methods utilize regional forest inventory data, including forest types, stand age, stand density,
stand volume, mean tree height, and diameter at breast height, to estimate vegetation carbon storage in forest ecosystems (DBH) (Tang et al. 2018). These methods have been widely utilized to calculate carbon accumulation within forest ecosystems, as demonstrated by studies such as Fang et al. (1998), Fang et al. (2001), and Jia et al. (2016). The Forest Service developed a model of such methods, the UFORE (Urban FORest Effects), to assess the urban forest structure in five cities in the United States. To manually calculate the carbon stored in a tree, UFORE-C uses allometric equations derived from the literature by Nowak and Crane (2000).
Satellite-based estimation methods have become an alternative means of quantifying forest aboveground biomass/ carbon storage. This approach involves the use of modern technologies such as remote sensing (RS), geographic information systems (GIS), and global positioning systems (GPS) to

designing can develop outputs regarding carbon damage and less destructive solutions.
collect multisource remote sensing data at different scales (Wulder et al. 2012). The datasets used for estimating vegetation carbon storage include optical remote sensing data, synthetic aperture radar satellite data (SAR), and Light Detection and Ranging data (LiDAR) (Sun and Liu 2020).
Process-based estimation methods are divided into two main types: geostatistical modeling and mechanism modeling. Geostatistical modeling combines forest inventory data with topography, elevation, slope, aspect, and other environmental factors to construct statistical models to estimate forest biomass at regional scales using geostatistical methods. Mechanism modeling can be used to quantitatively describe the process of the forest carbon cycle and estimate forest carbon storage (Chen 2004; Sun and Liu 2020).
It should be noted that the accuracy of models used to measure carbon storage in trees may be subject to debate, and gathering enough data for a specific site can be a time-intensive process. However, this study does not address the potential factors that contribute to the carbon footprint of land development, nor does it explore methods for quantifying those factors. As a result, the authors suggest that researchers investigate additional carbon benefits associated with land partitioning and development and numerical methods for measuring them.
4.1
The critical contribution of the present study is to introduce the measurement of carbon stored in trees as a quantifiable green parameter in land partitioning and sustainable development. This research proposes a “carbon degree map” as a way of carbon mapping as part of a low-carbon design approach. The authors argue that using this map while planning and before
Trees must first be classified based on the amount of carbon they store to create a carbon degree map, ranging from lowest to highest. Projected values within a predefined narrower range avoid large numbers in the calculations. A bitmap image is used where the green pixels with integer values ranging from 0 to 255 represent the input values for the trees. Here, 1 for the green pixels signifies trees with insignificant carbon storage, while 255 denotes the highest carbon storage (Figure 2).
5. GreenPlotter: Methodology
This study proposes GreenPlotter as an approach to a low-carbon intelligent land development system. By considering size, access, fixed facilities, and carbon as the input variables on the scale of the urban blocks, GreenPlotter not only evaluates prepared designs but allows designers to generate predesign plans quickly. Through two main modules, Road Creation and Land Partitioning, there is a semi/fully automated land development process. Genetic algorithms optimize the program’s efficacy in terms of time and produce less ecologically destructive designs.
In GreenPlotter, the proposed intelligent land development system, the level of design and evaluation is defined on the urban block scale in which the position of fixed facilities and trees, as well as the accessibility of streets, are known. Intelligent urban development models can involve many variables. Still, the possibility of indexing carbon sequestration of trees as a green factor is examined for the first time in the present study. The input materials are interpreted into a bitmap in PNG format to allow for variables. The input map object consists of borders, access to roads, a carbon degree map, and fixed facilities (e.g., buildings, walls, orchards, glasshouses) in pixelated shapes in RGB bitmap images.

5.1 Input Preprocessing
The chosen block map is converted into an RGB bitmap image to allow input data preprocessing. One pixel represents one square meter in the real world, and the integer RGB values define the objects. As blue pixels (0,0,255) demonstrate the boundary of the block, the green ones distinguish the existing trees based on their carbon value (0,0–255,0). Red colors (255,0,0) are the indicators of roads or streets. Fixed facilities or the prior built structures in the block are also displayed in black color (0, 0, 0). In addition, some boundaries might also be considered as the access to blocks; in this case, the pixels must be shown in magenta color (255,0,255) (Figure 2).
5.2 Architecture of the Algorithm
The GreenPlotter is divided into two general modules: Road Creation and Land Partitioning (Figure 3).
5.2.1 Road Creation Module
The Road Creation module decides how the access network is placed in a block so that each subdivision has adequate size and access. Besides a fully automated process of generating streets, the Road Creation module allows the designer to draw and modify the access network wherever required. In the automatic mode of the module (axis finding architecture), setting an axis on the input map object aims to halve and access creation. For this purpose, the pixel space within the input map object is searched for the fittest axis calculated by Equation 1. The generated parts turn to map objects, and the process repeats until they can no longer be split (indivisible map objects). The inputs and outputs of the steps are:
Inputs : Preprocessed Map Object (output of input preprocessing step), designer choice of Architecture (Axis Finding or Customized).
Outputs : Indivisible map objects, i.e., subdivision of the block from the Road Creation Module (Figure 4).

Equation 1. Road creation fitness score.
Where carbon-fitness represents the loss tree in collision with roads, fixed-facilities-fitness, as a condition, scores zero on the streets intersecting with fixed facilities, area-split-fitness, and access-split-fitness equalizes the size and access to the road of generated maps, respectively.
The collision algorithm, used in carbon and fixed facilities fitness, has a safe pixel distance restriction; for example, a road must be 1 pixel away from the trees. Otherwise, a collision occurs. The mentioned safe distance is configurable ( Table 4).
In the Land Partitioning module, the generated map objects (indivisible maps) are linearly partitioned into a defined range of sizes on the longitudinal axis. Then the produced parcels are categorized based on size. The inputs and outputs of this step are as follows:
Inputs : Indivisible Maps, N (desired Number of Parcels), and Parcel Size categories.
Outputs : Categorized Parcel Maps (Figure 5).
A genetic algorithm is implemented to search for the fittest point on the longitude axis line of the map object. The perpendicular lines on found points suggest the parcel division lines. The genetic algorithm fitness function of the Land Partitioning module is:
(2)

Equation 2. Land partitioning fitness score.
Where the carbon-fitness represents the loss tree in the step, fixed-facilities-fitness as a condition again, and finally, area-split-fitness equalizes the size of the generated parcel.
The Land Partitioning module divides the generated maps from the previous step into a desired number of parcels. The module may run multiple times since the number of generated parcels may differ from the desired number. In case of infeasibility, the program continues by reducing the parcel number of the program ( Table 5).


This study aimed to evaluate the carbon parameter indexing of trees in land partitioning and development. To achieve this, we developed an algorithm called GreenPlotter, which runs on a MacBook Air 2020 with M1 SOC and 8 GB of RAM. The study tested and analyzed various division scenarios in a hypothetical land to investigate how it responds to the low-carbon design mode (Table 2). For this purpose, an urban green block with hypothetical properties was drawn. Then its characteristics were translated into an RGB bitmap image as input for the program. The trapezoidal-shaped block is 8055 m2 (86703.3 ft.2), connected to the city access network from the southeast and surrounding 141 trees and three fixed facilities (Figure 2).
Once the number and size of the parcels, as well as the width and rate of accessibility, are determined, the GreenPlotter will be ready to run. In the present framework, 12 parcels in four types of sizes (C: 300–400; B: 400–500; A: 500–700; and Oversize: 700 and above) have been defined as appropriate outcomes.
The program’s fitness functions produced varying solutions in different modes, with the carbon parameter coefficient ranging from 0 to 9. Given the presence of genetic algorithms and the possibility of mutations, each mode was tested more than twice. From the tested modes, two were selected for comparison in this study. Twenty development maps were chosen (Figure 6), each with a completion time of less than 12 seconds ( Table 3). Their coefficients in the fitness function were fixed to mitigate the effect of other dependent variables (area, access, and fixed facilities). Additionally, to facilitate a better comparison between the results, the value of trees must be kept constant, and the point of entry into the block must be manually determined in the Road Creation module. Results show the program successfully generated ecologically sustainable solutions in both phases. This finding is supported by the fact that the number of trees cut down decreased significantly from the first solution (21 trees) to the last solution (one tree).
Success is attributed to two factors. First, in the Road Creation section, the program prioritized the carbon parameter, leading to a decrease in the generated area of the access network. This change indicates that the program responded logically to the low-carbon design objective by reducing the volume
of construction (Figure 7 ). Second, in the Land Partitioning section, results indicate that increasing the weight of carbon results in fewer parcels but larger ones. This trend suggests the logic behind the low-carbon intelligent system of partitioning is to decrease parcelization and conserve land in larger sizes.
Upon closer inspection, the results of the Road Creation section reveal an inverse relationship between the weight of the carbon parameter and the area of the generated access network. In the first six tests, the ratio of the occupied area by generated streets to the free area of the block ranged from 10.3% to 13.4%. However, in the seventh test, where the carbon coefficient was set to 3, this ratio reached its lowest point of 9.5%. While the ratio increased by 3.7% in a repeated test, it returned to the minimum point. It remained constant even when the weight of the carbon parameter coefficient was increased in subsequent tests (as shown in Table 2). Therefore, it can be concluded that the program effectively responded to the lowcarbon design mode by reducing the access network area and preserving the maximum number of trees.
As the carbon parameter weight increased, the program produced a smaller number of larger parcels. While the downward trend in tree cutting is evident from the output comparisons, the trade-off is the generation of larger but fewer parcels. The results from Table 2 show that when the carbon coefficient is zero, 14.2% of the trees are cut down. However, when the coefficient is increased to 4 in the 9th test, the amount of damage decreases to 0.7% and remains constant. In contrast, the number of parcels in the first eight tests met the favorable input number of 12. However, when transitioning to a low-carbon design, parcels declined to 8–9 in. (20.32–22.86 cm) in subsequent tests, with oversized parcels (O) generated more frequently than other types.
By crafting a “carbon degree map,” the algorithm showcases its ability to produce design options with reduced ecological impact. This result represents a noteworthy advancement in reshaping urban planning methods, offering designers, urban planners, and policymakers valuable information to prioritize eco-friendly development endeavors. Our research highlights the fusion of digital mapping and AI technologies to introduce a carbon metric as a fresh influence in shaping urban environments.
Table 2. GreenPlotter algorithm results.
Road Creation
Input: indivisible maps (subdivisions of the block from road routing), N (estimated number of parcels), and parcel size categories.
Output: categorized parcel maps (Land Partitioning)

of the process, particularly in the agricultural context. This study aims to contribute to the body of knowledge by introducing measurable green parameters into urban land partitioning.
Urban land partitioning involves navigating various factors, including market forces, regulations, and social dynamics, making it a complex decision-making process. Designers and planners need help in preparing land partitioning and development maps due to the many parameters and qualitative aspects involved. Consequently, solutions may vary for each scenario, posing difficulties in finding the most optimal solution. However, the quantifiable aspects of this issue provide researchers with a framework for formulating the urban land partitioning process. Furthermore, acknowledging deforestation as a long-term consequence of urbanization highlights the importance of quantifying the value of green areas in the design control process. We advocate for leveraging artificial intelligence to automate a significant portion of design control operations, potentially saving time and minimizing ecological disruptions. While existing literature on intelligent land partitioning systems supports this assertion, ongoing debate surrounds their effectiveness in environmental preservation.
While existing research on intelligent land partitioning systems has demonstrably streamlined the process, a critical gap exists regarding neglecting ecological considerations. These studies aim to translate variables into code language by parameterizing the forces influencing land division. Initially, the integration of CAD and land partitioning primarily focused on streamlining urban land development, later transitioning towards optimization
Motivated by advancements in digital mapping, data analytics, AI, and machine learning, our study proposes an innovative approach to carbon mapping that quantifies carbon storage capacity in land and informs land partitioning decisions. Central to this is the “carbon degree map,” which assigns values to trees based on carbon storage, integrating measurable green factors into decision-making for accurate environmental impact estimations, particularly in green regions.
To test this newly introduced green variable, a Python code algorithm called GreenPlotter was developed to generate urban plans in green areas. The program consists of two main modules: Road Creation and Land Partitioning. These modules incorporate parameters such as carbon sequestration, land size, accessibility, and existing facilities to guide the partitioning process. Results indicate that the low-carbon mode of the program functions effectively. During the suggested access network and partitioning, the program generated less ecologically disruptive solutions, preserving more trees. The low-carbon mode in the Road Creation section resulted in a reduction of the road construction volume. In contrast, the Land Partitioning module responded by generating fewer parcels and preserving land in larger sizes.
In conclusion, our study illustrates integrating digital mapping and AI tools to introduce a carbon parameter as a novel force shaping urban landscapes. By creating a “carbon degree map,”

our algorithm demonstrates the potential to generate design options with less ecological disruption. This approach marks a significant step towards transforming urban planning practices, as designers, urban planners, and policymakers can utilize such informational maps to prioritize environmentally sustainable development initiatives.
Future research endeavors should focus on assessing the scalability and adaptability of the carbon degree map across diverse urban contexts. While our study addresses explicitly the carbon footprint of tree cutting in land development, exploring other carbon footprints associated with land partitioning remains necessary. Additionally, incorporating numerical and intelligent methods can effectively enhance the quantification and analysis of these footprints.
One of the limitations of GreenPlotter architecture in land partitioning is that it is grid-based. Additional study will improve the applicability of informative maps like the “carbon degree map.” Future studies could benefit from integrating socioeconomic spatial metrics into their analyses, offering a more comprehensive understanding of the environmental impacts of urban development. Challenges such as limited data availability and the time-consuming nature of accurate carbon storage mapping should be addressed in future studies. Furthermore, considering the limitations of a raster-based approach, researchers could investigate the potential of a vector-based approach to address these issues.
Acknowledgements
The data supporting this study’s findings are available from the corresponding author, Y. Delavar, upon reasonable request.
References
Baycan-Levent, T. and P. Nijkamp. 2009. “Planning and Management of Urban Green Spaces in Europe: Comparative Analysis.” Journal of Urban Planning and Development 135:1: 1–12.
Bijandi, M., M. Karimi, B. F. Bansouleh, and W. van der Knaap. 2021. “Agricultural Land Partitioning Model Based on Irrigation Efficiency Using a Multi-objective Artificial
v Figure 7. Comparison of accessibility and cut ratio in suggested solutions.
Bee Colony Algorithm.” Transactions in GIS 25: 551–74.
Boujari, P., Ghamar, S., Nasirian, M., Ghapanchian, F., Khajavi, M., Qasemi, A., Bahari, M., Delavar, Y., & Garrousi, H. 2024. A scoping review of urban design and planning studies on the Covid-19 pandemic and elements of the built environment. TeMA-Journal of Land Use, Mobility and Environment, 17(2), 309–337. https://doi.org/10.6093/1970-9870/10427
Burry, J. and M. Burry. 2010. The New Mathematics of Architecture. London: Thames & Hudson.
Chen J, Brosofske KD, Noormets A, Crow TR, Bresee MK, LeMoine JM, Euskirchen ES, Mather SV, Zheng D. 2004 Aworking framework for quantifying carbon sequestration indisturbed land mosaics. Environmental Management 33:S210–S221. https://doi.org/10.1007/s00267-003-9131-4.
Dahal, K. R. and T. E. Chow. 2014. “A GIS Toolset for Automated Partitioning of Urban Lands.” Environmental Modelling & Software 55: 222–34.
Delavar, Y., Gamble, S., & Ochoa, K.S. 2025. Past, present, and future perspectives on the integration of AI into walkability assessment tools: A systematic review. Urban Planning, 10(Issue in press). https://doi.org/10.17645/up.8518
Demetriou, D., J. Stillwell, and L. See. 2012. “LandParcelS: A Module for Automated Land Partitioning.” School of Geography, University of Leeds.
Demetriou, D., L. See, and J. Stillwell. 2014. “Integrating GIS and Genetic Algorithms for Automating Land Partitioning.” Second International Conference on Remote Sensing and Geoinformation of the Environment (RSCy2014) 9229, 40–48. SPIE.
Dhakal, S. 2010. “GHG Emissions from Urbanization and Opportunities for Urban Carbon Mitigation.” Current Opinion in Environmental Sustainability 2:4: 277–83.
Fang, J. Y., Wang, G. G., Liu, G. H., & Xu, S. L. 1998. Forest biomass of China: an estimate based on the biomass–volume relationship. Ecological Applications, 8(4), 1084-1091. DOI: 10.2307/2640963.
Fang, J., A. Chen, C. Peng, S. Zhao, and L. Ci. 2001. Changes in Forest Biomass Carbon Storage in China between 1949 and 1998. Science, 292 (5525), 2320-2322.
Graedel, T. E. and P. J. Crutzen. 1989. “The Changing Atmosphere.” Scientific American 2613: 58–69.
Guo, Z. 2021. “From Simulation to Synthesis: Architectural Modeling with Context-Based Encoding Using Data-Driven Computational Machines.” Doctoral dissertation, ETH Zurich.
Hakli, H. and U. Ğ. U. Z. Harun. 2017. “A Novel Approach for Automated Land Partitioning Using Genetic Algorithm.” Expert Systems with Applications 82: 10–18.
Haklı, H., H. Uğuz, and T. Çay. 2016. “A New Approach for Automating Land Partitioning Using Binary Search and Delaunay Triangulation.” Computers and Electronics in Agriculture 125: 129–36.
Hamburg, S. P., Harris, N., Jaeger, K., Karl, T. R., McFarland, M., & Mitchell, J. F. 1997. Common questions about climate change. United Nations Environment Programme. World Meteorological Organization.
Jia, X., Zha, T., Gong, J., Wang, B., Zhang, Y., Wu, B., Qin, S. and Peltola, H., 2016. "Carbon and water exchange over a temperate semi-arid shrubland during three years of contrasting precipitation and soil moisture patterns." Agricultural and Forest Meteorology, 228:120-129. https://doi.org/10.1016/j.agrformet.2016.07.007.
Karacor, E. and D. Korshid. 2015. “Projected Environmental Effects of the Third Airport in Istanbul.” Journal of Food, Agriculture & Environment 13:2: 223–27.
Khan, S. D. 2005. “Urban Development and Flooding in Houston Texas, Inferences from Remote Sensing Data using Neural Network Technique.” Environmental Geology 47: 1120-1127.
Lazarus, M., C. Chandler, and P. Erickson. 2013. “A Core Framework and Scenario for Deep GHG Reductions at the City Scale.” Energy Policy 57: 563–74.
Nowak, D. J., & Crane, D. E. 2000. The Urban Forest Effects (UFORE) model: Quantifying urban forest structure and functions. In M. Hansen & T. Burk (Eds.), Integrated tools for natural resources inventories in the twenty-first century (pp. 714–720). U.S. Department of Agriculture, Forest Service, North Central Forest Experiment Station.
Ochoa, K.S. 2021. “Event Protocol: Enhancing Disaster Response with Architectonic Capabilities by Leveraging Machine and Human Intelligence Interplay.” Doctoral dissertation, ETH Zurich.
Paloheimo, E. and O. Salmi. 2013. “Evaluating the Carbon Emissions of the Low Carbon City: A Novel Approach for Consumer Based Allocation.” Cities 30: 233–39.
Piao, S., Fang, J., Ciais, P., Peylin, P., Huang, Y., Sitch, S., & Wang, T. 2009. The carbon balance of terrestrial ecosystems in China. Nature, 458(7241), 1009-1013.
Puplampu, D. A. and Y. A. Boafo. 2021. “Exploring the Impacts of Urban Expansion on Green Spaces Availability and Delivery of Ecosystem Services in the Accra Metropolis.” Environmental Challenges 5: 100283.
Rustiadi, E., A. E. Pravitasari, Y. Setiawan, S. P. Mulya, D. O. Pribadi, and N. Tsutsumida. 2021. “Impact of Continuous Jakarta Megacity Urban Expansion on the Formation of the Jakarta-Bandung Conurbation over the Rice Farm Regions.” Cities 111: 103000.
Shigeto, S., Y. Yamagata, R. Ii, M. Hidaka, and M. Horio. 2012. “An Easily Traceable Scenario for 80% CO2 Emission Reduction in Japan through the Final Consumption-based CO2 Emission Approach: A Case Study of Kyoto-City.” Applied Energy 90:1: 201–05.
Stevens, D., S. Dragicevic, and K. Rothley. 2007. “iCity: A GIS–CA Modelling Tool for Urban Planning and Decision Making.” Environmental Modelling & Software 22:6: 761–73.
Sun, W. and X. Liu. 2020. “Review on Carbon Storage Estimation of Forest Ecosystem and Applications in China.” Forest Ecosystems 7: 1–14.
Tang, X., X. Zhao, Y. Bai, Z. Tang, W. Wang, Y. Zhao…and G. Zhou. 2018. “Carbon Pools in China’s Terrestrial Ecosystems: New Estimates Based on an Intensive Field Survey.” Proceedings of the National Academy of Sciences, 115(16), 4021-4026.
Tehrani, A. A., Veisi, O., Delavar, Y., Bahrami, S., Sobhaninia, S., & Mehan, A. 2024. Predicting urban Heat Island in European cities: A comparative study of GRU, DNN, and ANN models using urban morphological variables. Urban Climate, 56, 102061. https://doi.org/10.1016/j.uclim.2024.10206
Wakchaure, A. S. 2001. An ArcView tool for simulating land subdivision for build out analysis (Master’s thesis). Virginia Tech. http://hdl.handle.net/10919/37156.
Wickramasuriya, R., L. A. Chisholm, M. Puotinen, N. Gill, and P. Klepeis. 2011. “An Automated Land Subdivision Tool for Urban and Regional Planning: Concepts, Implementation and Testing.” Environmental Modelling & Software 26:12: 1675–84.
Wulder, M. A., Coops, N. C., Roy, D. P., White, J. C., & Hermosilla, T. 2018. Land cover 2.0. International Journal of Remote Sensing, 39(12), 4254–4284. https://doi.org/10.1080/01431161.2018.1452075.
Zagow, M. 2020. “Does Mixed-use Development in the Metropolis Lead to Less Carbon Emissions?” Urban Climate 34: 100682.
Yasin Delavar is pursuing his PhD at the College of Design, Construction, and Planning, University of Florida, specializing in Digital Twins, Visualization, BIM, and Computational Design. His research focuses on leveraging digital technologies to enhance collaboration and communication during the design phase.
Amirhossein Delavar is a Machine Learning Engineer interested in ML real-world solutions to problems, especially time series, genetic algorithms, and machine vision. Currently working as a Team Leader to solve machine vision problems on an image streaming platform.
Kianoush Suzanchi is an Assistant Professor in the architecture department of Tarbiat Modares University in Tehran. He specializes in landscape architecture and urban green space design and planning. His last project was developing a comprehensive urban green space plan for the Tehran metropolis.
Karla Saldaña Ochoa is an Assistant Professor and Director of SHARE Lab at the University of Florida. She collaborates internationally, in Europe and South America, focusing on AI-human intelligence integration in architectural design and urban analysis. Karla holds a master’s in landscape architecture and a PhD in Technology in Architecture from ETH Zurich, specializing in disaster response.