Generative Design for Coastal Resilience: A Computational Approach to Living Shorelines
Michael A. Dieffenthaller1[0009 0008 3854 6451] , Karla Saldaña
Ochoa1[0000 0001 6092 4908] , Hallie S. Fischman2[0000 0002 1058 1078] , and Christine Angelini2[ [0000 0002 6669 5269]
1 University of Florida, School of Architecture, Gainesville, Florida 32611
2 University of Florida, Center for Coastal Solutions, Gainesville, Florida 32611 mdieffenthaller@ufl.edu
Abstract. This article presents a parametric modeling approach and computational methodologies to estimate nitrogen and carbon assimilation for living shoreline design iterations. We integrate nearby and parallel site-specific environmental data to establish foundational metrics for the dynamics of an oyster population. These metrics encompass parameters such as shell length, population density, and biomass calculations, which inform and correspond to nitrogen and carbon assimilation estimations. The model incorporates real-time design adjustments in the parametric relationships between the oyster castles and their estimated environmental impact. By analyzing and incorporating oyster proximities, density, count, and spacing of the various arrangements, the estimations of the environmental effects can be understood while simultaneously visualizing the designs on the site using the augmented reality lens. The ability to visually comprehend what a living shoreline might look like on a proposed site and to allow the user to sift through predetermined design options or to design their own can provide the community and stakeholders valuable insights into the impact of living shorelines, assisting in decision-making processes for coastal protection and restoration projects.
Keywords: Living Shorelines Parametric Design Computational Design Ecology Augmented Reality Generative Design Game Engine Coastal Resilience
1. Introduction
1.1. Living Shorelines in Practice
More than 1 billion people worldwide live within 10 km of the coast [1], placing them at increasing risk from the compounding threats of rising sea levels, storm surge, flooding, and erosion [2]. Traditionally, these risks have been addressed through the construction of coastal protection structures such as seawalls, dikes, jetties, and groins [3]. While these hardened defences provide critical protection during infrequent storm events, their long-term maintenance in the face of accelerating sea-level rise is projected to be economically unsustainable, with costs estimated at $12–71 billion annually
Dieffenthaller M, et. all 2
by 2100 [4]. Moreover, extensive shoreline hardening disrupts coastal ecosystem functions, negatively affecting biodiversity, nutrient cycling, and habitat connectivity [5,6]. These alterations diminish essential ecosystem services provided by coastal systems, such as carbon and nitrogen sequestration in nursery habitats, which are highly valued for their ecological and economic importance [7].
To address these challenges, coastal management is increasingly adopting nature-based solutions that harness coastal vegetation, sand, rock, or wood to deliver protection while preserving ecosystem services [8,9]. These strategies, often termed "living shorelines," enhance coastal habitats, either independently or in combination with minimal built, or grey, infrastructure, to mitigate erosion, attenuate waves, and create habitat [9,10]. Living shorelines can achieve levels of coastal protection comparable to traditional hardened structures while simultaneously supporting fisheries, sequestering carbon, and enhancing aesthetic value [8,11]. Additionally, they can adapt to changing conditions, such as rising seas, and naturally recover from disturbances [10,12], reducing long-term maintenance and repair costs. Due to these multifaceted benefits, coastal managers are designing and constructing living shorelines across a range of shoreline types around the world, with particular prevalence in salt marsh, mangrove, and oyster reef systems [9].
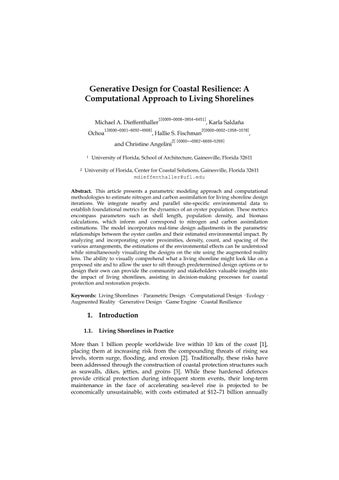
Given that living shorelines are commonly constructed along well-populated shorelines, it is often essential that diverse actors, from local community members, to regulators tasks with environmental permits to contractors tasked with installing them, are involved in the design process. In essence, living shorelines designs must be adaptable to fit project and stakeholder needs, a reality that can pose as a barrier to project implementation as significant pre-construction scoping, planning, and iterative designing is required [13]. With each site, there are unique and diverse environmental conditions that require careful consideration and adaptation in order to establish a living shoreline effectively [14,15] (see Fig. 1). Designers and planners often face challenges, including a limited toolset, for assessing ecological benefits, or impacts, or engaging stakeholders effectively with the designs they wish to understand and iterate [16,17,18]. These gaps highlight the need for new tools that merge science, data, design, and visualization with community interactivity and input.

Generative Design for Coastal Resilience: A Computational Approach to Living Shorelines
Fig. 1. Varying living designs implemented in Unreal Engine by curating specific vegetation types per site conditions.
1.2. Computational Approaches in Environmental Design
Computational tools, particularly parametric algorithms, have transformed how designers approach complex and diverse systems. The ability to simulate environmental conditions, such as water flow, vegetation, and relationships, makes these tools very suitable for decision-making that relies on informed and adaptable design proposals [19,20]. For example, parametric algorithms used in urban planning have helped optimize green infrastructure, offering insights that were previously unattainable or difficult to understand without proper education [21,22].
Despite these advancements, the potential parametric generative algorithms remain under explored for coastal design strategies, particularly living shorelines. These algorithms are beneficial for understanding and simulating coastal ecosystems as the dynamic interactions and site-specific data can be accounted for and linked in relationships that allow for the various conditions to affect the predicted outcomes. Platforms like Grasshopper and Unreal Engine provide unique opportunities to tailor visual models with data inputs and mathematical functions for living shorelines to the environmental data of the site. By integrating ecological and biogeochemical data directly into the design process and iterations, real-time simulations can be achieved that are both scientifically rooted and visually engaging (see Fig. 2). Providing numerical outputs to the environmental impact as well as sensorial understandings of the place [23,24].

Fig. 2. Preliminary Grasshopper control window and interface for Rhino to alter the parameters and change the oyster reef configuration as well as the environmental data output.
1.3. Key Challenges
The transition from conceptualization to implementation of living shorelines has many challenges that center around human engagement and understanding coastal strategies' effects. The divide between ecological complexity and design practicality requires that computational solutions address or acknowledge the following:
a) Dynamic Environmental and Anthropogenic Conditions: Coastal environments greatly vary and are affected by changes in salinity, sedimentation rates, tidal flows, wave intensity ,extreme weather conditions and human influence, such as nitrogen-based fertilizer runoff and pollution from industrial facilities or aging/insufficient water treatment infrastructure [14,22,25].
b) Scalability Across Sites: Different sites are suitable for different vegetation, oyster reef design, health, and maintenance. For example, one site that might allow for the growth of mangrove forests differs from a rocky coastline, which differs from marsh grass ecosystems [12,16,26 ]. The size of the site also changes the conditions and health of the shoreline.
c) Stakeholder Engagement: Coastal resilience is a community effort requiring various people from various backgrounds to meet on common grounds to achieve project goals [16]. However, this requires that the tools being used for community engagement must remain accessible to those without technical expertise. Intuitive visualization interfaces are beneficial for empowering policymakers, community leaders, and project teams to communicate effectively and make informed decisions [19,20,21].
These challenges present opportunities to optimize, collaborate, and redefine how we approach coastal shoreline management and resilience planning, leading to interdisciplinary projects that yield combinations of quality environmental data outputs and high-resolution visualizations uniting sensorial and experiential understanding and information-based outputs to comprehend the effects of decisions numerically.
1.4.
Problem Statement
Coastal environments face increasing threats from rising sea levels, erosion, extreme weather conditions, and anthropogenic activities. Traditional hard infrastructure, such as seawalls or rip-raps, provides immediate and lowmaintenance solutions to these challenges but disrupt natural habitats and often fail to adapt to dynamic environmental changes along many coastlines (see Fig. 3). These static structures can cause ecological degradation, leaving ecosystems and communities vulnerable over time [14,19,27-29], although there are recent efforts to integrate more ecological features in their design
Generative Design for Coastal Resilience: A Computational Approach to Living Shorelines [30].
Living shorelines are an alternative solution that combines artificial and natural materials to stabilize the shoreline while enhancing or preserving ecosystem services. Although there are advantages to the application and design of living shorelines, many challenges remain. One of them is designing a living shoreline accounting for environmental, aesthetic, and economic advantages since many of the established tools to design living shorelines are based on static catalogs and data tables with suggestions for plants and fauna based on pre-defined combinations. Therefore, traditional approaches to living shorelines design do not allow for an immersive approach to rapidly iterative and explore different configurations of plants, bivalves, or other living and non-living materials employed in the design may affect the site and what immediate benefits each may have. To solve this shortcoming and empower more inclusive and efficient engagement of diverse actors in living shorelines design, we propose to employ current methods that allow a combination of data on carbon and nitrogen assimilation and living shoreline visualization. In this research, we propose to use Computer Aided Architectural Design tools, such as parametric generative algorithms.
1.5. Objectives
This project introduces a parametric generative design tool for living shoreline design and implementation. Using parametric modeling, augmented reality (AR) visualization, and game engine software, the tool addresses critical gaps in scalability, adaptability, and stakeholder engagement, which is essential for community involvement, project commitment, and understanding [12,17,20,21], as well as future digital twin and environmental prediction and monitoring development [22]. To pilot the generative design tool, we focus on living shorelines constructed using oyster castles, i.e. interlocking concrete units that facilitate oyster recruitment,
Dieffenthaller M, et. all 6
although highlight that this framework can be extended to include other living (i.e. plants, animals such as bivalves) and non-living structures that promote plant or animal establishment, that may be used in living shorelines. Specifically, this study aims to:
• Develop a visual tool to quantify nitrogen and carbon assimilation estimations through oyster reef castle design simulations.
• Dynamically visualize design adjustments based on user input with high-quality imagery while providing estimations of the corresponding environmental impacts of the decisions.
• Enable community and non-technical stakeholders to interact with, understand, and evaluate shoreline designs and their impacts in real time.
1.6. Scope and Significance
This tool’s interdisciplinary approach combines generative design methodologies, environmental science, and digital visualization techniques to address three primary challenges:
1. Dynamic Integration: Combining real-time environmental data such as nearby salinity, oyster density, biomass, oyster length, and corresponding nitrogen and carbon assimilation with computational models that factor adjusting densities, distances, and weight and size averages to enhance the accuracy of the predicted environmental impact of the simulated designs [16,21,22].
2. Scalability: Develop the computational and parametric relationships within the models to be flexible and adjust and account for environmental changes that would occur across the various coastal ecosystems [15,17,19,25]. This would allow for the same level of simulation and visualization if a new site with varying environmental conditions was chosen for living-shoreline implementation.
3. Stakeholder Accessibility: Designing an augmented reality and desktop tool that is easy to use, intuitive interface that supports decision-making, visualization, and holistic understanding of environmental conditions and impacts of various living-shoreline designs for policymakers, local communities, and project teams. This is essential for project initiative, support, and accessibility for the visualization [16,18-21,26,31,32].
Generative Design for Coastal Resilience: A Computational Approach to Living Shorelines
This project and model align with broader efforts in coastal resilience by offering a scalable, adaptable, and scientifically informed method for livingshoreline design strategies [17,18,20-22,26]. Through project testing, this proposed tool has the potential to expand and transform living-shoreline planning and implementation for both the environmental teams and the communities and cities impacted by the decisions and changes.
2. Methodology
The methodology of this project develops a generative design tool for living shorelines that integrates environmental data and user input and alteration. Each design selection and alteration can assess the amount of nitrogen and carbon assimilation through high-quality visuals. Augmented reality allows these experiences to happen on-site, overlaying real conditions with the simulated ones.
2.1. Data Collection and Preprocessing
Designing effective living shorelines relies on a thorough collection of sitespecific data to provide and create accurate metrics for modeling and impact estimation. Major environmental conditions in the model include: water salinity, existing coastal edge conditions, estimated flood and water changes during rain and storm events, and water flow.
Data Collection: Data on oyster density, size, and carbon and nitrogen content was measured at nearby sites within the Guana Tolomato Matanzas National Estuarine Research Reserve (FDEP 2023) [33]. Oyster biomass was estimated across the range of densities and sizes, and carbon and nitrogen assimilation rates were calculated using oyster growth rates [33]. These values provided the foundation for the parametric relations established in the model.
Data Preprocess: The data was cleaned to standardize the raw inputs for parametric modeling use. As the oyster collection sites collect and record various environmental situations, not all data is applicable for future prediction modeling. After the environmental variables, such as salinity and tidal range, were examined, the design parameters such as oyster density, size, growth rate and associated carbon and nitrogen assimilation quantities were established for computational modeling.

Dieffenthaller M, et. all 8
Fig. 4. Parameters models and designed for the oyster castles that are embedded in Unreal Engine blueprints that contribute to the environmental impact calculations.
2.2. Parametric Framework Development
The initial design prototype was built in Grasshopper because of its flexibility and integration of modeling capabilities with data input. It was used to explore preliminary parametric relationships. The primary goal was the ability to dynamically change and iterate living shoreline conditions.
Generative Design Algorithms Parametric algorithms were designed to understand the effects of ecological spatial configurations. Each individual oyster castle recorded its location so that each model's spacing, proximity, and density to one another and their relations to elevation and the water could be factored in. The algorithms were parameterized to adapt to different shoreline conditions and designs (see Fig. 4). Oyster growth, biomass, and carbon and nitrogen assimilation were calculated using Fischman et al. 2025 [33]: Oyster length after over 1 year was of growth calculated as
(1) L1 = L 0 + (L i n f L 0 )* (1 e k )
Where L0 and L1 are oyster lengths before and after 1 year of growth, Linf is the maximum oyster length in the system (here, 158mm), and k is the universal growth constant (calculated as 0.518 +/- 0.359).
Oyster biomass initially and after a year of growth was calculated for shell and tissue as:
Bs = 0.2213*L + 1.14 Bt = 0.0104 * L 0.2854
(2) (3)
where Bs and Bt is oyster biomass in shell and tissue, respectively, L is oyster length.
Finally, oyster carbon and nitrogen assimilation were calculated as
(4) (5) At = Ct* ∆ Bt As = Cs* ∆ Bs
Where As and At is oyster assimilation of carbon or nitrogen in shell and tissue, respectively, Cs and Ct is the percent carbon or nitrogen in oyster shell and tissue, respectively, and and is the change in biomass of oyster shell and tissue, respectively.
Bs ∆ Bt
Generative Design for Coastal Resilience: A Computational Approach to Living Shorelines
Total assimilation across the estuary is the shell and tissue assimilation of a single oyster (Equations 4 and 5; As + At) multiplied across the total number of oysters.
The formulas translated as parametric relations in the tool were also left openended throughout the process to remain flexible so that future adaptations and iterations could easily integrate and refine the tool.
Interactive Features: The Grasshopper interface focused on adjustments to the oyster reef design and the ability for the user to design and cycle through iterations of living shoreline. Using a custom GhPython component, a minimap interface with buttons to simulate placing or painting was added to allow users to place vegetation and oysters on the site. The resultant estimated environmental impact, nitrogen and carbon assimilation was calculated, and outputted in the Grasshopper space. Early prototype visualizations of the oysters and vegetation were displayed in Rhino.
2.3. Transition to Unreal Engine
To obtain advanced visualizations, greater interactive features for users, and the augmented reality experience [34], the parametric models and early algorithms were translated into Unreal Engine 5. The use of the gaming engine transformed the parametric model into a more immersive simulation.
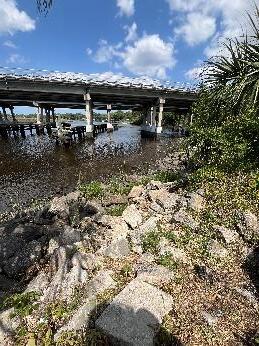
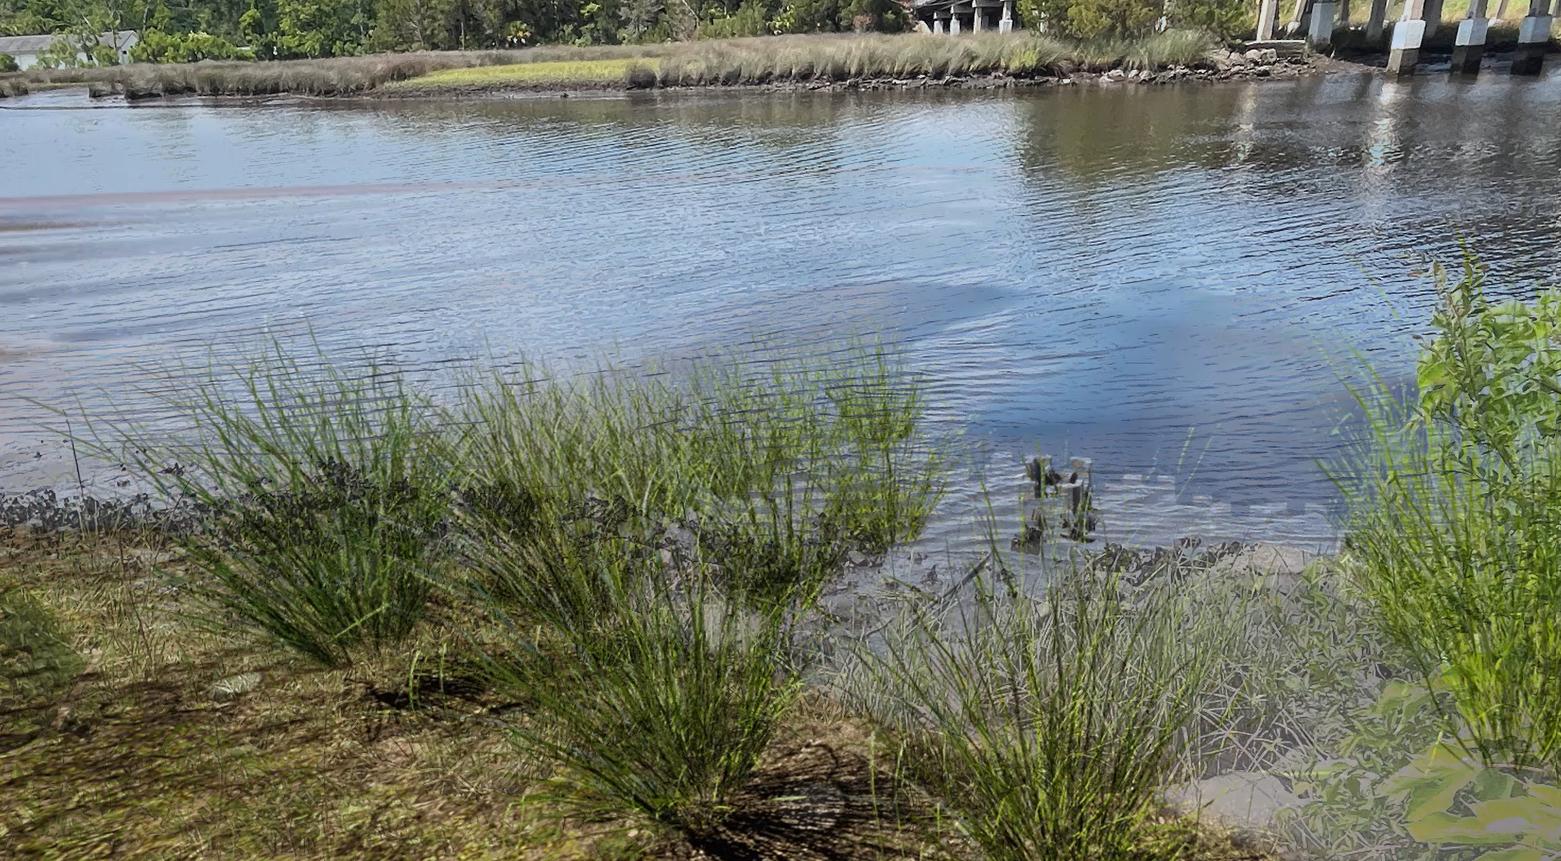
Visualization and AR Integration Unreal Engine allowed for high-resolution visualizations of living shoreline designs, including curating and designing models and materials for the oyster castles, detailed vegetation, and other park models assets such as park benches, hardscapes, and docks. Additionally, integrating AR features allows the stakeholders to digitally overlay the proposed living shoreline designs on the current shoreline on-site. This facilitates better spatial understanding and experiential qualities in the conversations between the stakeholders, community, and project team. The ability to realistically and accurately represent the shade, views, materiality, and water movement on-site enables greater informed decisions and the potential outcomes of those decisions (see Fig. 5).
User Interaction Multiple features were developed to enrich the interactive experience. Users would be able to load pre-designed living shorelines and its corresponding oyster nitrogen and carbon assimilation. The user could also design their own shoreline or alter one of the predesigned shorelines by adding their oyster castles and vegetation for visuals. Depending on where each oyster castle was located, the outputs, such as the nitrogen and carbon assimilation, would be updated in real-time through the parametric relations established in the model. Additionally, users can adjust sliders to see flooding on the site, which is based on historical flood recordings (see Fig. 6). The
Dieffenthaller M, et. all 10
ability to change layers and overlay the various information, as well as modify the design and receive immediate feedback gives the user the ability to understand, compare, and ask questions about the proposed project.

Fig. 5. Living shoreline selection showing vegetation used for the iterations (left), the AR visualization (right).
2.4. Environmental Impact Simulations
The tool integrates ecological impact assessments, with a focus on nitrogen and carbon assimilation estimations, into the design process. The primary goal of this project iteration was to provide quantitative and qualitative insights into the environmental impact of living on shorelines. To give users insight into nitrogen and carbon assimilation, shade, flooding, and aesthetic changes.
Assimilation Calculations Nitrogen and carbon removal rates were calculated using previously mentioned coefficients and formulaic parametric links that used locally collected oyster data such as biomass, length, density, and growth rates. Due to the linearity of the oyster length and biomass determining the nitrogen and carbon assimilation, as well as the data being obtained from nearby oyster sites, the accuracy of the simulation model still maintains legitimacy regarding its prediction. It is important to note, however, that the various dynamics that are present and affect oyster reefs along coastlines require caution that the current model output is not to be used for total accurate metric outputs of the living shorelines to be established on-site as the tool simplifies the conditions of the site. Additionally, oyster density and size were determined from a site in close proximity to the Ribault Scenic Drive park with similar salinity levels, and the growth rates were used from another nearby but further located site in the Guana River.
Generative Design for Coastal Resilience: A Computational Approach to Living Shorelines
Unreal Engine Layers To combine the different facets of the project, the environmental data, the model assets, and the parametric relationships, the Unreal Engine blueprints were organized into four primary groups: a) model assets, b) environmental data, c) parametric relationships and algorithms, d) user interface and interactivity.
The model assets group focused on processing the model assets created, such as the oyster castles, the park, park features, and environmental assets, such as the water, to maintain consistency and high-quality material visuals. Each model had to have blueprints associated with it so that the environmental data and parametric relationships could be linked individually and holistically.
The environmental data was separated and organized based on location so that after the raw data was cleaned and filled, it could remain replaceable with new data and understood individually. In Unreal Engine, there were individual groups for the data and blueprints to process specific data points used in the parametric formulas, referenced, and linked with the individual model assets. This included the resultant values from oyster density, length, and growth rates.
The parametric relationships focused on linking and processing further the environmental data, the user, the user location, the modeled assets, the model asset locations, the dynamic changes, the user inputs from the interactive features, and the handling of the corresponding adjustments that would occur from the user. The parametric relationships relied heavily on digital coordinate systems that are translated and correspond to the real-time geolocated coordinates. These coordinates were used to determine the model’s location, other models, and the site conditions, such as the water and elevation. These relationships helped determine the proximity and spacing of oyster castles, influencing the assimilation rates.
The last group developed was the user interactivity and interface. This is comprised of five major aspects. The first was blueprints that would create an overhead minimap of the site, allowing the user to see the site, their location, and the adjustments of the living shoreline in real-time—providing another perspective during the simulation (see Fig. 6). The next development was to translate the placing or paint feature developed from the early Grasshopper prototype so that users could place various oyster castles where they would like. The next feature was to have design options so that iterative base designs could be loaded in. Another feature was to ensure that the changes that would occur from the design options and the “painted” or placed oyster reefs would update and reflect the corresponding results of the changes as numerical quantities portrayed on the screen for the user to see with ease of understanding and access (see Fig. 6). While this paper focuses on the oyster modeling and development of the tool, other sliders were developed in parallel to control the tree growth to visualize aesthetics and changes in light,
Dieffenthaller M, et. all 12
as well as sliders to control water conditions that would correspond to flooding resulting from storms. Furthermore, these vegetation models were parametrically linked similarly to the oyster so when data become available the nitrogen and carbon assimilation of these placed models could also be portrayed.

Fig. 6 AR interface with models loaded and overlayed over the park, flooding conditions modeled and overlayed with the ground, as well as tree growth adjusted. Minimap, sliders, and environmental outputs are on the right side of the interface.
3. Results
The generative design tool can integrate real-time collected environmental data with prediction algorithms for estimated ecological data for various generative adaptive designs. In addition, this tool provides numerical outputs of the environmental impacts and ways for users, stakeholders, communities, and project teams to visualize and interact with the living shorelines.
3.1. Case Study or Scenario Planning
The tool was applied at the Ribault Scenic Drive Park in Jacksonville, Florida, in collaboration with the St. John’s Riverkeepers, a local nonprofit organization, as the park is undergoing restoration and improvements. This allowed for testing its potential as a scenario planning and decision-making tool.
Site Context This case study involved a shoreline characterized by brackish water, rocky edge conditions from existing rip-rap, and high nitrogen levels in the water [35-37]. Project goals included enhancing biodiversity on land and
Generative Design for Coastal Resilience: A Computational Approach to Living Shorelines
in the water, estimating assimilation quantities of carbon and nitrogen from the system, visualizing stabilized shorelines, and visualizing new community amenities such as fishing locations, shade, and better views.
Scenario Outcomes Nitrogen and carbon assimilation estimations by userinput oyster restoration units were determined from the amount of assimilation calculated from oyster growth and biomass estimations obtained from nearby oyster reef data monitoring and collecting sites. These were determined through the parametric relations that used proximity, density, and count and provided accurate averages and algorithmic relations.
Generative Design Outputs
Spatial Arrangements The tool allowed for preset oyster castle reef configurations to be selected as well as individually placed. Using parameters such as proximity, spacing, elevation, and density, the designs were able to be optimized visually, economically, and environmentally. The various iterations and ease of adjustability allow for determining maximum nitrogen and carbon assimilation while visualizing how it will change the views, access to water, and light in the park.
Dynamic Adjustments Parametric relationships within the models allow for real-time updates and testing, enabling the users to modify designs. The relationships and algorithms were designed to remain open-ended so that the inputs that are based on collected and available data, such as oyster biomass, growth rates, average oyster size and length, and the formula that determines the resultant nitrogen and carbon assimilation can easily be changed to accommodate for new sites and updates in data collected.
Visualization Capabilities
Augmented Reality Views Stakeholders, community members, and project teams can easily view and interact with digital models that convey highquality realistic visuals superimposed on the site. This allows for a greater comprehensive and immersive experience of the potential designs and how environmental conditions would affect the design, like flooding and light changes from growth over time.
Environmental Impact Previews Simulations displayed estimated nitrogen and carbon assimilation for each design iteration. Regions of flooding can be visualized to understand how flood events would affect the site. The project also leaves parametric relations and space for future adjustments and visualization inputs that would require more data for greater accuracy, such as biodiversity changes, oil and trash collection, risk assessment, and cost and maintenance estimations of each configuration. Additionally, the model was developed so that the vegetation assets could easily be linked to the nitrogen and carbon assimilation estimations once data becomes available as part of a
future iteration. This open framework used the same methodology as the oyster calculations but still needs to be updated with accurate and relevant data.
3.2. Accessibility for Stakeholders
One of the more significant results of this project is the usability of the tool by and for non-technical and non-specialized stakeholders and community members. The AR and real-time parametric adjustments ensure ease of insight into the various design iterations and the trade-offs of each decision or input. Users can also explore ecological aesthetics and understand experiential qualities such as shade, flooding conditions, and the potential changes that would occur with living shoreline implementations. This allows for greater collaboration and feedback from the community about proposed projects and easier modifications to project design in response to stakeholder input. However, with the interface only going through a couple of iterations of development, there should be further testing and refinement to the interface to ensure optimal ease of use, communication of environmental effects, and that it is accessible across diverse user groups [20-22].
3.3. Broader Applications
While this study focused primarily on the effects of oyster reefs, the tool’s adaptability suggests and can be adjusted to other ecological, coastal management and architectural applications. Using nearby locally collected data, with parametric models that use algorithms based on environmental data as the foundation for the computation, with visualization tools, interactive game features, and high-quality digital models, allows this tool to be applicable for other use case scenarios. For example, for further Digital Twin developments, this tool could evolve not only to account for other coastal regions and the effects of different ecological conditions on the environment but also a real-time monitoring and management system of various shoreline interventions. As much of the development was on the tool and relation, other projects and research, such as green roofs, park designs, and stormwater management, that rely on environmental and infrastructural static data, projected data, and modeling would be able to use the same methodology, workflow, and computational parameters.
4. Conclusion
This study presents a generative design tool that bridges computational methodologies and 3D modeling with ecological restoration. This offers a new approach to designing living shorelines that integrate parametric modeling, environmental data, augmented reality visualization, and game engine
Generative Design for Coastal Resilience: A Computational Approach to Living Shorelines
interactivity to comprehend the opportunities, challenges, and trade-offs of coastal resilience solutions. This work could provide the foundation for future research and projects based on scalability and adaptability, to enhance stakeholder engagement and maximize the service provisioning of an engineering project.
The generative design tool’s ability to estimate nitrogen and carbon assimilation, dynamically visualize shoreline configurations, and provide interactive decision-making features allows greater collaboration between project teams, stakeholders, and community members. Designers and policymakers can access data-driven insights on restoration investments. These real-time visualizations enhance comprehension of ecological and design trade-offs and scalable and adjustable algorithms to adapt to diverse coastal ecosystems.
Despite the tool's strengths, future iterations must address some limitations. The first limitation identified is that ecological consistencies are not always available, affecting the simulation's accuracy based on high-quality environmental data. The tool used high-quality data from nearby oyster reefs. It calculated the mean value of the data collected. It used these values as a predictive factor for areas without information, creating proxies that could be improved if extensive data collection was conducted from site-specific regions to ensure greater accuracy of nitrogen and carbon assimilation estimates.
The second limitation is that the current algorithm is trained for the selected ecological and site constraints. Therefore, scaling the algorithm for more significant and diverse ecosystems would require further computational resources, research, and development. This current iteration also requires foundational knowledge of programs such as Unreal Engine to edit and alter the program to other ecosystems or oyster-based reef sites.
Future work should focus on expanding the tool’s dataset compatibility, improving its scalability, expanding applicability across various ecosystems, enhancing user interface for diverse stakeholders, and conducting pilot to validate and refine ecological impact models. The early iterations of the tool represent the beginning initiatives for collaborative interdisciplinary tools, leaving room for additional research
As coastal communities face challenges from climate change and environmental degradation, the opportunities from interdisciplinary collaborations like this one offer paths toward more sustainable and inclusive solutions. Combinations of science, technology, and design enable people with various backgrounds to participate in decisions that will directly affect their communities and environments.
Acknowledgments We would like to thank the St. John Riverkeepers for their guidance, support, and interest throughout this project. We are also grateful to the
Dieffenthaller M, et. all 16
University of Florida, the SHARE Lab, and The Center for Coastal Solutions for providing critical environmental data and computational resources. Finally, we are grateful to CAADFutures 2025: Catalytic Interfaces reviewers for their insightful comments, which have enhanced the quality of this work.
Disclosure of Interests. The authors have no competing interests to declare that are relevant to the content of this article.
References
1. Cosby, A.G., Lebakula, V., Smith, C.N., Wanik, D.W., Bergene, K., Rose, A.N., Swanson, D., Bloom, D.E.: Accelerating growth of human coastal populations at the global and continent levels: 2000–2018. Scientific Reports 14(1), 22489 (2024)
2. He, Q., Silliman, B.R.: Climate change, human impacts, and coastal ecosystems in the Anthropocene. Current Biology 29(19), R1021–R1035 (2019)
3. Charlier, R.H., Chaineux, M.C.P., Morcos, S.: Panorama of the history of coastal protection. Journal of Coastal Research 21, 79–111 (2005)
4. Hinkel, J., Lincke, D., Vafeidis, A.T., Perrette, M., Nicholls, R.J., Tol, R.S.J., … Levermann, A.: Coastal flood damage and adaptation costs under 21st century sea-level rise. Proceedings of the National Academy of Sciences 111, 3292–3297 (2014). https://doi.org/10.1073/pnas.1222469111
5. Gittman, R.K., Scyphers, S.B., Smith, C.S., Neylan, I.P., Grabowski, J.H.: Ecological consequences of shoreline hardening: A meta-analysis. BioScience 66(9), 763–773 (2016). https://doi.org/10.1093/biosci/biw091
6. Dugan, J.E., Emery, K.A., Alber, M., Alexander, C.R., Byers, J.E., Gehman, A.M., McLenaghan, N., Sojka, S.E.: Generalizing ecological effects of shoreline armoring across soft sediment environments. Estuaries and Coasts 41, 180–196 (2018)
7. Barbier, E.B., Hacker, S.D., Kennedy, C., Koch, E.W., Stier, A.C., Silliman, B.R.: The value of estuarine and coastal ecosystem services. Ecological Monographs 81(2), 169–193 (2011). https://doi.org/10.1890/10-1510.1
8. Morris, R.L., Konlechner, T.M., Ghisalberti, M., Swearer, S.E.: From grey to green: Efficacy of eco-engineering solutions for nature-based coastal defence. Global Change Biology 24(5), 1827–1842 (2018)
9. Smith, C.S., Rudd, M.E., Gittman, R.K., Melvin, E.C., Patterson, V.S., Renzi, J.J., Wellman, E.H., Silliman, B.R.: Coming to terms with living shorelines: A scoping review of novel restoration strategies for shoreline protection. Frontiers in Marine Science 7, 434 (2020)
10. Bilkovic, D.M., Mitchell, M., Mason, P., Duhring, K.: The role of living shorelines as estuarine habitat conservation strategies. Coastal Management 44(3), 161–174 (2016)
11. O’Leary, B.C., Fonseca, C., Cornet, C.C., de Vries, M.B., Degia, A.K., Failler, P., Furlan, E., et al.: Embracing nature-based solutions to promote resilient marine and coastal ecosystems. Nature-Based Solutions 3, 100044 (2023)
12. Mitchell, M., Bilkovic, D.M.: Embracing dynamic design for climateresilient living shorelines. Journal of Applied Ecology 56(5), 1099–1105
Generative Design for Coastal Resilience: A Computational Approach to Living Shorelines (2019)
13. Bridges, T., King, J., Simm, J.D., Beck, M., Collins, G., Lodder, Q., Mohan, R.: International guidelines on natural and nature-based features for flood risk management. USACE (2021)
14. Fisheries, N.: Understanding Living Shorelines | NOAA Fisheries, https://www.fisheries.noaa.gov/insight/understanding-livingshorelines, last accessed 2024/05/09.
15. Florida Living Shorelines, https://floridalivingshorelines.com/, last accessed 2024/05/09.
16. Living Shorelines – Naturally Resilient Communities, https:// nrcsolutions.org/living-shorelines/, last accessed 2024/05/09.
17. Moosavi, S.: Ecological Coastal Protection: Pathways to Living Shorelines. Procedia engineering. 196, 930–938 (2017). https://doi.org/10.1016/ j.proeng.2017.08.027.
18. Scyphers, S.B., Beck, M.W., Furman, K.L., Haner, J., Keeler, A.G., Landry, C.E., O’Donnell, K.L., Webb, B.M., Grabowski, J.H.: Designing effective incentives for living shorelines as a habitat conservation strategy along residential coasts. Conservation letters. 13, n/a (2020). https://doi.org/ 10.1111/conl.12744
19. SL494/SS707: Ecosystem Services Provided by Living Shorelines, https:// edis.ifas.ufl.edu/publication/SS707, last accessed 2024/05/09.
20. Living Shoreline Explorer | Coastal Resilience, https:// coastalresilience.org/project/living-shoreline-explorer/ , last accessed 2024/05/09.
21. Land to Sea, https://www.teamorca.org/land-to-sea/, last accessed 2024/05/09.
22. Nunez, K., Rudnicky, T., Mason, P., Tombleson, C., Berman, M.: A geospatial modeling approach to assess site suitability of living shorelines and emphasize best shoreline management practices. Ecological engineering. 179, 106617- (2022). https://doi.org/10.1016/ j.ecoleng.2022.106617.
23. Rhyne, T.-M.: Computer games and scientific visualization. Commun. ACM. 45, 40–44 (2002). https://doi.org/10.1145/514236.514261
24. Kosmadoudi, Z., Lim, T., Ritchie, J., Louchart, S., Liu, Y., Sung, R.: Engineering design using game-enhanced CAD: The potential to augment the user experience with game elements. Computer-Aided Design. 45, 777–795 (2013). https://doi.org/10.1016/j.cad.2012.08.001
25. Living Shorelines, https://myfwc.com/conservation/special-initiatives/ cwci/living-shorelines/, last accessed 2024/05/09.
26. Living Shorelines, https://estuaries.org/living-shorelines/, last accessed 2024/05/09.
27. Onorevole, K.M., Thompson, S.P., Piehler, M.F.: Living shorelines enhance nitrogen removal capacity over time. Ecological engineering. 120, 238–248 (2018). https://doi.org/10.1016/j.ecoleng.2018.05.017
28. Angelini, C., Sheremet, A., Dix, N.: Ecologically engineering living shorelines for high-energy environments. Presented at the 2018 ESA Annual Meeting (August 5 -- 10) August 8 (2018).
29. Tell Me About: Living Shorelines in Florida, https:// www.floridamuseum.ufl.edu/earth-systems/blog/tell-me-about-living-
Dieffenthaller M, et. all 18 shorelines-in-florida/, last accessed 2024/05/09.
30. Paxton, A.B., Riley, T.N., Steenrod, C.L., et al.: Evidence on the performance of nature-based solutions interventions for coastal protection in biogenic, shallow ecosystems: a systematic map. Environmental Evidence 13, 28 (2024). https://doi.org/10.1186/s13750-024-00350-5.
31. Resilient Florida Program - Living Shorelines | Florida Department of Environmental Protection, https://floridadep.gov/rcp/resilient-floridaprogram/content/resilient-florida-program-living-shorelines , last accessed 2024/05/09.
32. Communications: Restoring Florida’s Coast with Living Shorelines, https://www.flseagrant.org/restoring-floridas-coast-with-livingshorelines/, last accessed 2024/05/09.
33. Fischman, H. et al : Research on spatial optimization of bivalve outplanting . Under Review, PNAS
34. Friese, K.-I., Herrlich, M., Wolter, F.-E.: Using Game Engines for Visualization in Scientific Applications. In: Ciancarini, P., Nakatsu, R., Rauterberg, M., and Roccetti, M. (eds.) New Frontiers for Entertainment Computing. pp. 11–22. Springer US, Boston, MA (2008). https://doi.org/ 10.1007/978-0-387-09701-5_2
35. 2.7.25. Ribault River | State of the River Report for the Lower St. Johns River Basin, https://sjrr.domains.unf.edu/2-7-25-ribault-river/.
36. Vecera, R.: 2024 State of the River Report - St. Johns Riverkeeper, https:// stjohnsriverkeeper.org/2024-state-of-the-river-report./
37. Wainwright, D.: | Florida Department of Environmental Protection | Fecal Coliform TMDL for the Ribault River (WBID 2224). https:// floridadep.gov/sites/default/files/tmdl_document2224.pdf