Development of a Machine Learning Modeling Tool for Predicting Human Immunodeficiency Virus Incidence Using Public Health Data From a County in the Southern United States
Carlos S. Saldana,1, Elizabeth Burkhardt,2 Alfred Pennisi,2 Kirsten Oliver,2 John Olmstead,2 David P. Holland,3,4 Jenna Gettings,2 Daniel Mauck,2 David Austin,2 Pascale Wortley,2 and Karla V. Saldana Ochoa5
1Division of Infectious Diseases, Department of Medicine, Emory University School of Medicine, Atlanta, Georgia, USA; 2Epidemiology Division, Georgia Department of Public Health, Atlanta, Georgia, USA; 3Division of Primary Care, Mercy Care Health Systems, Atlanta, Georgia, USA; 4Fulton County Board of Health, Communicable Disease Prevention Branch, Atlanta, Georgia, USA; and 5School of Architecture, College of Design, Construction, and Planning, University of Florida, Gainesville, Florida, USA
Background. Advancements in machine learning (ML) have improved the accuracy of models that predict human immunodeficiency virus (HIV) incidence. These models have used electronic medical records and registries. We aim to broaden the application of these tools by using deidentified public health datasets for notifiable sexually transmitted infections (STIs) from a southern US county known for high HIV incidence. The goal is to assess the feasibility and accuracy of ML in predicting HIV incidence, which could inform and enhance public health interventions.
Methods. We analyzed 2 deidentified public health datasets from January 2010 to December 2021, focusing on notifiable STIs. Our process involved data processing and feature extraction, including sociodemographic factors, STI cases, and social vulnerability index (SVI) metrics. Various ML models were trained and evaluated for predicting HIV incidence using metrics such as accuracy, precision, recall, and F1 score.
Results. We included 85 224 individuals; 2027 (2.37%) were newly diagnosed with HIV during the study period. The ML models demonstrated high performance in predicting HIV incidence among males and females. Influential features for males included age at STI diagnosis, previous STI information, provider type, and SVI. For females, predictive features included age, ethnicity, previous STI information, overall SVI, and race.
Conclusions. The high accuracy of our ML models in predicting HIV incidence highlights the potential of using public health datasets for public health interventions such as tailored HIV testing and prevention. While these findings are promising, further research is needed to translate these models into practical public health applications.
Keywords. machine learning; HIV; public health; EHE; artificial intelligence.
Despite significant advancements in the treatment and prevention of human immunodeficiency virus (HIV), disparities remain in the implementation of these interventions, particularly in the Southern United States [1–3]. Fulton County, Georgia, is a priority jurisdiction in the Ending the HIV Epidemic initiative due to the high HIV incidence in that county [4]. In 2021, there were 59.6 new HIV diagnoses per 100 000
Received 13 November 2023; editorial decision 01 February 2024
Correspondence: C. S. Saldana, Division of Infectious Diseases, Emory University School of Medicine, 341 Ponce de Leon Ave NE, Atlanta, GA 30308 (cssalda@emory.edu); K. V. Saldana Ochoa, School of Architecture, College of Design, Construction, and Planning, University of Florida, 1480 Inner Rd, Gainesville, FL 32601 (ksaldanaochoa@ufl.edu).
Clinical Infectious Diseases®
© The Author(s) 2024. Published by Oxford University Press on behalf of Infectious Diseases Society of America. All rights reserved. For commercial re-use, please contact reprints@oup.com for reprints and translation rights for reprints. All other permissions can be obtained through our RightsLink service via the Permissions link on the article page on our site—for further information please contact journals.permissions@oup.com. https://doi.org/10.1093/cid/ciae100
people in Fulton County, well above the national average of 11.5 [4, 5]. There is a need for innovative, data-driven strategies to guide public health interventions aimed at reducing HIV rates by improving access to HIV testing and prevention.
In recent years, artificial intelligence, particularly machine learning (ML) models, has been used to analyze large-scale datasets, such as electronic medical records and a variety of patient registries [6–12]. These models have been used to identify patterns and influential features associated with HIV acquisition. These tools assist and inform providers of individuals who should be prioritized for HIV testing and prevention strategies [13].
Medical records from a single healthcare setting provide an important context and inform influential features related to HIV acquisition but could fail to fully capture relevant socioeconomic features and other valuable geospatial data from outside of its patient population. We aim to leverage ML tools using deidentified STI/HIV public health datasets that are readily available to public health officials coupled with social
vulnerability indicators from a high-incidence county in the Southern United States to predict HIV incidence. This tool could inform tailored sexual health outreach and optimize resource allocation for HIV testing and prevention.
METHODS
Study Setting
Fulton County, Georgia, had an estimated 2021 population of 1 066 702 residents, consisting of 45% African American, 44.2% White, and 7.4% Hispanic/Latino individuals. For context, approximately 55.9% of residents held a bachelor’s degree or higher. The median household income was $77,635, and the poverty rate stood at 13.7% [14].
Data Sources
From January 2010 to December 2021, we collected deidentified data of individuals aged ≥13 years from 2 Georgia databases: the State Electronic Notifiable Disease Surveillance System (SendSS), a web-based platform that collects, manages, and analyzes data on communicable diseases such as STIs, hepatitis C, and tuberculosis, and the Georgia Electronic HIV/AIDS Reporting System (eHARS), a browser-based system developed by the Centers for Disease Control and Prevention in the United States to collect, manage, and analyze laboratory-reported data specifically related to HIV. These databases collect data on demographics, diagnosis time frame, diagnosing provider type, risk behaviors, and similar information. We matched each individual by census tract to a social vulnerability index (SVI) [15], a tool developed by the Agency for Toxic Substances and Disease Registry that is often applied in studies to assess and measure community vulnerability during epidemics, disasters, and emergencies in different populations. For our model, the SVI was classified using quintiles, per tool developers, for an overall score and the 4 SVI themes (socioeconomic status, household composition, race/ethnicity/language, and housing/transportation). Quintiles ranged from 1 = ”very low vulnerability,” 2 = ”low vulnerability,” 3 = ”moderate vulnerability,” 4 = ”high vulnerability,” and 5 = ”very high vulnerability.”
Dataset Development
The outcome of interest was incident HIV during the study period of 2010 to 2021, defined as confirmed HIV diagnosis in eHARs. We extracted STI cases from the SendSS database, which specifically catalogs STI cases per occurrence. Each case has both an outcome and a unique patient identifier. To ensure the accuracy of HIV diagnoses within our dataset, we applied a probabilistic matching technique to accurately crossreference HIV diagnoses across the eHARS and SendSS databases, using key demographic characteristics. Our algorithm assigned scores to potential matches based on the similarity of these fields, with higher scores indicating a stronger
likelihood of a match. We determined a positive match with a score of 67% or higher. We used this threshold as the optimal balance when identifying positive matches, managing computational resources, and maintaining data limits. We excluded patients whose initial or sole record in SendSS was attributed to an HIV diagnosis and those with a documented HIV diagnosis before the study period, including those previously diagnosed out of state. Furthermore, subsequent STI cases after an individual’s HIV event were omitted. To maintain data integrity, we also excluded cases from our analysis where the missing data exceeded a threshold of 10%. Finally, the dataset was transposed from a case-based model to a patient-based model, consolidating multiple STI cases into a singular composite profile per patient, each with 1 or more STIs. The process of participant selection is illustrated in Figure 1
Feature Selection
Our study included the diverse features detailed in Table 1, encompassing sociodemographic variables such as age, sex assigned at birth, race, and ethnicity. We included the age at STI diagnosis and compiled those in an array for individuals with multiple STI occurrences. The cumulative non-HIV STI count per patient was also included. Additionally, we cataloged all previous non-HIV STIs, including gonorrhea, chlamydia, and syphilis along with its stages, and, where multiple infections were observed in a single patient, we constructed an array to represent this. The time for reinfection interval was categorized by labeling reinfections as those that occurred at different time intervals from the initial STI(s). Provider type, ranging from urgent care centers and private clinics to correctional facilities, health departments, and similar facilities, was also organized in an array when multiple STIs occurred. Last, we aligned SVIs that corresponded to the time of STI diagnosis in order to evaluate the influencing socioeconomic context.
Model Development
After data preprocessing, we stratified patients by sex assigned at birth. We trained separate models for males and females, given the variety of biological and behavioral factors that influence HIV acquisition in each group. To ensure data completeness, we addressed missing values by imputing them with the mean value within the variable. Our dataset encompassed diverse features with numerical, categorical, and array data. We adopted a 3-fold approach to manage this heterogeneity. For numerical data, we implemented normalization to standardize the scale. For categorical data, we used 1-hot encoding [16] to code the data into numerical feature vectors that were then normalized. For array data, we used an ML methodology to extract numerical feature vectors using a neural network autoencoder [17]. This process yielded an array of 2-dimensional feature vectors for each attribute. To consolidate these 2-dimensional feature vectors into a single numerical feature vector for 2

1. Methodology for matching SendSS and eHARS datasets from Fulton County, Georgia, from 2010 to 2021. Of 132 928 STI cases, 5729 were excluded. Transposition from case-based to patient-based led to 85 224 individuals who were then matched to a social vulnerability quintile and categorized by sex assigned at birth and documented HIV status. Abbreviations: eHARS, Electronic HIV/AIDS Reporting System; HIV, human immunodeficiency virus; SendSS, State Electronic Notifiable Disease Surveillance System; STI, sexually transmitted infection.
each attribute, we used dimensionality reduction through T-distributed stochastic neighbor embedding (T-SNE) [18].
T-SNE transformed the initial 2-dimensional feature vector into a 1-dimensional feature vector that was then normalized to facilitate the analysis.
We ensured a balance between individuals with documented HIV and those without for both the training and test sets. Given that the class distribution disparity between these 2 groups was significant at a 1:100 ratio, a potential bias could adversely affect the ML models by neglecting the minority class, despite its crucial predictive significance. To address this class imbalance challenge, we used resampling, a technique that involves altering the composition of the dataset [19]. Specifically, for our model, we used “undersampling,” which entails reducing instances from the majority class, hence, setting a cap for examples from the majority class (without documented HIV) based on the total number of cases from the minority class (with documented HIV). Consequently, we randomly selected an equivalent number of cases from the “without documented HIV”
group to match the “with documented HIV” group in order to establish an unbiased representation of both classes within the training set [19]. This balance was maintained in both male and female groups, with the training set (85%) and the remaining test set (15%) reserved for validation.
Model Selection and Evaluation
To identify the most suitable predictive model, we adopted a comprehensive and widely recognized strategy known as the “horse race approach” [20]. This technique entails training multiple ML models using the same training dataset; this enabled us to evaluate their performances and select the algorithm that attains the highest predictive accuracy. We selected from a variety of established classifiers, each with distinct attributes, strengths, and limitations. The chosen classifiers included random forest, nearest neighbors, logistic regression, naive Bayes, and gradient boosted trees [21, 22]. Random forest is an ensemble of decision trees that is well suited for handling large, highdimensional data and robust against overfitting. Nearest
Figure
1.
State Electronic Notifiable Disease Surveillance System
Variable Type
Patient ID
Considerations
CAT Transposed data to include a single patient with all STI cases in 1 record
Sex assigned at birth CAT Stratified models for males and females
Race CAT
Ethnicity CAT
Age at STI diagnosis
Previous non-HIV STI
Enhanced HIV/AIDS Reporting System
Variable Type Considerations
Matched HIV diagnosis during study period
CAT Used probability matching between datasets using sociodemographic information
CAT ARRAY For patients with multiple cases, we developed an array for the age at each STI diagnosis
CAT ARRAY Non-HIV STI event (ie, chlamydia, gonorrhea, syphilis stage); for patients with multiple cases, we developed an array for each previous non-HIV STI
Non-HIV STI count CONT Count of non-HIV STI events
Reinfection interval
CAT ARRAY Time lapses for each STI reinfection in intervals; for patients with multiple cases, we developed an array with the interval between each STI diagnosis
Provider type CAT ARRAY Hospital, clinic, correctional system, and others; for patients with multiple STI cases, we developed an array for diagnosing provider at each STI diagnosis
Overall, SVI
SVI Theme 1 (socioeconomic status)
SVI Theme 2 (household composition, disability)
SVI Theme 3 (minority status, language)
SVI Theme 4 (housing, transportation)
CAT Used quintiles of the first case in the dataset
CAT Used quintiles of the first case in the dataset
CAT Used quintiles of the first case in the dataset
CAT Used quintiles of the first case in the dataset
CAT Used quintiles of the first case in the dataset
Data sources are from Fulton County, Georgia, notifiable diseases from 2010 to 2021. Features are categorized by type and considerations. Data manipulation techniques, such as array development for patients with multiple STI diagnoses, are noted to clarify the approach to data integration and analysis.
neighbors classifies based on proximity to the closest training examples, being simple and effective for small datasets, though it becomes slower with increasing dimensions. Logistic regression is ideal for binary outcomes and is easier to implement and interpret but might struggle with complex data relationships, such as the multifaceted data in our dataset. Naive Bayes, a probabilistic classifier, applies Bayes’ theorem under strong independence assumptions and is notably efficient with highdimensional data. Gradient boosted trees incrementally build models in stages by optimizing a loss function, proving highly effective for complex datasets in both regression and classification tasks [21, 22]. Through uniform training and evaluation of each model on the same training data, we established an equitable platform for comparison. Finally, we assessed each model’s performance via accuracy (proportion of true results), precision (proportion of true positive predictions in relation to the total number of positive predictions), recall (proportion of actual positive cases that were correctly identified by the model as positive), and F1 score (harmonic mean of precision and recall, providing a single measure of the model’s accuracy that considers both the false-positives and false-negatives).
Ethical Considerations
Institutional review board (IRB) approval was obtained through the Georgia Department of Public Health (DPH) IRB Office. Data-sharing agreements were obtained between DPH and the University of Florida. All personal identifiers were removed from the datasets before data sharing to maintain participant confidentiality and comply with legal standards.
RESULTS
Between 2010 and 2021, of 132 928 STI cases recorded in SendSS, 127 169 met our inclusion criteria. When we transposed our dataset from STI-based to patient-based, we identified 85 224 unique individuals, each with 1 or more STI cases. Sex-assigned-at-birth distribution was 54% females (45 834) and 46% males (38 935), as detailed in Table 2 Of these, 2027 individuals (2.37%) met our inclusion criteria and had documented incident HIV during the study period, including 1698 males (84%) and 329 females (16%). The male training set (85%) had 1444 individuals evenly matched with 1444
Abbreviations: ARRAY, list of categorical values; CAT, categorical variable; CONT, continuous variable; HIV, human immunodeficiency virus; ID, identification; STI, sexually transmitted infection; SVI, social vulnerability index. 4
Table 2. Sociodemographic Features, Sexually Transmitted Infection Data, and Social Vulnerability Data Stratified by Sex Assigned at Birth and Documented Human Immunodeficiency Virus Status
Abbreviations: HIV, human immunodeficiency virus; STI, sexually transmitted infection.
6 • CID • Saldana et al
randomly selected individuals “without documented HIV” for a total of 2888 cases for this set. The pattern was maintained for the female group, which consisted of 280 in each group for a total of 560 for the training set. The remaining was used as the validation test set (15%) that included 508 individuals for males (254 with documented HIV and 254 without) and 98 for females (49 with documented HIV and 49 without), as shown in Table 3
On average, males were diagnosed with STIs at age 28 years and females at age 24 years (range, from 13 to 88 and from 13 to 95, respectively). In both groups, the majority were Black, 63% of males and 57% of females, with a considerable portion having an unspecified race (23% of males and 32% of females). The highest number of STI cases recorded per individual was 18 for males and 23 for females. Most experienced just a single STI episode (71% of males and 72% of females), followed by 2 episodes (17% in both males and females). Chlamydia was the predominant STI among females, accounting for 79% of episodes compared with 54% in males. Conversely, gonorrhea was the most frequent in males (36%) compared with 19% in females. Reinfections typically occurred more than a year later for both males (69%) and females (67%). When reinfections occurred within a year, they most often took place between 201 and 365 days from the initial STI in both genders (12%). Males were most often diagnosed at STD clinics (22.32%) and females at private physician offices (40%), with the latter also being the second most common for males (19%) followed by hospitals for females (15%). The rarest locations for diagnoses were school-based clinics for males (2%) and correctional facilities for females (2%).
Model Performance and Evaluation
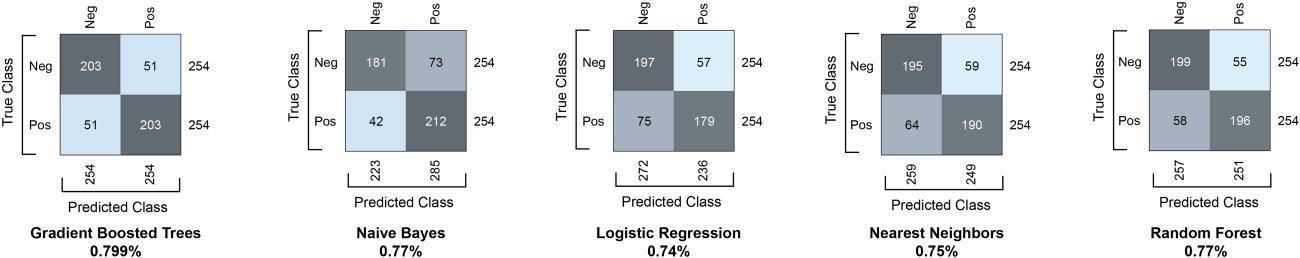
In the analysis of various models, detailed in Figure 2, gradient boosted trees stood out among the classifiers, achieving an 80% accuracy rate in predicting HIV incidence for both male and female groups, as detailed in Figure 3 For males, the model correctly identified 203 true-negatives and 203 true-positives. Similarly, for females, the model correctly identified 38 truenegatives and 40 true-positives. As depicted by the confusion matrices, the model has comparable precision and recall across both genders, although with a slightly higher error rate for females. The precision for males stands at 80%, signifying that when the model predicts an HIV case, it is correct around 80% of the time. For females, the precision is slightly lower at 78%. The recall for males, which measures the model’s ability to find all actual cases of HIV, was also 80%, while it was slightly higher at 81% for females. The F1 score was equal for males and females at 80%, suggesting that the model has a balanced performance in identifying true-positives and avoiding false-negatives.
In terms of feature influence in prediction, for the male subset, the most influential features, in order of significance, were age at STI diagnosis, previous non-HIV STI, provider type,
Table 3. Details of the Training and Test Dataset Breakdown by Sex Assigned at Birth and Precision and Accuracy Metrics for the Model’s Classification Performance
Sex Assigned At Birth Training Data (85%) Test Data (15%) Precision Accuracy
Male 2888 (1444 with and without each)
Female 560 (280 with and without each)
508 (254 with and without each) Neg: 80% Pos: 80% 80%
98 (49 with and without each) Neg: 80% Pos: 78% 80%
non-HIV STI count, reinfection interval, and SVI theme 4 (housing transportation), indicating that both demographic and social vulnerability features had a notable influence. The predictive factors for the female subset differed slightly, emphasizing age at STI diagnosis, ethnicity, non-HIV STI, provider type, along with race and overall SVI and themes 2 and 3. These distinctions highlight the complexity and effectiveness of our model, pointing to the necessity for customizing predictive methods according to demographic specifics, as illustrated in Figure 4.
DISCUSSION
Our models accurately predicted HIV incidence from 2010 to 2021 by leveraging deidentified public health datasets. Our models highlight sociodemographic factors that influence HIV acquisition consistent with similar trends observed throughout the Southern United States and globally [2, 23, 24]. By leveraging the capabilities of ML, “big data,” and a social context, our methodology provides a comprehensive perspective on the dynamics that influence HIV transmission. Similar approaches have been used locally and globally using electronic medical record data and patient registries [6–12, 23, 24]; however, our study is the first to use US public health datasets to predict HIV incidence.
Our study introduces advancements in data processing methodology for handling multimodal data, including numerical, categorical, and arrays, as they pertain to HIV. Unlike previous approaches [7, 13] that converted all features into numerical or categorical data, which could lead to information loss, our methodology effectively processes array data using established ML algorithms such as autoencoders. Additionally, we used dimensionality reduction algorithms, transforming multidimensional data into a 1-dimensional numerical feature, which can be integrated with other numerical and categorical features for training ML classifiers.
In our study, age at first STI diagnosis emerged as the most predictive factor for both genders, similar to a study from sub-Saharan Africa [23]. For males, additional predictors included prior non-HIV STI occurrences and social vulnerability
and false-negatives
for

features, paralleling findings from other studies where sociobehavioral factors played a significant role [6, 23, 25]. As in other studies, these factors took precedence over race and ethnicity in males, echoing concerns about dataset biases and model fairness raised in the literature [26, 27]. For females, ethnic background and STI-related variables were predictors, aligning with insights on gender-specific risk factors seen in studies
8 • CID • Saldana et al
from the United States and Africa [13, 25]. The identification of socioeconomic factors as influential predictors in these models underscores their suitability for guiding public health interventions [6]. By accurately identifying individuals at heightened risk of HIV acquisition, these models could become valuable tools for developing strategies that prioritize individuals for HIV testing and prevention.
Figure 2. Confusion matrices for various machine learning models. True-positives, true-negatives, false-positives,
are reported
gradient boosted trees, naive Bayes, logistic regression, nearest neighbors, and random forest, with accuracy scores below each matrix. Note: Similar performance metrics were seen in the female subgroup (not displayed in this figure).
Figure 3. Gradient boosted trees confusion matrices present the performance for males (left) and females (right) both with an accuracy of 80% with balanced precision and recall across classes. Both models exhibit comparable error rates.

Figure 4. Influential features for our predictive model males (left) and females (right). Each bar represents a feature’s influence on the model’s predictions. Longer bars indicate greater influence. Abbreviations: HIV, human immunodeficiency virus; STI, sexually transmitted infection; SVI, social vulnerability index.
The strength of our study lies in its reliance on datasets that are routinely accessed by public health professionals, enhancing the practicality of integrating and implementing these models into existing public health frameworks. Our models demonstrate a proof of concept in effectively identifying individuals at an elevated risk of HIV acquisition within a population already at elevated risk, those with a history of STIs. This approach could offer strategic direction for enhanced HIV testing and preexposure prophylaxis (PrEP) referrals, particularly in areas with high incidence and challenges associated with resources and public health staffing. These tools could also guide public health officials in identifying disproportionately impacted areas, such as census tracts, for focused outreach efforts.
Our study does have some key limitations. Our model’s reliability hinges on the accuracy and completeness of its datasets. A significant amount of unspecified racial data may impact the model’s precision, bias, and utility. Data biases that stem from unrepresentative training data of the target population could lead to inaccurate predictions. In this pilot phase, we acknowledge the need for data preprocessing that incorporates fairness approaches for a more human-centric model. This involves ensuring group fairness for statistical parity and individual fairness for consistent decisions [28]. Our model might not accurately identify undiagnosed HIV cases, and exclusion of records with more than 10% missing data might omit pertinent cases. The model only assesses HIV risk in individuals with reportable STIs, limiting its applicability beyond this group. As our study is based in Fulton County, Georgia, an urban and diverse area, it may not fully capture the broader, often rural Southern HIV epidemic, thus limiting the broader applicability of our findings. Nonetheless, all Georgia jurisdictions use our model’s datasets.
Future research should focus on reducing prediction bias in models through better inclusion criteria and fairness; improving model explainability for healthcare professionals and policymakers; using real-time or prospective data for real-time
public health strategies; applying implementation science frameworks to assess the integration of these models into public health practice, such as enhancing HIV testing and PrEP referrals; conducting qualitative research with stakeholders for best practices to deploy these tools; strategies for improving data quality, including variables such as gender identity and location; and prioritizing ethical considerations and community involvement for equitable, privacy-conscious model use. These steps aim to enhance the effectiveness and ethical use of predictive models in healthcare.
Note
Potential conflicts of interest. C. S. reports grants from the National Institutes of Health and consultancy as a medical advisor for the Office of HIV/AIDS of the Georgia Department of Public Health and ViiV Healthcare. E. B. reports Prevention and Control for Health Departments grant support. All other authors report no potential conflicts.
All authors have submitted the ICMJE Form for Disclosure of Potential Conflicts of Interest. Conflicts that the editors consider relevant to the content of the manuscript have been disclosed.
References
1. Fauci AS, Redfield RR, Sigounas G, Weahkee MD, Giroir BP. Ending the HIV epidemic: a plan for the United States. JAMA 2019; 321:844–5.
2. Centers for Disease Control and Prevention. HIV Surveillance Report, 2021; vol. 34. Available at: http://www.cdc.gov/hiv/library/reports/hiv-surveillance.html Published May 2023. Accessed 13 November 2023.
3. Doherty R, Walsh JL, Quinn KG, John SA. Association of race and other social determinants of health with HIV pre-exposure prophylaxis use: a county-level analysis using the PrEP-to-need ratio. AIDS Educ Prev 2022; 34:183–94.
4. Bunting SR, Hunt B, Boshara A, et al. Examining the correlation between PrEP use and black:white disparities in HIV incidence in the Ending the HIV Epidemic priority jurisdictions. J Gen Intern Med 2023; 38:382–9.
5. Centers for Disease Control and Prevention. Estimated HIV incidence and prevalence in the United States, 2017–2021. HIV Surveillance Supplemental Report, 2023; 28 (No.3). Available at: http://www.cdc.gov/hiv/library/reports/hiv-surveillance.html Accessed 13 November 2013.
6. Balzer LB, Havlir DV, Kamya MR, et al. Machine learning to identify persons at high-risk of human immunodeficiency virus acquisition in rural Kenya and Uganda. Clin Infect Dis 2020; 71:2326–33.
7. Marcus JL, Hurley LB, Krakower DS, Alexeeff S, Silverberg MJ, Volk JE. Use of electronic health record data and machine learning to identify candidates for HIV pre-exposure prophylaxis: a modeling study. Lancet HIV 2019; 6:e688–95.
8. Zheng W, Balzer L, van der Laan M, Petersen M; SEARCH Collaboration. Constrained binary classification using ensemble learning: an application to costefficient targeted PrEP strategies. Stat Med 2018; 37:261–79.
9. Orel E, Esra R, Estill J, et al. Prediction of HIV status based on socio-behavioral characteristics in East and Southern Africa. PLoS One 2022; 17:e0264429.
10. Krakower DS, Gruber S, Hsu K, et al. Development and validation of an automated HIV prediction algorithm to identify candidates for pre-exposure prophylaxis: a modeling study. Lancet HIV 2019; 6:e696–704.
11. Feller DJ, Zucker J, Yin MT, Gordon P, Elhadad N. Using clinical notes and natural language processing for automated HIV risk assessment. J Acquir Immune Defic Syndr 2018; 77:160–6.
12. Xu X, Ge Z, Chow EPF, et al. A machine-learning-based risk-prediction tool for HIV and sexually transmitted infections acquisition over the next 12 months. J Clin Med 2022; 11:1818.
13. Burns CM, Pung L, Witt D, et al. Development of a human immunodeficiency virus risk prediction model using electronic health record data from an academic health system in the southern United States. Clin Infect Dis 2023; 76:299–306.
14. US Census Bureau. “QuickFacts Fulton County, Georgia” 2020 Census of Population and Housing. Available at: https://www.census.gov/quickfacts/ fultoncountygeorgia Accessed 30 January 2024.
15. Centers for Disease Control and Prevention/Agency for Toxic Substances and Disease Registry/Geospatial Research, Analysis, and Services Program. CDC/ ATSDR Social Vulnerability Index [2020] Database [Georgia]. Available at: https://www.atsdr.cdc.gov/placeandhealth/svi/data_documentation_download. html Accessed 13 November 2023.
16. Seger C. An investigation of categorical variable encoding techniques in machine learning: binary versus one-hot and feature hashing [Internet] [Dissertation]. 2018. (TRITA-EECS-EX). Available at: https://urn.kb.se/resolve? Accessed 30 January 2024.
17. Wang W, Huang Y, Wang Y, Wang L. Generalized autoencoder: a neural network framework for dimensionality reduction. Presented at 2014 IEEE Conference on Computer Vision and Pattern Recognition Workshops. 23–28 June 2014, Columbus, OH: IEEE. 490–7.
18. Gisbrecht A, Schulz A, Hammer B. Parametric nonlinear dimensionality reduction using kernel t-SNE. Neurocomputing 2015; 147:71–82.
19. Ali MM. Probability models on horse-race outcomes. J Appl Stat 1998; 25:221–9.
20. Wongvorachan T, He S, Bulut O. A comparison of undersampling, oversampling, and SMOTE methods for dealing with imbalanced classification in educational data mining. Information 2023; 14:54.
21. Allan K. Classifiers. Language 1977; 53:285–311.
22. Friedman JH. Greedy function approximation: a gradient boosting machine. Ann Stat 2001; 29:1189–232.
23. Mutai CK, McSharry PE, Ngaruye I, Musabanganji E. Use of machine learning techniques to identify HIV predictors for screening in sub-Saharan Africa. BMC Med Res Methodol 2021; 21:159.
24. He J, Li J, Jiang S, et al. Application of machine learning algorithms in predicting HIV infection among men who have sex with men: model development and validation. Front Public Health 2022; 10:967681.
25. Birri Makota RB, Musenge E. Predicting HIV infection in the decade (2005–2015) pre-COVID-19 in Zimbabwe: a supervised classification-based machine learning approach. PLoS Digit Health 2023; 2:e0000260.
26. Huang J, Galal G, Etemadi M, Vaidyanathan M. Evaluation and mitigation of racial bias in clinical machine learning models: scoping review. JMIR Med Inform 2022; 10:e36388.
27. Facente SN, Lam-Hine T, Bhatta DN, Hecht J. Impact of racial categorization on effect estimates: an HIV stigma analysis. Am J Epidemiol 2022; 191:689–95.
28. Ai Fairness 360. Lf Ai Incubation Project. [Internet]. Available at: https://aifairness-360.org/ Accessed 30 January 2024.