AI asActiveAgent for Creative Exploration in Design Pedagogy
Abstract
In Architecture, Engineering, and Construction (AEC), Artificial Intelligence (AI) is often used to optimize and automate procedural, repetitive, and deterministic tasks. These tasks do not have a strong affinity with design exercises intentionally characterized by transcending optimization, where qualitative and quantitative aspects coexist and frequently involve both asking the right questions and answering them. Accordingly, this paper will consider an iterative human-machine collaboration within a design studio to test how AI algorithms (automatic object identification, Fourier transform, RGB analysis, and Word3Vec) and data analysis (automatic crawlers and data preprocessing) can fit within an architectural design exercise that investigates the relationship of architecture and the natural landscape, through a series of small-scale projects.
The design workflow is organized in four steps depending on the data modality analyzed. a), Identification of user needs and context (images and text data from social networks). b) Storytelling and branding (text data from digital books), c) Curating and modeling space (point cloud data from terrestrial laser scanning). d) Materialization of the project (via 3D printing and game engines). To validate our approach, we compared the proposed design workflow with a classical one that followed a similar series of design operations: a) Site analysis, b) Design brief, c) Design response, and d) Design representation. The design framework presented in this paper brought together tools already well explored in design practices (point clouds, 3D printing, and game engines) with newly explored tools (AI algorithms) that resulted in design solutions that could only be articulated through such a joint effort with artificial and human intelligence.
Keywords: Artificial Intelligence, Architectural Design, Social Media Data, Game Engines, Pedagogy.
1. Introduction
Artificial Intelligence excels at solving problems with clear answers, processing data, and performing repetitive tasks, freeing up time for architects to work on more open questions that require creativity. With today's abundance of Data and AI algorithms, AEC practitioners can effectively encode, organize, and generate spectral and spatial information based on the data itself. However, it is still challenging to integrate such technologies in design workflows as an active tool for creativity and exploration. In the famous 1969 Eames Design Diagram (Neuhart & Eames, 1997), Charles Eamespostulatedthatdesign processescould only besuccessfulwhentheyidentify the overlapping needs of the designer, the client, and "the concerns of society as a whole." While the interplay between the first two stakeholders is well-researched and documented, the third has remained an abstract concept that relies on the designer's interpretation of the gestalt. Christopher Alexander’s(1964)Notes ontheSynthesis of Form could be considered an attempt to grapple with and reconcile the complexities of design methodology with a mathematical and computational basis, but also responding to the larger notion of “program” beyond the brief settled on between the designer and client. Ultimately, Alexander concludes that his was an attempt “to show that there is a deep and important underlying structural correspondence between the pattern of a problem and the process of designing a physical form.” These patterns (datasets) are complex and varied and relied on the designer’s experience, judgment, and foresight on an individual basis to orchestrate and materialize as built form. With big data from social media, we can now aggregate and analyze datasets that provide insight into the concerns and opinions of the broader public at scales previously unfeasible. Within the AEC industry, AI is often used to optimize and automate procedural,repetitive,anddeterministictasks.Thesetasksdonothave astrongaffinitywithdesign exercises intentionally characterized for transcending optimization, in which qualitative and quantitative aspects co-exist (Lawson, 1990) and are often just as much about asking the right questions as opposed to answering them. In response to the former, this article takes a particular stance by considering an iterative collaboration between humans and machines to test how AI algorithms and data analysis can fit within an architectural design exercise (at the undergraduate level) that investigates the relationship to placemaking in a natural landscape, through a range of small-scale projects.
2. State of the Art
One of the main concerns regarding AI in architectural design is, “Can a machine or an algorithm produce a creative output?” The latter often relates to the concept of “Lovelace’s Objection,” enforced by Alan Turing, which calls into question if a machine is limited to merely being able to act or assess indistinguishably from a human; Turing argues that the machine can merely originate that which we as humans know how to order it to (Franceschelli and Musolesi, 2021). Such a question is one of the fundamental questions that pertain to architecture, as one might question whether an AI algorithm can act as a seed for inspiration and creativity within a design process. While there are examples of AI being used to develop conceptual designs, they are implemented within a fixed viewpoint and tasked with a specific aspect instead of a holistic overview of the entire design, such as to develop and determine an adequate overall shape or footprint for the building program (Castro Pena et al., 2021), automatically generate a floor plan (Chaillou, 2020), or generated images of facades (Ali et al., 2021).
3. Methodology and Data
In this article, we will divert towards a different avenue that uses AI as an explorative tool for creativity and not an optimization tool for productivity. With such a motivation, this article presents a fourfold methodology to implement AI and visualization tools in a design studio. The AI algorithms implemented in this work have been coded using built-in functions within the software Wolfram Mathematica (https://www.wolfram.com/mathematica/, accessed May 2022). The algorithms, software, and data sources used in the methodology are described in Table 01, which also displays which part of the methodology they have been used. In the following paragraphs, we will describe each method/module in more detail. From the four modules, we will concentrate on the explanation of Methods 2.1 and 2.2, as both use AI-powered tools and different datamodalities.Methods2.3and2.4will havealess in-depth analysis as theauthorshaveexplored both in additional articles that will be cited in each section and other relevant publications about the subject.
Table 01 Description of Types of Algorithms and Software used in each method within the methodology
3.1. Identification of User Needs and Context (images and text data from social media)
By the end of 2022, it is estimated that there will be 3.96 billion social media users worldwide (Yu et al. 2020). This is more than half the number of people living on the planet. One of the most significant opportunities offered by such data is the potential to understand, follow or analyze a specific topic from a third-person view, where the topic is not rooted in a specific place or time but can be viewed from various geographic locations and in different time ranges (Pandey and Purohit, 2018). Hence, the main objective of this module was to capture a concept through time and space from a third-person view. The students' first task was to create a list of concepts that resonated with their design intentions for their projects. This was followed by an analysis of social media posts that were linked to the site, either from hashtags or geolocations, to create a new list of concepts based on the needs of the users. By joining the two lists, each student created a
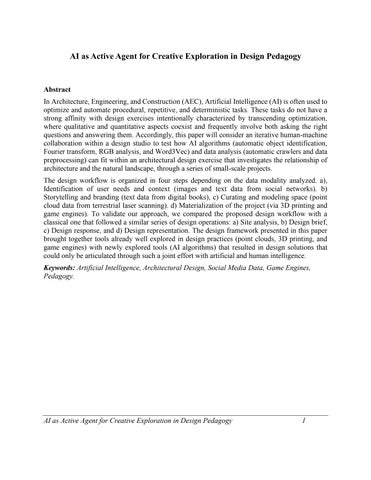
combination of keywords close to their initial design intent and user needs. These keywords were used to collect social media posts via an automated Twitter crawler without a geolocation constraint, collecting over 5.000 social media posts per student from 2010 to 2021. Each search was different because each keyword combination was different. The students then initiated a process of automatically encoding the image data from the posts using AI feature extraction algorithms in four ways: RGB analysis (Chang et al., 1996), Edge Detection (Nadernejad et al., 2008), Fouriertransform (Nussbaumer,1981),and automaticobject detection(Huanget al., 2018). Each student selected a method to encode their data, which was meaningful to their interest. After having the data numerically encoded, they input it into an unsupervised clustering algorithm called a Self Organizing Map (SOM) to represent the data in a reduced 2-dimensional space (Kohonen, 1990). As the posts are multimodal, they can be visualized using either their image (Figure 02) or text representation (Figure 01); thus, this reduced 2-dimensional grid can be used to understand the type of posts that each student collected with the selected keyword combination.

Figure 01 A compilation of SOM grids (output from an unsupervised clustering algorithm) organized by the text data from the collected social media posts
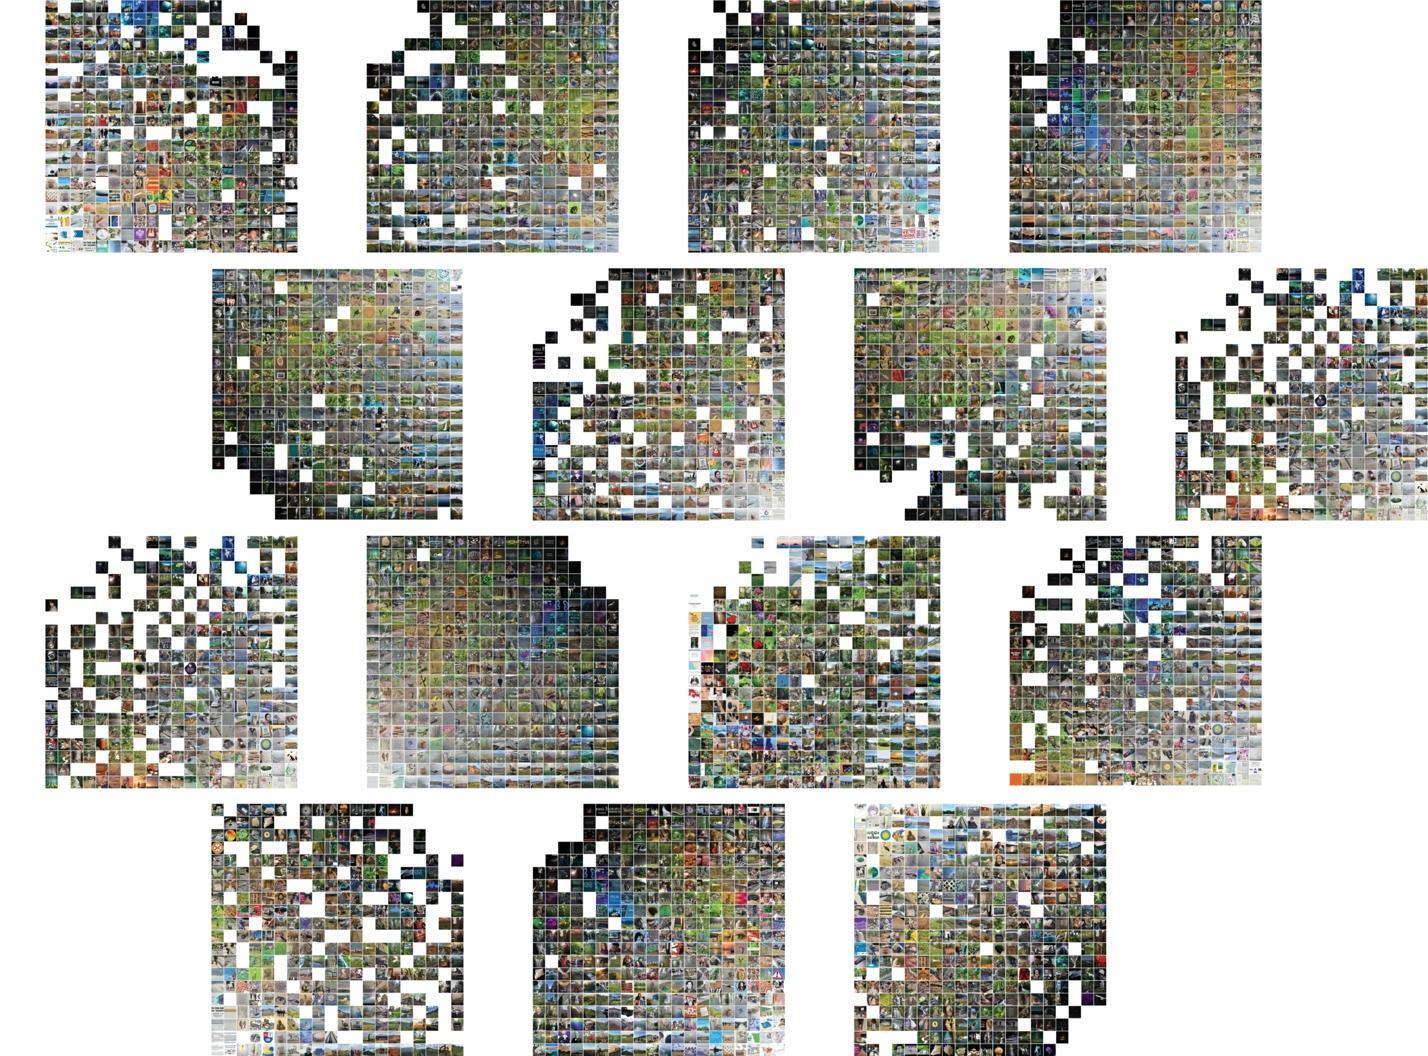
Figure 02 A compilation of SOM grids (output from an unsupervised clustering algorithm) organized by the image data from the collected social media posts Consequently,theycan select agroupofcells (that bythemselvesaregroups ofsimilardatapoints) to continue with the exploration that aims at creating an atmospheric understanding of such initial concepts for the design intervention. (Figure 03), After selecting a group of images, the students started a collage process to create an atmospheric image (Figure 04). Such images are supposed to capture their intention through concepts they want to engage in their designs. Through this exploration, the students had a different understanding of the site that included a third person characterized by the users and their activities. This approach goes beyond the typical site analysis that relies on often cursory site visits and mappings related to the site's physical infrastructure and targeted interviews.
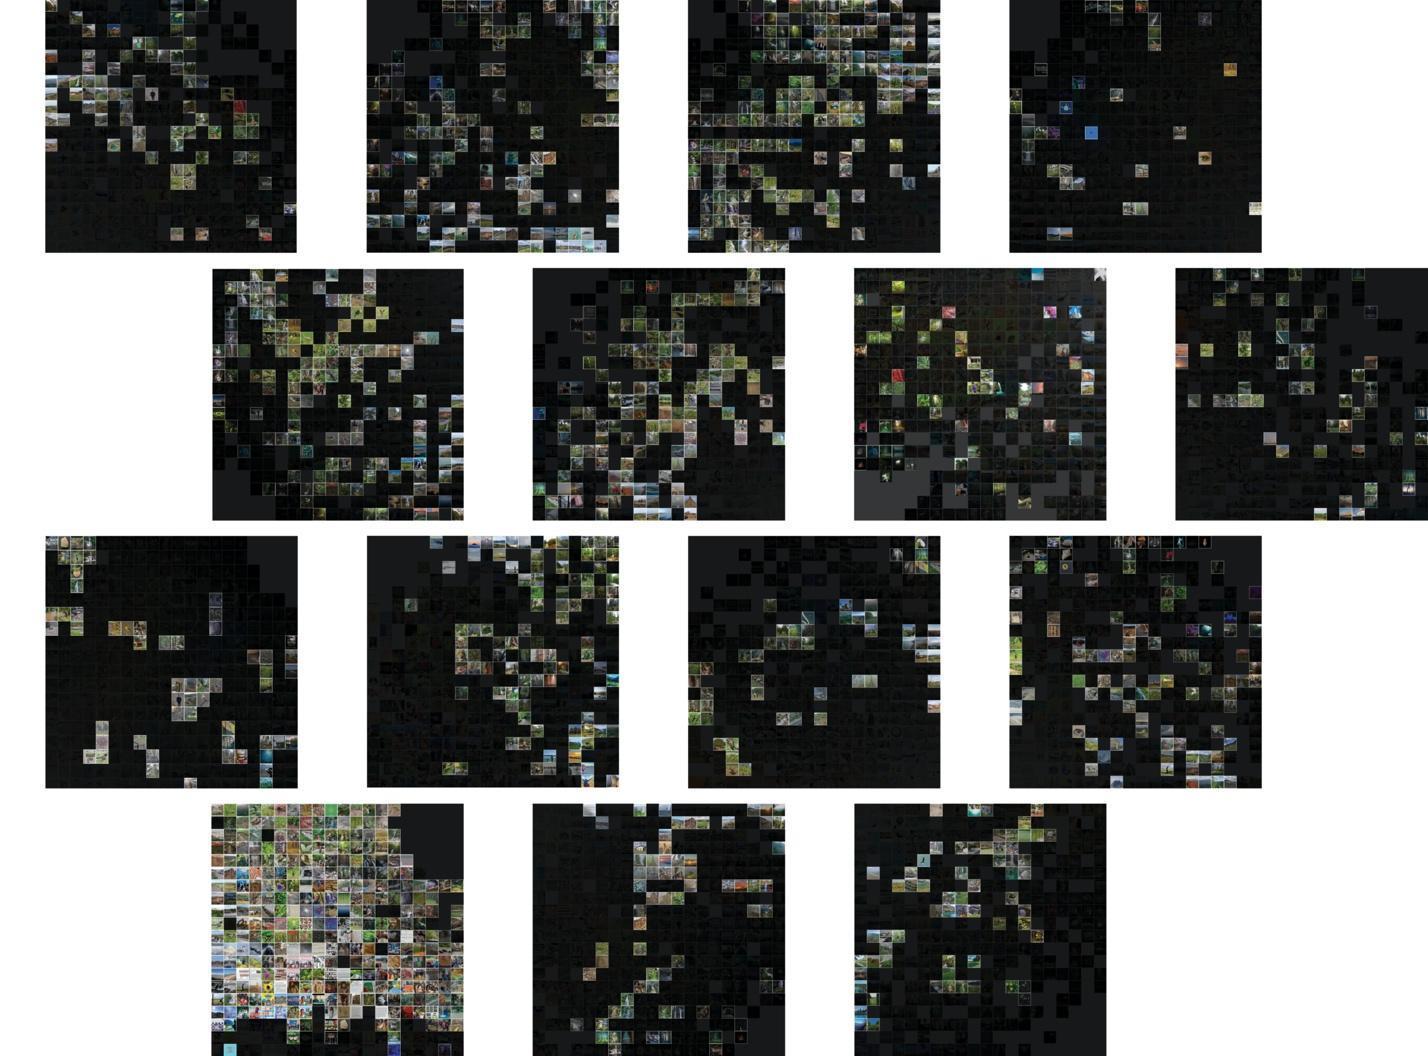
Figure 03 A compilation of SOM grids (output from an unsupervised clustering algorithm) organized by the image data from the collected social media post, overlaid with the selection by each student of images that resonated with their initial concepts
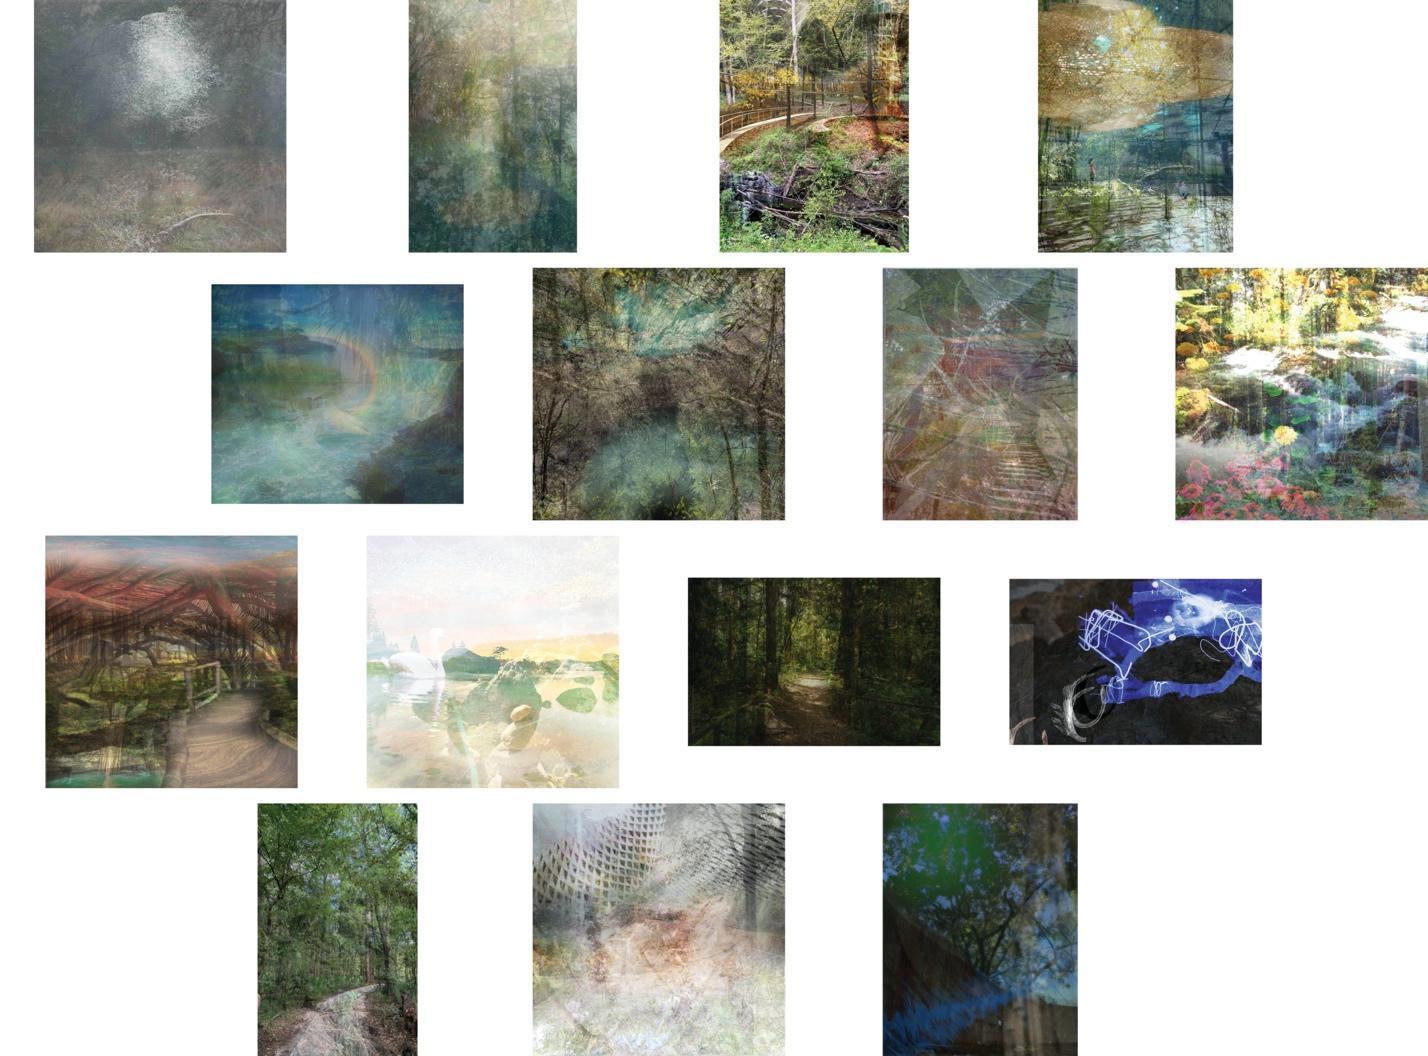
Figure 04 Atmospheric images, a collage of selected images organized by SOM, these images are capturing the design intentions that students wanted to materialize in their designs
2.2. Storytelling and Branding (text data from digital books)
A common approach to writing a design brief is to find inspiration from books or articles dealing with theoretical or philosophical quests describing concepts that are considered essential for the experience of the proposed design solution. However, one is often constrained to a particular line of thought by exploring known books or literary samples previously read. Nowadays, with the assistance of AI, we can expand our horizons and access various libraries that offer multiple lines of inquiry. In this module, the students used ALICE (https://ask.alice-ch3n81.net), an AI power search engine that relates authors by the similarity of their text and displayed paragraphs that included specific keywords to describe a concept. ALICE runs Natural Language Processing algorithms to create word embedding from books and then uses an unsupervised clustering algorithm, Self Organizing Maps, to organize clusters of similar texts. The writing exercise focused on using ALICE (AI tool) to power creativity and expand the students' horizons when conceptualizing a project. In this module, the students were encouraged to write a design brief
including the keywords developed in Method 2.1 to describe their possible interventions. They then used those same keywords to find quotes from a curated library of books to enrich their text, approaching the task as a collaborative writing exercise. After querying ALICE with their keywords, students are exposed to a list of paragraphs that describe a particular line of thought and can be used to brand their existing design brief description. The final text included at least five quotes meaningfully joined in each text description from the design brief. By using an AI-powered tool to help write a design brief, the standard individualistic approach was challenged as now the discussion was enriched by various authors addressing the same topic to articulate a combinatorial description of the design intentions. Image 05 displays an excerpt from a design brief:
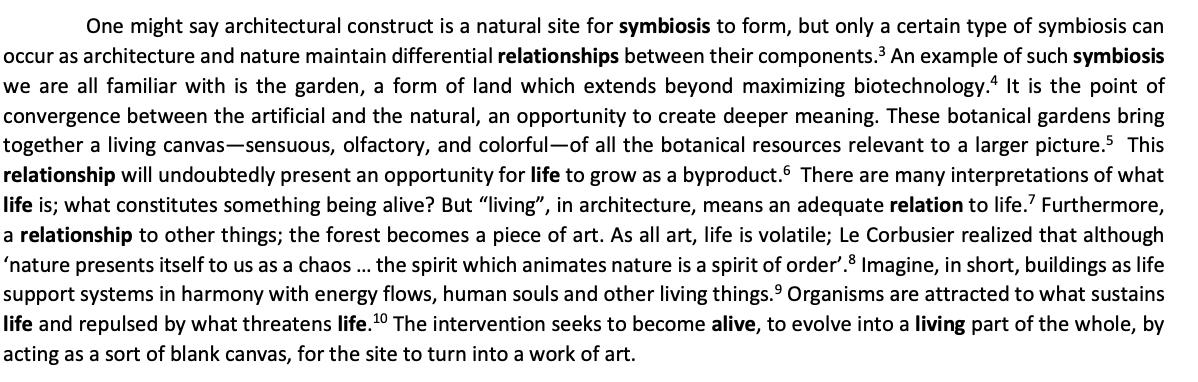

Figure 05 An excerpt from a design brief, where the concepts defined by a student are shown in bold and the text from ALICE is joined in-between and cite on the footnotes.
2.3. Curating and Modelling Space (from point cloud data by terrestrial laser scanning)
Designers commonly use sophisticated computer-based software to represent three-dimensional projects (e.g., Rhino, Revit, Blender, Cinema 4D, etc.); one of the most challenging problems with these software visualizations (traditional polygon surface modeling) is simulating landscape at high fidelity. This task is often problematic due to the significant consumption of time and resources (de Souza et al., 2015). To overcome this limitation, we propose to work with point cloud models. Point cloud models are the digital representation of a set of three-dimensional coordinates that precisely measure the environment; they can be interpreted as GPS coordinates having X as latitude, Y as longitude, and Z as the elevation. We used two methods to collect a point cloud model of the site. First, students used their mobile phones (with an integrated LIDAR
laser scanner) to gather point cloud data of specific places. Second, we used terrestrial LIDAR laser scanning to capture the overall site. All the point cloud models were registered using Cloud Compare (Girardeau-Montaut, 2016) and were further segmented according to each student's preference and design intentions. By exploring the site through the point cloud model, students had a new understanding of the site as the porosity of the point clouds make it possible to see through walls and surfaces, revealing "hidden" spaces and unique views otherwise inaccessible. The idea of a 3D model that represents the exact reality empowers the beginning of the design process, knowing that their design interventions are represented with precision and conviction. (Nir & Capeluto, 2005, Saldana Ochoa 2017). By working with a point cloud model, students can index the site differently; they had the opportunity to explore areas on the site that were physically inaccessible and could work directly on a precise representation of the site. This precise model was transformed into a mesh in Rhino and used to CNC fabricate a physical site model (Figure 06).


Figure 06 Images of the physical model of the site, on the left we can observe the layers defined by the CNC machine on the right is the final result by smoothing the surface, the trees are located exactly where the existing trees are in the site.
2.4. Materialization of the Project (through 3D printing and game engines)
Both the entertainment industry and the design community benefit from game engines and animation walkthroughs to help convey and explore design projects (Anifowose et al., 2020). Although AEC practitioners do not directly design interactive and entertainment games, many have pushed the boundaries of virtual reality to express spatial ideas (Hoon and Michale, 2003). Therefore, for this module, after segmenting their point cloud model in Cloud Compare, students movedto Rhino to concretizetheirdesign intentions, keeping in mindboth theatmosphericimages and the design brief as sources of inspiration for their projects. They then imported their design solutionsintoCloudComparetotransformthe3Dmodels(traditionalpolygonalsurfacemodeling) into point cloud models while retaining the materials assigned from Rhino. After this process, the students imported the point cloud models into Unity. Once in Unity, they used Point Cloud Viewer and Tools to visualize the point cloud models. A critical aspect of this module was deciding which objects should be enhanced. Currently, Unity can only display 20 million points per scene. Hence, the students made conscious decisions regarding which elements to populate with more points, prioritizing elements that make up the most significant gestures of the proposal and with fewer points, thosethat aredistant ornon-essential.They usedcameras andagents to createan interactive visualization of their project similar to the workflow explained in the work of Leitão (2020) and Barsan et al. (2020). Figure 07 shows the example of two projects. Finally, the models were 3D printed using the Rhino digital model to obtain a physical model for their final presentation.


Through this methodology, we showcased a series of modules that explored methods for implementing AI into an architectural pedagogy at the undergraduate level. The results of this research showed that the inclusion of AI and big data analysis can augment various creative abilitiesallowing designers to focus onquestions that requirehumancreativityratherthanmachine productivity. Recognizing that certain phases of the design process require iterative and recursive thinking; the application of AI can be used to augment and expose potentials and possibilities within phases that require parallel and lateral associative thinking akin to brainstorming. These methods are applied to the early phases of schematic design and territories in which the broad use of AI techniques as generative, interpretive tools to convey conceptual and narrative ideas that are in the early stages of exploration. The impact can be seen particularly in the first and third steps of the design process outlined above because they take particular care of the "concerns of society as a whole" (Eames & Eames, 1996) as they consider a collective input–social media data and excerpts from books. With the proposed validation process, we were able to identify which design abilities were augmented in each of the steps in the proposed design workflow.
a) Identification of User Needs and Context vs. Site Analysis; the ability to grasp a concept through time (10 years) and space (various geographical locations) by exploring its representation on thousands of social media images to help render an atmospheric understanding of the users' needs.
b) Storytelling and Branding vs. Design Brief; the ability to co-author a richer narrative by exploring thousands of architectural theory and philosophy quotes simultaneously, organized around the desired concepts defined in method 2.1.
c) Curating and Modelling Space vs. Design Response; the ability to test various design solutions at a greater speed than before, thanks to working on a precise digital site representation via point cloud models.
d) Materialization of the Project vs. Design Representation; the ability to represent complex geometry through physical 3D prints and virtual reality.
4. Conclusion
In a cursory attempt to summarize a more conventional model of site analysis, we may refer to the classic 1981 book Site Analysis: Diagramming information for architectural design by Edward T. White (White, 1983). Traditional site analysis tends to focus on overt geographical features such as figure/ground relationships, vehicular and pedestrian circulation, sightlines, topography, etc., such that even the diagrammatic representation of these sometimes-transient factors tends to be deterministic and static, with clear delineation of edges, boundaries, and trajectories. White acknowledges that the “site is never inert but is an ongoing set of very active networks that are intertwined in complex relationships” (White, 1983), yet its presentation and pursuit of graphical and narrative clarity through abstraction oftentimes results in oversimplification. While useful as a design tool for understanding and synthesis, these diagrams fall short of describing the nuances and complexities of a site. They can perform well when conditions are binary in nature such as in urban contexts; however, when representing natural landscapes with gradations and overlaps the
single level of abstraction and resolution tends to be overly reductive. While certainly representational techniques have progressed substantially since White’s treatise, the fundamental conceptual approach to site analysis has largely stayed the same in academia and practice, almost 40 years later. This issue is particularly exacerbated when designing for the public realm, in which the user base and constituents are ill-defined, leading to a scenario in which one of the primary stakeholdersisessentiallyinabsentia.Whiletheclientistechnicallythegovernmentinthesecases, the user’s true public sentiment may not be faithfully represented. If we understand the expansive definition of site analysis (Module 2.1 atmospheric image) to encompass society and culture, and program as a reflection of such concerns (Module 2.2 writing the design brief), the tools employed in the research begin to construct a way of symbolically synthesizing both data and the designer’s intent, as a powerful methodology for design exploration. The SOM used in Module 2.1 served to capture “the concerns of society as a whole” across a specific geospatial territory as well as over time, and provide a broader holistic view of public sentiment, The point cloud model (Module 2.3), due to its dual nature of accuracy and abstraction, served as a living site the students could refer, analyze, and in some cases edit or recompose to work with a design narrative (Module 2.2), and ultimately leverage to materialize their projects in both physical and virtually experiential formats (Module 2.4).
Let us return to Christopher Alexander’s (1964) assertion that the designer never fully understands the context in its entirety, but in “pieces” that are major aspects of the problem to be focused on. As “there are limits on the number of distinct concepts which we can manipulate cognitively at any one time,” one must prioritize and sift through the fields of information to uncover and expose poignant design issues. Characterized as a “good fit” between form and context, architects strive for the tension that such a relationship creates, understanding that the context in which it exists is constantly in flux (Arango, Dubberly, 2018). The capability of AI-assisted workflows that enable the uncovering and symbolic representation of such patterns is at the core of Modules 2.1 and 2.2 described above. While prior algorithmic processes strive to be deterministic in search of a unitary response, the current generation of AI models can deal with non-deterministic problems when given enough data, finding the irregularities that lead to form as the “diagram of forces,” characterized by D'Arcy Wentworth Thompson (1956) in On Growth and Form. Acknowledging that there is still much work to do to ensure ethical and bias-free interpretation of data, it is important that students take responsibility for the data we use, recognizing that AI is not solely to optimize processes but can be used to power creativity. Having “limitations in tools is not new to architectural processes,” but a thorough understanding of such processes is critical such that the tools are not misused or misunderstood (Meekings and Schnabel, 2016). The design framework presented in this article joined already well-explored tools in design practices (point clouds, 3D printing, and game engines) with newly explored tools (AI algorithms) that resulted in design solutions that could only be articulated by such joint effort with artificial and human intelligence. “In its largest sense, design signifies not only the vague, intangible, or ambiguous, but also the strivetocapturetheelusive.”(Kostas,2006),andthisnewgenerationofAItoolsarewell-equipped to help uncover the elusive and augment the perception of human designers.
5. Acknowledgement
The authors thank the students in the course for their openness to trying new tools all the time.
References
Anifowose, Hassan, Wei Yan, and Manish Dixit. "BIM LOD+ Virtual Reality Using Game Engine for Visualization in Architectural & Construction Education." arXiv preprint arXiv:2201.09954 (2022).
Alexander, Christopher. Notes on the Synthesis of Form. Vol. 5. Harvard University Press, 1964.
Arango, Jorge. Living in information: responsible design for digital places. Rosenfeld Media, 2018.
Barsan-Pipu, Claudiu, Nathalie Sleiman, and Theodor Moldovan. "Affective Computing for Generating Virtual Procedural Environments Using Game Technologies." (2020).
CastroPena,M.LuzCastro,AdriánCarballal,NereidaRodríguez-Fernández,IriaSantos, andJuan Romero. "Artificial intelligence applied to conceptual design. a review of its use in architecture." Automation in Construction 124 (2021): 103550.
Ceylan, Salih. "Artificial Intelligence in Architecture: An Educational Perspective." In CSEDU (1), pp. 100-107. 2021.
Chaillou, Stanislas. "Archigan: Artificial intelligence x architecture." In Architectural intelligence, pp. 117-127. Springer, Singapore, 2020.
Chang, Young-Chang, and John F. Reid. "RGB calibration for color image analysis in machine vision." IEEE Transactions on image processing 5, no. 10 (1996): 1414-1422.
Thompson, Darcy Wentworth, and D'Arcy W. Thompson. On growth and form. Vol. 2. Cambridge: Cambridge university press, 1942.
de Souza, Douglas Lopes, Andressa Carmo Pena Martinez, and Denise de Mônaco Santos. "The potential use of laser scanner in urban contexts." (2015).Franceschelli, G., & Musolesi, M. (2021). Creativity and Machine Learning: A Survey. ArXiv:2104.02726 [Cs].
Girardeau-Montaut, Daniel. "CloudCompare." France: EDF R&D Telecom ParisTech (2016).
Hoon, Michael, and Michael Kehoe. "Enhancing architectural communication with gaming engines." (2003).
Huang, Rachel, Jonathan Pedoeem, and Cuixian Chen. "YOLO-LITE: a real-time object detection algorithm optimized for non-GPU computers." In 2018 IEEE International Conference on Big Data (Big Data), pp. 2503-2510. IEEE, 2018.
Kohonen, Teuvo. "The self-organizing map." Proceedings of the IEEE 78, no. 9 (1990): 14641480.
Kostas, Terzidis. "Algorithmic architecture." (2006).
Ali, Ahmed Khairadeen, and One Jae Lee. "Facade Style Mixing using Artificial Intelligence for Urban Infill." (2021).
Leitão, António, R. E. N. A. T. A. Castelo-Branco, And Guilherme Santos. "Game Of Renders." (2020)
Meekings, Scott, and Marc Aurel Schnabel. "Big data on individuals in the architectural design process: combining individual’s data with the architects toolset." International Journal of Parallel, Emergent and Distributed Systems 32, no. sup1 (2017): S66-S72.
Nadernejad, Ehsan, Sara Sharifzadeh, and Hamid Hassanpour. "Edge detection techniques: Evaluations and comparisons." Applied Mathematical Sciences 2, no. 31 (2008): 1507-1520.
Neuhart, and Eames, Diagram reprinted in Helene Lipstadt's article "Natural Overlap: Eames, C., and Eames R., and the Federal Government" in The Work of Charles and Ray Eames: A Legacy of Invention. New York: Abrams. 13. (1996)
Nir, Eyal, and Capeluto Guedi. "Smart cloud-of-points model: Point-based digital media and tools for architectural design." (2005).
Nussbaumer, Henri J. "The fast Fourier transform." In Fast Fourier Transform and Convolution Algorithms, pp. 80-111. Springer, Berlin, Heidelberg, 1981.
Pandey, Rahul, and Hemant Purohit. "Generic architecture of a social media-driven intervention support system for smart cities." In Proceedings of the Workshop Program of the 19th International Conference on Distributed Computing and Networking, pp. 1-6. 2018.
White,EdwardT.SiteAnalysis,Diagramming InformationforArchitectural Design.Architectural Media, 1983.
Yu, Yanan, Marguerite Moore, and Lisa P. Chapman. "Social network analysis of an emerging innovation: direct-to-garment printing technology." Journal of Fashion Marketing and Management: An International Journal (2020).