
Originalpapers
ComputersandElectronicsinAgriculture
journalhomepage: www.elsevier.com/locate/compag

Aframeworkforthemanagementofagriculturalresourceswithautomated aerialimagerydetection

KarlaSaldanaOchoa
⁎,1,ZifengGuo1
ETHZürich,InstituteofTechnologyinArchitecture,ChairforComputerAidedArchitecturalDesign,Switzerland
ARTICLEINFO
Keywords: Treesdetection Streetsegmentation Agriculture Machinelearning CNN UAV
ABSTRACT
Theacquisitionofdatathroughremotesensingrepresentsasignificantadvantageinagriculture,asitallows researcherstoperformfasterandcheaperinspectionsoverlargeareas.Currently,extensiveresearcheshavebeen doneontechnicalsolutionsthatcanbenefitsimultaneouslyfromboth:vastamountsofrawdata(bigdata) extractedfromsatelliteimagesandUnmannedAerialVehicle(UAV)andnovelalgorithmsinMachineLearning forimageprocessing.Inthisexperiment,weprovideanapproachthatfulfillsthenecessitiesofrapidfood security,assessment,planning,exploitation,andmanagementofagriculturalresourcesbyintroducingapipeline fortheautomaticlocalizationandclassificationoffourtypesoffruittrees(coconut,banana,mango,andpapaya) andthesegmentationofroadsintheKingdomofTonga,usinghigh-resolutionaerialimagery(0.04m).
Weusedtwosuperviseddeepconvolutionalneuralnetwork(CNN):thefirst,tolocalizeandclassifytrees (localization)andthesecond,tomaskthestreetsfromtheaerialimageryfortransportationpurposes(semantic segmentation).Additionally,weproposeauxiliarymethodstodeterminethedensityofgroupingsofeachof thesetreesspecies,basedonthedetectionresultsfromthelocalizationtaskandrenderitinDensityMapsthat allowcomprehendingtheconditionoftheagriculturesitequickly.Ultimately,weintroduceamethodtooptimizetheharvestingoffruits,basedonspecificsceneries,suchasmaximumtime,pathlength,andlocationof warehousesandsecuritypoints.
1.Introduction
LocatedinthePacificOcean,theKingdomofTongaextendsoveran areaof362,000km2.Withapopulationof107.122inhabitantsin2016, 58.4%ofitspopulationdependsonagricultureandforestryasaprimarysourceofincomeandakeydriverforeconomicgrowth.Itsmost prominentagriculturalproductsarebananas,coconuts,coffeebeans, vanillabeans,androotssuchascassava,sweetpotato,andtaro2 (HalavatauandHalavatau,2001).
MostofthecountriesinthePacificregionareexposedtohigh-risk disastersincludingcyclones,earthquakes,tsunami,stormsurge,volcaniceruptions,landslides,anddroughts,e.g.,Tongaisaffectedby morethanonetropicalcycloneeveryfouryears.Thesesrecurrentdisasterscausedamageandlossestoagriculture,foodsecurityandlocal economy.Inthelastyears,accordingtothe2015Reportofthe Secretary-GeneralontheImplementationoftheInternationalStrategy
forDisasterReduction;disastersworldwidecostaroundUSD1.5trillion ineconomicdamage.Thefrequencyandseverityofnaturaldisasters areincreasing,revealinganurgentneedtostrengthentheresilienceof foodassessmentsandsecurity(FAO,2015).
Tounderstandhowlocalagricultureandfoodsecuritywereaffected byanaturaldisaster,aerialimageryfromthesiteandthesucceeding mappingandclassificationofdataarerequired.ThefieldofRemote Sensingoverthepastdecadeshasrobustlyinvestigatedfastermethods tocollect,produce,classify,andmapearthobservationdata.Inrecent years,theuseofUnmannedAerialVehicles(UAV)tocollectdatahas increasedrapidly,mainlyfortheirinexpensivehardwareandrapidly deployforthecollectionofimagery.Inparallel,thedevelopmentof newtechnicstodetectobjectsinopticalremotesensingimagerywere activelyexplored3 byseveralscholars.In1991anautomatictreedetectionanddelineationfromdigitalimagerywasperformedby Pinz (1991) whoproposedaVisionExpertSystemusingaerialimagery.He
⁎ Correspondingauthor:BuildingHIB,FloorE15,Stefano-Franscini-Platz1,CH-8093Zurich,Switzerland. E-mailaddress: saldana@arch.ethz.ch (K.SaldanaOchoa).
1 Thetwoauthorscontributedequallytothiswork.
2 Theprocessingofcoconutsintocopraanddriedcoconutwasoncetheonlysignificantindustryandonlycommercialexport.
3 Thisprocessdetermineswhetheragivenaerialorsatelliteimagecontainsoneormoreobjectsbelongingtotheclassofinterestandlocatethepositionofeach predictedobjectintheimage(ChengandHan,2016).
https://doi.org/10.1016/j.compag.2019.03.028
Received12October2018;Receivedinrevisedform18February2019;Accepted27March2019
0168-1699/©2019ElsevierB.V.Allrightsreserved.
wasabletolocatethecenteroftreescrownandestimatetheirradius usinglocalbrightnessmaxima.In1995 Gougeon(1995),launcheda rule-basedalgorithm,thatfollowedthevalleysofshadowsbetweentree crowinagroundsampleddistancefromdigitalaerialimagery. Hung etal.(2006) proposedavision-basedshadowalgorithmfortreecrowns todetectandclassifyimageryfromUAV,usingcolorandtextureinformationtosegmentregionsofinterest. Hassaanetal.(2016) presentedanalgorithmtocounttreesinurbanenvironmentsusingimage processingtechniquesforvegetationsegmentationandtreecounting. Byapplyingak-meansclusteringalgorithmandsettingthresholdvaluestogreenclusterscenters,thealgorithmwasabletosegmentoutthe greenportionoutofanyimagewithoutanynoise.
Today,thedevelopmentofmachinelearningapproachesprovides researcherswithaconceptualalternativetosolveproblemsinthe mentioneddomainswithoutpredefiningtherulesforaspecifictask. Instead,modelscanlearntheunderlyingfeaturesemergingfromalarge amountofdata.Oneofthemostprominentapproachescomesfromthe fieldofimageprocessingandcomputervisionnamedConvolutional NeuralNetwork(CNN).Thealgorithmisbasedonanend-to-end learningprocess,fromrawdatatosemanticlabels,whichisanessential advantageincomparisonwithpreviousstate-of-the-artmethods (Nogueiraetal.,2017).Thismodeloutperformsalltheotherapproachesintaskslikeimageclassification,objectrecognitionandlocalization,andpixel-wisesemanticlabeling.Theearlyimplementation ofCNNby LeCunetal.(1998) achieved99.2%ofaccuracyinhandwritingdigitsrecognitionandledtheboostofCNNbasedimageprocessinginthefollowing20years.Inrecentyears,largeonlineimage repositoriessuchasImageNet(Dengetal.,2009),andhigh-performancecomputingplatformslikeGPUacceleration,havecontributed significantlytothesuccessofusingCNNinalarge-scaleimageand videorecognition.CompetitionsandchallengesliketheImageNet Challenge(Russakovskyetal.,2015)andVisualObjectClassesChallenge(Everinghametal.,2015)attractmanyresearchersandasaresult,state-of-artCNNmodelssuchasAlexNet(Krizhevskyetal.,2012) andVGG-Net(Simonyan&Zisserman,2014)respectively–both availableonline.
Moreover,researcherscandirectlyuseortrainthesemodelsontheir datasetwithnoneedtodesignitsarchitecture,e.g.,YOLOmodel (Redmonetal.,2016)achievedanexcellentperformanceonrecognitionandmadethereal-timeobjectlocalizationpossible.Inthemeantime, Longetal.(2015) withtheirnovelmodelFCNachieved20% relativeimprovementinpixel-wisesemanticsegmentationinthe PASCALVOCchallenge.Also,SegNetproposedby Badrinarayanan etal.(2015) alsoachievedcompetitiveperformanceasitisdesignedto beefficientbothintermsofmemoryandcomputationaltimeduring prediction–Itisalsosignificantlysmallerinthenumberoftrainable parametersthanothercompetingarchitectures.
Theuseofdeeplearning4 inRemoteSensinghasgrownexponentiallysinceitcaneffectivelyencodespectralandspatialinformationbasedonthedataitself.Duringthelastyears,considerable effortshavebeenmadetodevelopvariousmethodsforthedetectionof differenttypesofobjectsinsatelliteandaerialimageswithCNN,such asroad,vegetation,tree,water,buildings,cars,etc.–IntheConclusion sectionweaddressquantitativemeasurestosupporttheeffectivenessof theproposedapproachcomparedtoexistingapproaches: Chenetal., 2014;Luusetal.,2015;Luetal.2017;Kussuletal.,2017;Mortensen
4 Deeplearningisabranchofmachinelearningthatreferstomulti-layered interconnectedneuralnetworksthatcanlearnfeaturesandclassifiersatonce, i.e.,auniquenetworkmaybeabletolearnfeaturesandclassifiers(indifferent layers)andadjusttheparameters,atrunningtime,basedonaccuracy,giving moreimportancetoonelayerthananotherdependingontheproblem.End-toendfeaturelearning(e.g.,fromimagepixelstosemanticlabels)isthesignificantadvantageofdeeplearningwhencomparedtopreviousstate-of-the-art methods(Nogueiraetal.,2017).
etal.,2016;Sørensenetal.,2017;Miliotoetal.2017.
Inthispaper,weaimtoprovideanapproachthatfulfillsthenecessitiesofrapidfoodsecurity,assessment,planning,exploitation,and managementofagriculturalresources;weproposeaframeworktoefficientlylocalizeandclassifyfourtypesoftropicalfruits(coconut,banana,mango,andpapaya).Wepursuethelatterbyamethodtoautomaticallyidentifyandsegmentroads,sothatfastestandsafestwaysto transportcropstoadjacentwarehousesorsecuritypointscanbedetected.
Todoso,weusedtwosuperviseddeepCNNs;thefirstCNNmodel performsthetaskofobjectlocalization,tolocalizeandclassifythetype oftrees.Thelocationsofthetreesarenotonlyusedtocontrolagriculturalresources,butalsoinscenariosofnaturaldisasterstheycanbe comparedwiththepreviousstatetohaveabetterunderstandingon howlocalagricultureandfoodsecuritywereaffected.Thisinformation candirectlyinformandacceleratesubsequentreliefefforts. Additionally,weproposeamethodtodeterminethedensityofeachof thesetreestoimproveproductivity,basedonthedetectionresultsof thefirstCNNandpresentedasDensityMapstoquicklycomprehendthe conditionoftheagriculturalsite.
ThesecondCNNmodelperformsasemanticsegmentation,that masksthestreetsfromtheaerialimagerytohelpidentifylocaltransportationinfrastructureand,inthescenarioofnaturaldisasters,evaluatesthedamage,proposingaproperplantodistributeaidacrossaffectedareas.Ultimately,weintroduceamethodtooptimizethe harvestingprocess,basedinspecificsceneries,suchasmaximumtime, pathlength,andlocationofthewarehouseandsecuritypoints.
2.Data
2.1.DataforthefirstCNN:ObjectLocalizationmodel
Forthisexperiment,weusedUAVshigh-resolutionimageryover satelliteimages,thelatteriseasilyaffectedbycloudyenvironments. Also,freelyavailablesatelliteimageshavelowerresolutionthanUAV imagery.TheimagerywascapturedinOctober2017andwasmade availableinearly2018aspartofanOpenAIChallengecoordinatedby WeRobotics,PacificFlyingLabs,OpenAerialMapandtheWorldBank UAVsforDisasterResilienceProgram.Weparticipatedinthischallenge thataimtocrowdsourcethedevelopmentofautomatedsolutionsfor theanalysisofaerialimagery;withspecificfocusonhumanitarian, developmentandenvironmentalprojects.
Atotalof80km2 ofhighresolution(under10cm)aerialimagery wasobtainedfromtheKingdomofTonga,coveringfourareasofinterest(withacombinationofruralandurbanareas).Thefirstthree covered10km2 each,andthelatestcovered50km2.Thespatialresolutionoftheopticalimageryis4cmor8cmdependingontheAreaof Interest.
Wecreatedthetrainingdatabyselectingtheimageryfromthe 50km2 areawith8cmofprecisionandfurtheruseditinthefirstsupervisedCNN.WeobtainedlabeledimagerythroughtheHumanitarian OpenStreetMapcommunity,whereexpertslabeleverytypeoftreefrom thisaerialimagerywiththesetreeclasses:coconut,banana,mango,and papaya.
TopreparethetrainingdataforthefirstCNNmodel,wesplitthe originalfull-sizeaerialimageryintosquarepatcheswithpredefined resolution(256×256×3).Inordertoincreasethesampleoftraining data,weuseddataaugmentationtechniques,includingrandomhorizontalandverticalflippingandrandomrotationshavingaresultof 27,293labeledimages.Thepatchesareintentionallyoverlappeduntil halfofthesubdivisionresolution–becausesometreesmayhavebeen splitandwillnotberecognizedcorrectly–securingthatatleastone patchcanentirelycovereachtree.Thepatchesarelabeledbyvectors thatcontainposition,sizeandtypeoftree(Fig.1);thiswillbefurther explainedin Section3.1

Fig.1. Onepatchisexemplifyinghowthetrainingdatawasprepared,tobefedtothefirstCNN.
2.2.DataforthesecondCNN:Semanticsegmentationmodel
ThetrainingdatausedinthesecondCNNisfromtheISPRScommissionII/4benchmarkonUrbanClassificationand3DBuilding ReconstructionandSemanticLabelingThesedatacorrespondtothe urbanareaofPotsdam,Germany,andconsistsofhigh-resolutionTrue OrthoPhotoandtheirrespectiveDigitalSurfaceModels.Thisdatahas beenclassifiedmanuallyintosixlandcoverclasses:impervioussurfaces,buildings,lowvegetation,trees,cars,andbackground(Fig.2). Wesplittheimageryintosquarepatchesof256×256×3without overlapping,achievingatrainingdataof20,102images.
3.Procedure
3.1.Classificationandlocationoftrees
ThisCNNmodelistrainedwiththetrainingdatadescribedinthe subchapter DataforthefirstCNN:ObjectLocalizationmodel.Thismodel isabletoclassifyandlocatedifferenttreesspecies.TheCNNtakesone squareRGBimageof256×256×3asinputandprovidesthecorrespondingprediction.Attheendofthepredictionprocess,thelocalizationresultsareassembled.Ifthedistancebetweentwoormorerecognizedtrees–ofthesamespecies–islessthanapredefined threshold,thelatterareconsideredasone,andtheirlocationsare averaged.
ThearchitectureofCNNisbasedonamodifiedYOLOmodel.As introducedbyRedmonetal.,YOLOworkswithapredictiongrid,and eachcellofthegridisresponsibleforrecognizingoneobject.Objects arepredictedasoneormoreboundingboxeswithaconfidencevalue andaone-hotvectorthatrepresentsthetypeoftheobject;inthisexperiment,thespeciesofthetrees.Theconfidencevaluereflectsthe probabilityofthecellcontaininganobjectandhowaccuratethe boundingboxis.Boundingboxeswithconfidencevalueslargerthana user-definedthresholdarekeptandarerenderedasaresult.Inourcase, thepredictiongridis5×5,whereeachcellpredictsoneboundingbox andfourclasses.Aboundingboxisrepresentedbyfourvalues:x,y,the radiusoftheobjectandconfidencevalue.Sincetreesseenfromabove aremainlycircular,thewidthandheightoftheboundingboxare simplifiedbyradius.Therefore,theoutputisatensororathree-dimensionalmatrixof5×5×8.Wesetthethresholdfortheconfidence valuesto0.8.Weoverlapthepatchesinordertoavoidmissingatree localizationwhenseveraltreesarefoundinonecell.Theprocessof cellsactivationisillustratedin Fig.3.
Theoverallarchitectureofthemodelcanbeillustratedin Fig.4 Theinitialconvolutionallayersofthenetworkextractfeaturesfromthe imagewhilethefullyconnectedlayerspredictoutputprobabilitiesand coordinates.Thenetworkhas24convolutionallayersfollowedbytwo fullyconnectedlayers(Redmonetal.,2016)
Themodeladoptssum-squarederrorasthebasisofthelossfunction,however,asRedmonetal.mentioned,sum-squarelossweightsthe localization,theclassification,andtheconfidenceerrorsequallyand destabilizethemodel,whichisnotidealforourtask.Inorderto overcomethisissue,twomodificationsofthelossfunctionareintroduced.First,anadditionalcoefficientismultipliedtotheconfidence errorandsecond,thegroundtruthofconfidencevalue(whichiseither 0or1)isusedasthecoefficientofthelocalizationandtheclassification errors.Therefore,theconfidencevaluegainshigherpriorityintraining andincreasestheaccuracyofthemodelindetectingtheexistenceof trees.Moreover,thepenaltyoflocalizationerroronlyhappenswhen thegroundtruthtreeexists.LetCandC′,BandB′andTandT′bethe confidencevalues,theboundingboxes(x,ycoordinates,andsize)and thespeciesoftreesofthegroundtruthandthepredictionrespectively, λbethecoefficientforconfidenceerror(inourpracticeissetto5)and Nbethenumberofgridcells(whichis25inourcase).Thentheloss functioncanbewrittenasfollow:
Beforetrainingthemodel,wesplitthedatasetina60–5–35ratiofor training,validation,andtestingrespectively.Theoutputofthefirst CNNmodelretrievedthelocationandclassoftreesinpixelspace.In chapter3.Wewillfurtherdiscusstheperformanceandresultsofthe model.
3.1.1.Densityandheatmaps
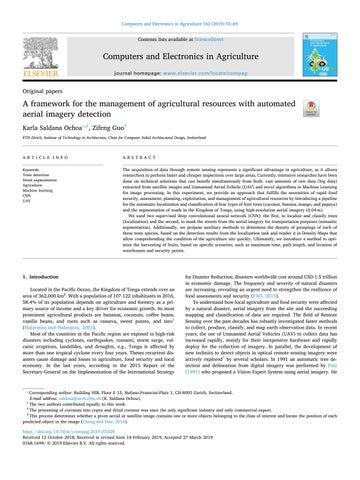
Densitymapscanprovidevaluableinsightintonaturalscenarios suchasagriculturebecausetheycancommunicatethecharacteristicsof geo-data,e.g.,theconcentrationoftreesinspace.Inordertodetermine thedensityofthedetectedtrees,wemaptheirlocationsbackintotheir geo-coordinates.WeemploytheGaussianKerneltodeterminethe densityofeachclassoftrees:letpbethepositionsofalltheretrieved trees,Nbethenumberofalltrees,thedensityatagivenlocationp’can becalculatedas:
Fig.2. Anexampleofhowthetrainingdatawasprepared,tobefedtothesecondCNN.


pp exp(||||) i N i 2 2
WerenderedthisresultsasDensityMapsforeachspecies,andlater anadditionaloneforallspecies(Fig.5).Outof12,945truepositive treeslocated,10,136treeswherecoconuttrees,representing78%of thedetectedtrees,2340bananastrees,55papayatrees,and173Mango trees.
3.2.Streetdetection
Thestreetdetectionutilizesthemethodofpixel-wisesemantic segmentationtoextractthestreetsoutoftheoriginalaerialimagery. ThesemanticsegmentationisaprocessthattakesanRGBimageasthe inputandproducesanequal-sizeimagethatispixel-wisedcolored basedonsemanticlabelsastheoutput.Allthepixelsthathavethesame labelarecoloredidentically.Forthistask,wetrainedanotherCNN
TheoriginalUAVimagery,andthecorrespondingDensitymapdisplayingthelocalizationofallspecies.
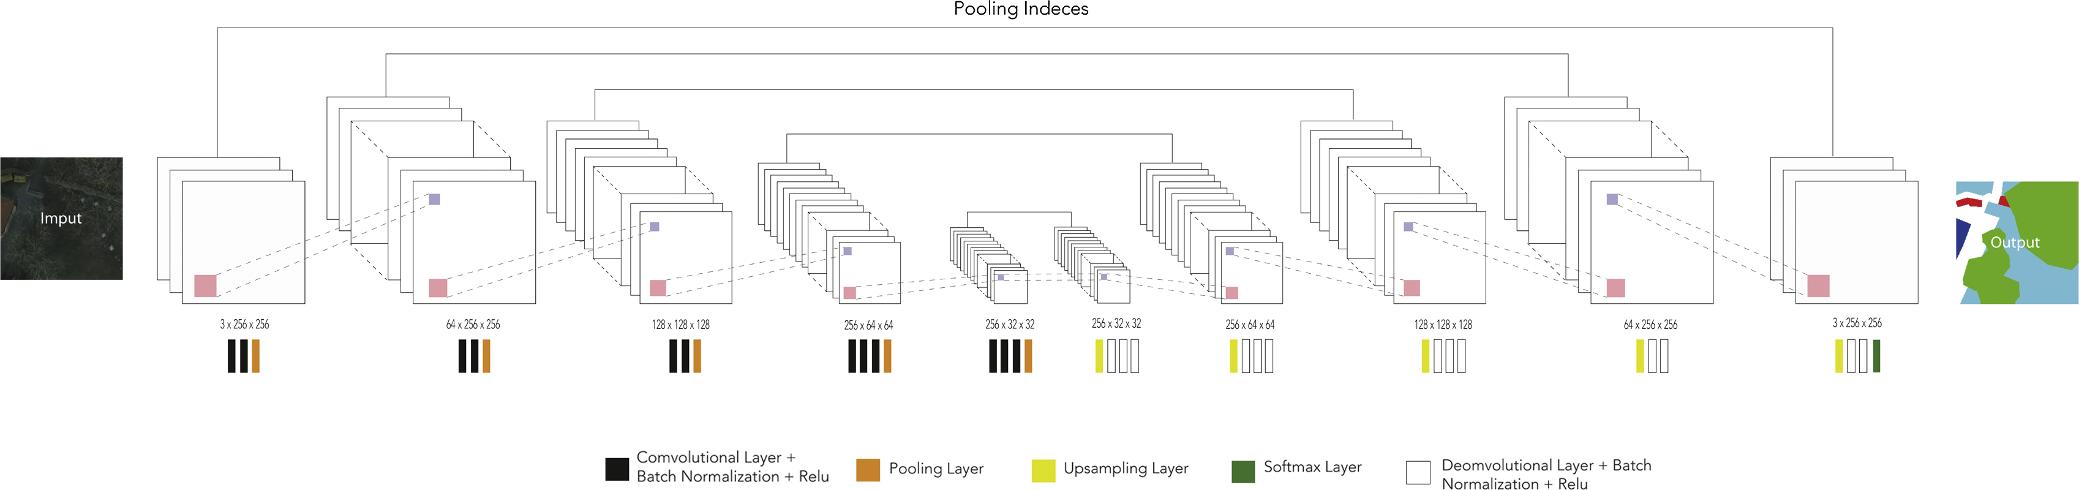
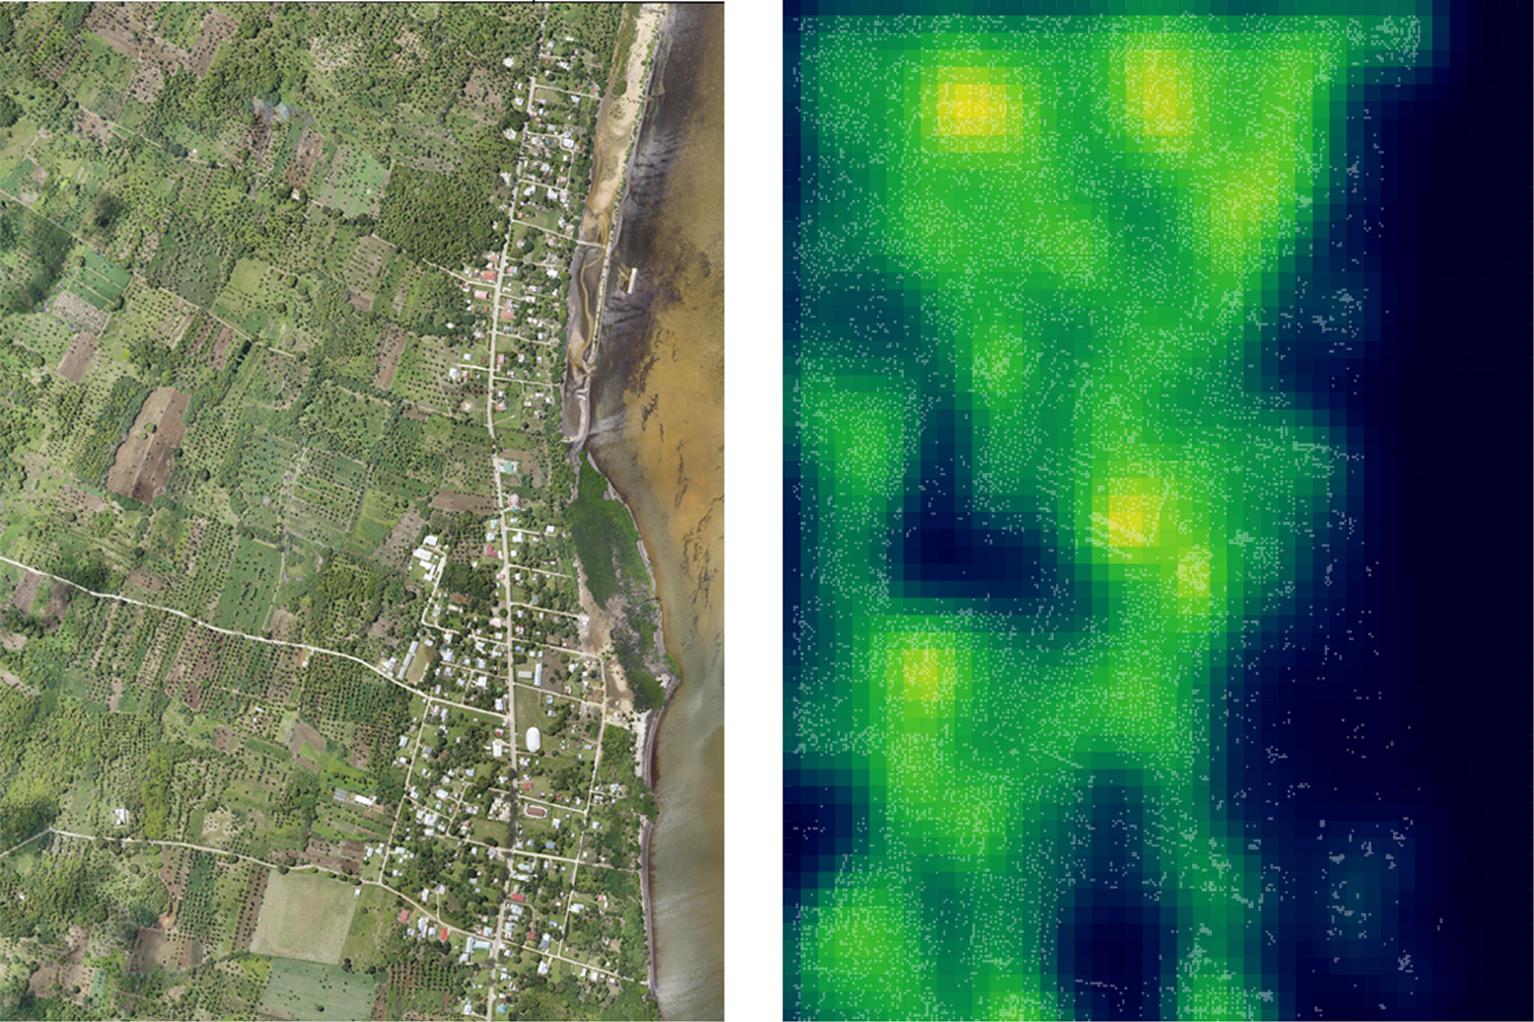
Fig.6. ThearchitectureoftheSegNetmodelwherethedispositionoftheconvolutional,pooling,up-sampling,softmaxandnormalizationlayersareexplained.
Fig.7. Thefirstimage,theextractlayerformtheSegNetmodelcorrespondingtothestreetnetwork,secondimages,theprocessfrompixelstoscatterpointsfollowed bytheDelaunaytriangulation,andthethirdimagesthespatialpatternofthestreets.
modelwiththeISPRScommissionII/4dataset.Thesubdivisionprocess ofinputimageryandtreatmentwasdescribedinthesubchapter Data secondCNN:SemanticSegmentationmodel.Wehighlightthatunlikethe treelocalizationandclassificationtrainingdata,thepatchesforthe streetrecognitionhavenooverlap.Afterall,patchesareprocessed, outputsareassembled.Fromthisoutput,weextractedonlythestreet layerandhighlighteditonablackandwhiteimage.
ThesegmentationmodelisbasedonamodifiedSegNetmodel (Badrinarayananetal.,2015)withtheinputsizeof256×256×3;the inputimageisprocessedbyasetofhierarchicalconvolutionalmodules toreducethesizeandgainmuchmorechannels.Eachmoduleconsists ofthreetofiveconvolutionallayerswitheachonefollowedbyone batchnormalizationlayer.Attheendofeachmodule,thereareone poolinglayerandoneactivationlayer.Then,thecompressedimages arefeedintoasetofhierarchicalup-samplingmodules.Eachmodule startswithanup-samplinglayerandfollowedbyseveralconvolutional layers,andthelastoneisfollowedbyanactivationlayeraswell.The poolinglayerandtheup-samplinglayerinthemodulesofthesame hierarchysharetheirpoolingindices.Theoverallarchitectureofthe modelisillustratedin Fig.6
3.2.1.Pathoptimization
Thedetectionresultsareirregularandforsomestreetsdisconnected;theleadingcausesofare:first,theoriginalimagemaybe affectedbythedistortioncausedbythemergingofmanyUAV-images intoone,secondly,thestreetmaybecoveredbytreecrownsandother objects,whichmakesitdifficulttokeepconsistency;besidestothe instabilityofthedetectionmodel.
Insteadoftryingtoextractpreciselinesthatrepresentthestreet networkfromtheimage,analternativemethodisproposed.Withthe hypothesisthattheprobabilityoftwodisconnectedstreetsegmentsis onestreetdependingontheirdistancein-between,wedeterminethat theshorterthedistance,thehighertheprobabilityofbelongingtothe samestreet.Followingthisassumption,arandomsubsamplingprocess ismadeontheresultingimage,whereeachpixellabeledasastreethas acertainprobabilityofbeinganodeandtakenintoaccountinthenext stageoftheprocess.Thesubsamplingphaseconvertsthestreetsystem fromimagetoscatteredpoints,wheretheirdensityrepresentsthe hierarchy(importance)ofthestreet.Thescatteredpointsarestoredina list,andtheirpositionsinsidethislistareconsideredastheirindex.
ADelaunaytriangulationismadeonthescatteredpoints,representingthewholestreetnetwork.Itsedgesareweightedbytheinversedsquareoftheirlengths,meaningshorteredgeshavehigher priority.Then,theshortestpathbetweentwopointsofthenetworkcan becalculatedbytheDijkstraalgorithm5 (Dijkstra,1959),obtaining resultsthatmatchthespatialpatternofthestreets(Fig.7).
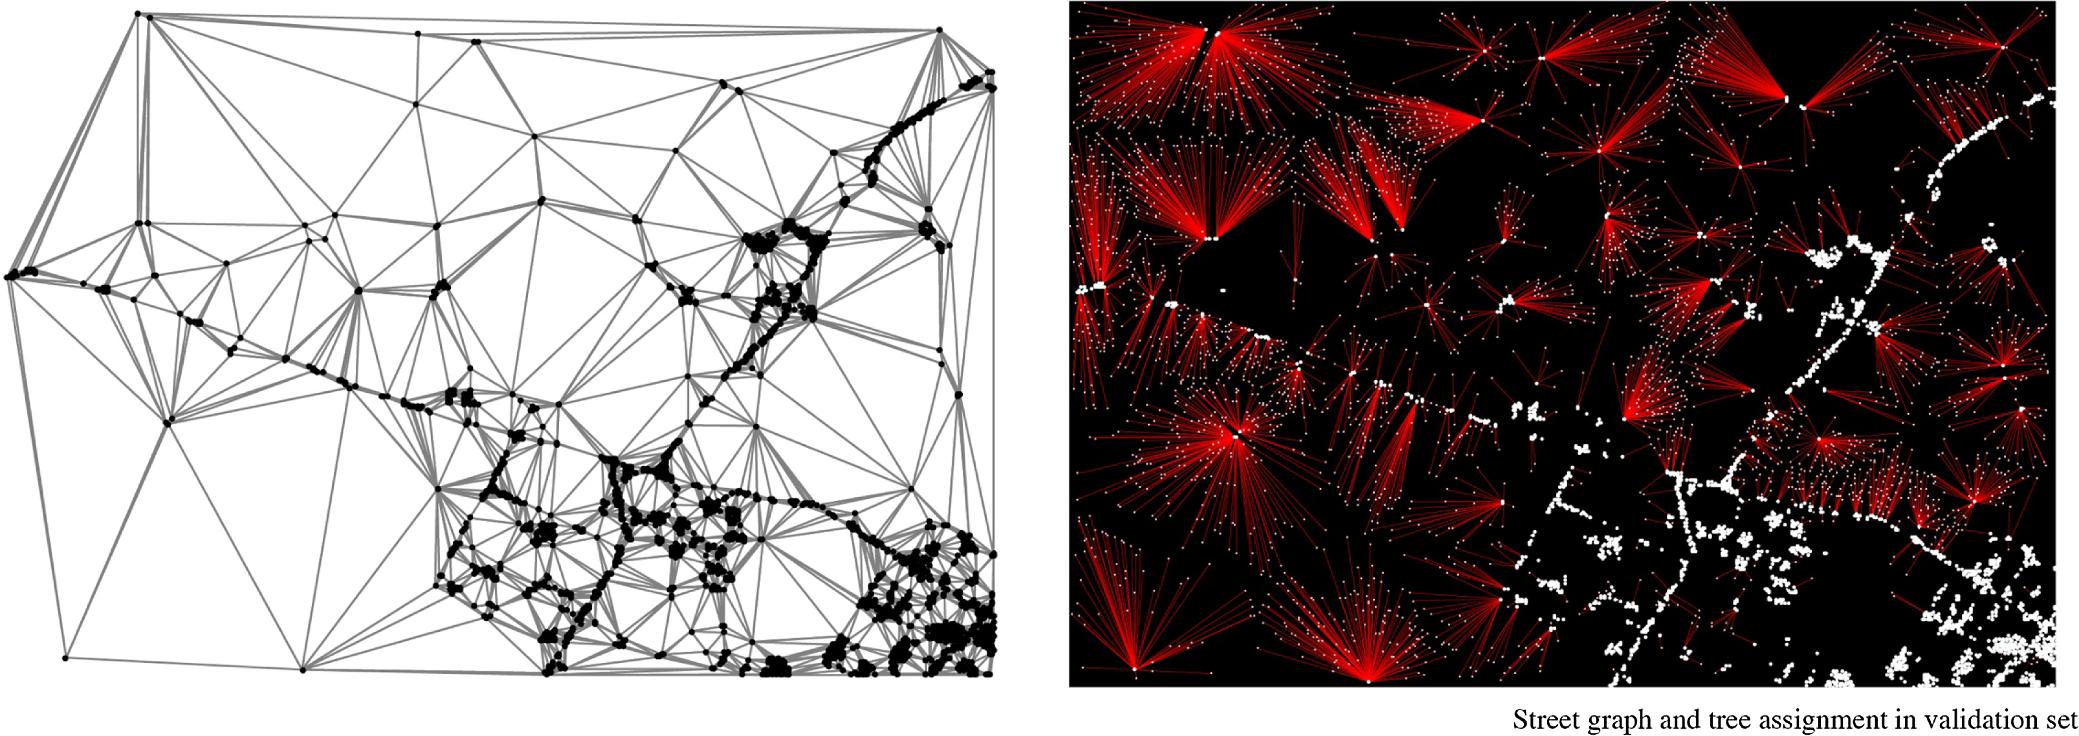
Byoverlappingthedensitymapandthestreetnetwork,thenodesof
5 Dijkstraalgorithm,orDijkstrashortestpathalgorithm,proposedbythe computerscientistEdsgerW.Dijkstra,isanalgorithmthatfindstheshortest pathbetweennodesinaweightedgraph.Thealgorithmexistsmanyvariants: themostcommononefixesanodeasthesource,iteratesoveralltheother nodesandproducesashortestpathtree.Theoriginalone,however,stopsearly whenthetargetnodeisreachedandthereforeonlyreturnstheshortestpath betweenthesourceandthetargetnodes.
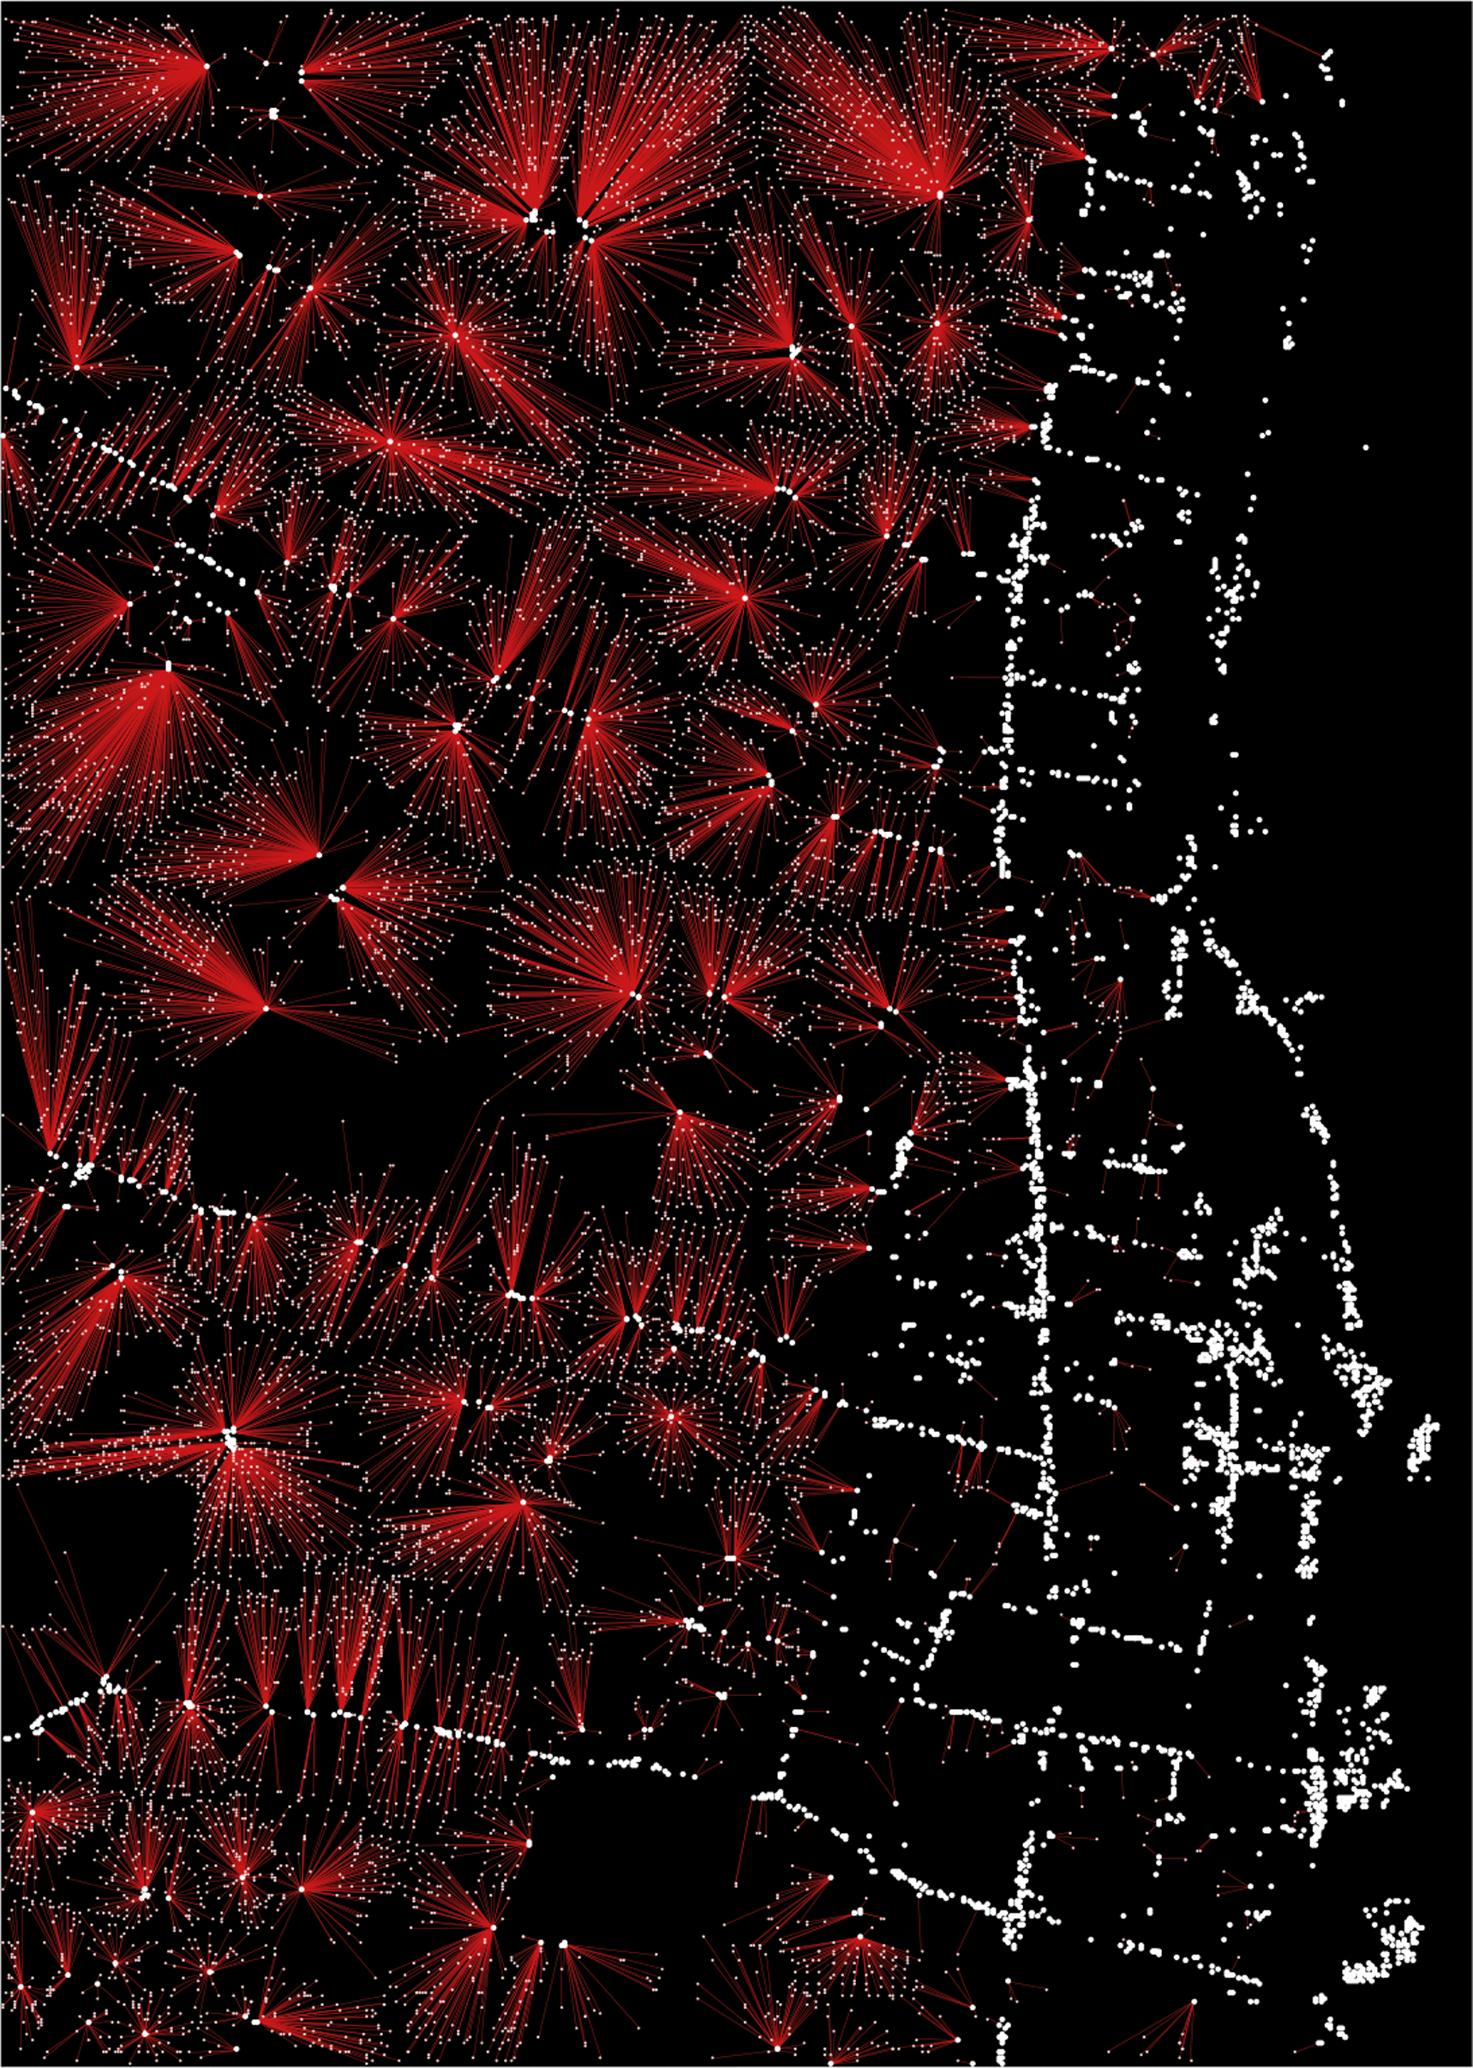
Weightednodesbythenumberofreachabletreeswithinapredefinedthresholdofthemaximaldistance.
thenetworkcanbeweightedbythenumberoftreestheyreach;asseen in Fig.8.Theoverlappingbetweenlocalizationdataandsegmentation dataallowsusmakingqueriesaboutthenetwork.Forinstance,we couldasktheoptimalpathtoharvestasmanycropsaspossiblewithin 10minoftravelingorviceversa.Thestartingpoint,endingpoint, numberoftreesandtimeofthequeryareuser-specified,andthesearch processisbasedonoptimizationalgorithms.Therefore,thisprocess adaptstothenecessitiesofaspecificscenario.
WeusetheGeneticAlgorithm(Fraser,1957)forpathoptimization. Itsearchesforoptimalsolutionsonrandomlyselectedparentsolutions byregularlyapplyingmutationandcrossoveroperationsandselecting
theoffspringthatgainhigherscoresontheobjectivefunction.Thealgorithmmodifiesthesolutioninitsgenotyperatherthanthephenotype.Morespecifically,werepresenteachpathbyaseriesofkeypoints insteadofallthepointsofit.Thekeypointsareinarbitrarysequences andlocations,andtheyareassumedtobevisitedoneaftertheother untilthelastpointisreached.Thein-betweenpathbetweeneverytwo keypointsiscalculatedusingDijkstraalgorithmontopofthetriangulatedgraph,andthefinalpathistheunionoftheseresults.Therefore,thegenotypeofthepathwouldbethelistofkeypointsandthe phenotypewouldbetheresultoftheDijkstraalgorithm.Bymodifying thesequencesandthelocationsofthekeypointsnewpathscanbe
generatedfromtheoriginalone.Duringtheoptimization,themutation ofthepathisdonebyrandomlymodifyingthekeypointssequence,and thecrossoverisdonebytakingtwoinputpathsandswappingpartof theirkeypoints.Thenumberofkeypointsofthepathisflexible,and thereforecrossovercanbeappliedtopathsthathaveadifferentnumber ofkeypointsandproducesin-betweenoffspring.
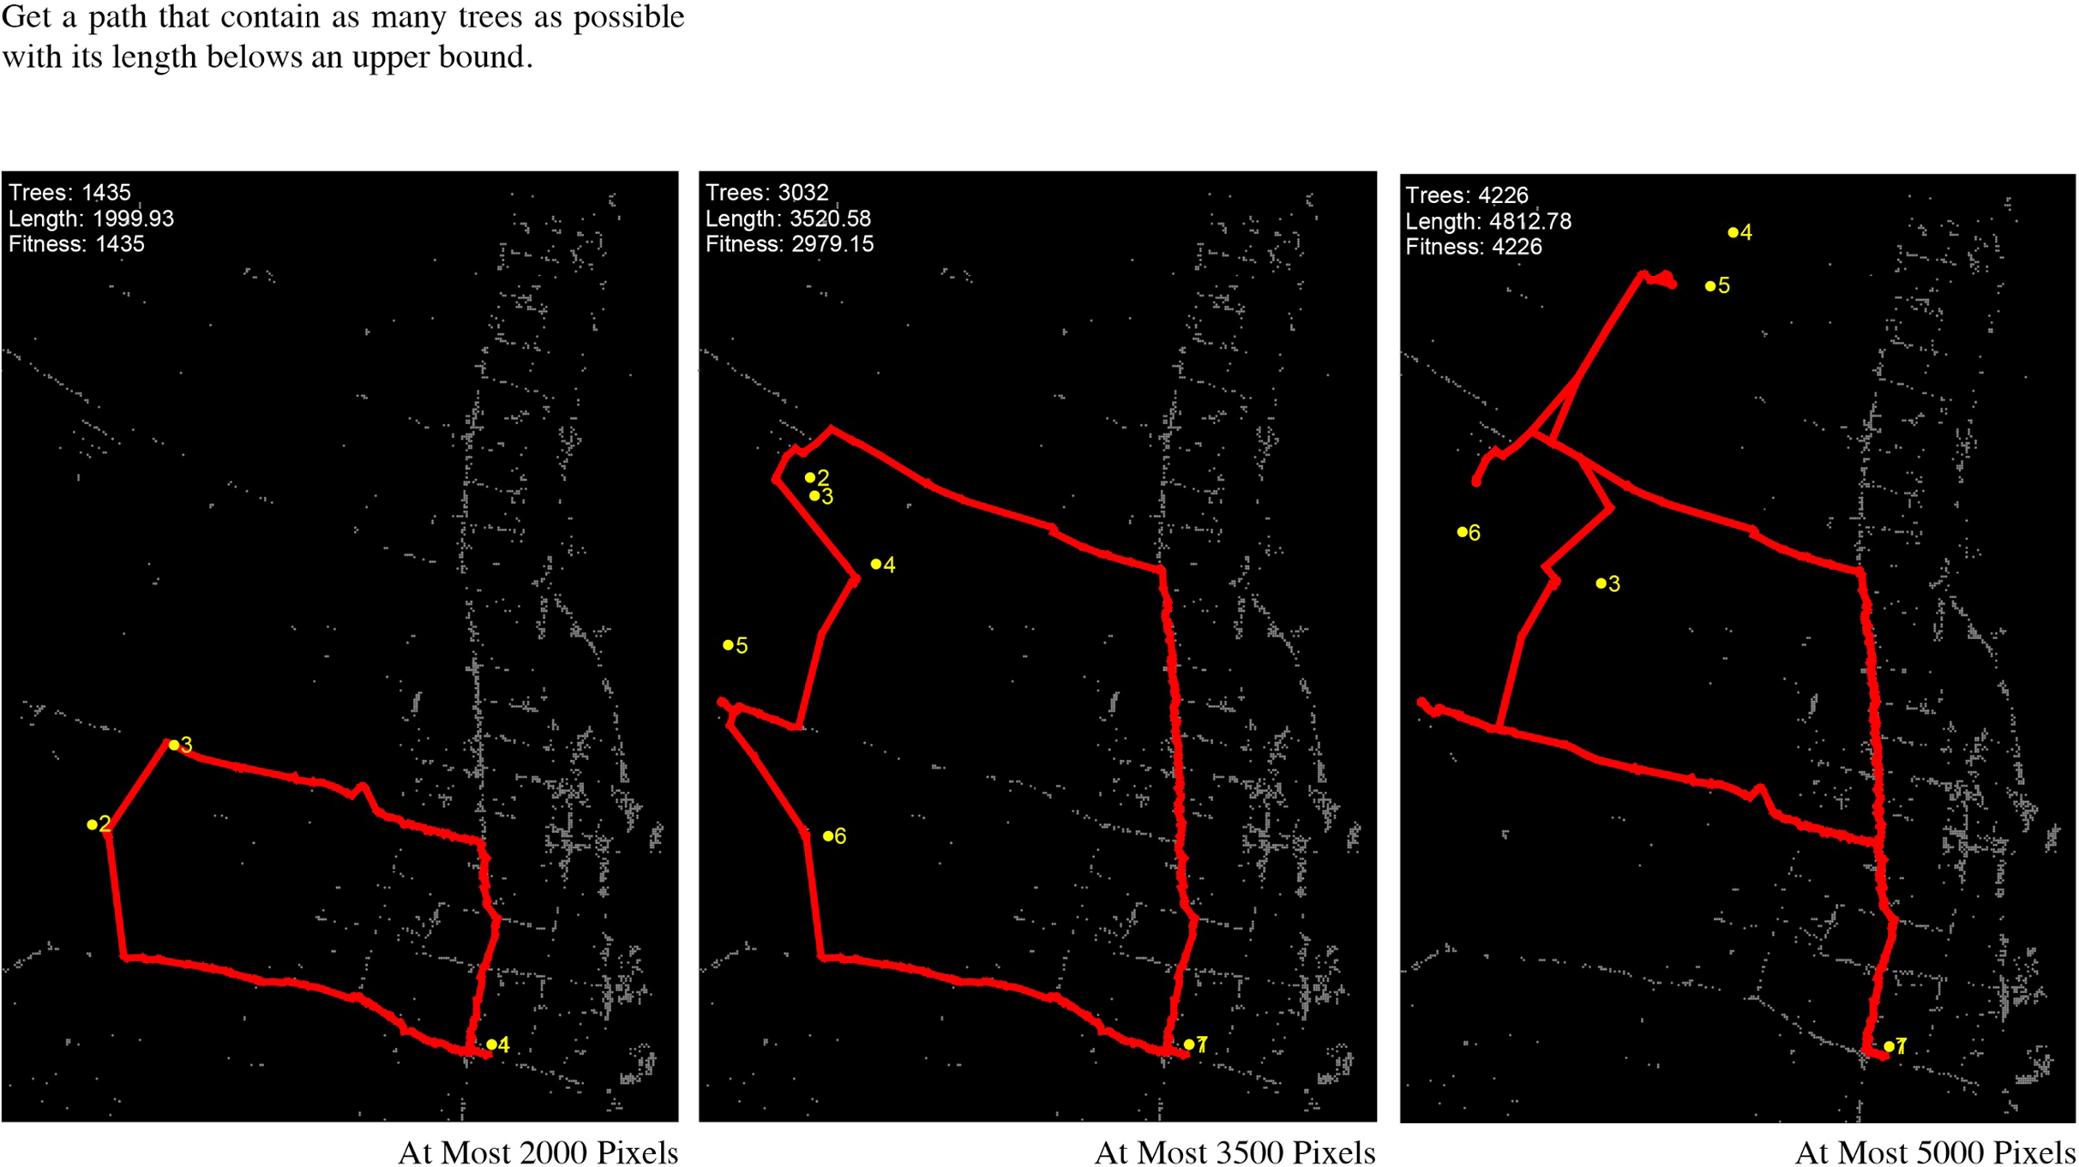
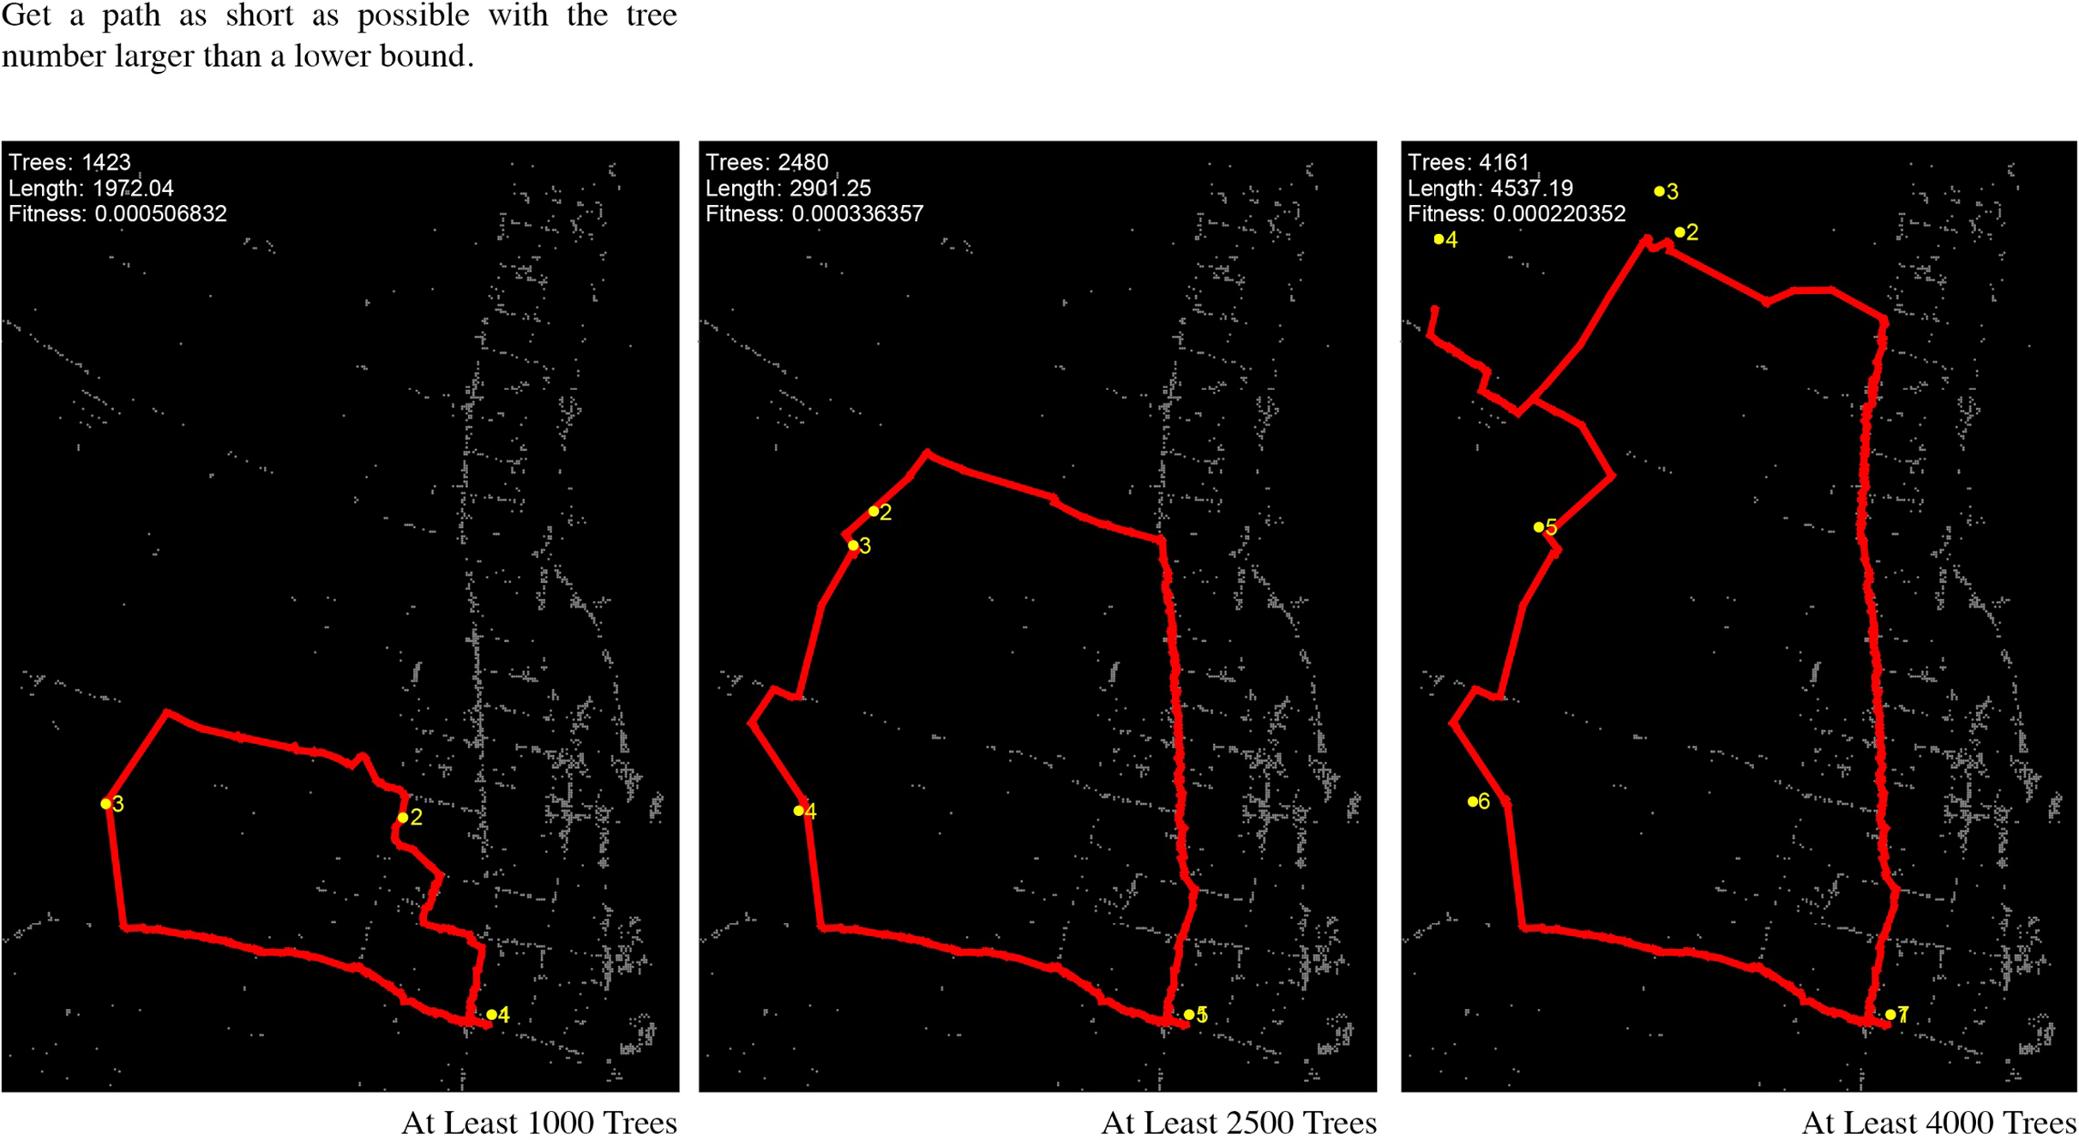
Weproposedtwotypesofsearch,asexamplesofthequeryprocess. Oneistomaximizethenumberofcropstoharvestwithalimitedlength oftraveldistance,andtheotheristominimizethetraveldistancewith alimitednumberofcropstoharvest.Theobjectivefunctionsforeach are: n l /max1, 1 d And: + n n l min1,/(1) d where n isthenumberofcrops, l isthelengthofthepath, d isaconstant and l′, n′arethetwoboundsrespectively.
4.Resultsanddiscussion
TheperformanceoftheTreeLocalizationandClassificationmodel wasmeasuredbyevaluatinghowprecisetheclassifierwastolocalize treescorrectly.TheaverageEuclidiandistancebetweenthecenterpoint oftheoriginaltreesandthepredictedtreesis8.86406pixels(lessthan onemeter).Theclassifierwasabletocount16,457trees,outofwhich 12,945werecorrectlylocated.Consideringtheoriginal13,393trees, theoverallLocalizationaccuracyofthemodelis80%.
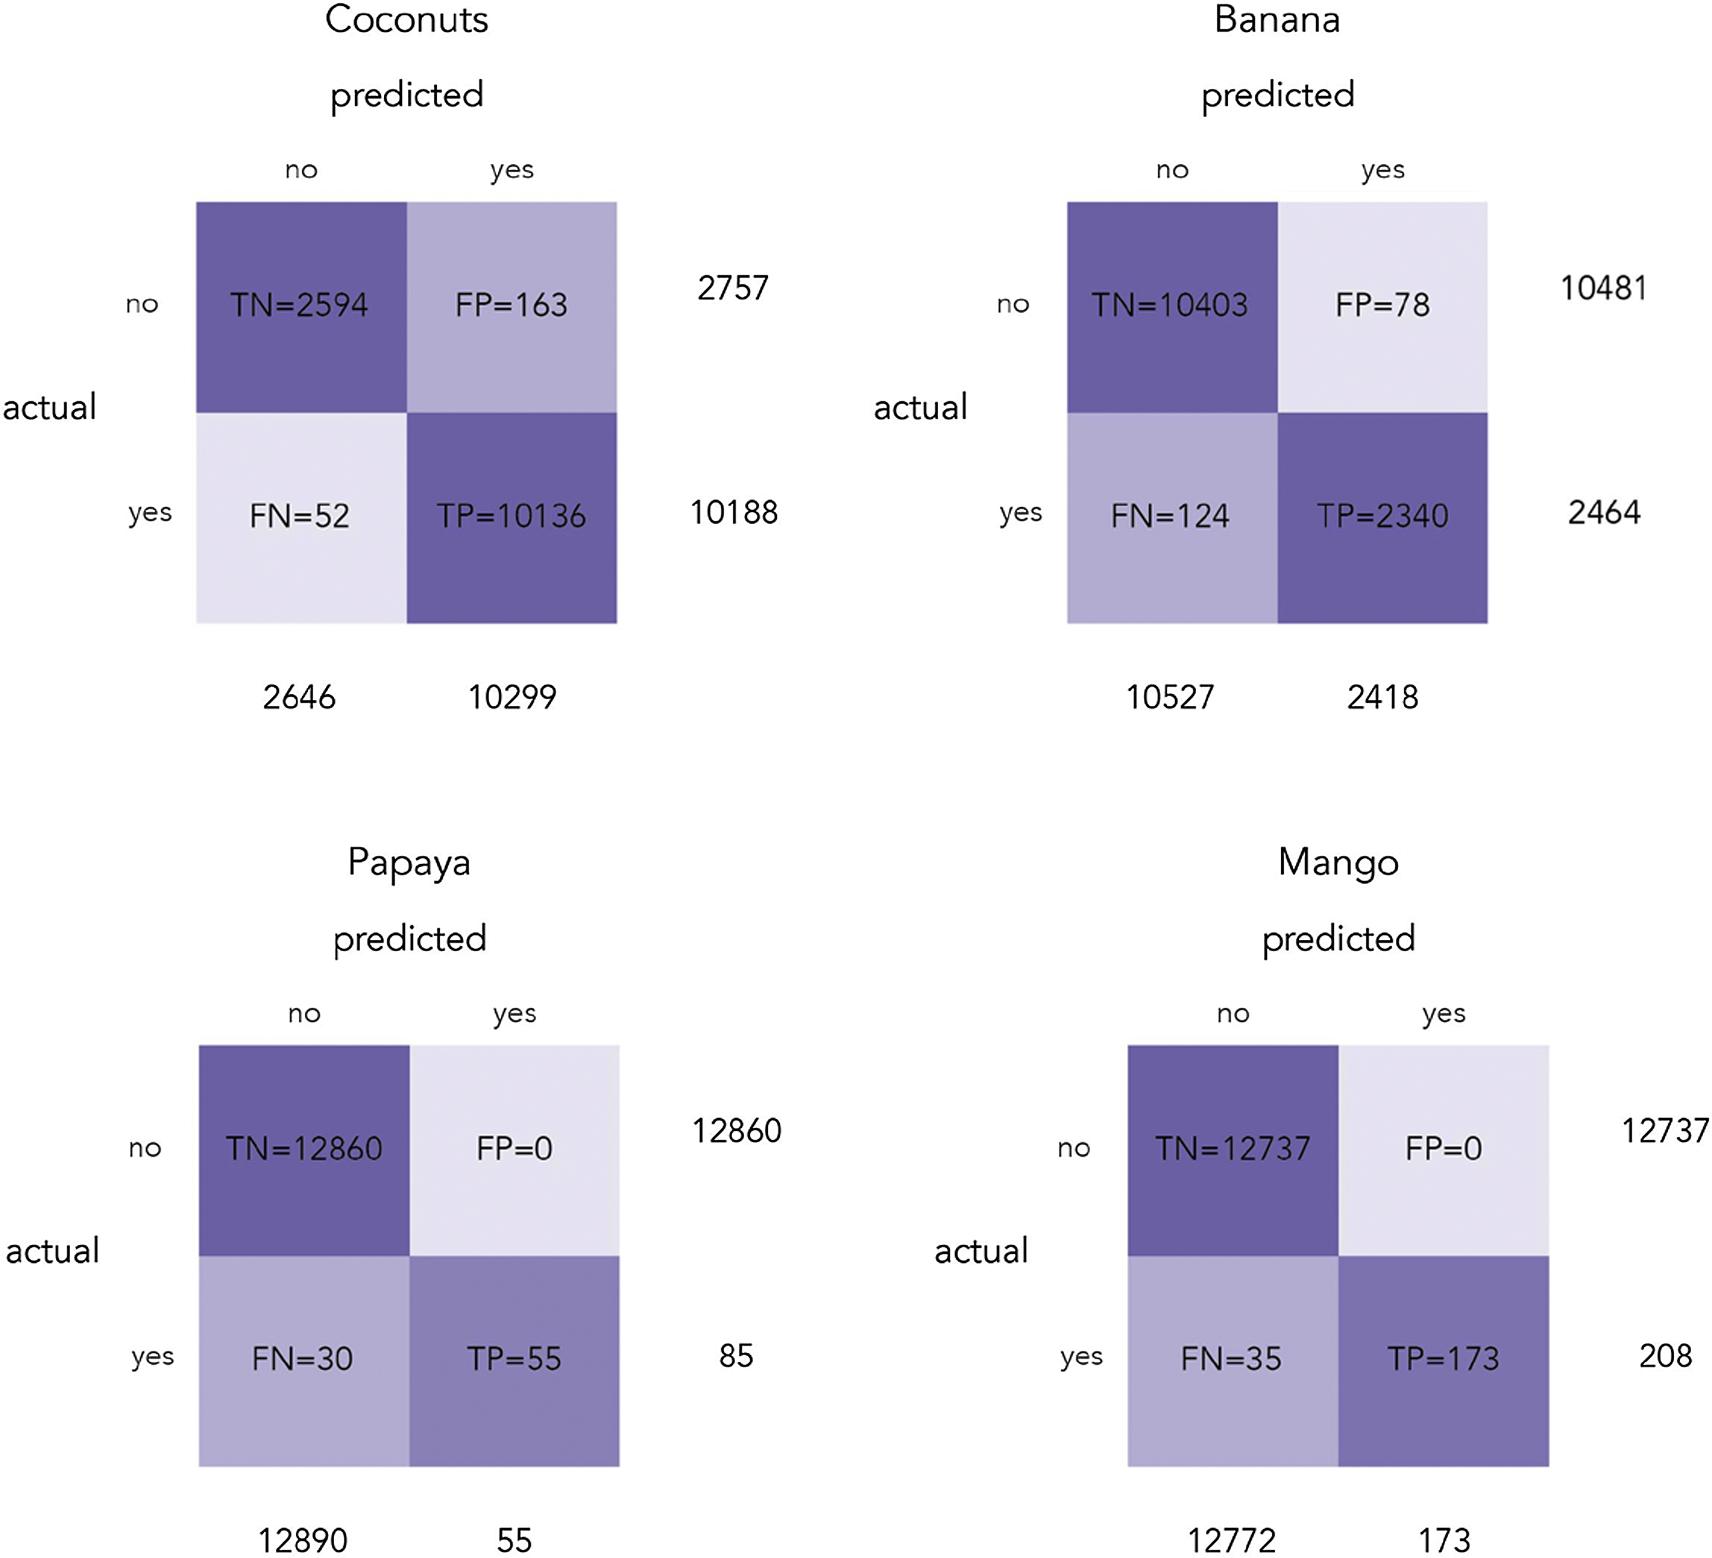
Wedrawaconfusionmatrixfromeachtypeoftrees(Fig.9),in ordertoevaluatetheaccuracyofclassificationofourModel,arranged asfollows:Coconuttrees:type1,Bananatrees:type2,Papayatrees: type3andMangotrees:type4.WeachieveaClassificationaccuracyof 98%.
Havingforeachclass:
+ = (Mean TPMean TN)/total0.987691
OurMisclassificationRateis1%,basedonhowoftentheclassifier waswrong.
+ = (Mean FPMean FN)/total0.00990861
AnditsPrecisionis97%accordingtohowmanytimesitpredicts correctlyaTP.

Fig.10. AreaofinterestonTonga,withtheclassificationresults,fromthefourtypesoftrees;green:coconut,red:banana,blue:mango,andyellow:papaya.(For interpretationofthereferencestocolourinthisfigurelegend,thereaderisreferredtothewebversionofthisarticle.)
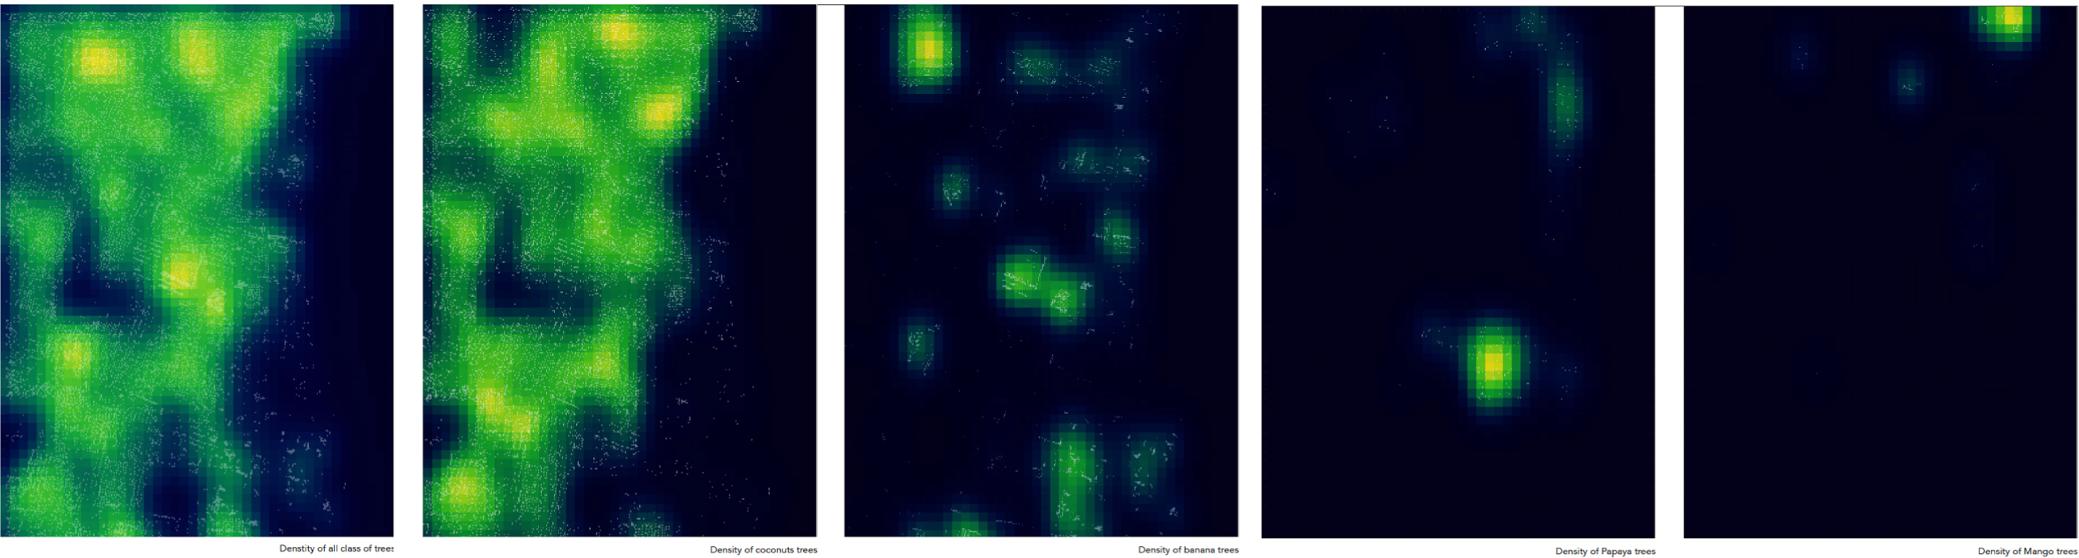
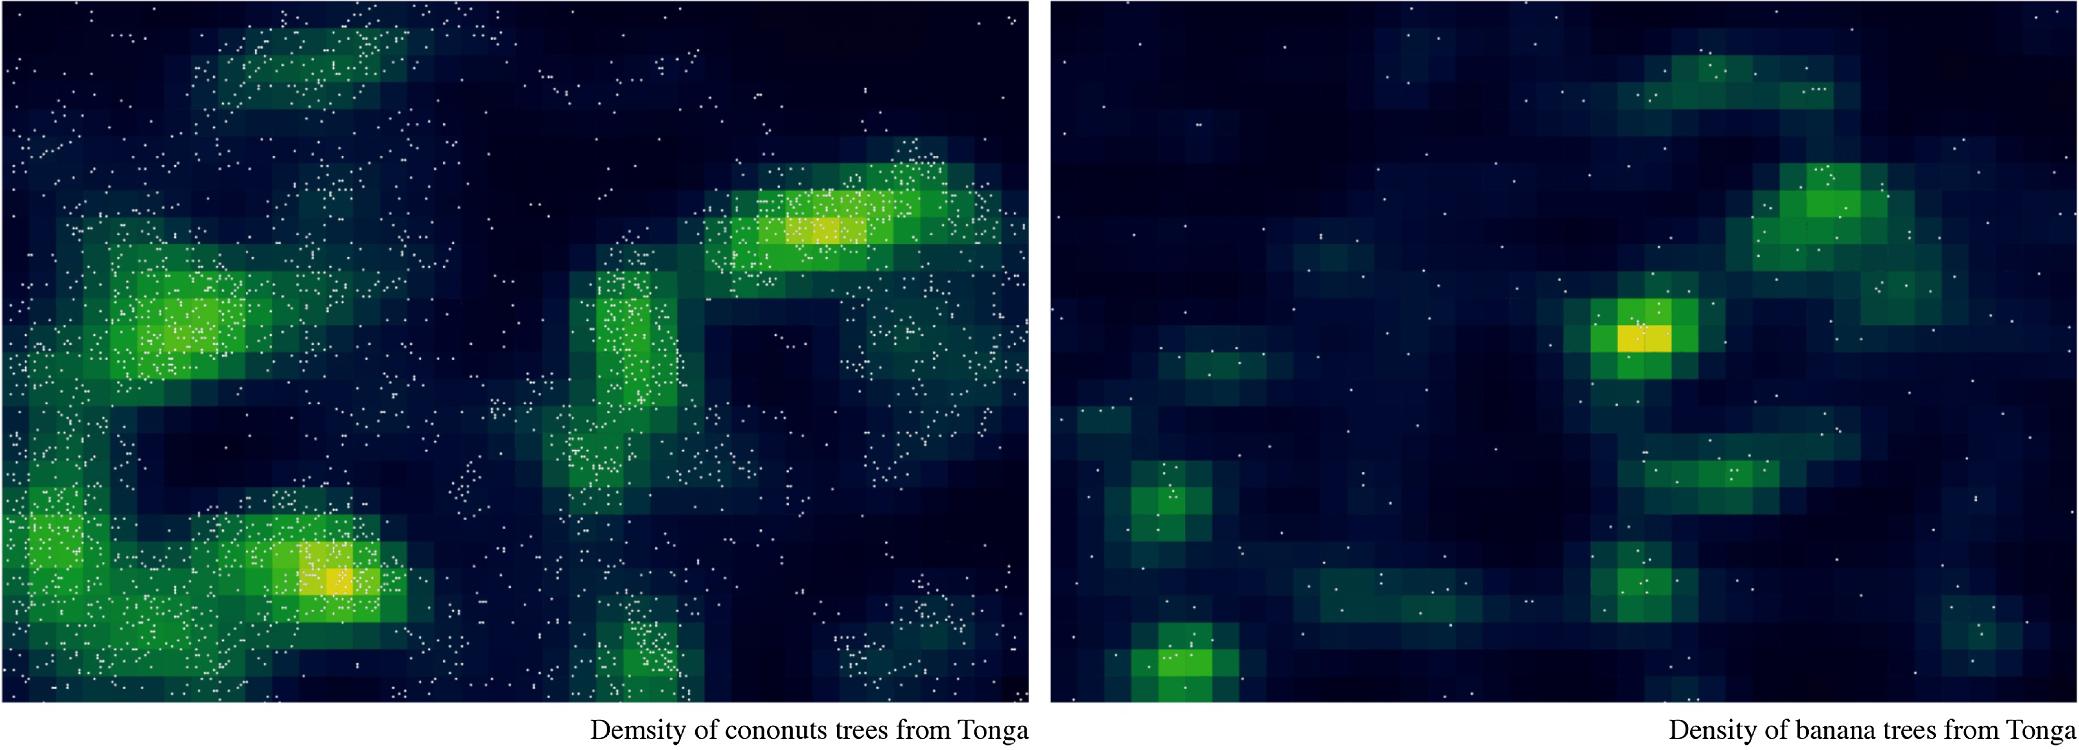
DensityMapsofallspecies,followedbyspecificdensitymapsofCoconuttreesBananatrees,Mangotrees,andPapayatrees.
Mean TP/predicted yes0.97
=
TheF1Scoreofthemodelis0.89,accordingtotheaverageofthe LocalizationAccuracy(80%)andtheClassificationAccuracy(98%).
Fig.10 illustratesthelocalizationresults.Alltreesarelocalizedwitha boundingboxrepresentingtheclasstheybelongto;green:coconut,red: banana,blue:mango,andyellow:papaya.
Thecorrespondingdensitymapoftheresultsshowsthathigh-densityareasarepunctual,whereasmid-densityareasappearaslarge surfacesconnectinghigh-densityareas.Null-densityareasaredisplayed inascatteredmannerbetweenhighandmid-densityareas(Fig.11).In thecoconutheatmap,thesameglobalheatmapreappears.However,in thebanana,mangoandpapayatreesheatmap,onlyhigh-densityseparateareasappear.
DosSantosetal.(2017) demonstratedthattheestimationoftrees densityisanessentialfirststeptowardlarge-scalemonitoring.Besides this,itprovidesabroadviewofresourcedistributionthatenablesthe identificationofareaswithhigher,midandlowdensities.Theseresults canyieldactionstoplanning,harvesting,andmanagementofthese tropicalfruitsbytheinterestsoflandowners,producerassociations,and humanitarianorganizations–TheimportanceofimprovingtheseactionsisessentialnotonlytoTonga’sindustryandeconomybutalsoto thethousandsoffamilieswhodependontheirextractionforsubsistence.
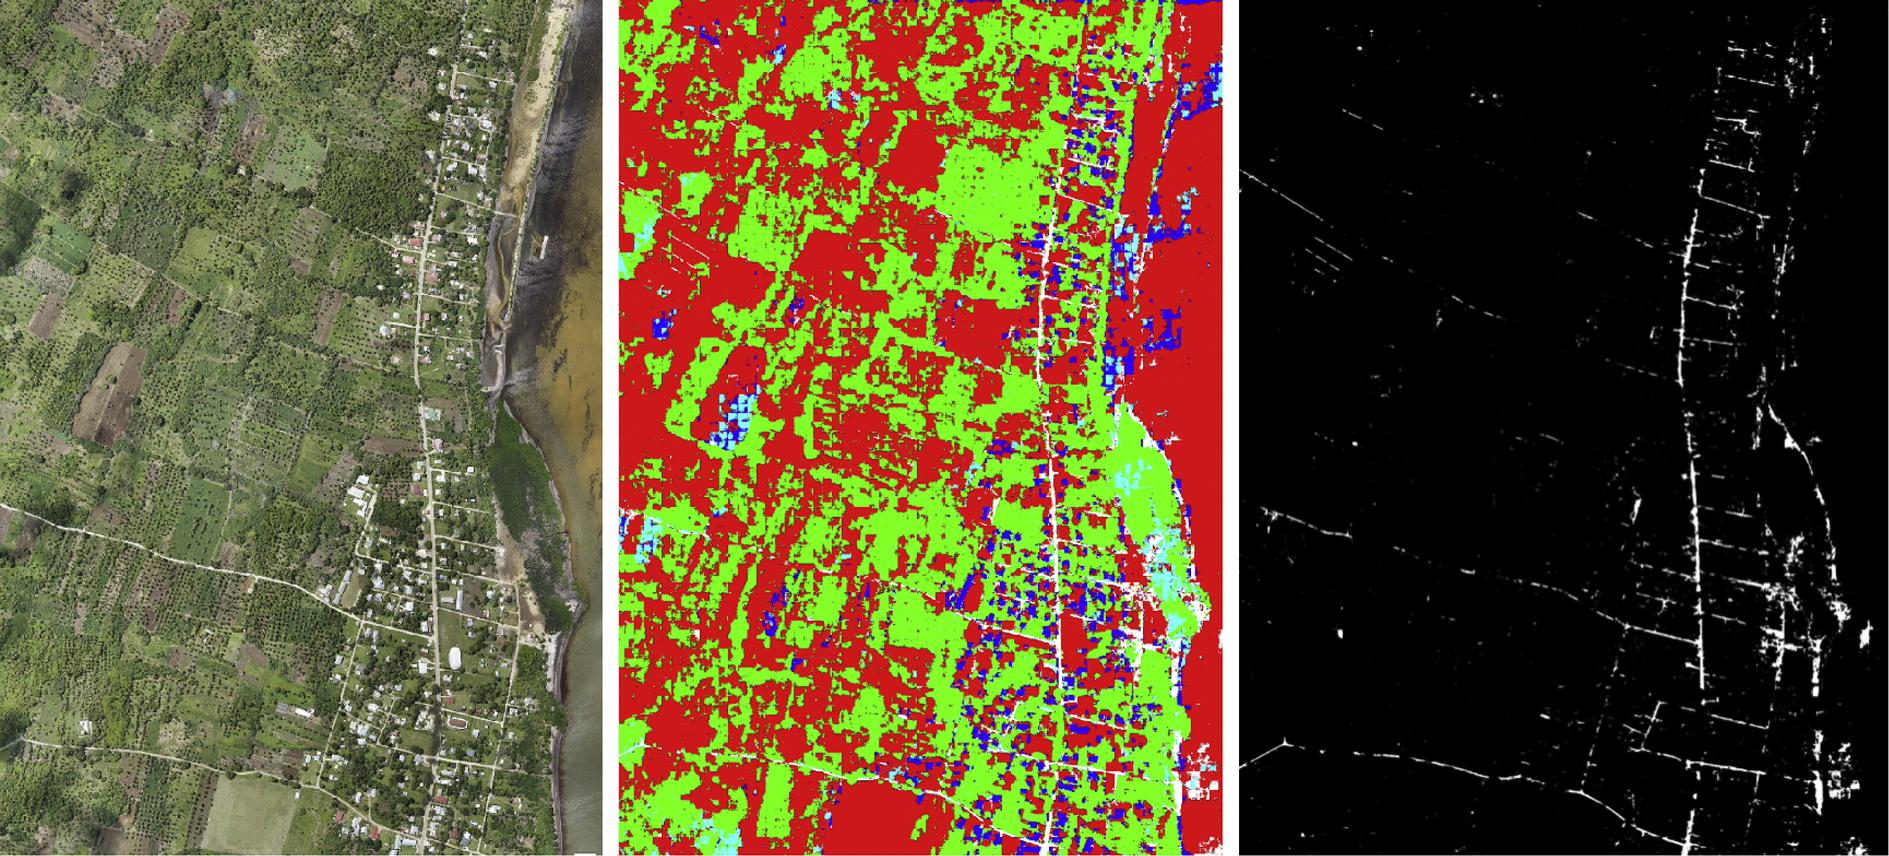
Thesecondmodelwasabletodiscriminatedifferenturbanclasses (Fig.12 middle):buildingfootprintsinblue,vegetationingreen,open spacesinred,androadnetworkinwhite.Byapplyingafilter,wecould maskthestreetsandseetheirstructure.Sincethetrainingdatawas fromanurbanscenario,andthesiteisrural,theaccuracyofthemodel todetectstreetswaslow.Forexample,somepartsofthebuildingswere mistakenlylabeledasstreets.Therefore,theseresultsrequiredfurther post-processingasdescribedinthesubchapter PathOptimization. Resamplingandgraph-makingprocessesprovideasystematicapproachtoovercomethisissue.Thepreciseextractionofthestreetcan bebypassed,makingitpossibletousetheseresultsinapplicationslike pathfindingandpathrecommendation.Thetwoproposedtasksfor pathfindingshowthatthisbypassingispossibleanduseful.Somepath queryresultsareillustratedin Fig.13 andmoreareshownin Appendix A.
Inordertovalidateourapproach,weappliedthetreelocalization modeltoadifferentdataset,onefromthethreeareasofinterestthat covered10Km2 witharesolutionof8cm(explainedinthechapter 2.1.
DatafirstCNN:ObjectLocalizationmodel)(Fig.14).Aftersuccessfully obtainingthelocationofthetreesfromtheimageryweconcludethat thetreerecognitionmodelcanworkindifferentscenarios,andisrobust enoughtofinddifferencesinocclusion,variation,illuminationand scaleamongtheretrievedtrees.
Besides,weappliedthewholepipelineoftheexperimenttoanother areaofinterestinTonga,successfullyretrievingtreesandstreets.The siteandtheresultsareshownin AppendixB.Theprocessingtimeof thisapproachisproportionaltothesizeofthesiteofinterest.
5.Conclusion
ThispaperhasinvestigatedtheuseofConvolutionalNeural Networkstoefficientlylocalizeandtransportfourtypesoftropicaltrees usingaerialimagery.Thisnewapproachreducescostsandtimeofinventory,mapping,harvesting,andmanagementofagriculturalresources,andassesstheimpactofdisastersonfoodsecurity.
Weintroduceaspecificcasewherethismethodfulfillsthenecessitiesofrapidassessmentafternaturaldisasters.Togetherwithtwo ConvolutionalNeuralNetworksmodels,wehavealsoproposeda methodtodeterminethedensityoftreesandamethodtooptimizethe harvestingprocessbasedonspecificscenarios.
Thisexperimentprovidesaframeworkwherewecandrawsome conclusionsabouttheadvantageanddisadvantagesofConvolutional NeuralNetworks.Theadvantagesofthemodelsare:reducestheneedof featuringengeneering,6 outperformsotherapproachesimplementedfor comparisonpurposes(featureextraction,7 area-basedtechniquesstatistics,texture,color,andshape-basedalgorithms)and,ithasthefacultytolearntheunderlyingpatternsofthedata.Thedisadvantagesof themodelsare:takesalongertimetotrainthanothertraditionalapproaches,needslargedatasets,lackspubliclyavailabledatasetsfor researcherstoworkwith,andinmanycases,researchersneedtodeveloptheirownsetsofimages.
Stateoftheartapproachesonthisfieldofstudy(agriculturalobjects detectionfromaerialimagery)involved:differentdatasets,pre-
6 Hand-engineeredcomponentsrequireconsiderabletime,aneffortthattakes placeautomatically.
7 Featureextractionstartsfromaninitialsetofmeasureddataandbuilds derivedvalues(features)intendedtobeinformativeandnon-redundant,facilitatingthesubsequentlearningandgeneralizationsteps.

Fig.13. Thefirstrowshowsthelongestpathsaccessingamaximalamountoftrees;thesecond-rowshowstheshortestpathswithsomeaccessibletreesaboveagiven threshold.
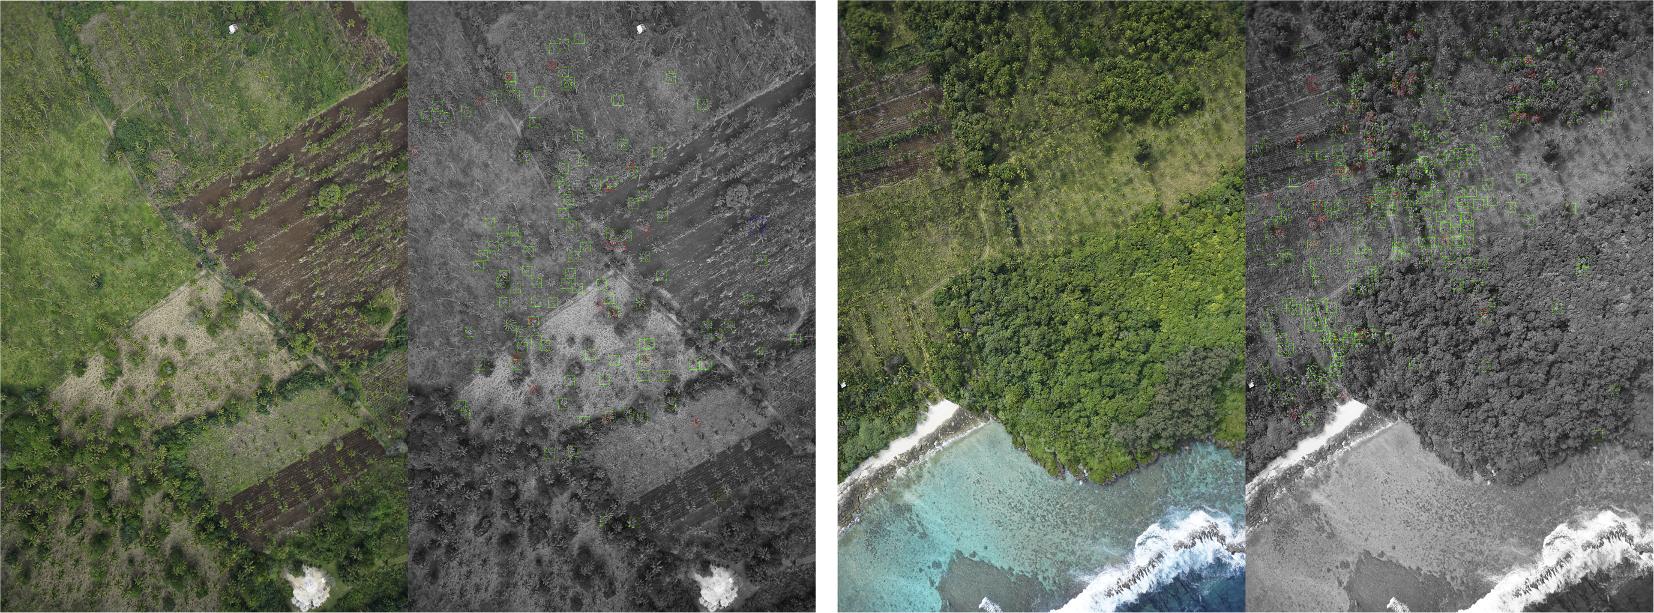
Fig.14. Aerialimageryusedasavalidationdata.
Table1 Comparisonamongexistingapproaches.
KSC:75.34%(CA) 0.7463(F1). Pavia:84.61%(CA) 0.8441(F1)
93.48%(CA)
89.5%(CA)
94.6%(CA)
Reference Task Data
79%(CA),0.66(IoU)
97%(CA)
DatasetA 97.5%(CA) DatasetB 94%(CA)
80%(LA)
97.5%(CA) 0.89(F1)
Classification Accuracy(CA) F1Score(F1)
Bandremovalfordenoising
HybridofPCA, autoencoder,andlogistic regression
13classesfor KSCdataand9 classesfor Paviadata
Hyperspectral imageryonKennedy SpaceCenter,USA andPaviacity,Italy
Classification Accuracy(CA)
Classification Accuracy(CA)
Classification Accuracy(CA)
Classification Accuracy(CA) Intersectionover Union(IoU)
Classification Accuracy(CA)
FromRGBtoHSV,resizedto 96×96pixels,creationof multiscaleviews
Correctdistortion,resizedto 40×40pixels
Calibration,filteringand restorationofmissingdata
Resizedto1600×1600pixels andthendividedinto 400×400pixelspatches
Imagecropping,randomflip horizontallyandvertically, randomtransposing
Classification Accuracy(CA)
Localization Accuracy(LA)
Classification Accuracy(CA) F1Score(F1)
Backgroundseparation, makingvegetationblobs, resizedto64×64pixels
Dividedinto256×256 patches
AuthordefinedCNN
AuthordefinedCNN
Aerialortho- imagerywitha 0.3048-mpixel resolution 21classes
Chenetal.(2014) Classification
Luusetal.(2015) Classification
Luetal.(2017) Classification UAVimagery 2classes
Kussuletal.(2017) Classification Satellitesimagery 11classes AuthordefinedCNN
Adaptedversionof VGG16
7classes
PhotographbySony a7with35mmlens
2classes DenseNet
Photographby CanonPowerShot G15
AuthordefinedCNN
Adaptedversionof YOLOandSegNet
2classes
4classes
Mortensenetal. (2016) Segmentation
Classification
Classification UAVimagery
Aerialortho- imagery
Localization, Segmentation
Sørensenetal. (2017)
Miliotoetal. (2017)
Ours
processingtechniques,metrics,models,andparameters;itisdifficultto comparethecurrentresearchamongthem(KamilarisandPrenafetaBoldú,2018);thus,ourcomparisonshavebeenstrictlylimitedtothe usedoftechniquesandthescoreofeachpaper.Inthefollowing Table1 adescriptionofthetask,data,labels,model,pre-processing,performanceandscoreisdisplayed.
Asexplainedabovethescoreofthemodelvariesdependingonthe experiment.Therefore,wecompareourresultswiththeonesthathad thesamevalidationperformance,inthecaseofChenetal.they achieveda0.79F1Score,andourmodelachieved0.89F1Score.Miliot etal.,Sørensenetal.,Kussuletal.,Luusetal.scoredabove90%results onClassificationAccuracy,ourmodelcanbeaddedtothislistsinceit achieved97%inClassificationaccuracy.Itisworthmentioningthatall theaboveexperimentsdealtonlywiththetaskofClassification.
Inthisexperiment,weproposedamodelthatnotonlyclassifybut locatedifferentclassoftrees;hence,wehaveanadditionalScoreperformance:LocalizationAccuracy80%,thisvalueshowshowaccurate themodelwastolocatedanyclassoftree.TheF1Score–theaverage valueofclassificationaccuracyandlocalizationaccuracy–demonstratesthatourmodelissuitabletoperformthetaskofclassification
andlocalizationof4typesoftrees.
Outlooks
Thisapproachcanbeusedinlocalization,classificationortransportationofresources;forinstance,intheassessmentofdamagein buildingsafteranaturaldisaster,foodsupplychain,urbanandregional planning,etc.Otherpotentialusescouldbeinformalsettlementsdetection,andmorespecificallythemonitoringofrooftopmaterialsasa meansdeterminelocalizedsocio-economicalconditions.
Dataandcode
Thedataandcodeofthispipelineareopensourceandcanbeaccessedviathislink: https://github.com/guozifeng91/south-pacificaerial-image
Declarationsofinterest
None. AppendixA
Pathoptimization


AppendixB
CompleteframworkaplliedinaAeraofinterestinTonga.


AppendixC.Supplementarymaterial
Supplementarydatatothisarticlecanbefoundonlineat https://doi.org/10.1016/j.compag.2019.03.028
References
Badrinarayanan,V.,Kendall,A.,Cipolla,R.,2015.Segnet:adeepconvolutionalencoderdecoderarchitectureforimagesegmentation.arXivpreprintarXiv:1511.00561. Chen,Y.,Lin,Z.,Zhao,X.,Wang,G.,Gu,Y.,2014.Deeplearning-basedclassificationof hyperspectraldata.IEEEJ.Sel.Top.Appl.EarthObs.RemoteSens.7(6),2094–2107
Cheng,G.,Han,J.,2016.Asurveyonobjectdetectioninopticalremotesensingimages. ISPRSJ.Photogramm.RemoteSens.117,11–28
Deng,J.,Dong,W.,Socher,R.,Li,L.J.,Li,K.,Fei-Fei,L.,2009.Imagenet:alarge-scale hierarchicalimagedatabase.In:2009IEEEConferenceonComputerVisionand PatternRecognition.IEEE,pp.248–255
Dijkstra,E.W.,1959.Anoteontwoproblemsinconnexionwithgraphs.Numer.Math.1 (1),269–271
dosSantos,A.M.,Mitja,D.,Delaître,E.,Demagistri,L.,deSouzaMiranda,I.,Libourel,T., Petit,M.,2017.Estimatingbabassupalmdensityusingautomaticpalmtreedetection withveryhighspatialresolutionsatelliteimages.J.Environ.Manage.193,40–51 Everingham,M.,Eslami,S.A.,VanGool,L.,Williams,C.K.,Winn,J.,Zisserman,A.,2015. Thepascalvisualobjectclasseschallenge:Aretrospective.Int.J.Comput.Vision111 (1),98–136
FAO,2015.Theimpactofdisastersonagricultureandfoodsecurity,76. https://doi.org/ F0134/EN Fraser,A.S.,1957.SimulationofgeneticsystemsbyautomaticdigitalcomputersI. Introduction.Aust.J.Biol.Sci.10(4),484–491
Gougeon,1995.ACrown-followingapproachtotheautomaticdelineationofindividual treecrownsinhighspatialresolutionaerialimages.Can.J.RemoteSens.21, 274–284
Halavatau,S.M.,Halavatau,N.V.,2001.FoodSecurityStrategiesfortheKingdomof Tonga(PDF),WorkingPapernumber57,UnitedNationsCentreforAlleviationof PovertyThroughSecondaryCrops'DevelopmentinAsiaandthePacific(CAPSA), archived(PDF)fromtheoriginalon10September2015. Hassaan,O.,Nasir,A.K.,Roth,H.,Khan,M.F.,2016.Precisionforestry:treescountingin urbanareasusingvisibleimagerybasedonanunmannedaerialvehicle.IFACPapersOnLine49(16),16–21. https://doi.org/10.1016/j.ifacol.2016.10.004. Hung,C.,Bryson,M.,Sukkarieh,S.,2006.Visionbasedshadowaidedtreecrowndetectionandclassificationalgorithmusingimageryfromanunmannedairbornevehicle.In:InternationalSymposiumforRemoteSensingoftheEnvironment. Kamilaris,A.,Prenafeta-Boldú,F.,2018.Deeplearninginagriculture:asurvey.Comput. Electron.Agric.147,70–90. https://doi.org/10.1016/j.compag.2018.02.016. ISSN: 0168-1699.
Krizhevsky,A.,Sutskever,I.,Hinton,G.E.,2012.Imagenetclassificationwithdeepconvolutionalneuralnetworks.In:Advancesinneuralinformationprocessingsystems, pp.1097–1105.
Kussul,N.,Lavreniuk,M.,Skakun,S.,Shelestov,A.,2017.Deeplearningclassificationof landcoverandcroptypesusingremotesensingdata.IEEEGeosci.RemoteSens.Lett. 14(5),778–782
LeCun,Y.,Bottou,L.,Bengio,Y.,Haffner,P.,1998.Gradient-basedlearningappliedto documentrecognition.Proc.IEEE86(11),2278–2324
Long,J.,Shelhamer,E.,Darrell,T.,2015.Fullyconvolutionalnetworksforsemantic segmentation.In:ProceedingsoftheIEEEConferenceonComputerVisionand PatternRecognition,pp.3431–3440
Lu,H.,Fu,X.,Liu,C.,Li,L.G.,He,Y.X.,Li,N.W.,2017.Cultivatedlandinformation extractioninUAVimagerybasedondeepconvolutionalneuralnetworkandtransfer learning.J.MountainSci.14(4),731–741
Luus,F.P.,Salmon,B.P.,vandenBergh,F.,Maharaj,B.T.,2015.Multiviewdeeplearning forland-useclassification.IEEEGeosci.RemoteSens.Lett.12(12),2448–2452 Milioto,A.,Lottes,P.,Stachniss,C.,2017.Real-timeblob-wisesugarbeetsvsweeds classificationformonitoringfieldsusingconvolutionalneuralnetworks.Proceedings oftheInternationalConferenceonUnmannedAerialVehiclesinGeomatics.Bonn, Germany
Mortensen,A.K.,Dyrmann,M.,Karstoft,H.,Jørgensen,R.N.,Gislum,R.,2016.Semantic segmentationofmixedcropsusingdeepconvolutionalneuralnetwork.International ConferenceonAgriculturalEngineering.Aarhus,Denmark
Nogueira,K.,Penatti,O.A.B.,dosSantos,J.A.,2017.Towardsbetterexploitingconvolutionalneuralnetworksforremotesensingsceneclassification.PatternRecogn. 61,539–556. https://doi.org/10.1016/j.patcog.2016.07.001.
Pinz,1991.Acomputervisionsystemforrecognitionoftreesinaerialphotographs.In: InternationalAssociationofPatternRecognitionWorkshop,pp.111–124.
Redmon,J.,Divvala,S.,Girshick,R.,Farhadi,A.,2016.Youonlylookonce:Unified,realtimeobjectdetection.In:ProceedingsoftheIEEEConferenceonComputerVision andPatternRecognition,pp.779–788
Russakovsky,O.,Deng,J.,Su,H.,Krause,J.,Satheesh,S.,Ma,S.,Berg,A.C.,2015. Imagenetlargescalevisualrecognitionchallenge.Int.J.Comput.Vision115(3), 211–252
Simonyan,K.,Zisserman,A.,2014.Verydeepconvolutionalnetworksforlarge-scale imagerecognition.arXivpreprintarXiv:1409.1556.
Sørensen,R.A.,Rasmussen,J.,Nielsen,J.,Jørgensen,R.,2017.ThistleDetectionusing ConvolutionalNeuralNetworks.EFITACongress,Montpellier,France