Note: Print-out of the trend curves (including the statistical results) is automatically activated upon completion the V‑Check™ Measurement if the protocol ‘Serial Printer’ is selected and a printer is connected to the SDM.
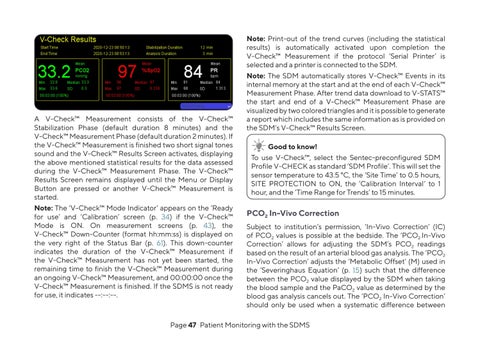
A V‑Check™ Measurement consists of the V‑Check™ Stabilization Phase (default duration 8 minutes) and the V‑Check™ Measurement Phase (default duration 2 minutes). If the V‑Check™ Measurement is finished two short signal tones sound and the V‑Check™ Results Screen activates, displaying the above mentioned statistical results for the data assessed during the V‑Check™ Measurement Phase. The V‑Check™ Results Screen remains displayed until the Menu or Display Button are pressed or another V‑Check™ Measurement is started. Note: The ‘V‑Check™ Mode Indicator’ appears on the ‘Ready for use’ and ‘Calibration’ screen (p. 34) if the V‑Check™ Mode is ON. On measurement screens (p. 43), the V‑Check™ Down-Counter (format hh:mm:ss) is displayed on the very right of the Status Bar (p. 61). This down-counter indicates the duration of the V‑Check™ Measurement if the V‑Check™ Measurement has not yet been started, the remaining time to finish the V‑Check™ Measurement during an ongoing V‑Check™ Measurement, and 00:00:00 once the V‑Check™ Measurement is finished. If the SDMS is not ready for use, it indicates --:--:--.
Note: The SDM automatically stores V‑Check™ Events in its internal memory at the start and at the end of each V‑Check™ Measurement Phase. After trend data download to V‑STATS™ the start and end of a V‑Check™ Measurement Phase are visualized by two colored triangles and it is possible to generate a report which includes the same information as is provided on the SDM’s V‑Check™ Results Screen. Good to know! To use V‑Check™, select the Sentec-preconfigured SDM Profile V‑CHECK as standard ‘SDM Profile’. This will set the sensor temperature to 43.5 °C, the ‘Site Time’ to 0.5 hours, SITE PROTECTION to ON, the ‘Calibration Interval’ to 1 hour, and the ‘Time Range for Trends’ to 15 minutes.
PCO2 In-Vivo Correction Subject to institution’s permission, ‘In-Vivo Correction’ (IC) of PCO2 values is possible at the bedside. The ‘PCO2 In-Vivo Correction’ allows for adjusting the SDM’s PCO2 readings based on the result of an arterial blood gas analysis. The ‘PCO2 In-Vivo Correction’ adjusts the ‘Metabolic Offset’ (M) used in the ‘Severinghaus Equation’ (p. 15) such that the difference between the PCO2 value displayed by the SDM when taking the blood sample and the PaCO2 value as determined by the blood gas analysis cancels out. The ‘PCO2 In-Vivo Correction’ should only be used when a systematic difference between
Page 47 . Patient Monitoring with the SDMS