22 | URBIS STORAGE INDEX
Up, down, or indifferent? As uncertainty in the property market continues, where does self storage sit in the cycle? In recent months we have seen oversupply and ‘discounts’ amplified in the press. Is self storage caught in the current tidal wave? Or is it a case of being tarred with the same brush? Let’s explore the detail. Linda Sharkey is presenting at this year's SSAA Convention in Cairns. Linda is a Certified Practising Valuer, Chartered Valuation Surveyor and leader of the self storage team at Urbis. With 12 years’ experience, she has full geographical coverage in valuations and advisory across Australia and New Zealand. In addition to self storage, Linda is experienced in highest and best use analysis, feasibility testing, value capture and market trend studies.
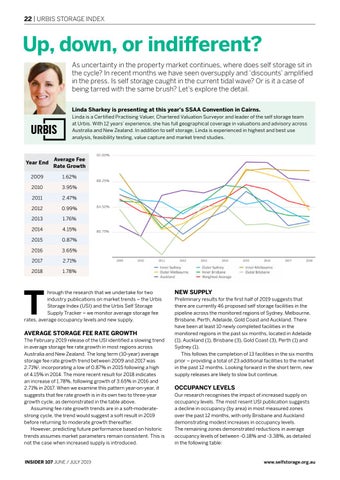
Average Fee Year End Rate Growth 2009
1.62%
2010
3.95%
2011
2.47%
2012
0.99%
2013
1.76%
2014
4.15%
2015
0.87%
2016
3.65%
2017
2.71%
2018
1.78%
92.00%
88.25%
84.50%
80.75%
T
hrough the research that we undertake for two industry publications on market trends – the Urbis Storage Index (USI) and the Urbis Self Storage Supply Tracker – we monitor average storage fee rates, average occupancy levels and new supply.
AVERAGE STORAGE FEE RATE GROWTH The February 2019 release of the USI identified a slowing trend in average storage fee rate growth in most regions across Australia and New Zealand. The long term (10-year) average storage fee rate growth trend between 2009 and 2017 was 2.71%1, incorporating a low of 0.87% in 2015 following a high of 4.15% in 2014. The more recent result for 2018 indicates an increase of 1.78%, following growth of 3.65% in 2016 and 2.71% in 2017. When we examine this pattern year-on-year, it suggests that fee rate growth is in its own two to three-year growth cycle, as demonstrated in the table above. Assuming fee rate growth trends are in a soft-moderatestrong cycle, the trend would suggest a soft result in 2019 before returning to moderate growth thereafter. However, predicting future performance based on historic trends assumes market parameters remain consistent. This is not the case when increased supply is introduced.
INSIDER 107 JUNE / JULY 2019
NEW SUPPLY Preliminary results for the first half of 2019 suggests that there are currently 46 proposed self storage facilities in the pipeline across the monitored regions of Sydney, Melbourne, Brisbane, Perth, Adelaide, Gold Coast and Auckland. There have been at least 10 newly completed facilities in the monitored regions in the past six months, located in Adelaide (1), Auckland (1), Brisbane (3), Gold Coast (3), Perth (1) and Sydney (1). This follows the completion of 13 facilities in the six months prior – providing a total of 23 additional facilities to the market in the past 12 months. Looking forward in the short term, new supply releases are likely to slow but continue.
OCCUPANCY LEVELS Our research recognises the impact of increased supply on occupancy levels. The most resent USI publication suggests a decline in occupancy (by area) in most measured zones over the past 12 months, with only Brisbane and Auckland demonstrating modest increases in occupancy levels. The remaining zones demonstrated reductions in average occupancy levels of between -0.18% and -3.38%, as detailed in the following table:
www.selfstorage.org.au


