Edwin A. Hernández-Delgado
Alberto M. Sabat
University of Puerto Rico Department of Biology
Coral Reef Research Group PO Box 23360 San Juan, Puerto Rico 00931-3360
E-mail: coral_giac@yahoo.com
Technical Report submitted to the Sea Grant College Program University of Puerto Rico, Mayagüez Campus Project R-101-3-00
November 1, 2003
This study should be cited as follows:
Hernández-Delgado, E.A., & A.M. Sabat 2003. Long-term ecological changes of coral reefs in the Luis Peña Channel No-Take Natural Reserve, Cuelebra, PR. Technical Rep. submitted to Sea Grant College Prog., Univsersity of Puerto Rico, Mayagüez, P.R. 149 pp.
Actual contact address of the corresponding author:
Edwin A. Hernández-Delgado, Ph.D.
University of Puerto Rico
Department of Biology
Coral Reef Research Group PO Box 23360
San Juan, Puerto Rico 00931-3360
coral_giac@yahoo.com
Abstract
The structure of coral reef epibenthic communities within the Luis Peña Channel No-Take Natural Reserve (LPCNR), Culebra Island, PR, has shifted significantly between years 1997 and 2003. Line-intercept transects were used to address ecological change at two sampling stations (CR1, CR2) between years 1997 and 2003. With the exception of the shallow depth zone at CR2, there was a 7 to 30% decline in the coral species richness, and a 17 to 40% decline in colony abundance. There was also a 31 to 66% decline in the % of coral cover, a 21 to 241% increase in the % of total algal cover, a 104 to 1,423% increase in the % of macroalgal cover, and a 161 to 1,370% increase in the % of benthic cyanobacterial cover. With the exception of the deeper depth zone at CR1, there was also a 186 to 400% increase in sponge cover. An alarming 5 to 10% annual rate of coral decline has been observed. This ranks among the fastest chronic decline rates ever documented in the entire Caribbean region, and ranks as the highest coral reef chronic decline ever documented in the northeastern Caribbean sub-region. A significant difference in the coral reef epibenthic community structure was observed when using multidimensional scaling ordination between year means (stress <0.01-0.01), and between year means using depth zones as replicates (stress 0.09-0.17). A 2-way crossed ANOSIM test showed that there were significant differences in the community structure between years and a significant interaction between years and depth. Community structure was more significantly different with increasing time. A major coral decline has occurred through all depth zones. The key taxa mostly responsible for these differences included macroalgae, total algae, filamentous algae, and cyanobacteria. A Caswell’s neutral model test showed a significantly lower coral species diversity through time than the predicted value, suggesting major disturbance effects. Also, Kdominance curves have shown major shifts in the coral species dominance rankings through time. Moreover, coral:macroalgae ratios have plummeted significantly through time, in most cases, below the critical 1:1 threshold level. Changes observed in the coral species diversity index (H’n) and evenness (J’n) suggests a major shift from a moderately predictable severe environment to a severe unpredictable environment. Major causes of coral mortality included Caribbean-wide natural factors such as recurrent White Plague Type II outbreaks, in combination with local anthropogenic factors, mostly algal overgrowth following disease-related coral mortality. The combination of low herbivory levels (associated with the still low densities of the Long-Spined Sea Urchin, Diadema antillarum, and the still moderate to low herbivory by parrotfishes, Scaridae), and increasing nutrient pulses resulting from remote raw sewage pollution and highly-sedimented and nutrient loaded runoff from uncontrolled land-clearing activities could be the main local factors contributing to the observed increase in the % of macroalgal and cyanobacterial cover. Despite the no take Natural Reserve designation, coral reefs within the LPCNR are declining at an alarming rate and models predict a major reef collapse within the next decade or two unless major management and restoration activities are implemented. Priority recommendations to the DNER include: 1) consistently patrol and enforce existing no fishing regulations; 2) assign full time patrolling and management personnel, and a higher budget for the LPCNR; 3) develop an experimental research program aimed at understanding the mechanisms of coral reef decline; 4) develop a long-term water quality monitoring program for the LPCNR; 5) expand the existing coral propagation experimental programthat we initiated in 2003 with the collaboration of the Culebra Island Fishermen Association, Coralations and ReefScaping, Inc., to re-introduce rare or nearly-endangered coral species such as Acropora palmata and A. cervicornis; 6) complete and implement the
management plan for the LPCNR by year 2004; 7) promote a co-management model for the LPCNR to involve the community and other interested stakeholders; and 8) promote that the Culebra Municipal Government and the Culebra Conservation and Development Authority, with the collaboration of other government agencies, the community, and other interested stakeholders, develop a Culebra island wide land use and management plan that address existing serious erosion and sedimentation control problems and other water quality issues. Time is running out and we are losing one of the most beautiful and biologically diverse coral reefs of the entire Puerto Rican archipelago and the wider Caribbean at one of the most alarming rates ever documented. Action is immediately needed. Understanding these variation patterns will be the first step towards linking these patterns to environmental variation and to management-linked influences.
Resumen
La estructura de la comunidad epibéntica de los arrecifes de coral en la Reserva Natural de no pesca del Canal de Luis Peña (RNCLP), Isla de Culebra, PR, ha cambiado significativamente entre los años 1997 y 2003. Se utilizaron transectos de línea-intercepto para evaluar los cambios ecológicos ocurridos en dos estaciones de monitoreo continuo (CR1, CR2). Con la excepción de las estaciones llanas en CR2, se observó una reducción de 7 a 30% en la riqueza de especies, y de 17 a 40% en la abundancia de colonias de corales. Se observó también una reducción de 31 a 66% en el % de cobertura de corales, un incremento de 21 a 241% en el % de cobertura total de algas, un incremento de 104 a 1,423% en el % de cobertura de las macroalgas, y un incremento de 161 a 1,370% en el % de cobertura de las cianobacterias bénticas. Con la excepción de la zona profunda en CR1, se observó un incremento de 186 a 400% en la cobertura de las esponjas. Además, se documentó una tasa anual alarmante de reducción crónica en el % de cobertura de corales de 5 a 10%. Ésta constituye una de las tasas más rápidas jamás documentada para todo el Caribe y, a su vez, constituye la tasa más alta jamás documentada para la sub-region noreste del Caribe. Un análisis de ordenación de escalas multi-dimensionales demostró que las comunidades arrecifales resultaron significativamente diferentes a través de los años (nivel de estrés <0.01-0.01) y a través de los años utilizando las zonas de profundidad como replicas (nivel de estrés 0.09-0.17). Un análisis ANOSIM de 2 vías demostró diferencias significativas en la estructura de las comunidades entre los años, y en la interacción entre años y profundidad. Las diferencias entre las estructuras de las comunidades se tornaron más significativas a medida que aumentó el tiempo. La reducción de corales observada ha ocurrido independientemente de la profundidad. Los grupos funcionales principalmente responsables para las diferencias observadas incluyen las macroalgas, algas (totales), algas filamentosas y las cianobacterias bénticas. Una prueba del modelo neutral de Caswell demostró que la diversidad de especies de corales resultó significativamente menor a través del tiempo que lo predicho por el modelo, lo que sugiere un incremento en los efectos de las perturbaciones. Además, las curvas K de dominancia demostraron cambios significativos en la jerarquía de dominancia de las especies de corales a través del tiempo. Más aún, se ha observado un colapso estadísticamente significativo a través del tiempo en la tasa de corales:macroalgas, inclusive bajo el nivel umbral critico de 1:1. Los cambios observados en el índice de diversidad de especies de los corales (H’n) y el índice de ecualitatividad (J’n) sugieren que ha ocurrido un cambio significativo desde un ambiente severo moderadamente predecible hacia un ambiente severo e impredecible. Las causas principales de
la mortalidad de corales incluyen factores naturales regionales que han afectado a todo el Caribe, como los brotes recurrentes de la Enfermedad de la Plaga Blanca Tipo II, en combinación con factores antropogénicos locales, principalmente, el sobrecrecimiento de las algas luego de mortalidad de corales asociada a la enfermedad. Se sugiere que la combinación entre los niveles bajos de herbivoría (asociado a las densidades aún bajas del Erizo Gigante, Diadema antillarum, y a la aún moderada a baja herbivoría por los peces cotorros, Scaridae), y los incrementos en la frecuencia de pulsos de nutrientes disueltos provenientes de la descarga remota de aguas usadas crudas y de la escorrentía altamente sedimentada y cargada de nutrientes consecuencia de la deforestación sin control, podrían estar contribuyendo al gran incremento observado en el % de cobertura de las macroalgas y de las cianobacterias. A pesar de la designación como una Reserva Natural de no captura, los arrecifes de coral dentro de la RNCLP están perdiéndose a una tasa alarmante, tanto que los modelos predicen un colapso de proporciones mayores en sus arrecifes dentro de solo una o dos décadas a menos que se implementen actividades importantes de manejo y de restauración. Las recomendaciones prioritarias para el DRNA incluyen: 1) patrullar y hacer cumplir consistentemente las restricciones a la pesca; 2) asignar personal permanente a tiempo completo para la vigilancia y el manejo de la RNCLP, así como un presupuesto mayor; 3) desarrollar un programa de investigación experimental para comprender los mecanismos de degradación arrecifal; 4) desarrollar un programa de monitoreo permanente a largo plazo de calidad de agua en la RNCLP; 5) expandir el programa experimental de propagación de corales que iniciamos en el 2003 con la colaboración de la Asociación de Pescadores de la Isla de Culebra, Coralations y ReefScaping, Inc. para reintroducir especies raras o cerca de estar en peligro de extinción, tales como Acropora palmata y A. cervicornis; 6) completar e implementar el plan de manejo para la RNCLP para el año 2004; 7) promover un modelo de co-manejo para el manejo de la RNCLP que involucre a la comunidad y a otras partes interesadas; y 8) promover que la Administración Municipal de Culebra y la Autoridad de Conservación y Desarrollo de Culebra, con la ayuda de otras agencias gubernamentales, la comunidad y otras partes interesadas, desarrollen un plan de uso y manejo de terrenos a nivel de toda la Isla de Culebra, el cual atienda los problemas serios relacionados al control de la erosión y la sedimentación, así como otros asuntos relacionados a la calidad del agua. El tiempo continua corriendo y estamos perdiendo uno de los arrecifes de coral más hermosos y biológicamente diversos de todo el archipiélago puertorriqueño y de todo el Caribe, a una de las tasas más alarmantemente rápidas jamás documentadas. Se requiere acción inmediata. El comprender estos patrones de variación sera el primer paso hacia conectar estos patrones a las influencias asociadas a la variación ambiental y a las actividades de manejo.
Table of contents
Introduction. 1-3
Methods. 3-12
Study sites. 3-7
Long-term monitoring of coral reef epibenthic communities. 7-10
Multivariate analysis of coral reef communities. 10-11
Analysis of disturbance effects. 11-12
Results. 12-93
Ecological change at CR1. 12-37
Multivariate analysis of coral reef communities at CR1. 38-47
Indicators of disturbance effects at CR1. 48-54
Ecological change at CR2. 55-79
Multivariate analysis of coral reef communities at CR2. 80-88
Indicators of disturbance effects at CR2. 88-93
Discussion. 94-141
Shifts in the structure of coral reef communities. 94-104
Comparison of annual coral decline rates with the wider 94-95 Caribbean region.
The role of algae and cyanobacteria on the coral reef 95-103 phase shifts.
Detection of shifts in community structure by multivariate 103-104 analyses.
Causes of coral decline. 105-135
Caribbean-wide mechanisms, local causes or a 105-107 combination of both?
Local factors and their synergism with regional 107 factors.
White Plague Type II. 107-118
Low herbivory or selective herbivory: The top- 119-123 down model.
Interaction among degrading factors: The down- 123-129 top model.
A proposed mechanism of coral reef decline. 129-135
Effects on species diversity: Regional vs. local factors, threshold 135-138 effects, multiple stable states, and Allee effects.
Modeling alternate states of coral reefs in the LPCNR. 138-141
Conclusions. 142-146
Acknowledgments. 146
Cited literature. 147-159 Appendix 160-163
List of Tables
TABLE 1a. Summary of the coral community data at CR1 (1997-1999). 14
TABLE 1b. Summary of the coral community data at CR1 (2001-2003). 15
TABLE 2a. Summary of the % of relative coral cover at CR1 (1997-1999). 16
TABLE 2b. Summary of the % of relative coral cover at CR1 (2001-2003). 17
TABLE 3. Friedman 2-way ANOVA for the coral reef community data at 18 CR1.
TABLE 4. Friedman 2-way ANOVA for the % of relative coral cover data at 19-20 CR1.
TABLE 5. Exponential regression analysis between the cumulative coral 22 species richness and the cumulative number of replicate transects at CR1.
TABLE 6. Exponential regression analysis between the cumulative coral 24 species richness and the cumulative colony abundance at CR1.
TABLE 7a. Summary of the quadratic regression analysis results between the 36 % of total algal cover and several coral parameters.
TABLE 7b. Summary of the quadratic regression analysis results between the 37 % of macroalgal cover and several coral parameters.
TABLE 8. Yearly mean dissimilarity matrix of CR1. 38
TABLE 9. Results of the 2-way crossed ANOSIM test for significant 42 differences of the structure of coral reef epibenthic communities at CR1.
TABLE 10. Results of the pairwise ANOSIM significance test between 42 years at CR1.
TABLE 11. Results of the pairwise ANOSIM significance test between 42 depth zones at CR1.
TABLE 12a. Results of the SIMPER analysis of years 1997 vs 1998 at CR1. 43
TABLE 12b. Results of the SIMPER analysis of years 1997 vs 1999 at CR1. 44
TABLE 12c. Results of the SIMPER analysis of years 1997 vs 2001 at CR1. 44
TABLE 12d. Results of the SIMPER analysis of years 1997 vs 2002 at CR1. 44
TABLE 12e. Results of the SIMPER analysis of years 1997 vs 2003 at CR1. 44
TABLE 13a. Results of the SIMPER analysis of years 1998 vs 1999 at CR1. 45
TABLE 13b. Results of the SIMPER analysis of years 1998 vs 2001 at CR1. 45
TABLE 13c. Results of the SIMPER analysis of years 1998 vs 2002 at CR1. 45
TABLE 13d. Results of the SIMPER analysis of years 1998 vs 2003 at CR1. 46
TABLE 14a. Results of the SIMPER analysis of years 1999 vs 2001 at CR1. 46
TABLE 14b. Results of the SIMPER analysis of years 1999 vs 2002 at CR1. 46
TABLE 14c. Results of the SIMPER analysis of years 1999 vs 2003 at CR1. 47
TABLE 15a. Results of the SIMPER analysis of years 2001 vs 2002 at CR1. 47
TABLE 15b. Results of the SIMPER analysis of years 2001 vs 2003 at CR1. 47
TABLE 16. Results of the SIMPER analysis of years 2002 vs 2003 at CR1. 47
TABLE 17. Summary of the Caswell’s neutral model V statistics for CR1. 48
TABLE 18. Friedman 2-way ANOVA of the Coral:Macroalgae ratios at CR1. 52
TABLE 19a. Summary of the coral community data at CR2 (1997-2001). 58
TABLE 19b. Summary of the coral community data at CR2 (2002-2003). 59
TABLE 20a. Summary of the % of relative coral cover at CR2 (1997-2001). 60
TABLE 20b. Summary of the % of relative coral cover at CR2 (2002-2003). 61
TABLE 21. Friedman 2-way ANOVA for the coral reef community data at 62 CR2.
TABLE 22. Friedman 2-way ANOVA for the % of relative coral cover data at 63-64 CR2.
TABLE 23. Exponential regression analysis between the cumulative coral 66 species richness and the cumulative number of replicate transects at CR2.
TABLE 24. Exponential regression analysis between the cumulative coral 68 species richness and the cumulative colony abundance at CR2.
TABLE 25a. Summary of the quadratic regression analysis results between the 78 % of total algal cover and several coral parameters.
TABLE 25b. Summary of the quadratic regression analysis results between the 78 % of macroalgal cover and several coral parameters.
TABLE 26. Yearly mean dissimilarity matrix of CR2. 80
TABLE 27. Results of the 2-way crossed ANOSIM test for significant 84 differences of the structure of coral reef epibenthic communities at CR2.
TABLE 28. Results of the pairwise ANOSIM significance test between 84 years at CR2.
TABLE 29. Results of the pairwise ANOSIM significance test between 84 depth zones at CR2.
TABLE 30a. Results of the SIMPER analysis of years 1997 vs 1998 at CR2. 85
TABLE 30b. Results of the SIMPER analysis of years 1997 vs 2001 at CR2. 85
TABLE 30c. Results of the SIMPER analysis of years 1997 vs 2002 at CR2. 85
TABLE 30d. Results of the SIMPER analysis of years 1997 vs 2003 at CR2. 85
TABLE 31a. Results of the SIMPER analysis of years 1998 vs 2001 at CR2. 86
TABLE 31b. Results of the SIMPER analysis of years 1998 vs 2002 at CR2. 86
TABLE 31c. Results of the SIMPER analysis of years 1998 vs 2003 at CR2. 86
TABLE 32a. Results of the SIMPER analysis of years 2001 vs 2002 at CR2. 87
TABLE 32b. Results of the SIMPER analysis of years 2001 vs 2003 at CR2. 87
TABLE 33. Results of the SIMPER analysis of years 2002 vs 2003 at CR2. 87
TABLE 34. Summary of the Caswell’s neutral model V statistics for CR2. 89
TABLE 35. Friedman 2-way ANOVA of the Coral:Macroalgal ratios at CR2. 91
TABLE A1a. Summary of the statistical power of the sampling effort at CR1. 160
TABLE A1b. Summary of the statistical power of the sampling effort at CR1. 160
TABLE A2a. Summary of the statistical power of the sampling effort at CR2. 161
TABLE A2b. Summary of the statistical power of the sampling effort at CR2. 161
TABLE A3. Magnitude of changes in coral reef epibenthic parameters for 162 the period of 1997 to 2003 at CR1 per each depth zone.
TABLE A4. Magnitude of changes in coral reef epibenthic parameters for 162 the period of 1997 to 2003 at CR1 per each depth zone.
TABLE A5. Coral:macroalgal ratios at CR1. 163
TABLE A6. Coral:macroalgal ratios at CR2. 163
List of Figures
FIGURE 1a. Study sites at the LPCNR. 4
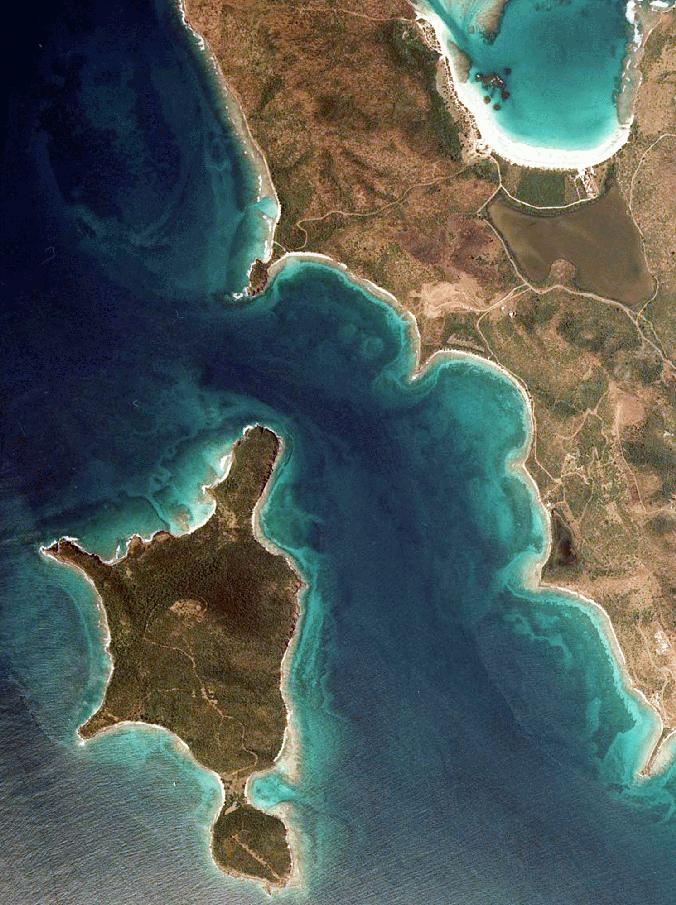
FIGURE 1b. Benthic habitat map of the LPCNR (from Hernández-Delgado, 6 2003).
FIGURE 2. Change in coral species richness at CR1. 21
FIGURE 3. Change in coral cumulative species richness at CR1. 22
FIGURE 4. Change in coral colony abundance at CR1. 23
FIGURE 5. Relationship among the cumulative coral colony abundance 24 and species richness at CR1.
FIGURE 6. Dynamics of the mean colony abundance at CR1 (1997-2003). 25
FIGURE 7. Change in the % of living coral cover at CR1. 26
FIGURE 8. Change in the % of total algal cover at CR1. 27
FIGURE 9. Change in the % of macroalgal cover at CR1. 29
FIGURE 10. Change in the % of filamentous algal cover at CR1. 30
FIGURE 11. Change in the % of cyanobacterial cover at CR1. 32
FIGURE 12. Change in the coral species diversity index at CR1. 34
FIGURE 13. Change in the coral species evenness at CR1. 35
FIGURE 14. Bray-Curtis dissimilarity classification and MDS-ordination 39 plot of yearly mean community structure at CR1.
FIGURE 15. Bray-Curtis dissimilarity classification and MDS-ordination 41 plot of yearly mean community structure at CR1 (with depth zones as replicates).
FIGURE 16. Yearly K-dominance curve of coral species at CR1. 49
FIGURE 17. Coral:Macroalgae ratios at CR1. 51
FIGURE 18. Diagram for the inference of favorability and predictability 53 of the coral reef environment at CR1 based on the relationship between coral H’n and J’n (after Alcolado et al., 1993).
FIGURE 19. Change in coral species richness at CR2. 65
FIGURE 20. Change in coral cumulative species richness at CR2. 66
FIGURE 21. Change in coral colony abundance at CR2. 67
FIGURE 22. Relationship among the cumulative coral colony abundance 68 and species richness at CR2.
FIGURE 23. Dynamics of the mean colony abundance at CR2 (1997-2003). 69
FIGURE 24. Change in the % of living coral cover at CR2. 70
FIGURE 25. Change in the % of total algal cover at CR2. 71
FIGURE 26. Change in the % of macroalgal cover at CR2. 72
FIGURE 27. Change in the % of filamentous algal cover at CR2. 73
FIGURE 28. Change in the % of cyanobacterial cover at CR2. 74
FIGURE 29. Change in the coral species diversity index at CR2. 76
FIGURE 30. Change in the coral species evenness at CR2. 77
FIGURE 31. Bray-Curtis dissimilarity classification and MDS-ordination 81 plot of yearly mean community structure at CR2.
FIGURE 32. Bray-Curtis dissimilarity classification and MDS-ordination 83 plot of yearly mean community structure at CR2 (with depth zones as replicates).
FIGURE 33. Yearly K-dominance curves for coral species at CR2. 90
FIGURE 34. Coral:Macroalgal ratios at CR2. 91
FIGURE 35. Diagram for the inference of favorability and predictability 92 of the coral reef environment at CR2 based on the relationship between coral H’n and J’n (after Alcolado et al., 1993).
FIGURE 36. Bubble plot showing the observed shifts of two of the benthic 99 community indicators at CR1: A) % Macroalgal cover; and B) % Cyanobacterial cover.
FIGURE 37. Bubble plot showing the observed shifts of two of the benthic 100 community indicators at CR1: A) % Macroalgal cover; and B) % Cyanobacterial cover.
FIGURE 38. Examples of major natural causes of coral mortality at the 109 LPCNR.
FIGURE 39. Other natural sources of coral mortality at the LPCNR. 110
FIGURE 40. Other natural sources of coral mortality at the LPCNR. 111
FIGURE 41. Coral mortality at the LPCNR results from a combination of 112 natural and anthropogenic factors.
FIGURE 42. Aerial views of examples of poor land management practices 113 in Culebra.
FIGURE 43. Other examples of poor land management practices in Culebra. 114
FIGURE 44. Examples of poor land use practices in Culebra. 115
FIGURE 45. Examples from dirt roads close to the shoreline. 116
FIGURE 46. Effects of sedimented and nutrient-loaded runoff in Culebra. 117
FIGURE 47. Aftermath of sedimented and nutrient-loaded runoff in Culebra. 118
FIGURE 48. Doppler radar image of an extreme rainfall event over Culebra 124 Island.
FIGURE 49. Top-down regulation model of a White-Plague Type II disease 130 outbreak.
FIGURE 50. Top-down regulation model of herbivory by the Long-Spined 131 Sea Urchin, Diadema antillarum.
FIGURE 51. Theoretical predicted interactions among herbivory and long- 132 term eutrophication effects in determining the dominant epibenthic components on shallow coral reefs.
FIGURE 52. Combined top-down and bottom up theoretical mechanisms 133 involved in the recent coral reef decline documented in the LPCNR.
FIGURE 53. Theoretical predictions of alternate stable states of the 139 LPCNR coral reefs.
TABLE A1. Summary of the statistical power of the sampling effort at CR1.
FIGURE A1. Draftman plot of coral species diversity indices at CR1 (1997).
FIGURE A2. Draftman plot of coral species diversity indices at CR1 (1998).
FIGURE A3. Draftman plot of coral species diversity indices at CR1 (1999).
FIGURE A4. Draftman plot of coral species diversity indices at CR1 (2001).
FIGURE A5. Draftman plot of coral species diversity indices at CR1 (2002).
TABLE A2. Summary of the statistical power of the sampling effort at CR2.
FIGURE A6. Draftman plot of coral species diversity indices at CR2 (1997).
FIGURE A7. Draftman plot of coral species diversity indices at CR2 (1998).
FIGURE A8. Draftman plot of coral species diversity indices at CR2 (2001).
FIGURE A9. Draftman plot of coral species diversity indices at CR2 (2002).
TABLE A3. Magnitude of changes in coral reef epibenthic parameters for the period of 1997 to 2002 at CR1 per each depth zone.
TABLE A4. Magnitude of changes in coral reef epibenthic parameters for the period of 1997 to 2002 at CR2 per each depth zone.
TABLE A5. Summary of some examples of rate of changes in the % of coral cover through the Caribbean during the last three decades (modified after Gardner, 2002).
TABLE A6. Coral:algal ratios at CR1.
TABLE A7. Coral:algal ratios at CR2.
Introduction.
Puerto Rican coral reefs have been shown to suffer moderate to severe signs of degradation (Mckenzie and Benton, 1972; Goenaga and Cintrón, 1979; Goenaga, 1988; Goenaga and Boulon, 1992; Hernández-Delgado and Sabat, 1998; Hernández-Delgado, 1992, 2000, 2001a, 2002, in press; Weil et al., 2002; García et al., 2003). The most significant threatening anthropogenic factors affecting coral reefs in Puerto Rico include water quality degradation, sedimentation, eutrophication, overfishing, loss of essential fish habitats, collection of reef fishes and invertebrates for the aquarium trade, historical coral collection, uncontrolled recreational activities and military activities (Goenaga, 1986, 1991; Hernández-Delgado, in press). Most coral reefs are characterized by showing a shift towards dominance by filamentous algae and macroalgae, with a simultaneously high partial coral tissue mortality and bioerosion rates (HernándezDelgado, 2000, 2001a, 2002). Although there is a major concern that coral reefs are also rapidly declining within most of the Natural Reserve systems in Puerto Rico (HernándezDelgado, 2001b), there is a general lack of quantitative information about this trend.
Severe degradation has been extensive on most inshore coral reefs, while those coral reefs located far offshore showed lower environmental degradation (HernándezDelgado, 2000). Quantitative assessments have also shown that remote coral reef epibenthic and fish communities are generally in better ecological condition than those inshore (Hernández-Delgado and Sabat, 1998; Hernández-Delgado, 2000). However, some remote and apparently healthy coral reefs, such as those located within the Luis
Peña Channel No-Take Natural Reserve (LPCNR), Culebra Island, are already showing significant sings of degradation possibly as an indirect result of overfishing (HernándezDelgado et al., 1998; Hernández-Delgado, 2000), in combination with recurrent acute White Plague Type II outbreaks (Hernández-Delgado, 2001a, 2002), and potential water quality degradation due to inadequate or total lack of erosion and sedimentation controls, poor land use, and the lack of sewage treatment facilities in Culebra Island (HernándezDelgado, 2001a).
One of the major concerns of the Puerto Rico Department of Natural and Environmental Resources (PRDNER) to designate the LPCNR in year 1999, besides the protection and restoration of reef fishery resources, was to eliminate major stressing factors causing coral reef declines within the Reserve (Pagán-Villegas et al., 1999). Therefore, it was expected that, recovery of reef fish resources within the LPCNR following its designation (Hernández-Delgado, in preparation) should have been of major benefits for the coral reef epibenthic community. But that has not been the case.
Hernández-Delgado (2001, 2002) reported a continuous major decline of coral reef epibenthic communities, even through the years following the LPCNR’s designation. Major causes pointed out were recurrent coral disease outbreaks (mostly White Plague Type II) and preemptive outcompetition and overgrowth by macroalgae. It was suggested that overfishing was not anymore one of the major causes of coral decline, as suggested previously by Hernández-Delgado (2000). Instead, local events such as water quality degradation (i.e., chronic recurrent nutrient pulses during heavy rainfall events), in combination with regional events (i.e., disease outbreaks), were suspected as major
causes of concern. These findings contradicted the paradigm that predicts that restoration of overfished reef fish communities will contribute to prevent or stop declines of coral reef epibenthic communities.
The main objective of this study was to expand the existing baseline data bank regarding the ecological status of the coral reef epibenthic communities within the LPCNR by evaluating long-term ecological change at two study sites located within the Reserve between the years of 1997 and 2003. Our second objective was to evaluate the effectiveness of the LPCNR in enhancing the overall coral reef essential fish habitat (EFH) quality by maintaining a high percentage of living coral cover and a highly diverse coral community in a good ecological condition. By “good ecological condition” we mean a coral reef community that is not showing a statistically significant decline or a shift towards algal dominance. Finally, multivariate analysis techniques were tested for their ability to discriminate patterns of temporal variation in the structure of coral reef epibenthic communities at each site.
Methods.
Study sites.
The quantitative long-term monitoring of coral reef epibenthic communities was carried out in the coral reefs off Carlos Rosario Beach, Culebra, Puerto Rico (Figure 1a,b). The two sampling stations are located at: CR1 (18°19.570' E; 65°19.911' W) and at CR2 (18°19.746' E; 65°19.959' W). Major descriptions of habitat types within the
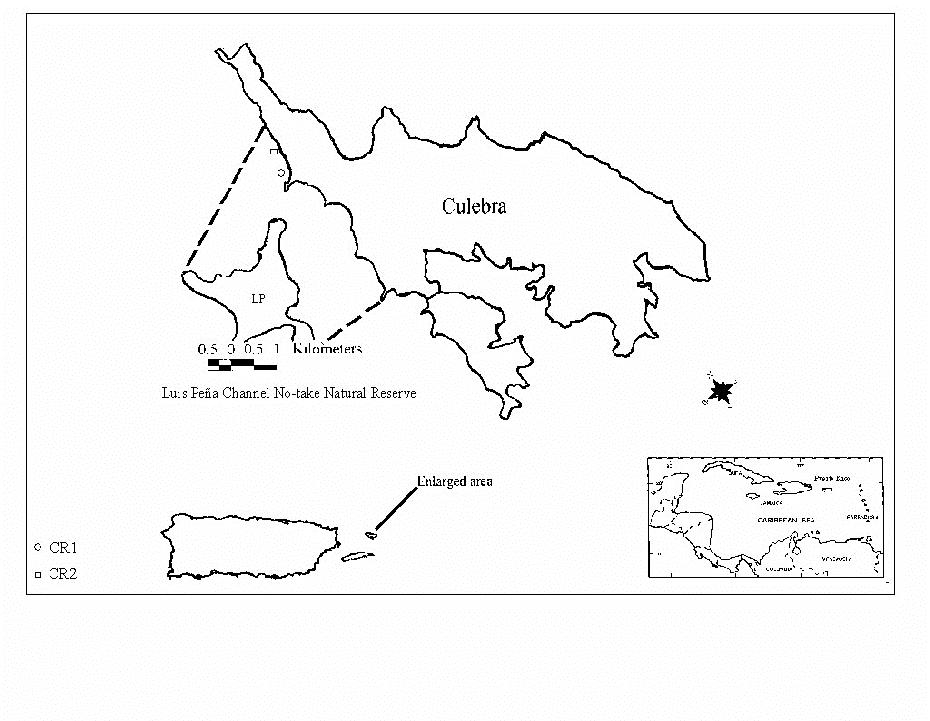
1a. Study sites at the LPCNR.
500 m
Linea r ree fs wi th some s pur and groove s
C oloni zed bedr ock
C oloni zed pavem ent
C oloni zed pavem ent wi th cha nnels
D ispe rsed cor als and rocks
A ggr egate d patch reefs
Mac roal gal pl ain s (10-50% )
Seagr asses ( Cont i nuous)
Seagr asses ( 70-90% )
Seagr asses ( 30-50% )
Sand
500 m
FIGURE 1b. Benthic habitat map of the LPCNR (from Hernández-Delgado, 2003).
LPCNR, as well as coral, fish, macroinvertebrate and algal species checklists can be found at Hernández-Delgado et al. (1998, 2000, 2002); Hernández-Delgado and Sabat (1998); Pagán-Villegas et al. (1999), Hernández-Delgado (2000, 2001a, 2002, 2003), and at Hernández-Delgado and Rosado (2001, 2003). Data was collected in years 1997, 1998, 1999, 2001, 2002, and 2003 at CR1, and in years 1997, 1998, 2001, 2002, and 2003 at CR2.
Long-tem monitoring of coral reef epibenthic communities
Each long-term monitoring station was permanently marked in 1997 with masonry nails driven to the reef bottom. Colored tags were used to facilitate their relocation. Ten replicate 10-m long transects were placed parallel to the shoreline following three different depth zones: I (<4 m); II (4-8 m); and III (>8 m). A total of 2 replicate transects were initially established at depth zone I, and 4 at each one of zones II and III. But in year 2001, transect replicates were increased to 4 at zone I to increase statistical power of the data at this zone (Hernández-Delgado, 2001a). Depths at CR1 ranged from 4 to 8 m, while depths at CR2 ranged from 3 to 11 m.
In order to answer the first question, if there were any significant short-term changes in coral reef epibenthic communities, the line-intercept transect (LIT) method (Loya and Slobodkin, 1971) was used, in combination with high-resolution digital photograph. Data was collected using a Canon Powershot G2 digital still camera (4.0 megapixels), provided with a Ikelite UW Housing, a Ikelite DS125 UW Strobe, a 24 mm Olympus external UW wide angle lens, and a Lexar 1.0 GB flashcard. Distance between
the camera and the transect line was kept constant at approximately 50 cm. Any coral colony or other epibenthic component was identified under the transect line, counted and their projected length under the transect line was measured to the nearest cm. According to Loya (1978), an individual colony is defined as "any colony growing independently of its neighbors (i.e., whenever an empty space is recorded between two adjacent colonies)”. In cases where an individual colony under the transect line was partially separated into two or more portions by tissue mortality, but there was still physiological connection between the partially separated tissues outside of the transect line, it was considered as one individual. But, in cases where an individual colony under the transect line was completely separated into two or more portions by tissue mortality (physiological fragmentation), each individual fragment was considered as a separate individual. This aspect is very important given the fact that partial colony mortality can produce physiological splitting of corals (Bythell et al., 1993; Hernández-Delgado 2000, 2001a, 2002). In the case of two or more colonies growing one above the other and underlying the transect line, the projected length of the largest colony was recorded for living coverage analysis (Loya, 1978).
The LIT method allowed us to determine the coral species richness, colony abundance, percentage cover of all major epibenthic components (i.e., corals, algal functional groups, sponges, other macroinvertebrates), and to document the coral species diversity index, measured as H’n and H’c (Shannon and Weaver, 1948) and evenness, measured as J’n and J’c (Pielou, 1966a,b). H’n was calculated according to the following formula:
H’n= - pi (ln pi),
where pi is the proportion of the number of colonies of the ith species from the total number of coral colonies of all species, and ln is the natural logarithm of pi. J’n was calculated according to the following formula:
J’n= H’n observed/H’n max, where H’n max= lnS, and S is the coral species richness of the sample. A similar approach was followed to calculate H’c and J’c, but all coral species proportions data was substituted by the relative percentage of coral cover for each species.
No significant difference was observed between the standard LIT method and the modified photo-LIT method for coral/algal cover and species diversity (HernándezDelgado, unpublished data; as cited by Hernández-Delgado, 2001a). Data on counts (i.e., species richness, colony abundance) was square root-transformed (X’= √X; or X’= √(X+0.5), if there were zeros), while data on proportions was transformed to arcsine (√X), as described by Zar (1984). Data on major descriptive parameters was analyzed between years and transects by means of a non-parametric Friedman two-way ANOVA (Hernández-Delgado, 2000) in order to test the null hypothesis of no significant differences between years and between depths.
The statistical power of sampling effort was calculated for each depth zone per year using the following formula: 1-(Standard error/Mean). Data was summarized in Tables A1 and A2 in the Appendix and shows that statistical power is generally strong for the most significant indicator parameters, particularly with increasing time. Also, increasing the number of replicate transects in the shallowest depth zone in 2001 has increased the statistical power of the data.
Multivariate analysis of coral reef communities
Multivariate analysis techniques were tested for their ability to discriminate patterns of temporal variation in the structure of coral reef epibenthic communities at each site. The coral reef community data set, based on the proportional cover of each major benthic component category, was compiled into a matrix and imported into
PRIMER ecological statistics software package (Clarke, 1993; Clarke and Warwick, 1994, 2001) for multivariate analysis. Raw proportional cover values were square roottransformed in order to appropriately weight the less abundant benthic categories (Clarke and Warwick, 2001; McField et al, 2001). Data from each year was first classified with hierarchical clustering (CLUSTER) using the Bray-Curtis group average linkage method (Bray and Curtis, 1957; Simboura et al., 1995) and then ordinated using a non-metric multidimensional scaling (MDS) plot (Kenny and Rees, 1994; Clarke and Warwick, 2001). Depth zones were used as replicates (n=3) per year (n=6 at CR1; n=5 at CR2).
Sample labels corresponded to replicate transects per year. Variable labels corresponded to the epibenthic components categories (i.e., coral species, algal functional groups, cyanobacteria, sponges).
Significant differences between groups of years were tested using PRIMER’s multivariate equivalent of an ANOVA called ANOSIM, which means “analysis of similarities” (Clarke and Green, 1988; Clarke, 1993; Clarke and Warwick, 2001). Both, global and pairwise tests were carried out by means of ANOSIM. The global ANOSIM test was used to test the hypotheses that there were no significant differences in the structure of coral reef epibenthic communities between years, and between depth zones. A 2-way crossed ANOSIM test was used to test the hypothesis that there were no interaction effects between years and depth zones. A pairwise ANOSIM was used to test the hypothesis that there was no difference in the structure of coral reef epibenthic communities between different pairs of years, and between different pairs of depth zones. All of these tests were based on 5000 permutations and had no built in assumptions about the data distribution (Mcfield et al., 2001). They key taxa responsible for the differences between groups of sites were determined using PRIMER’s SIMPER routine (Clarke, 1993; Clarke and Warwick, 2001).
Analysis of disturbance effects.
The Caswell (1976) neutral model was used to compare the observed coral species diversity with an ecologically “neutral” community constructed by the model using the same number of species and individuals as the observed community. The neutral model assumes random birth (recruitment) and death, random immigrations and emigrations, and no interaction between species. The equitability component of the coral species diversity at each study site was compared with a theoretical expectation for
diversity by calculating the Caswell’s V statistic using the PRIMER ecological statistics software package (Clarke and Warwick, 2001) for univariate analysis. V statistic values
>+2 or <-2 indicate significant departures from neutrality. A value of zero for the V statistic indicate neutrality, positive values indicate greater diversity than predicted and negative values lower diversity (Clarke and Warwick, 2001). This test was used to test the hypothesis that there were no significant departures from neutrality in the observed coral species diversity between depth zones per year, and between years. Any significant departure would be considered an indicator of disturbance. Finally, an ordinary Kdominance curve (Lambshead et al., 1983) was constructed based on the % of cumulative dominance (abundance) of corals and species ranks to determine if there was any significant disturbance effect on the coral community. Any shift in the position of the Kdominance curve could be an indicator of stressful conditions (Warwick, 1986).
Results.
Ecological change at CR1.
Epibenthic community data summaries from years 1997 to 2003 have been summarized in Tables 1 to 4. There was a significant 32 to 40% decline in the mean coral species richness between years 1997 and 2002 at all depth zones (Figure 2), with a peak decline of 40% for the depth zone II. Annual species richness decline averaged 8% at this zone within that period of time. However, there was a slight increase in the mean coral species richness between years 2002 and 2003 as a result of coral recruitment processes. The cumulative coral species richness also remained lower than in many of
the previous years (Figure 3, Table 5). There was also a significant 32 to 58% decline in the mean abundance of coral colonies per transect for the period of 1997 to 2002 (Figure 4). The sharpest decline in colony abundance was observed at depth zone I, with 58%, which averaged nearly a 12% annual decline. However, this declining trend slowed down to only 4% between years 2002 and 2003. This was the result of a buffering effect of a combined increase in physiological fragmentation in some colonies of the Montastraea annularis species complex and an increase in the abundance of coral recruits. In spite of that, there was also additional mortality of some old surviving fragments. The cumulative abundance of corals remained moderately low (Figure 5, Table 6). Differences observed in the above parameters were significant for both, the year and depth factors (Table 3). There has been a continuous trend of declining colony abundance of the dominant species, M. annularis, as a result of partial colony mortality, followed by physiological fragmentation of parental colonies, and subsequent mortality of the surviving fragments (Figure 6). However, this trend just stopped during year 2003, where a slight increase in colony abundance was recorded as a result of further colony physiological fragmentation. However, the loss of many rare and low-abundant coral species remained mostly unchanged
There were significant changes in the percentage cover of the major coral reef epibenthtic components at CR1 during the same period of time. Living coral cover declined significantly by a factor of 33 to 50% within the period of 1997 to 2002 (Figure 6), an average annual decline of 7 to 10%. However, this annual declining trend was
TABLE 1a. Summary of the coral community data at CR1 (1997-1999)*.
*Mean±one standard error; N.D.= Not determined.
TABLE 1b. Summary of the coral community data at CR1 (2001-2003)*.
*Mean±one standard error; N.D.= Not determined.
TABLE 2a. Summary of the % of relative coral cover at CR1 (1997-1999).
Helioseris cucullata
fragum
sinuosa
Eusmilia fastigiata
Scolymia lacera
Mussa angulosa
Millepora squarrosa
TABLE 2b. Summary of the % of relative coral cover at CR1 (2001-2003). Species
clivosa
fragilis
Agaricia lamarcki
Helioseris cucullata
Favia fragum
aliciae
Isophyllia sinuosa
Eusmilia fastigiata
Scolymia lacera
Mussa angulosa
Tubastrea coccinea
alcicornis
Millepora complanata
Millepora squarrosa
TABLE 3. Friedman 2-way ANOVA for the coral reef community data at CR1.
*D.F.= Degrees of freedom.
**(S)= Significantly different. Numbers in italics at the factor Year represent mean ranks per year (1=1997; 2=1998; 3=1999; 4=2001; 5=2002; 6=2003) and at the factor Depth represent mean ranks per depth zone (1= < 4 m; 2= 4-8 m; 3= >8 m)
***Species richness and colony abundance were √x-transformed. Coral, total algal, macroalgal and filamentous algal, Halimeda spp., encrusting algal, cyanobacterial and sponge cover were Arcsin (√x)transformed. Calcareous algal cover was Arcsin (√x+0.002)-transformed. Didemnid tunicate cover was Arcsin (√x+0.0005)-transformed.
TABLE 4. Friedman 2-way ANOVA for the % of relative coral cover data at CR1.
Parameter
*D.F.= Degrees of freedom
**(S)= Significantly different. Numbers in italics at the factor Year represent mean ranks per year (1=1997; 2=1998; 3=1999; 4=2001; 5=2002; 6=2003) and at the factor Depth represent mean ranks per depth zone (1= < 4 m; 2= 4-8 m; 3= >8 m). All proportions were Arcsin(√x)-transformed. If there were 0 values in the data matrix, then proportions were Arcsin(√x + the lowest value of non-zero proportions)-transformed.
FIGURE 2. Change in coral species richness (mean±one standard error).
FIGURE 3. Change in coral cumulative species richness at CR1.
TABLE 5. Exponential regression analysis between the cumulative coral species richness and the cumulative number of replicate transects at CR1.
FIGURE 4. Change in coral colony abundance at CR1 (mean±one standard error).
FIGURE 5. Relationship among the cumulative coral colony abundance and species richness
TABLE 6. Exponential regression analysis between the cumulative coral species richness and the cumulative colony abundance at CR1.
9536
y= 21.69(1-e -0 0079x) 0 9404
y= 16.57(1-e -0 0108x) 0 9381
y= 17.43(1-e -0 0112x) 0 9512 2003 y= 16.96(1-e -0 0122x) 0 9715
Continued physiological fragmentation event caused by W P-II
Major physiological fragmentation event caused by
Major mortality of coral physiological fragments caused by W P-II
Mortality of rare coral species F) 2003
Physiological fragmentation
Species
FIGURE 6. Dynamics of
FIGURE 7. Change in the % of living coral cover at CR1 (mean±one standard error).
FIGURE 8. Change in the % of total algal cover at CR1 (mean±one standard error).
reversed between years 2002 and 2003. For the first time since 1997, there was a mean 5% increase in the percentage of living coral cover. However, differences were still highly significant at both, the year and depth factors (Table 3). But in contrast, total algal cover showed a highly significant 55% increase between years 1997 and 2003 (Figure 8), with the highest increase documented at the depth zone II. Annual total algal cover mean increase was 9%. Among the different algal functional groups, macroalgae showed the highest increase in percentage cover for the same 6-year period of time, with 638%, with a mean annual increase of 106% (Figure 9). Macroalgal cover was significantly higher on deeper habitats (Tables 1 and 3). Filamentous algal cover have declined by 67% between years 1997 and 2003. However, filamentous algal cover was significantly higher in shallower habitats (Figure 10), but fluctuations were no different in time (Table 3). Cover values of other minor algal groups, such as erect calcareous algae, Halimeda spp., and encrusting algae (Tables 1 and 3) showed non-significant fluctuations in time and depth, with the exception of the encrusting algal cover that was significantly higher at shallower depths. Our study basically points out that there has been a major shift in the dominance of filamentous algae in 1997 towards dominance by macroalgae in recent years following the significant coral mortality events, a trend which may suggest water quality degradation.
Cyanobacterial cover showed a minor fluctuation during the initial four years of the long-term study (Figure 11). However, there has been a mean 470% increase in cyanobacterial cover between years 1997 and 2003. This difference in time was just marginally significant. Cyanobacterial percentage cover, increased between years 2001
FIGURE 9. Change in the % of macroalgal cover at CR1 (mean±one standard error).
FIGURE 10. Change in the % of filamentous algal cover at CR1 (mean±one standard error).
and 2003 by a factor of 324% in depth zone III, by a factor of 437% in depth zone II, and rocketed by a factor of 937% at depth zone I. Large variation due to the patchy nature of cyanobacterial distribution, however, caused this increase to remain statistically nonsignificant (Table 3). Sponge cover increased by a mean factor of 5% between years 2002 and 2003, and a total mean of 38% for the entire period of the study. Sponge cover was significantly higher at deeper zones (Tables 1 and 3). Finally, didemnid tunicate percentage cover kept at 0% during the first 5 years of the study. During 2003, mean didemnids percentage cover was 0.13%, a significant increase in comparison to previous years. This was mostly composed by the Encrusting Mat Tunicate, Trididemnum solidum, and in a minor degreee by Didemnum sp.
A total of 31 coral species have been identified from the permanent transects through the study (Table 2). Montastrea annularis was the dominant reef-building coral species at CR1 through the study. It showed a consistently significant increase in the mean relative cover (Table 4). Although many rare coral species have disappeared during the study (Figure 6), these differences were not significant (Table 4), and were mostly as a result of the large variation in the data, which is normal for rare species. During 1997, the top three dominant species per depth zone were: I= M. annularis (82%), Porites astreoides (10%), and Agaricia agaricites (3%); II= M. annularis (81%), P. astreoides (4%), and M. cavernosa (3%); and III= M. annularis (73%), M. cavernosa and Erythropodium caribbaeorum (5%). During 1998, the top three dominant species per depth zone were: I= M. annularis (85%), P. astreoides (6%), and P. porites (3%); II= M. annularis (79%), P. astreoides, Colpophyllia natans and E. caribbaeorum (4%); and III=
FIGURE 11. Change in the % of cyanobacterial cover at CR1 (mean±one standard error).
Montastraea annularis (72%), Erythropodium caribbaeorum (6%), and Porites
astreoides (4%). At 1999, dominant species were: I= M. annularis (82%), followed by P. astreoides (7%), and Agaricia agaricites 4%); II= M. annularis (78%), P. astreoides (4%), and E. caribbaeorum (3%); and III= M. annularis (63%), followed by E. caribbaeorum (9%), and . A. agaricites and M. cavernosa (5%). During year 2001, the dominant coral species were: I= M. annularis (89%), followed by P. porites (4%), and P. astreoides (3%); II= M. annularis (87%), P. astreoides (4%), and Colpophyllia natans (3%); and III= M. annularis (81%), E. caribbaeorum (7%), and P. porites (4%). During year 2002, dominant species included: I. M. annularis (89%), P. porites (3%), and P. astreoides (2%); II= M. annularis (87%), P. astreoides (6%), and M. cavernosa (2%); and III= M. annularis (78%), followed by M. cavernosa (6%), and P. astreoides (5%). Finally, dominant species during 2003 included: I. M. annularis (87%), P. porites (5%), and P. astreoides (3%); II= M. annularis (87%), C. natans (5%), and M. cavernosa (3%); and III= M. annularis (76%), followed by M. cavernosa (7%), and E. caribbaeorum (4%). The coral species diversity index (H’n) showed only a marginally significant decline (Figure 12), but with a slight increase in year 2003 in comparison to year 2002 (Table 1). However, coral species evenness (J’n) showed minor non-significant fluctuations (Figure 13). But, both, H’c and J’c showed significant fluctuations during the study (Tables 1 and 3).
Year - 1997 - 1998 - 1999 - 2001 - 2002 - 2003
FIGURE 12. Change in the coral species diversity index at CR1 (mean±one standard error).
FIGURE 13. Change in the coral species evenness at CR1 (mean±one standard error).
TABLE 7a. Summary of the quadratic regression analysis results between the % of total algal cover and several coral parameters.
Parameters
% Algal cover vs Species richness
% Algal cover vs Colony abundance
% Algal cover vs % Coral cover
% Algal cover vs Coral H’n
-14.47+94.30x-101.6x 2 0.5743
5.50+23.71x-41.90x 2 0.4867
-1.36+8.08x-8.723x 2 0 9887
A quadratic regression analysis was carried out at each depth zone between the % of total algal cover and four coral parameters, including species richness, colony abundance, % of coral cover and H’n (Table 7a). In general, there was a moderate to strong negative relationship between the % of total algal cover and species richness, with r 2 values ranging from 0.4867 to 0.9111. There was a similarly moderate to strong negative relationship between the % of total algal cover and coral colony abundance, with r 2 values fluctuating between 0.5559 and 0.8832. Algal cover also showed a consistently strong negative relationship with the % of coral cover, with r2 values of 0.8953 to 0.9887. Also, it showed a moderately week to strong negative relationship with coral H’n, with r2 values ranging from 0.3486 to 0.9185. These results suggest that algal growth during the last six years could explain most of the coral decline observed so far at CR1. This was more evident at depth zone III.
TABLE 7b. Summary of the quadratic regression analysis results between the % of macroalgal cover and several coral parameters.
Parameters
% Macroalgal cover vs Species richness
%Macrolgal cover vs Colony abundance
%Macroalgal cover vs % Coral cover
% Macroalgal cover vs Coral H’n
8.79-35.31x+74.62x 2 0.9888
10.51-41.09x+86.58x 2 0.7354
1.31-26.20x+28.95x 2 0.3417
52.84-270.7x+492.6x 2 0.9936
35.72-124.4x+248.9x 2 0.4868
4.47-36.78x-20.53x 2 0.4717
0.55-1.52x+2.50x 2 0 9177
0.81-3.72x+7.75x 2 0 8242
0.76-2.00x+2.34x 2 0 8389
1.52-4.41x+10.43x 2 0.8649
1.83-5.86x+11.29x 2 0.7963
1.99-3.41x+4.57x 2 0.8882
A similar analysis was carried out at each depth zone between the % of macroalgal cover and the same coral parameters (Table 7b). In general, there was a moderately weak to strong negative relationship between the % of macroalgal cover and species richness, with r2 values ranging from 0.3417 to 0.9888. There was a moderate to strong negative relationship between the % of mcroalgal cover and coral colony abundance, with r2 values fluctuating between 0.4717 and 0.9936. Macroalgal cover also showed a consistently strong negative relationship with the % of coral cover, with r2 values of 0.8242 to 0.9177. Also, it showed a consistently strong negative relationship with coral H’n, with r2 values ranging from 0.7963 to 0.8882. These results also suggest that macroalgal growth during the last six years could explain most of the coral decline observed so far at CR1. This pattern was evident through all depth zones.
TABLE 8. Yearly mean dissimilarity matrix of CR1.
Multivariate analysis of coral reef communities at CR1.
A hierarchical cluster analysis was carried out based on a Bray-Curtis dissimilarity matrix on the proportion of major epibenthic components to characterize the structure of the coral reef communities through time using mean annual values (Figure 14). In addition to the relative proportion of coral species,the relative proportion of algal functional groups, cyanobacteria, sponges and didemnid tunicates were included. This approach is more representative of the coral reef community (Mcfield et al., 2001). Table 8 shows the dissimilarity matrix between years. This is a measure of how different was the coral reef epibenthic community structure between different pairs of years. Dissimilarity through the study averaged 14.4% and kept consistently increasing through time. The largest dissimiliaty was observed for the time period between years 1997 and 2003, with 20.4%. However, there was also a mean 11.6% difference between years 2002 and 2003. The classification of sites based on broad categorical data by hierarchical clustering of mean yearly data was able to differentiate four different temporal clusters when using 10% dissimilarity as the cutoff value (Figure 14). These clusters are also
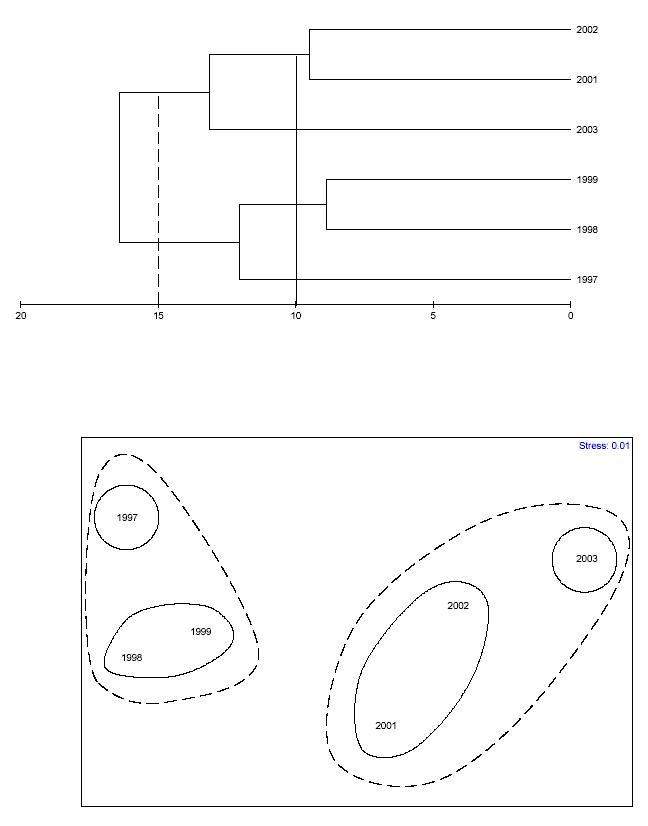
FIGURE 14. Bray-Curtis dissimilarity classification and MDS-ordination plot of yearly mean community structure at CR1 (based on the proportion of coral reef epibenthic categories). The solid line represents the 10% dissimilarity level. Dashed line represents 15% dissimilarity level.
consistent with major recurrent events of coral mortality and subsequent macroalgal overgrowth. Two different temporal patterns emerged when using the 15% dissimilarity cutoff value. These show a similar trend. Temporal-based clusters were more clearly distinguished in the MDS ordination. The stress level of the MDS plot was only 0.01. A similar temporal pattern analysis was carried out to yearly mean data, but using depth zones as replicates (Figure 15). Mean dissimilarity was 19.1%. A total of 14 temporal clusters emerged when using 10% dissimilarity as the cutoff value, while only 8 patterns were shown when using 15% dissimilarity as the cutoff value. The stress level of the MDS plot was 0.17. The global 2-way crossed ANOSIM test (Table 9) revealed a highly significant difference (0.0%) of the coral reef community structure between years, but no difference between depth zones (8.5%). However, the interaction of years x depth was highly significant (1.4%). The pairwise ANOSIM test (Table 10) revealed highly significant differences in the coral reef community structure at CR1 between years 1997 and 2003 (0.0%), 1998 and 2003 (0.1%), 1999 and 2003 (0.0%), 2001 and 2003 (0.0%), and between 2002 and 2003 (1.6%). A pairwaise ANOSIM test between depth zones (Table 11) revealed no significant differences. The results of the SIMPER analysis comparing change from year 1997 to the subsequent years until 2003 (Tables 12a-e) revealed that change in the proportion of macroalgae was the most significant factor influencing the observed differences in the structure of coral reef epibenthic communities at CR1.
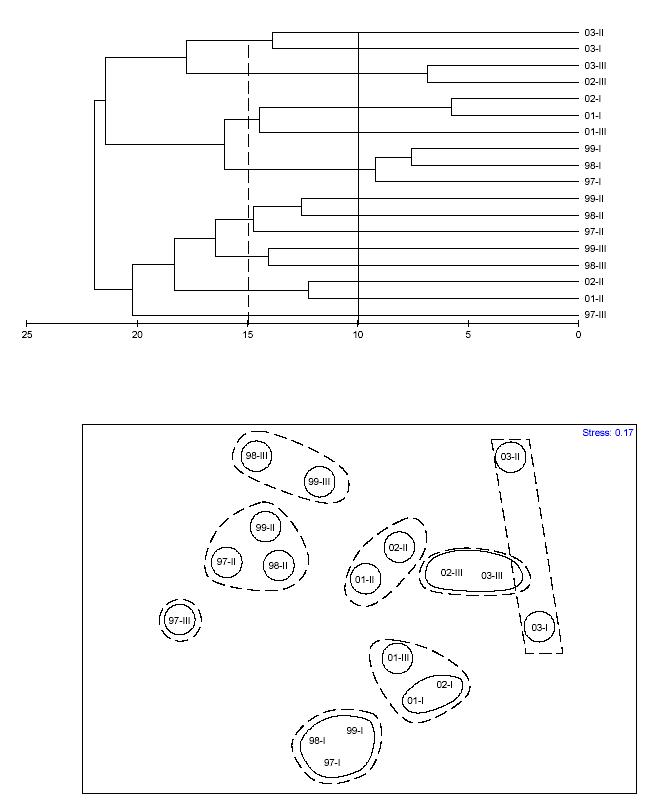
FIGURE 15. Bray-Curtis dissimilarity classification and MDS-ordination plot of yearly mean community structure at CR1 (with depth zones as replicates). Data was based on the proportion of coral reef epibenthic categories The solid line represents the 10% dissimilarity level. Dashed line represents 15% dissimilarity level.
TABLE 9. Results of the 2-way crossed ANOSIM test* for significant differences of coral reef epibenthic community structure at CR1.
*Square-root transformed data. Based on 5,000 permutations.
TABLE 10. Results of the pairwise ANOSIM significance test* between years at CR1.
1998 vs 2003
*Square-root transformed data. Based on 5,000 permutations. S= Significant.
TABLE 11. Results of the pairwise ANOSIM significance test* between depth zones at CR1.
*Square-root transformed data. Based on 5,000 permutations. S=Significant.
**I= <4 m; II= 4-8 m; III= >8 m.
Filamentous algae, total algae and cyanobacteria were also important factors. A similar analysis carried out to data from year 1998 vs. the following years (Tables 13a-d) showed that macroalgae, filamentous algae and the Encrsuting Gorgonian, Erythropodium caribbaeorum, were the most significant epibenthic components affecting the coral reef community structure. Macroalgae and E. caribbaeorum caused the most significant variation in community structure for the periods of 1999 to 2003 (Table 14a-c).
Cyanobacteria and filamentous algae caused the most significant variation for the period of 2001 to 2003 (Table 15a,b). Filamentous algae caused the most significant variation between years 2002 and 2003 (Table 16). This analysis showed that coral reef communities are highly dynamic and change in community structure can result from shifts in the dynamics of different coral reef epibenthic components on different temporal scales.
TABLE 12a. Results of the SIMPER analysis of years 1997 vs 1998 at CR1.
TABLE 12b. Results of the SIMPER analysis of years 1997 vs 1999 at CR1.
TABLE 12c. Results of the SIMPER analysis of years 1997 vs 2001 at CR1.
TABLE 12d. Results of the SIMPER analysis of years 1997 vs 2002 at CR1.
TABLE 12e. Results of the SIMPER analysis of years 1997 vs 2003 at CR1.
TABLE 13a. Results of the SIMPER analysis of years 1998 vs 1999 at CR1.
TABLE 13b. Results of the SIMPER analysis of years 1998 vs 2001 at CR1.
TABLE 13c. Results of the SIMPER analysis of years 1998 vs 2002 at CR1.
TABLE 13d. Results of the SIMPER analysis of years 1998 vs 2003 at CR1.
TABLE 14a. Results of the SIMPER analysis of years 1999 vs 2001 at CR1.
TABLE 14b. Results of the SIMPER analysis of years 1999 vs 2002 at CR1.
TABLE 14c. Results of the SIMPER analysis of years 1999 vs 2003 at CR1.
TABLE 15a. Results of the SIMPER analysis of years 2001 vs 2002 at CR1.
TABLE 15b. Results of the SIMPER analysis of years 2001 vs 2003 at CR1.
TABLE 16. Results of the SIMPER analysis of years 2002 vs 2003 at CR1.
TABLE 17. Summary of the Caswell’s neutral model V statistics for CR1.
*Non-significant departures from neutrality. Values >+2 or <-2 indicate significant departures from neutrality.
Indicators of disturbance effects at CR1.
The equitability component of the coral species diversity at CR1 was compared with a theoretical expectation for diversity by calculating the Caswell’s V statistic for each depth zone and each year (Table 17). V statistic values were consistently negative and significantly distant from neutrality at all depth zones and all years, with the exception of depth zone I during 1997 and 2002. These observations suggest that CR1 showed a coral diversity below the neutral model predictions and that some kind of stressful disturbance has caused a significant decline in diversity at all depth zones and at all years during the 6-year long study. Disturbances could be the result of recurrent regional factors (i.e., coral disease outbreaks) and recurrent local factors (i.e., nutrient pulses associated to poor land use, sedimentation and lack of sewage treatment). These results are consistent with the intermediate disturbance hypothesis (Connell, 1978; Huston, 1979).
FIGURE 16. Yearly K-dominance curves of coral species at CR1.
The yearly K-dominance curve (Figure 16) showed that basically one coral species (Montastraea annularis species complex) was the dominant component of the coral community. But the magnitude of its dominance has shifted through time and has become stronger. This pattern has been the result of major disturbances that have caused the loss of several rare species typically composed of one or a few individuals. Further disturbances that can cause physiological fragmentation of large M. annularis colonies are expected to cause a further strengthening in its dominance in the near future. Thus Kdominance curves should be included in future monitoring efforts to have a better understanding of the long-term coral community dynamics.
The Coral:Macroalgae ratio is considered to be another indicator of the status of coral reefs, as well as an indicator of shifting coral reef community structures in a longterm basis. Coral:macroalgae ratios showed a major shift from dominance by corals towards dominance by macroalgae at CR1 (Figure 17; Table A6). This change was statistically significant in time, but remained similar through depths (Table 18).
Morover, Coral:Macroalgae ratios declined during year 2003 below the threshold 1:1 value at depth zones I and III, with 0.87, respectively. Coral:Macroalgae ratio at depth zone II plummeted down to 1.3. This magnitude of decline suggests that a major disturbance has caused a shift from coral- to macroalgal-dominance.
Preston and Preston (1975) developed a practical scheme using H’n and J’n to infer the intensity and predictability of environmental disturbance at the community level. Three different ecological scenarios can be inferred: 1) High indices of H’n and J’n suggest a favorable and predictable environment; 2) A low value of H’n coupled with a high value of J’n indicates a constantly severe environment; and 3) Low indices of H’n and J’n indicate an unpredictably severe environment. However, Alcolado et al. (1993) modified this scheme to infer 11 environmental inference zones. We used the modified Alcolado model to classify the intensity and predictability of environmental disturbance at CR1 (Figure 18). Basically, 3 different environmental scenarios were identified in CR1: A) Almost constantly severe environment (H’n= 1.3-2.0; J’n= 0.70-0.80; B) Severe and unpredictable environment (H’n=1.3-2.0; J’n=0.50-0.70); and C) Very severe and unpredictable environment (H’n= 0-1.3; J’n=0.50-0.70). Figure 18 illustrate a complex pattern of variations in the intensity and predictability of environmental conditions with
FIGURE 17. Coral:Macroalgae ratios at CR1. Horizontal dashed line indicates critical 1:1 baseline ratio.
TABLE 18. Friedman 2-way ANOVA of the Coral:Macroalgae ratios at CR1. Parameter
Figure 18. Diagram for the inference of favorability and predictability of the coral reef environment at CR1 based on the relationship between coral H’n and J’n (after Alcolado et al., 1993).
depth zone, suggesting that disturbance intensity and predictability has not been completely uniform with depth and that basically similar effects have been observed through al depth zones. However, the observed pattern suggests that there has been a general pattern towards a shift in the intensity and predictability levels from an almost constantly severe scenario towards a very severe and unpredictably environment. Disturbances occur in discrete pulses (i.e., a hurricane, White Plague outbreaks). This pulse-type pattern is reflected in the shape of the graph lines of Figure 18. Therefore, unpredictability will be reflected on a continuous complex pattern of changes. However, this suggests that CR1 has been constantly under a sort of natural and anthropogenic disturbances that have affected H’n and J’n as a result of coral colony mortality.
Ecological change at CR2.
Epibenthic community data summaries from years 1997 to 2003 have been summarized in Tables 19 to 21. There was a 27% decline in the mean coral species richness between years 1997 and 2003 at depth zone II, and a 14% decline at depth zone III, but a 33% increase at depth zone I (Figure 19; Table A4). There were significant differences only between depth zones, but not between years (Table 21). The cumulative coral species richness also showed a major decline through time (Figure 20, Table 23).
There was also a 28 to 40% decline in the mean abundance of coral colonies per transect at depth zones II and III (Figure 21; Table A4). Butm, there was a 7% increase in colony abundance at depth zone I as a result of a combination of coral recruitment and an increase in colony physiological fragmentation. There were significant differences only between depth zones, but not between years (Table 21). The cumulative abundance of corals also declined with the simultaneous decline in the cumulative species richness (Figure 22, Table 24). In most cases, there has been a continuous trend of declining colony abundance of the dominant species complex, Montastraea annularis, as a result of partial colony mortality, followed up by physiological fragmentation of parental colonies, and subsequent mortality of the surviving fragments (Figure 23).
There were significant changes in the percentage cover of the major coral reef epibenthtic components at CR2 during the period of 1997 to 2003 (Table A4). Living coral cover declined by factors of 50 to 66%, which means that there were annual decline rates of 8 to 11% in coral cover, which is also considered a dangerously high rate (Figure 24). Differences were significant at both, the year and depth factors (Table 21).
But in contrast, total algal cover showed a 28 to 241% increase (Figure 25), with the highest increase documented at the depth zone I. Annual mean increase fluctuated between 5 and 40%. Total algal cover was significantly higher through time and on deeper habitats (Table 21). Among the different algal functional groups, macroalgae showed a 104 to 315% increase in cover at all depth zones, respectively, with a mean annual increase of 17 to 53% (Figure 26). This was highly significant in time (Table 21). However, filamentous algal cover showed a 2,260% increase in shallower habitats (Figure 27), but a 81 to 85% decline in deeper zones. Differences were not significant due to the large variances.
Cover values of other minor algal groups, such as erect calcareous algae, Halimeda spp., and encrusting algae (Tables 19 and 21) showed non-significant fluctuations in time and depth.
Cyanobacterial cover was low during 1997 and 2001, but high during 1998 (ENSO year) and even higher during year 2002 and 2003 (Figure 28). The magnitude of increase between years 1997 and 2003 was from 161 to 1,370%, an annual mean of 27 to 228%. There were significant differences in time, but not in depth, suggesting that this phenomenon was widespread through the entire coral reef. Sponge cover increased by a factor of up to 400%, this fluctuation was only significant through depth zones (Tables 19 and 21).
A total of 31 coral species have been identified from the permanent transects through the study at CR2 (Table 20). The Montastraea annularis species complex was the dominant reef-building coral (Figure 23). It showed a consistently high mean relative cover, being significantly higher at shallower reef zones (Table 22). Although many rare coral species have disappeared during the study, these differences were not significant (Table 22), mostly as a result of the large variation in the data, which is normal for rare species. During 1997, the top three dominant species per depth zone were: I= M. annularis (83%), Porites astreoides (7%), and Agaricia agaricites (4%); II= M. annularis (78%), P. astreoides (10%), and A. agaricites (3%); and III= M. annularis (57%), Siderastrea siderea and Erythropodium caribbaeorum (8%).
During 1998, the top three dominant species per depth zone were: I= M. annularis (80%), P. astreoides (7%), and A. agaricites (4%); II= M. annularis (72%), P. astreoides (11%), and E. caribbaeorum (5%); and III= M. annularis (42%), E. caribbaeorum (17%), and P. astreoides (9%). During 2001, dominant species were: I= M. annularis (76%), followed up by P. porites (13%), and A. agaricites (5%); II= M. annularis (84%), P. porites and P. astreoides (3%); and III= M. annularis (61%), followed by Colpophyllia natans (11%), and P. porites (7%). During year 2002, dominant species included: I. M. annularis (78%), P. astreoides (4%), and A. agaricites (3%); II= M. annularis (84%), P. astreoides (4%), and A. agaricites (3%); and III= M. annularis (57%), followed up by Colpophyllia natans (12%), and M. cavernosa (7%). Finally, during year 2003, dominant species were: I= M. annularis (71%), followed by P. porites (18%), and A. agaricites
TABLE 19a. Summary of the coral community data at CR2 (1997-2003)*.
cyanobacteria
Didemnid tunicates
*Mean±one standard error; N.D.= Not determined.
TABLE 19b. Summary of the coral community data at CR2 (1997-2003)*.
cyanobacteria
Didemnid tunicates
*Mean±one standard error; N.D.= Not determined.
TABLE 20a. Summary of the % of relative coral cover at CR2 (1997-2003).
Isophyllia sinuosa
coccinea
complanata
Carijoa riseii
TABLE 20b. Summary of the % of relative coral cover at CR2 (1997-2003). Species
Diploria strigosa
Diploria clivosa
labyrinthiformis
Madracis mirabilis
Helioseris cucullata
Mycetophyllia lamarckiana
Mycetophyllia
Favia fragum
Isophyllia sinuosa
Eusmilia fastigiata
Scolimia lacera
Tubastrea coccinea
Millepora alcicornis
Millepora complanata
Carijoa riseii
TABLE 21. Friedman 2-way ANOVA for the coral reef community data at CR2.
*D.F.= Degrees of freedom.
**(S)= Significantly different. Numbers in italics at the factor Year represent mean ranks per year (1=1997; 2=1998; 3=2001; 4=2002; 5=2003) and at the factor Depth represent mean ranks per depth zone (1= < 4 m; 2= 4-8 m; 3= >8 m)
***Species richness and colony abundance were √x-transformed. Coral, total algal, macroalgal and filamentous algal cover were Arcsin (√x)-transformed. The remaining parameters were transformed as follows: Calcareous algae and Halimeda spp. cover: Arcsin (√x+0.002)-transformed; Encrustring algae: Arcsin (√x+0.00325)-transformed; Cyanobacterial cover: Arcsin (√x+0.0035)-transformed; Sponge cover: Arcsin (√x+0.00125)-transformed; and Didemnid tunicate cover: Arcsin (√x+0.00025)-transformed.
TABLE 22. Friedman 2-way ANOVA for the
*D.F.= Degrees of freedom.
**(S)= Significantly different. Numbers in italics at the factor Year represent mean ranks per year (1=1997; 2=1998; 3=2001; 4=2002; 5=2003) and at the factor Depth represent mean ranks per depth zone (1= < 4 m; 2= 4-8 m; 3= >8 m). All proportions were Arcsin(√x)-transformed. If there were 0 values in the data matrix, then proportions were Arcsin(√x + the lowest value of non-zero proportions)-transformed.
FIGURE 19. Change in coral species richness (mean±one standard error).
FIGURE 20. Change in coral cumulative species richness at CR2.
TABLE 23. Exponential regression analysis between the cumulative coral species richness and the cumulative number of replicate transects at CR2.
FIGURE 21. Change in coral colony abundance at CR2 (mean±one standard error).
FIGURE 22. Relationship among the cumulative coral colony abundance and species richness.
TABLE 24. Exponential regression analysis between the cumulative coral species richness and the cumulative colony abundance at CR2.
y= 17.45(1-e -0 0059x) 0 9322
y= 18.90(1-e -0 0068x) 0 9360
y= 13.69(1-e -0 0144x) 0 9615
Major mortality of coral physiological fragments caused by W P-II
Mortality of rare coral species
Major physiological fragmentation event caused by W P-II
Physiological fragmentation due to partial mortality associated to a major bleaching event
Species
Continued mortality of coral physiological fragments caused by W P-II
Continued mortality of rare coral species
2002
Species
FIGURE 23. Dynamics of the mean colony abundance at CR2 (1997-2003).
2003
FIGURE 24. Change in the % of living coral cover at CR2 (mean±one standard error).
FIGURE 25. Change in the % of total algal cover at CR2 (mean±one standard error).
FIGURE 26. Change in the % of macroalgal cover at CR2 (mean±one standard error).
FIGURE 27. Change in the % of filamentous algal cover at CR2 (mean±one standard error).
FIGURE 28. Change in the % of cyanobacterial cover at CR2 (mean±one standard error).
II= Montastraea annularis (85%), Porites astreoides (5%), and Millepora alcicornis and Agaricia agaricites (2%); and III= M. annularis (56%), followed up by Colpophyllia natans (11%), and M. cavernosa (9%).
Encrusting didemnid tunicates invaded coral colonies within the transects for the first time (Table 19). There sere significant differences in time but not in depth (Table 21). The coral species diversity index (H’n) showed a 3 to 21% decline at the deeper zones (Figure 29), but a nearly 12% increase in the shallower depth (Table A4). H’n was significantly different among depths with higher values at deeper zones. No temporal effects were detected. Coral species evenness (J’n) showed a 7 to 11% decline in the shallow depths and only a 3% increase in the deeper zone (Figure 30) and mean values were significantly higher in deeper reef zones. H’c showed a 3 to 25% decline at the deepr zones, with a 5% increase in the shallow area. J’c showed significant fluctuations during the study with a 16% decline at depth zone II, and a 14 to 35% increase at depth zones III and I, respectively. These differences between depth zones were significant, but no temporal effects were observed in any of these parameters. A peak log-normal regression analysis carried out at depth zone I between the % of total algal cover and coral species richness (Table 25a) showed a moderately poor negative relationship (r2=0.0388). Exponential decay regression analysis at depth zone II showed a moderately negative relationship (r2=0.6379), but a very strong one at depth zone III (r2=0.9688). The negative relationship between algal cover and colony
<4 m 4-8 m >8 m
FIGURE 29. Change in the coral species diversity index at CR2 (mean±one standard error).
FIGURE 30. Change in the coral species evenness at CR2 (mean±one standard error).
TABLE 25a. Summary of regression analysis results between the % of total algal cover and several coral parameters.
Parameters
% Algal cover vs Species richness
% Algal cover vs Colony abundance I*
% Algal cover vs % Coral cover
5.34e[-0.5(ln(x/0 44)/1 90) 2] 0.0366
2.88 + 154.1x – 178.7x 2 0.3196
732.2-2238.0x+1766.0x 2 0.9101
% Algal cover vs Coral H’n I*** y= 1.61-2.32x
*Peak log-normal regression (3 parameters).
**Exponential decay regression (Modified single, 3 parameters).
***Quadratic regression.
TABLE 25b. Summary of regression analysis results between the % of macroalgal cover and several coral parameters. Parameters
% Macroalgal cover vs Species richness
10.80–18.45x+15.73x 2 0.7915
y= 8.99+3.88x–12.94x 2 0.2160
% Macrolgal cover vs Colony abundance I* y= 20.23e[-0.5(ln(x/0.0002)/-0.05)ˆ2] 0.9747 II*** y= 83.93-236.9x+231.2x 2 0.9756 III*** y= 33.08-79.46x-175.3x 2 0.4782
% Macroalgal cover vs % Coral cover I*** y= 0.64-0.16x-1.79x 2 0 3612
y= 0.57-0.51x-0.06x 2 0 6998
y= 0.54-0.56x-0.10x 2 0 8176
% Macroalgal cover vs Coral H’n I*** y= 1.50+3.89x-8.25x 2 0.8060 II*** y= 1.85-2.76x+2.29x 2 0.8873 III*** y= 1.47-1.43x-2.54x 2 0.2568
*Exponential decay regression.
**Exponential decay regression (Modified single, 3 parameters).
***Quadratic regression.
abundance was weak at depth zone II, and moderately weak at depth zone I, but strong at depth zone III (r2=0.9101). However, there were moderately poor to strong negative relationships between the algal cover and coral cover (r2=0.7611 to 0.9256). Finally, there was a poor to strong negative relationship between algal cover and H’n (r2=0.2043 to 0.8415). These results suggest that algal growth during the last six years could explain a significant portion of the coral decline observed so far at CR2. This was more evident at depth zone III, but in a lesser degree at depth zones I and II.
A similar analysis was carried out using %macroalgal cover as the categorical variable (Table 25b). Macroalgal cover was negatively correlated to species richness at the shallow depth zones (r2=0.7915 to 0.9957). Also, % macroalgal cover was negatively correlated to colony abundance in the shallower depth zones (r2=0.9747 to 0.9756). It was negatively correlated to % coral cover at the deeper zones (r2=0.6998 to 0.8176). But in the shallows, % macroalgal cover was negatively correlated to H’n (r2=0.8060 to 0.8873). This analysis suggests that macroalgae can explain most of the coral decline at CR2. However, there are evident strong depth zone effects, depending on the parameters being considered. Thus, this accounts for the multivariable and highly dynamic nature of the interactions between coral reef epibenthic components. Moreover, it suggests that a single-indicator approach is not advisable to assess long-term ecological changes in coral reefs. Instead, a combination of parameters at the whole community level should be considered in order to avoid reaching wrong conclusions.
TABLE 26. Yearly mean dissimilarity matrix of CR2.
Multivariate analysis of coral reef communities at CR2.
A hierarchical cluster analysis was carried out based on a Bray-Curtis dissimilarity matrix on the proportion of major epibenthic components as discussed above to characterize the structure of the coral reef communities through time (Figure 30). Dissimilarity through the study averaged 20.3% and kept consistently increasing through time. The largest dissimiliaty was observed for the time period between years 1997 and 2003, with 30.3%. However, there was also a mean 8.6% difference between years 2002 and 2003. The classification of sites based on broad categorical data by hierarchical clustering of mean yearly data was able to differentiate four different temporal clusters when using 10% dissimilarity as the cutoff value (Figure 31). These clusters are consistent with major recurrent events of coral mortality and subsequent macroalgal overgrowth. Three different temporal patterns emerged when using the 15% dissimilarity cutoff value. These show a similar trend. Temporal-based clusters were more clearly distinguished in the MDS ordination. The stress level of the MDS plot was <0.01.
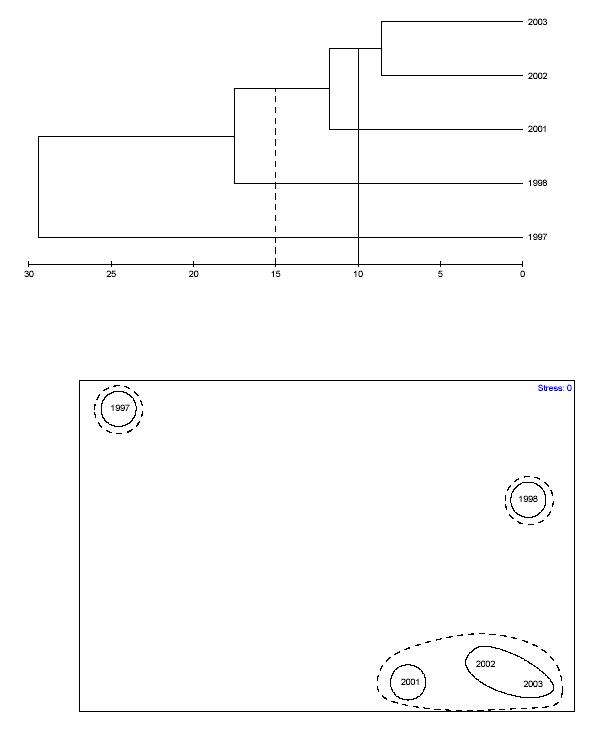
FIGURE 31. Bray-Curtis dissimilarity classification and MDS-ordination plot of yearly mean community structure at CR2 (based on the proportion of coral reef epibenthic categories). The solid line represents the 10% dissimilarity level. Dashed line represents the 15% dissimilarity level.
A similar temporal pattern analysis was carried out to yearly mean data, but using depth zones as replicates (Figure 32). Mean dissimilarity was 32.4%. A total of 14 temporal clusters emerged when using 10% dissimilarity as the cutoff value, while only 10 patterns were shown when using 15% dissimilarity as the cutoff value. The stress level of the MDS plot was 0.09. Clustering patterns are consistent between replicate transects that behaved similar in space and time.
The global 2-way crossed ANOSIM test (Table 27) showed a highly significant difference (0.0%) of the coral reef community structure between years and between depth zones. The interaction of years x depth was also highly significant (0.1%). The pairwise ANOSIM test (Table 28) showed highly significant differences in the coral reef community structure at CR2 between all pairs of years (0.0 to 5.0%). Significance became stronger with increasing time. A pairwaise ANOSIM test between depth zones (Table 29) also revealed highly significant differences between all pairs of depth zones (0.0 to 2.0%). The results of the SIMPER analysis comparing change from year 1997 to the subsequent years until 2003 (Tables 30-33) revealed that change in the proportion of macroalgae, cyanobacteria and filamentous algae were the most significant factor influencing the observed differences in the structure of coral reef epibenthic communities at CR2. The encrusting gorgonian, Erythropodium caribbaeorum, was also an important factor. A similar analysis carried out to data from years 1998 and subsequent years (Table 28) showed that macroalgae, E. caribbaeorum and filamentous algae were the most significant epibenthic components affecting the coral reef community variation. For the period of year 2001 to 2003, filamentous algae, cyanobacteria and macroalgae caused
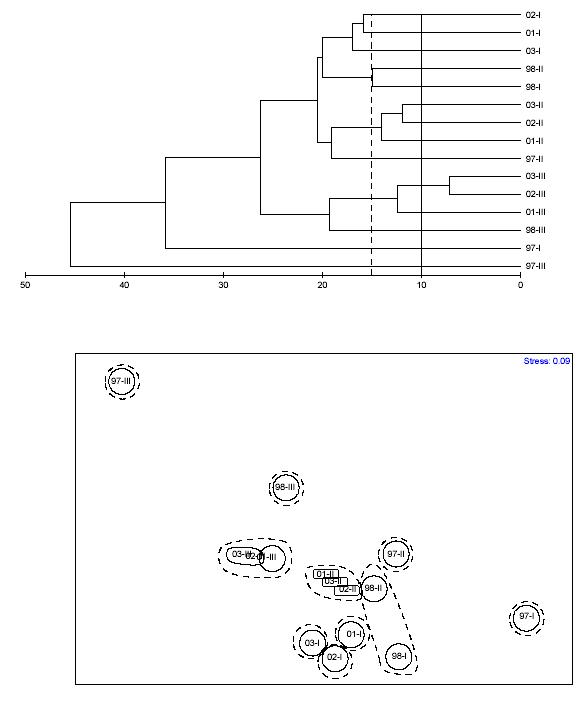
FIGURE 32. Bray-Curtis dissimilarity classification and MDS-ordination plot of yearly mean community structure at CR2 (with depth zones as replicates). Data was based on the proportion of coral reef epibenthic categories The solid line represents the 10% dissimilarity level. Dashed line represents the 15% dissimilarity level.
TABLE 27. Results of the 2-way crossed ANOSIM test* for significant differences of the structure of coral reef epibenthic communities at CR2.
*Square-root transformed data. Based on 5,000 permutations.
TABLE 28. Results of the pairwise ANOSIM significance test* between years at CR2.
*Square-root transformed data. Based on 5,000 permutations.
TABLE 29. Results of the pairwise ANOSIM significance test* between depth zones at CR2.
*Square-root transformed data. Based on 5,000 permutations.
**I= <4 m; II= 4-8 m; III= >8 m.
TABLE 30a. Results of the SIMPER analysis of years 1997 vs 1998 at CR2.
TABLE 30b. Results of the SIMPER analysis of years 1997 vs 2001 at CR2.
TABLE 30c. Results of the SIMPER analysis of years 1997 vs 2002 at CR2.
TABLE 30d. Results of the SIMPER analysis of years 1997 vs 2003 at CR2.
TABLE 31a. Results of the SIMPER analysis of years 1998 vs 2001 at CR2.
TABLE 31b. Results of the SIMPER analysis of years 1998 vs 2002 at CR2.
TABLE 31c. Results of the SIMPER analysis of years 1998 vs 2003 at CR2.
TABLE 32a. Results of the SIMPER analysis of years 2001 vs 2002 at CR2.
TABLE 32b. Results of the SIMPER analysis of years 2001 vs 2003 at CR2.
TABLE 33. Results of the SIMPER analysis of years 2002 vs 2003 at CR2.
the most significant variation in the coral reef community structure. Finally, for the period of year 2002 to 2003, macroalgae, filamentous algae and Porites porites causd the most significant variation. This analysis showed that coral reef communities are highly dynamic and change in community structure can result from shifts in the dynamics of different coral reef epibenthic components within relatively short time spans. However, there has been a high consistency of macroalgae, cyanobacteria and filamentous algae as the most important factors.
Indicators of disturbance effects at CR2
The equitability component of the coral species diversity at CR2 was compared with a theoretical expectation for diversity by calculating the Caswell’s V statistic for each depth zone and each year (Table 34). V statistic values were consistently negative and significantly distant from neutrality at depth zones II and III and all years, with the exception of depth zone III during 2001. V value at depth zone I was significantly distant from neutrality only in years 2002 and 2003. Mean values through time were significantly distant from neutrality at depth zones II and III. But, yearly mean values were consistently distant from neutrality. These observations suggest that CR2 showed a coral diversity below the neutral model predictions and that some kind of stressful disturbance has caused a significant decline in diversity at all depth zones and at all years during the 5-year long study. These results are consistent with the intermediate disturbance hypothesis (Connell, 1978; Huston, 1979).
TABLE 34. Summary of the Caswell’s neutral model V statistics for CR2.
*Non-significant departures from neutrality. Values >+2 or <-2 indicate significant departures from neutrality.
Finally, a K-dominance curve (Lambshead et al., 1983) was constructed based on the % of cumulative dominance (abundance) of corals and species ranks to determine if there was any significant disturbance effect on the coral community (Figure 33). There were shifts in the position of the K-dominance curve for each year that could indicate stressful conditions at CR2.
Coral:macroalgae ratios showed a major shift from dominance by corals towards dominance by macroalgae at CR2 (Figure 34; Table A7). This change was statistically significant in time, but remained similar through depths (Table 35). Morover, Coral:Macroalgae ratios declined below the threshold 1:1 value at depth zones II and III, since year 2001. Coral:Macroalgae ratio at depth zone I plummeted down to 0.68 in 2003. Actual mean Coral:Macroalgae ratios at depth zones II and III are a dangerously low 0.42 and 0.33, respectively. This magnitude of decline suggests that a major disturbance has caused a similar shift from coral- to macroalgal-dominance.
33. Yearly K-dominance curves of coral species at CR2.
FIGURE 34. Coral:Macroalgal ratios at CR2. Horizontal dashed line indicates critical 1:1 baseline ratio.
TABLE 35. Friedman 2-way ANOVA of the Coral:Macroalgae ratios at CR2.
Figure 35. Diagram for the inference of favorability and predictability of the coral reef environment at CR1 based on the relationship between coral H’n and J’n (after Alcolado et al., 1993).
The intensity and predictability of environmental disturbance was classified according to Alcolado et al. (1993) (Figure 35). Basically, 4 different environmental scenarios were identified in CR2: A) Constantly severe environment (H’n= 1.3-2.0; J’n= 0.80-1.00); B) Almost constantly severe environment (H’n= 1.3-2.0; J’n= 0.70-0.80; C) Severe and unpredictable environment (H’n=1.3-2.0; J’n=0.50-0.70); and D) Very severe and unpredictable environment (H’n= 0-1.3; J’n=0.50-0.70). Figure 35 illustrate a complex pattern of variations in the intensity and predictability of environmental conditions with time. However, patterns were clearly different for each depth zone. The benthic community at CR2 develops over a steeper slope than that of CR1, therefore, the gradient effect is more pronounced at CR2. Shallower habitats have maintained most of the time as very severe and unpredictable, suggesting that coral decline has been very pronounced in the reef shallows. However, intermediate depth habitats have shifted from severe and unpredictable to very severe and unpredictable, suggesting that coral decline has been significant in recent years. Deeper habitats have remained most of the time as severe but unpredictable. The observed pattern similarly reflect that disturbances have occurred in discrete pulses. CR2 has been also constantly under a sort of natural and anthropogenic disturbances that have affected H’n and J’n as a result of coral colony mortality.
Discussion.
Shifts in the structure of coral reef communities
Comparison of annual coral decline rates with the wider Caribbean region.
There has been a major shift in the structure of coral reef epibenthic communities within the LPCNR between years 1997 and 2003 (Tables A3 and A4). The % of living coral cover has plummeted a magnitude of 31 to 44% at CR1 and from 50 to 66% at CR2. Assuming a linear decline through time, annual coral decline rates at CR1 have fluctuated between 5.2 and 7.3%, and between 8.3 and 11.1% at CR2. Mean values were 6.3% at CR1 and 9.7% at CR2. These coral annual decline rates are considered high.
Hernández-Delgado (2002) summarized in Table A5 data from 71 different monitoring studies trhough the Wider Caribbean region in coral reefs within fairly similar environmental and bathimetric conditions than those monitored within the LPCNR.
According to that analysis, the northern Caribbean sub-region (Florida, Bermuda) had a mean annual coral decline of 1.61%. The central Caribbean sub-region (Jamaica) showed the highest mean annual coral decline rate of the wider Caribbean with 6.58%. The Pear Tree Bottom Reef (12.29%) and Montego Bay (14.18%) showed actually the highest mean annual coral decline rate of the entire Caribbean region.
Mean annual coral decline in the northeastern Caribbean sub-region (Puerto Rico, U.S. Virgin Islands) averaged 3.56%, ranking third among all biogeographic regions of the Caribbean. The Meso-Caribbean sub-region (México, Belize, Costa Rica, Panamá)
showed the second highest annual coral decline rate (6.00%). Finally, none of the 6 surveyed reefs from the southern Caribbean sub-region reached annual coral decline rates of 7% or higher. A total of 13 out of the 71 surveyed reefs (18.3%) showed an increase in coral cover through the wider Caribbean region. But, only 5 out of these (7%) showed an annual coral decline rate exceeding 10%. The two reefs surveyed within the LPCNR have showed mean annual coral decline rates of 6.3% and 9.7%, respectively. These values are still well above the averages for the Wider Caribbean region and could be comparable to coral reefs which have collapsed due to a combination of natural and anthropogenic factors which have included hurricanes, the Long-Spined Sea Urchin, Diadema antillarum, die-off, coral disease outbreaks, herbivore overfishing and water quality degradation (Knowlton et al., 1990; Hughes, 1993, 1994; Steneck, 1993; Shulman and Robertson, 1996; Hernández-Delgado, 2000, 2001, 2002; Keller, 2001; Wheaton et al., 2001; Porter et al., 2002).
The role of algae and cyanobacteria on the coral reef phase shifts.
There were significant increases in the % of total algal cover of magnitudes that ranged from 21 to 81% at CR1, and from 28 to 241% at CR2 within the period of 1997 to 2003. These suggest an annual algal increase trend of 3.5 to 13.5% at CR1, and of 4.7 to 40.2% at CR2, depending on the depth zone (Figures 36 and 37). Similarly, macroalgal cover showed an even more dramatic increase of 410 to 1,423% at CR1, and from 104 to 315% at CR2, with annual trends of 68.3 to 237.2%, and 17.3 to 52.5%, respectively. These results account for a major phase shift in the dominance of corals to a dominance by algae.
Coral:Macroalgal ratios at depth zone I in CR1 showed a dramatic decline from from the original value of 9.1:1 in 1997, to 0.87:1 in 2003 (Table A6). At depth zone II, there was also a major decline in the coral:algal ratio, from 34.6:1 in 1997 to 1.3:1 in 2003. A similar trend was documented at depth zone III, with a decline from 7.7:1 in 1997 to 0.87:1 in 2003. Coral:Macroalgal ratios showed a similar trend at CR2 during the same period of time (Table A7). At depth zone I it declined from 4.2:1 to 0.68:1, while at depth zone II, there was a drop from 1.7:1 to 0.42:1. There was a similar trend at depth zone III, with a drop from 3.1:1 to 0.33:1. These observations suggest that coral mortality has been widespread enough through the different depth zones of the reef community that Coral:Macroalgal ratios have fallen to levels close or well below the 1:1 threshold value. The observed increase in algal cover in Culebra, coupled with the decline in coral cover and the physiological fragmentation of large coral colonies between 1997 and 1998, followed by a major mortality of many of the surviving physiological fragments and the small-sized, rare species, between 1998 and 2002, might be an unequivocal first sign of a catastrophic coral reef decline associated to a possible combination of long-term effects of coral disease outbreaks, still low sea urchin densities, chronic water quality degradation as a result of discrete pulses of remote sedimented runoff and indirect fishing effects, as suggested previously by Hernández-Delgado (2000, 2001). Several studies have documented significant increases in algal cover in Caribbean coral reefs associated to simultaneous catastrophic declines in living coral cover. Liddell
and Ohlhorst (1993) observed an increase in macroalgal cover in Jamaica with a magnitude of 1,535%, and a 117% increase in filamentous algal cover within a period of 9 years, an annual increase rate of 171% and 13%, respectively. Hughes (1994) documented a 2,200% increase in algal cover in Jamaica within a period of 17 years, an annual increasing rate of 138%. Shulman and Robertson (1996) observed an annual increase in macroalgal cover of 186% and in filamentous algal cover of 29% in Panamá.
In addition, Ogden and Ogden (1993) reported that coral reefs in Panamá were 50-100% overgrown by algae within a period of two decades. Steneck and Dethier (1994) also documented that following the mass mortalities of Diadema antillarum in Jamaica, there was a 14% increase in macroalgal biomass in a 1 m deep backreef community within a period of 9 years (1.5% annual increase rate). But, filamentous algal turf biomass increased by a factor of 162% (18% annual increase rate), a fact that suggests that territorial damselfishes could have successfully taken over the reef in the absence of competition by D. antillarum. At the shallow forereef, macroalgae, which were totally absent from their study area, successfully invaded the reef and became the dominant algal functional group in terms of biomass. Algal turf biomass also increased by a factor of 28% (3% annual increase rate). However, at the deep forereef, algal turf biomass declined by a factor of 77% within a period of 5 years (15% annual decline rate), but macroalgal biomass increased by a dramatic magnitude of 22,156% (4,431% annual increase rate). These data further suggest that, following a major decline in herbivory, coral reef epibenthic communities can rapidly shift from a coral-dominated state to an algal-dominated one, and that this could be irreversible even within nearly a human generation time scale. It also suggests that in coral reefs subjected to intense overfishing,
such as Jamaica (Munro, 1983; Koslow et al, 1988; Hughes, 1994), annual algal cover increases can be more dramatic. But, when herbivory decline occurs with a simultaneous increase in nutrient concentrations, sedimentation, etc. (discussed below), these phase shifts could be more pronounced.
Other epibenthic components showed minor to wide fluctuations at the LPCNR during this study, but the % of cyanobacterial cover rocketed by a factor of 254 to 1,091% at CR1 between 1997 and 2003 (Figures 36 and 37). At CR2, cyanobacterial cover increased by a factor of 161 to 1,370%. As a matter of fact, most of the shifts observed in the algal community between years 2001 and 2003 were associated to the cyanobacterial bloom. In addition, the % of sponge cover increased at CR1 by 186 to 215% at depth zones II and I, respectively, and by a factor of 400% at CR2 during the same period of time. These values are alarming and point out at water quality issues as the major cause of concern in Culebra Island.
Previous investigations of phase shifts in coral reef communities have often overlooked benthic, filamentous cyanobacteria, which generally have been grouped with turf algae (i.e, Steneck and Dethier, 1994). Benthic cyanobacteria could play an important role in the coral reef phase shifts, as they can be early colonizers of recently dead coral surfaces and disturbed substrates (Tsuda and Kami, 1973; Borowitzka et al., 1978; Larkum, 1988; Thacker et al., 2001). Large cyanobacterial mats have been similarly observed in freshwater benthic communities following disturbance. But its role
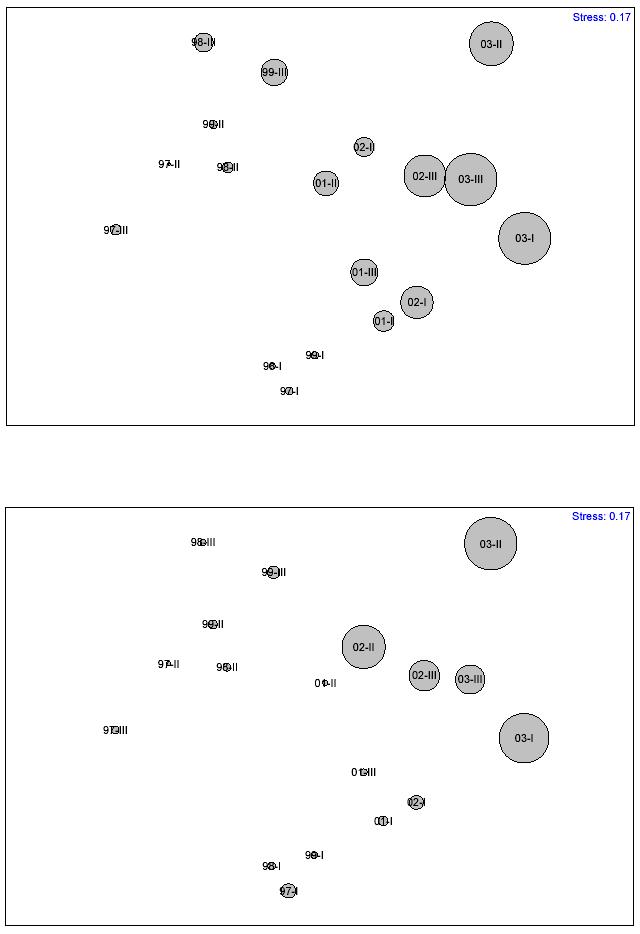
FIGURE 36. Bubble plot showing the observed shifts in two of the benthic community indictors at CR1: A) % Macroalgal cover; and B) % Cyanobacterial cover.
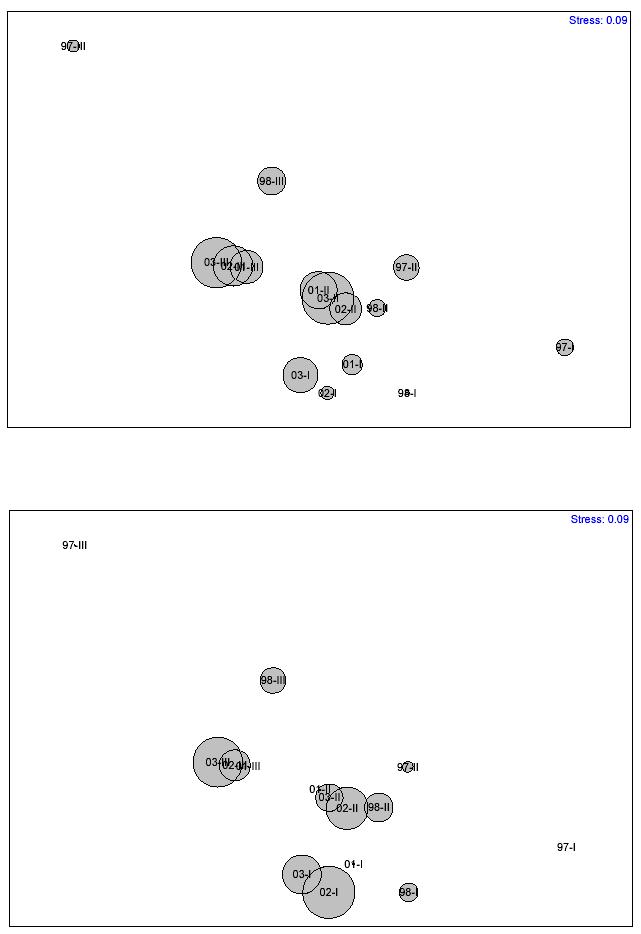
37. Bubble plot showing the observed shifts in two of the benthic community indictors at CR2: A) % Macroalgal cover; and B) % Cyanobacterial cover.
has been mostly overlooked most probably because traditional monitoring methods have not been adequate in discriminating cyanobacteria in the field and traditional statistical analyses have failed to weight and discriminate their effects on producing phase shifts in the coral reef community structure. This is one of the most powerful reasons to support the use of multivariate analysis to characterize these phase shifts throughout long-term monitoring. Cyanobacteria can rapidly overgrow exposed coral skeletons following disturbance associated to disease outbreaks (i.e., White Plague, any of the band diseases), predation, tissue abrasion or other epizootics, by preemptive outcompetition of other coral reef taxa. Such rapid colonization can result in highly localized increased nitrogen fixation rates (Larkum, 1988), which could produce a localized “micro-eutrophication” effect by refueling unpalatable macroalgal overgrowth such as the one observed in this study with the brown algae Dyctiota spp. Thus, the possible combination of this natural increase in nitrogen fixation by cyanobacteria in small spatial scales with the low but chronic suspected eutrophication in the coastal waters within the LPCNR as a result of frequent discrete pulses of highly sedimented, nutrient-rich runoff pulses from cleared lands and steep dirt roads could be further indirectly triggering additional coral mortality beyond the direct mortality associated to the recurrent disease outbreaks observed within the period of 1998 to 2002. Eutrophication itself can trigger cyanobacterial mat blooms (Fong et al., 1993), and the combination of eutrophication and reduced herbivory levels can also promote an outburst of cyanobacterial growth (Miller et al., 1999). However,
there have been studies showing also a lack of correlations with either nitrogen or phosphorous concentrations (Colwell and Botts, 1994; Thacker and Paul, 2001).
Filamentous cyanobacteria are known to produce a wide variety of secondary metabolites, many of which are toxic or pharmacologically active (Nagle and Paul, 1998). Many of these compounds can deter feeding by several species of herbivorous fishes, sea urchins and decapod crustaceans (Pennings et al., 1996, 1997; Nagle and Paul, 1998, 1999; Paul, 2001). Therefore, it is suggested that blooming filamentous cyanobacterial mats can potentially escape herbivory due to the presence of toxic or unpalatable secondary metabolites. But also, the usually intermingled presence of cyanobacterial mats and unpalatable macroalgae, such as Dyctiota spp. can be the result of selective preference of palatable species by herbivores. Selective browsing by herbivorous fishes on relatively palatable macroalgae might remove these competitors and allow establishment of relatively unpalatable macroalgae and toxic cyanobacteria (Tsuda and Kami, 1973). Experimental evidence by Thacker et al. (2001) supports this idea.
The observed phase shifts in the structure of coral reef communities within the LPCNR suggest that, besides the no-take zone designation back in 1999, epibenthic coral reef communities have kept declining at an alarming rate during the last six years and that there has been a major shift from a coral-dominated- towards an algal-dominated community. Furthermore, data suggest that different epibenthic components, namely macroalgae, cyanobacteria and filamentous algal turfs, could be significantly influencing
the observed phase shifts and only multivariate statistical techniques can discriminate among these.
Detection of shifts in community structure by multivariate analyses.
Multivariate statistical techniques have been used very rarely on coral reef ecosystems. This includes the studies of Márquez et al. (1997), and that of Murdoch and Aronson (1999). But their approaches were focused on octocorals and scleractinian corals, respectively. Only McField et al. (2001) and Hernández-Delgado (2002) focused on the whole coral reef community level, therefore, including coral, different algal functional groups and Porifera. In this study, we used a similar approach. The combined use of multivariate and univariate analysis of high-resolution digital image-based abundance (proportional cover) community data was able to discriminate significant differences in the structure of coral reef epibenthic communities at CR1 and at CR2 across a 6-year temporal scale. The method used in this study requires less time in the field than traditional quantitative methods and provides a permanent qualitative and quantitative data archive capable of multiple analyses for various purposes. Another benefit of high-resolution digital image-based sampling is that larger spatial units can be sampled with less effort (i.e., bottom time), thus reducing the typical small spatial scale heterogeneity (Carleton and Done, 1995). Digital images are high quality and can allow the identification of reef epibnethic components to the lowest taxon possible, thus producing data with a significantly high taxonomical resolution. Classification and ordination analysis performed to categorical data with high resolution was more powerful than traditional methods in demonstrating that a major shift in the structure of coral reefs
epibenthic communities have occurred at Culebra Island within the period of 1997 to 2003, despite the overall high similarity among sites and among successive years.
MDS ordination is considered the preferred alternative to represent the relationships between sites (Clarke, 1993). In this study, MDS ordination was used to represent relationships across a 6-year temporal scale with a relatively low stress that indicates a good two-dimensional representation of a multidimensional coral reef community data set. Overall, the postulated differences between years at CR1 and CR2 appear to be valid and constitute unequivocal evidence that a major coral decline has produced a significant shift in the structure of coral reef communities. Also, the SIMPER analysis technique was able to identify macroalgae, total algae, cyanobacteria and the filamentous algal turfs as the most important indicator groups, which accounted for the differences between years. Thus, this type of analysis could allow the design of specific studies and experiments to determine what environmental factors and mechanisms could explain the observed changes. If such indicator species and/or functional groups can be linked to specific environmental stressors (i.e., nutrients, sedimentation, turbidity), then the presence/absence or low abundance of these specific organisms would be useful in rapid ecological assessments (McField et al., 2001).
Causes of coral decline.
Caribbean-wide mechanisms, local causes or a combination of both?
The health of coral reefs at a global scale is of great concern. Through an elegant meta-analysis of a region-wide synthesis of temporal coral cover data, Gardner (2002) was able to demonstrate that a massive coral reef decline has occurred at all sub-regions through the wider Caribbean since the 1970s. The temporal variation in coral decline was highly significant both for the annual rate of change and for the absolute change of the % of coral cover. This suggests Caribbean-wide mechanisms rather than local causes. All time periods, except that of 1990-95, exhibited mean annual rates of decline that were negative and significantly different from zero. Also, only the time intervals of 1980-1985 and 1985-1990 showed significant negative changes in the absolute coral cover. During the last two decades, annual trends of coral decline at a Caribbean-wide basis showed negative peak levels in 1980, 1986, 1989, and 1998 (Gardner, 2002). This pattern coincided with the impacts of hurricanes during 1979 and 1980, and with a major increase in the % of macroalgal cover following the 1983-84 massive die-off of Diadema antillarum. Also, it coincided with the coral mortality associated to the 1987-88 global coral bleaching event and with the 1998 El Niño-related regional coral bleaching event.
The northeastern Caribbean sub-region showed the second highest mean annual rate of coral decline with nearly 7% (Gardner, 2002). However, according to his data, this subregion ranked 5th among the 6 sub-regions in terms of the absolute change in the % of coral cover, with a mean decline of 6%. The highest mean absolute coral decline was observed in Jamaica (32%). Garnder (2002) data also suggest that there was a
substantially high annual rate of coral decline (10%) during the 1980s in the northeastern Caribbean, but during the 1990s, annual decline rate dropped to about 1%.
The significance of our findings in Culebra Island is that the observed absolute coral decline of 31 to 66% within a period of only 6 years has been about 417 to 1,000% higher than the absolute change in the mean % of coral cover for the northeastern Caribbean sub-region documented by Gardner (2002) and Gardner et al. (2003). Moreover, annual rates of decline in Culebra Island for the period of 1997 to 2003 have been about 630 to 970% higher than those documented for the entire 1990s in the northeastern Caribbean sub-region. These levels resemble a lot to the massive coral decline that occurred throughout the entire Caribbean during the 1980s, particularly in this sub-region. Also, this decline rate can be compared to recent accounts of coral decline of approximately 54% (13% annual decline rate) that occurred during the mid 1990s at San Salvador Island, Bahamas (Ostrander et al., 2000). The lack of correspondence of the data from the LPCNR with that of the northeastern Caribbean subregion suggests that, although there could still be several Caribbean-wide phenomena occasionally affecting Culebra Island (i.e., storms, temperature stress, predation, disease outbreaks), it appears that local anthropogenic factors (i.e., water quality degradation, eutrophication, sedimentation, overfishing) could be having a more significant impact on the observed coral reef decline rates. It also suggests that observed coral decline rates in Culebra are unprecedented for this sub-region of the Caribbean.
Local factors and their synergism with regional factors.
A combination of several regional natural and local anthropogenic factors have been pointed out as the major causes of the coral decline in Culebra Island. These include a possible synergistic combination of long-term effects of coral disease outbreaks, still low sea urchin densities, chronic water quality degradation, remote sedimented runoff and indirect fishing effects.
White Plague Type II
Disease and epizootic outbreaks have become one of the most significant causes of mass mortalities of reef fauna through the wider Caribbean region during the last two decades (Lessios, 1988; Gladfelter, 1982; Rützler et al., 1983; Hughes, 1994; Clarke, 1996; Aronson and Precht, 1997, 2001; Bruckner and Bruckner, 1997; Santavy and Peters, 1997; Antonius and Ballesteros, 1998; Goreau et al., 1998; Richardson, 1998; Harvell et al., 1999, 2001; Alker et al., 2001; Cervino et al., 2001; Garzón-Ferreira et al., 2001; Weil et al. 2002). But one of the most dramatic coral decline effects caused by disease outbreaks during the 1990s has been that of the White Plague Type II (Richardson et al., 1998). There have been significant recurrent White Plague Type II outbreaks in Culebra Island between late 1997 and mid 2002, with a minor burst during 2003, that have caused major localized coral mortality, mostly affecting the Montastraea annularis species complex. This has been the major cause of coral decline due to its rapid propagation, at rates ranging between 1 and 3 cm/d (Hernández-Delgado, in review). Also, this has been the major cause of the coral species loss within the permanent monitoring transects, particularly of rare species with originally low abundances. No net
tissue regeneration has ever been documented in White Plague-infected colonies of M. annularis (Hernández-Delgado, in review; unpublished data). In a minor degree, sporadic white band disease infections during the study, followed by a major outbreak during the summer of 2001, which affected 51% of the Acropora cervicornis colonies surveyed at the study site (Hernández-Delgado, unpublished data) was another cause of mortality. Another white band disease burst occurred during the summer of 2003 and their effects seemed to be more intense in the weeks following major rain events in Culebra (Hernández-Delgado, unpublished data). The 1998 El Niño event caused a major worldwide coral bleaching event (Wilkinson, 1998) which affected about 80% of the coral colonies at the study site (Hernández-Delgado, unpublished data). However, there was no significant coral mortality in Culebra associated to this event.
Figures 38 to 47 are a visual summary of many of the factors discussed in this section and are self-explanatory. They show different examples of how a combination of regional natural factors and anthropogenic factors have caused the observed coral reef decline.
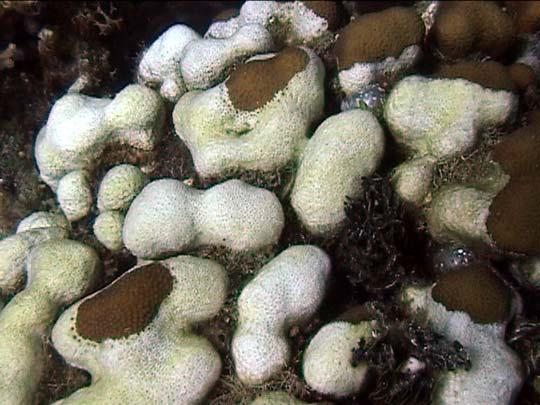
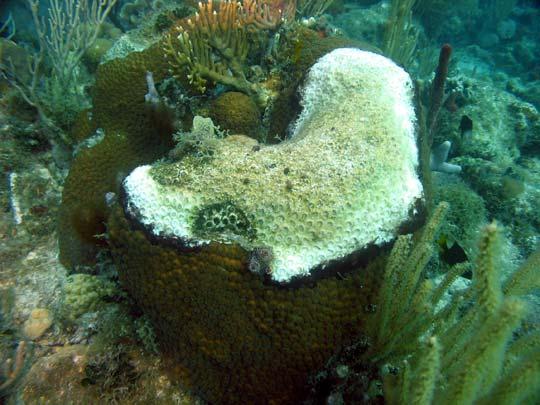
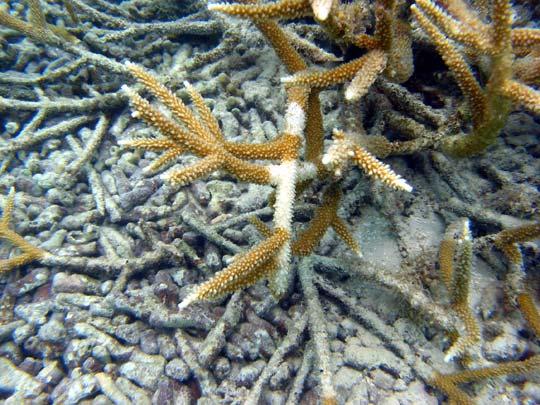
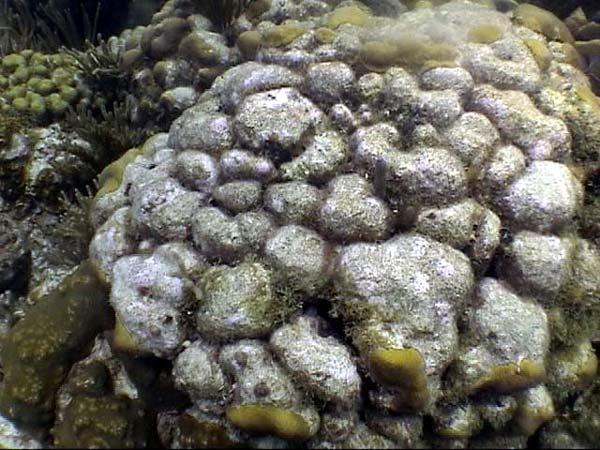
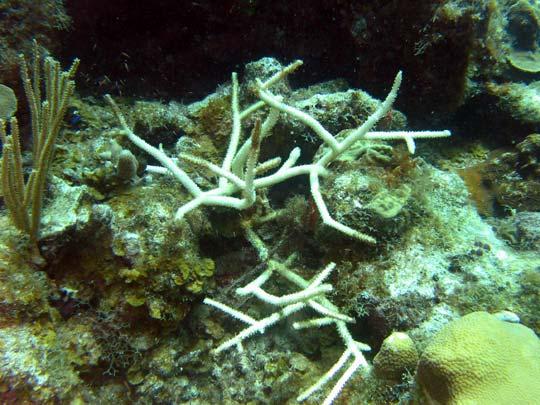
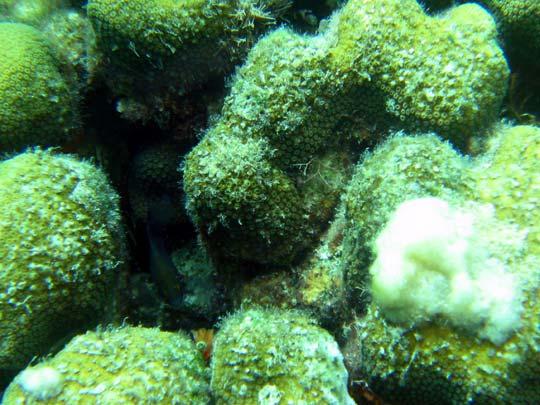
FIGURE 38. Examples of major natural causes of coral mortality at the LPCNR: A) White Plague Type II (WP-II) affecting a colony of Montastraea annularis; B) Lack of tissue recovery and preemptive outcompetition by algae 1 year after infection by WP-II in M. annularis; C) Black Band Disease affecting a colony of M. cavernosa; D) White Band Disease affecting a colony of Acropora cervicornis; E) Unknown band-type disease causing partial mortality of A. cervicornis; and F) Massive polyp killing by damselfish (Pomacentridae) territorial behavior.
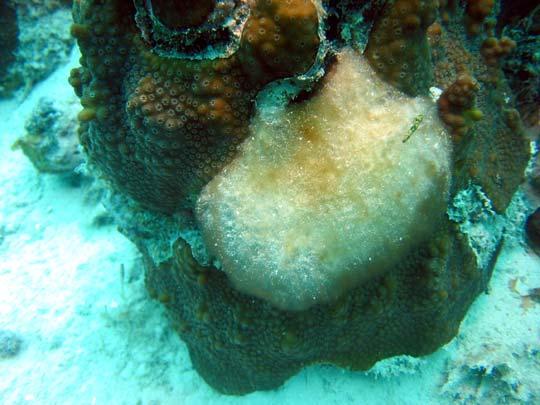
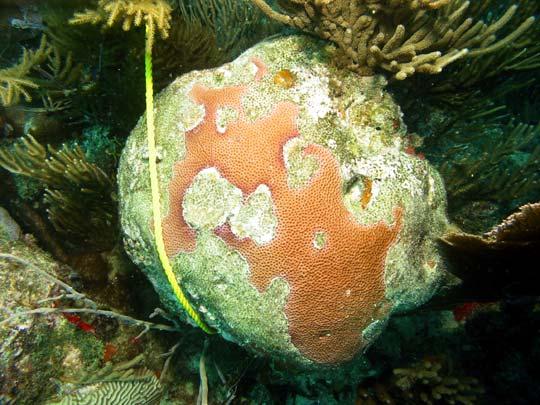
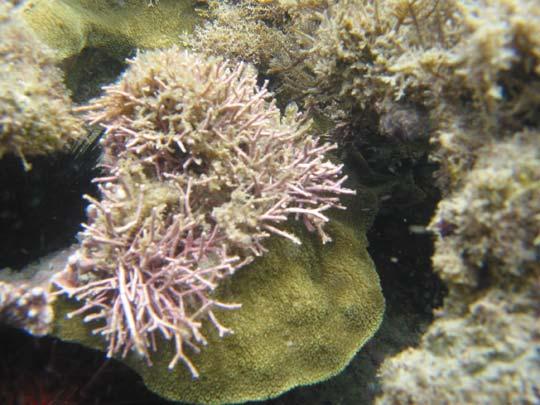
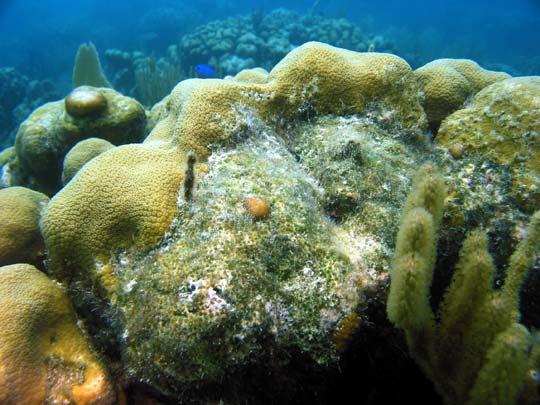
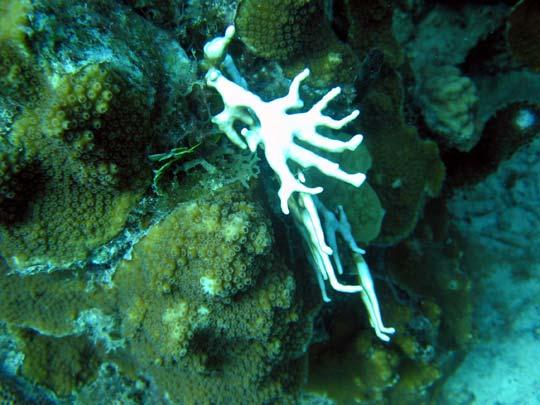
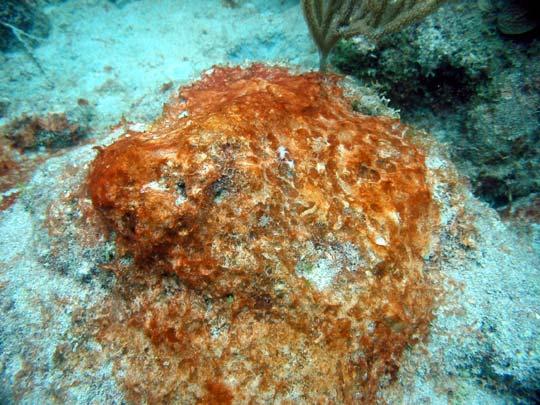
FIGURE 39. Other natural sources of coral mortality at the LPCNR: A) Overgrowth by mucilaginous cyanobacteria Schizotrix sp.; B) Filamentous algal turfs established over a colony of Montastraea annularis after a WP-II infection mediated by the territorial behavior of damselfishes; C) Partial death of a colony of Siderastrea siderea caused by an unknown slowly-progressing disease-type mortality; D) Total coral bleaching of a colony of Millepora alcicornis; E) Interference outcompetition (i.e., shading) by macroalgae Amphiroa sp. over a colony of Porites astreoides; and F) Preemptive occupation of bare substrate by cyanobacteria Lyngbya sp.
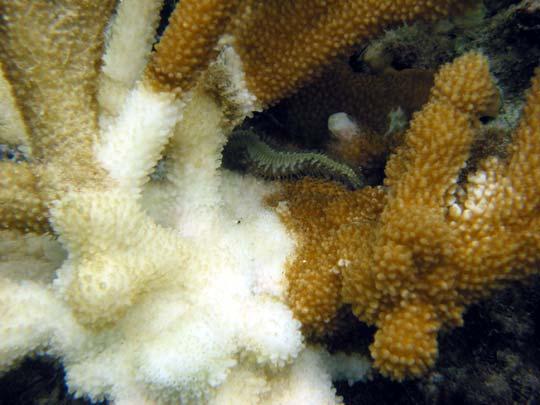
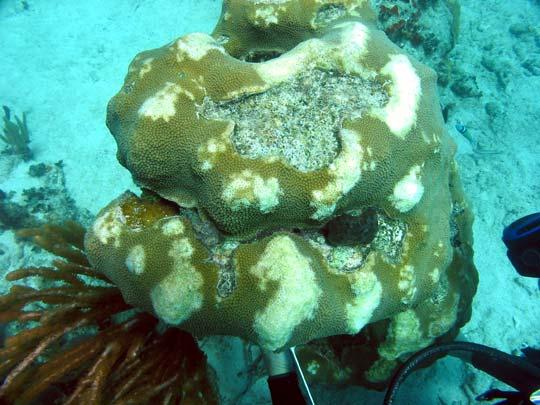
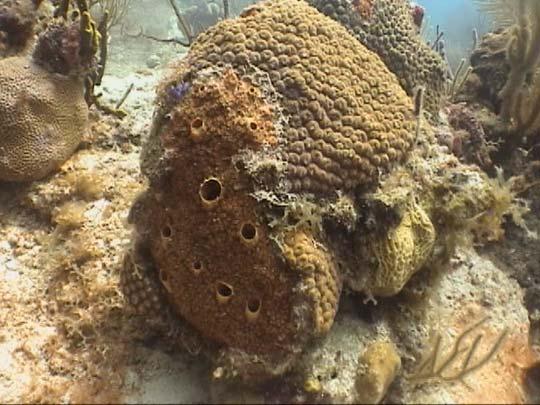
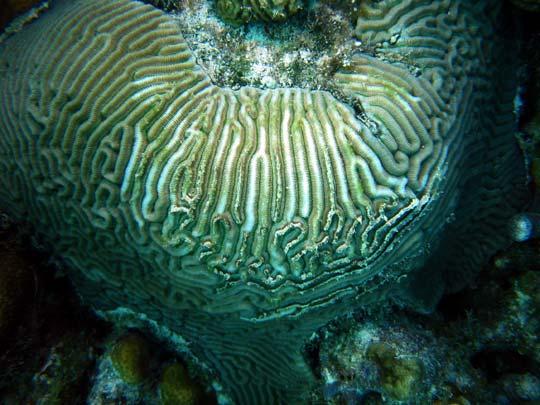
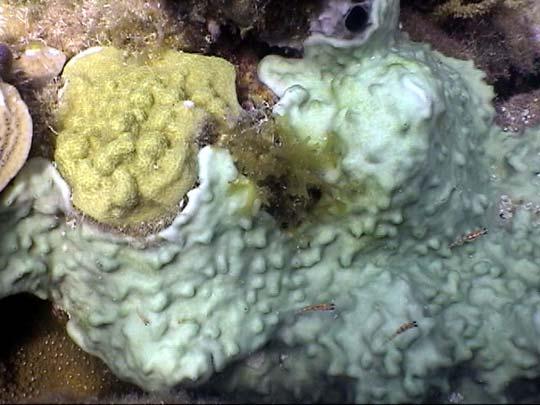
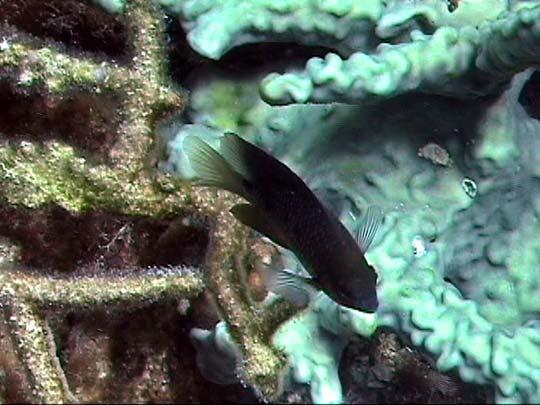
FIGURE 40. Other natural sources of coral mortality at the LPCNR: A) Predation of a colony of Acropora prolifera by Fireworm, Hermodice carunculata; B) Selective mortality of colony ridges in Colpophyllia natans, possible associated to predation; C) Partial mortality of a colony of Montastraea annularis as a result of predation by parrotfishes (Scaridae); D) Colony overgrowth and outcompetition by the Green Mat Tunicate, Trididemnum solidum; E) Overgrowth and outcompetition of a colony of M. cavernosa by the encrusting sponge Diplastrella sp.; and F) Territory of a Three-Spot Damselfish, Stegastes planifrons, on a dead colony of A. cervicornis. Note filamentous algal turf and invasion by a colony of T. solidum
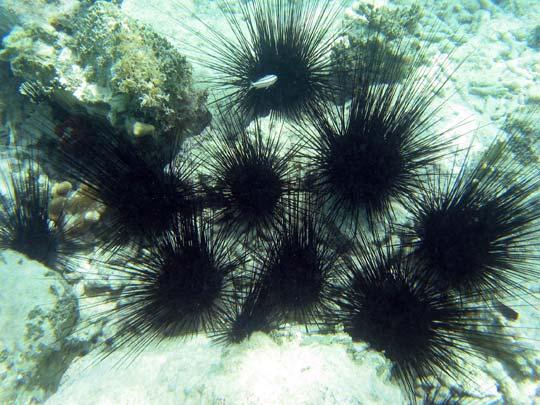
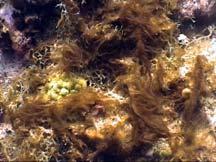
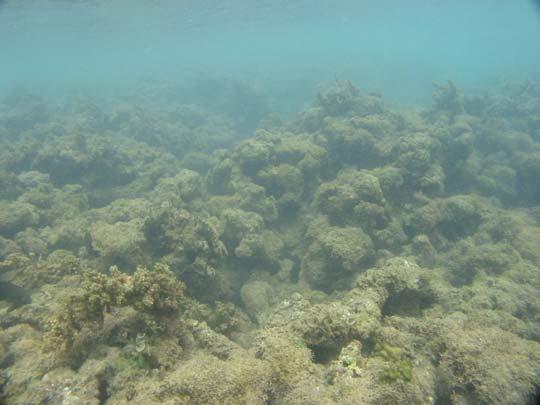
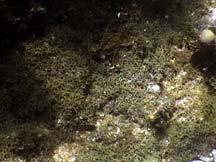
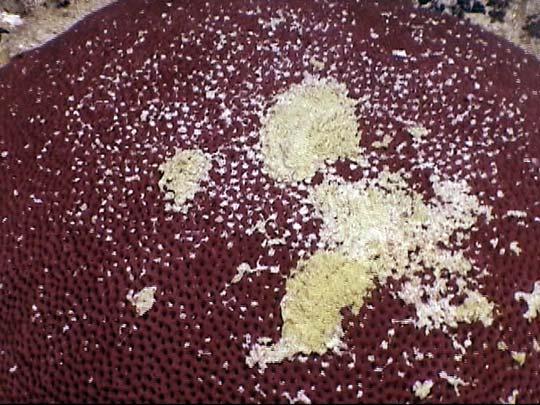
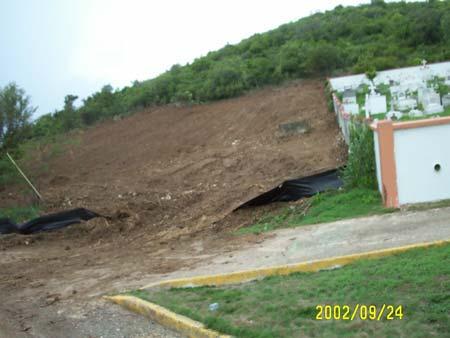
FIGURE 41. Coral mortality at the LPCNR results from a combination of natural and anthropogenic factors: A) Population densities of major macroherbivores such as the Long-Spined Sea Urchin, Diadema antillarum, still remain fairly low within the core reef zones; B) Substrate preoccupation by the unpalatable brown algae, Dictyota sp. fueled by lack of herbivory and nutrient pulses; C) Smothering of corals by cyanobacterial flags of Lyngbya sp. associated to eutrophication; D) Sediment smothering of Siderastrea sidereal; E) Increased water turbidity associated to remote sedimented runoff; and F) Major landclearing of steep slopes with inadequate controls of erosion and sediment runoff.
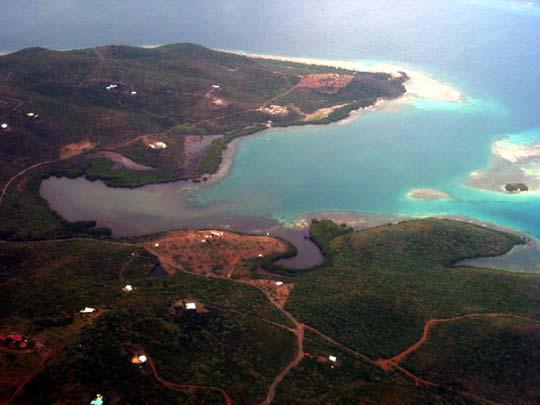
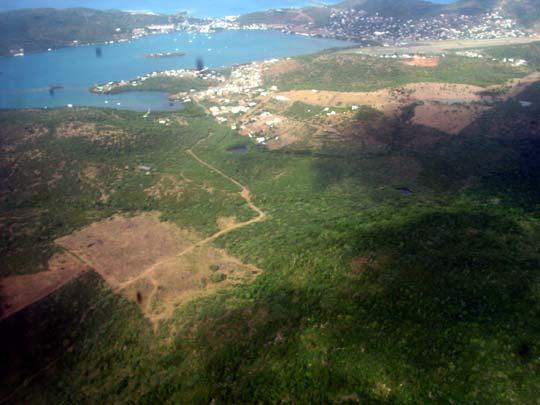
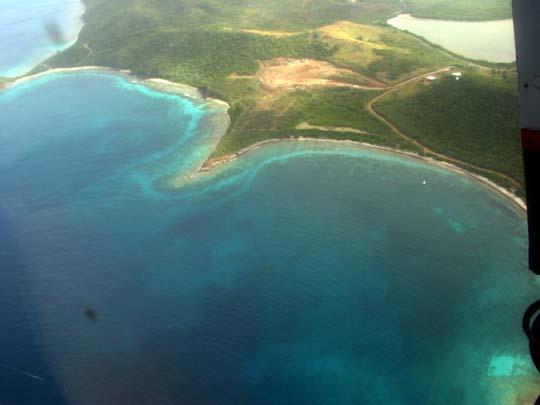
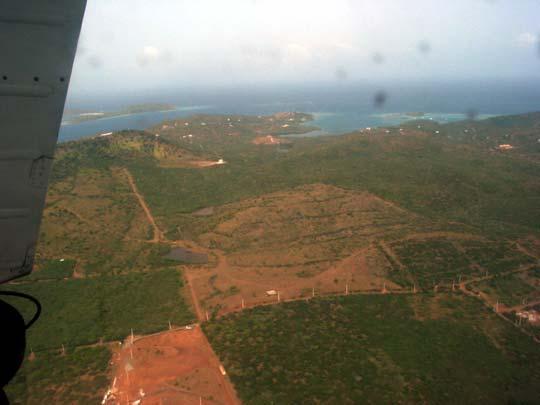
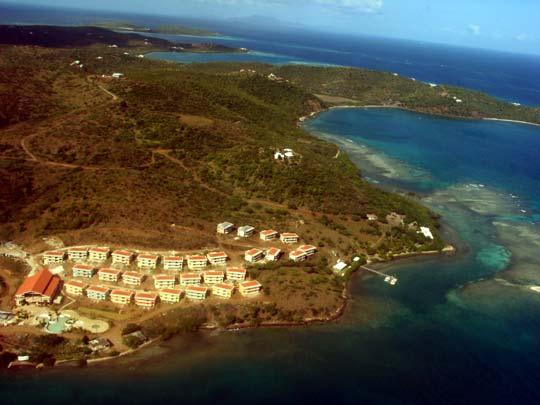
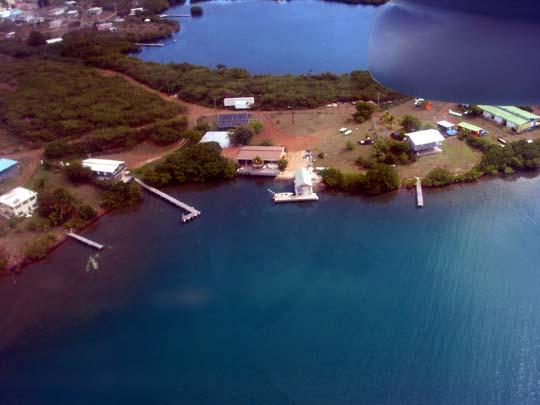
FIGURE 42. Aerial views of examples of poor land management practices in Culebra: A) Major landclearing of private properties and sedimented runoff over seagrass habitats in Puerto de Manglar; B) and C) Land-cleared parcels over steep slopes; D) Major tourist development Costa Bonita built over a steep slope at Ensenada Honda, just atop seagrass and coral reef habitats; E) The Culebra Municipal Landfill located in the eastern boundary of the LPCNR and is a major source of sedimented runoff with a high pollution potential; and F) Example of typical shoreline development.
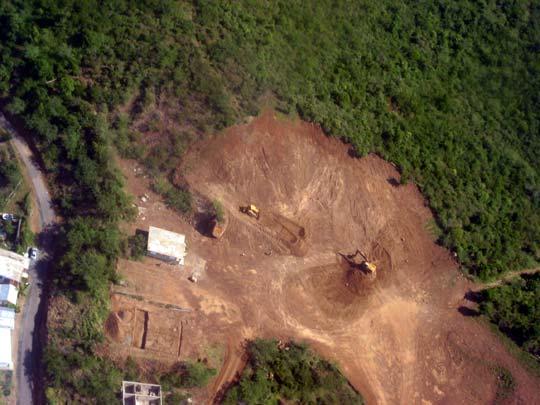
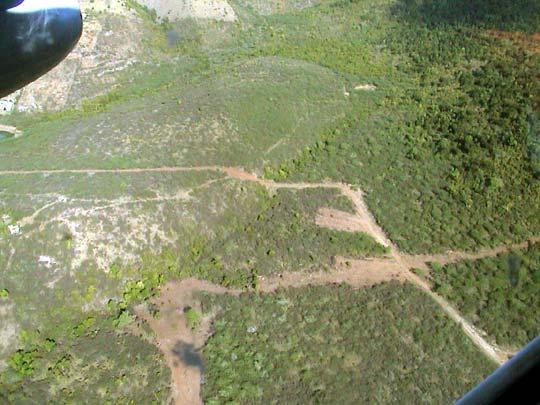

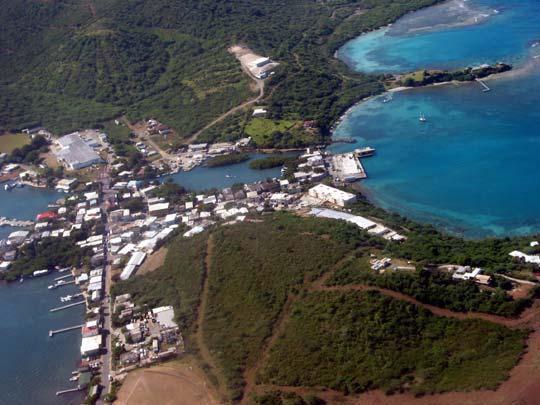
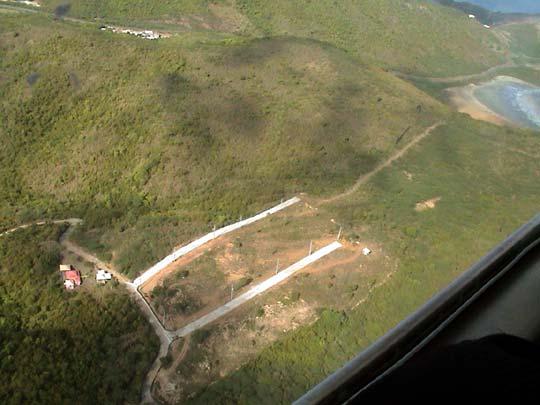
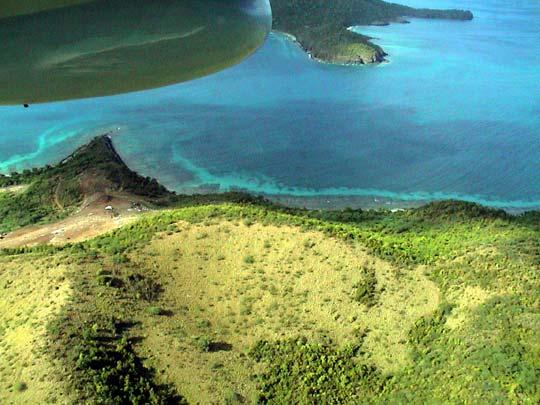
FIGURE 43. Other examples of poor land management practices in Culebra: A) Major landclearing for a housing project that was never developed; B) and C) Examples of steep dirt roads suffering severe erosion rates and causing extensive habitat fragmentation; D) Illegal landclearing and development at Monte Resaca that was stopped by the PR Superior Court; E) Landclearing of a steep slope in the coastal zone; and F) Frequent intentional brush fires in Culebra can eliminate a significant portion of remnant secondary forests and opening large areas in steep slopes to erosion. See at the bottom of F picture, the landfill and the LPCNR. Note proximity of landfill to fringing coral reefs and seagrasses.
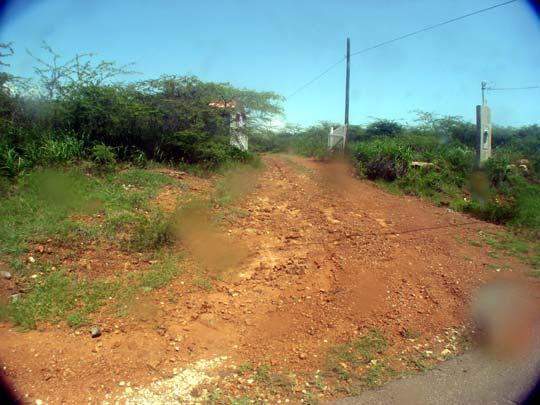
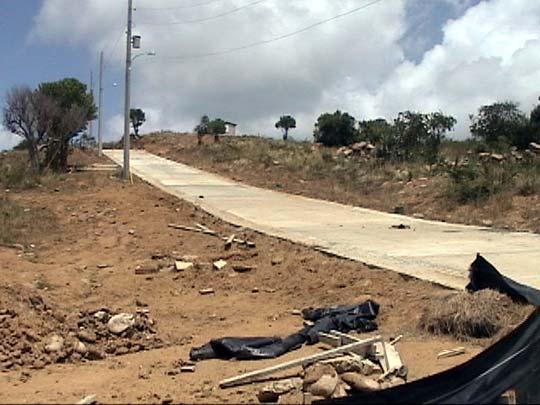
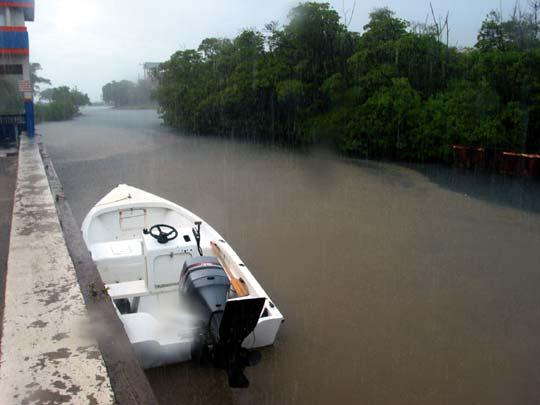
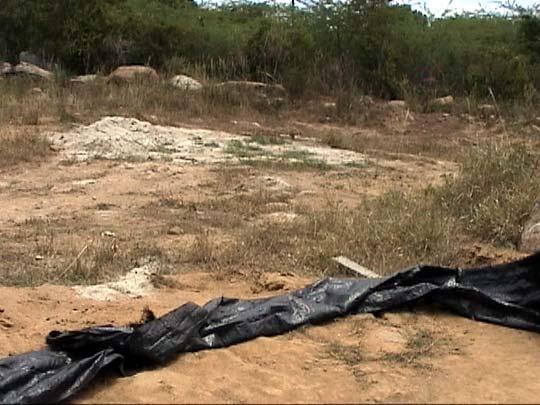
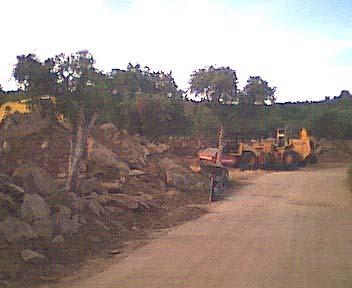
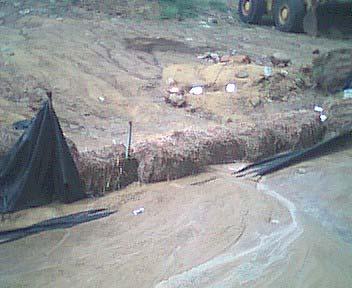
FIGURE 44. Examples of poor land use practices in Culebra: A) Many private dirt roads are subjected to chronic severe erosion; B-D) Most land development activities lack the required controls of erosion and sedimentation from runoff; E) and F) Sedimented runoff from cleared lands can rapidly reach the natural basins and the oean within a few minutes.
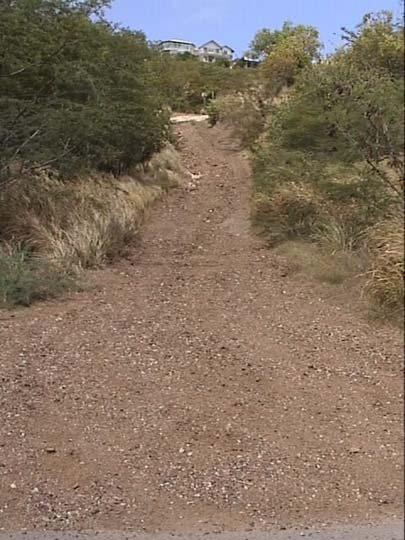
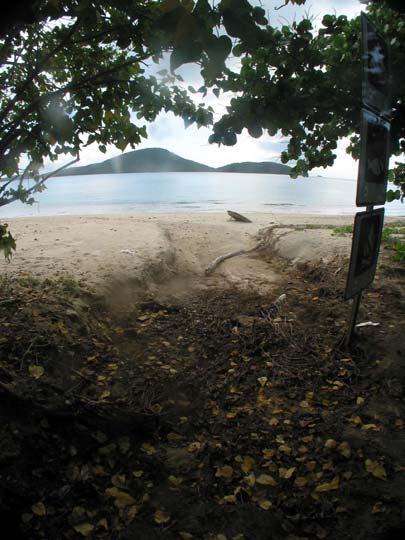
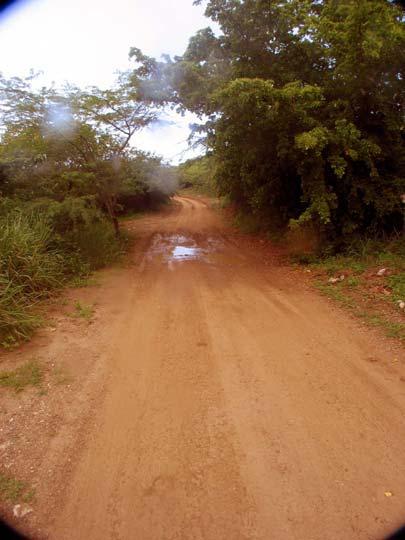
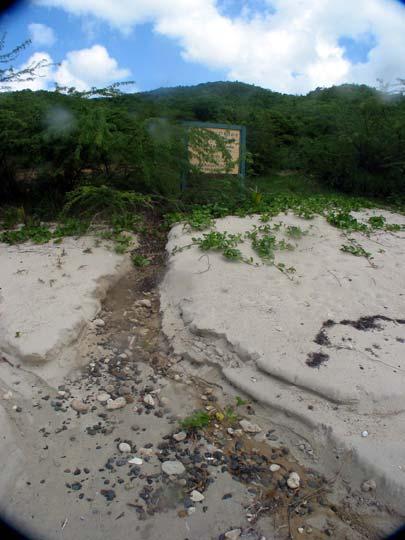
FIGURE 45. Examples from dirt roads close to the shoreline: A) Steep private dirt road that was constructed perpendicular to the coast in Ensenada Honda; B) Dirt road at Tamarindo Bay (LPCNR); C) and D) After heavy rainfall events sedimented runoff swashes can typically break in from the dirt road at picture B through the sand and reach the LPCNR shores with impressive amounts of sediments and nutrients.
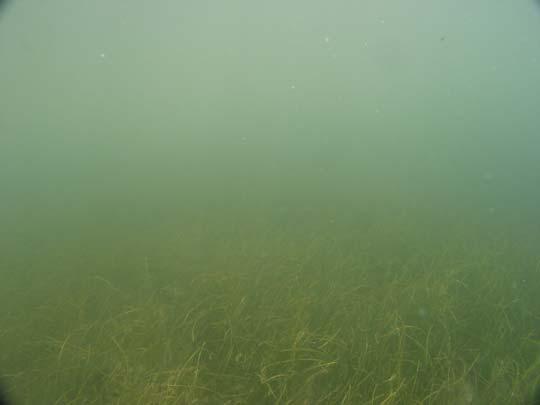
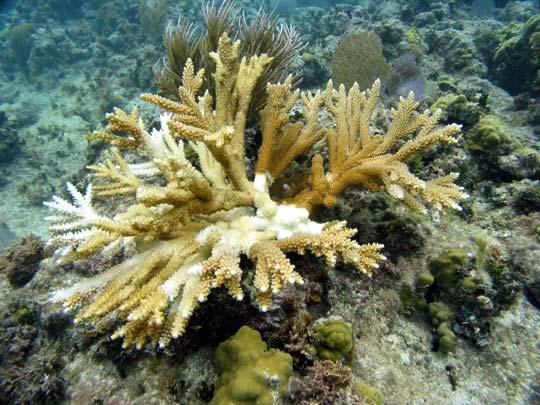
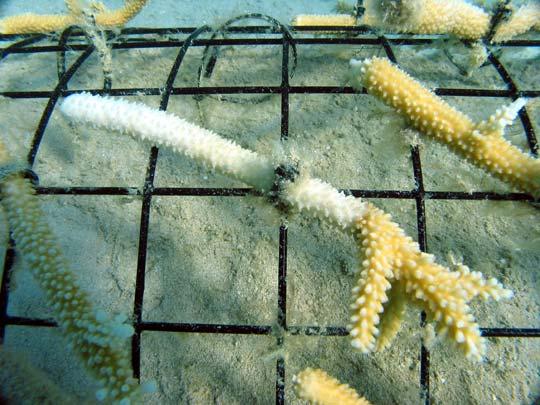
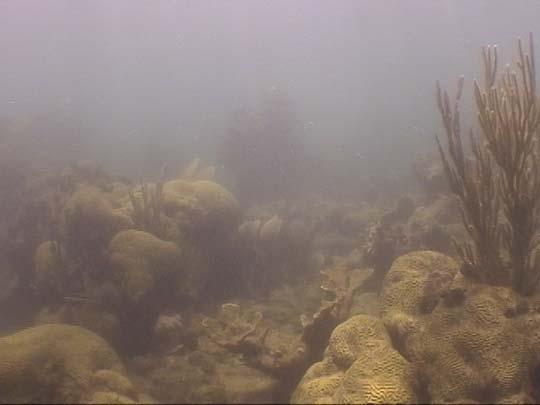
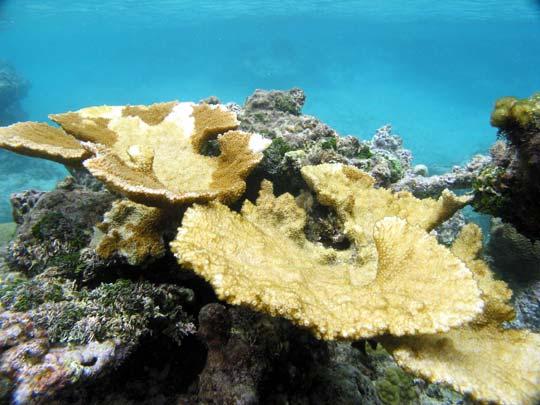
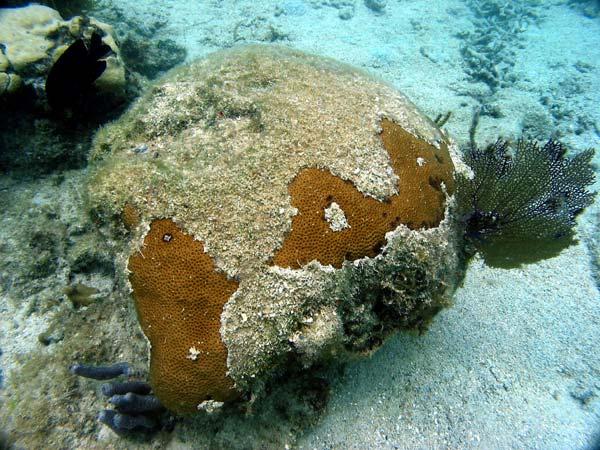
FIGURE 46. Effects of sedimented and nutrient-loaded runoff in Culebra: A) and B) Turbid waters can rapidly reach coastal seagrass and coral reef communities causing dramatic temporal reductions in sunlight penetration as well as declines in mean water salinity; C) Partial mortality of Acropora prolifera one week following a heavy rainfall event in April 22, 2003; D) Similar effect in A. palmata; E) Similar effect in a transplanted fragment of A. cervicornis within our experimental coral aquaculture farms at Tamarindo Bay; and F) Dying colony of Siderstrea siderea at a coral reef known to receive recurrent runoff loads.
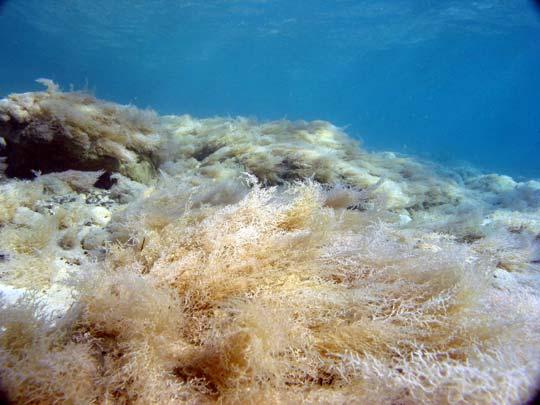
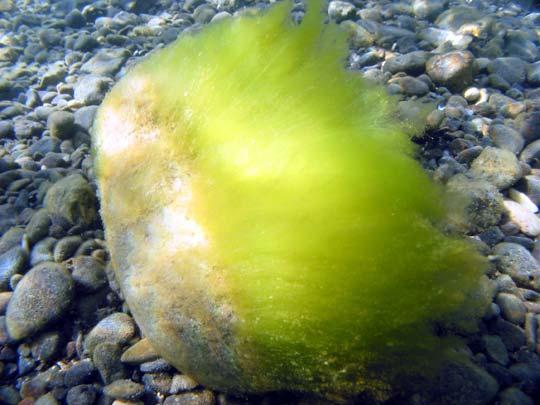
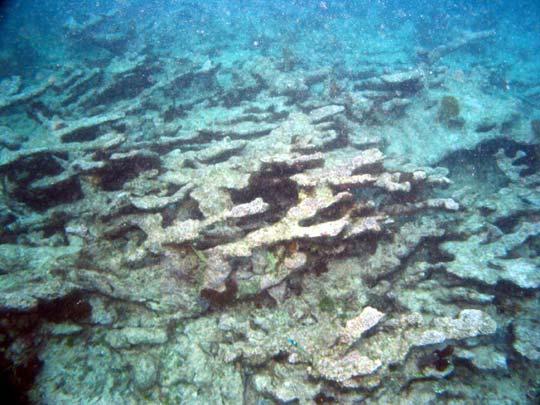
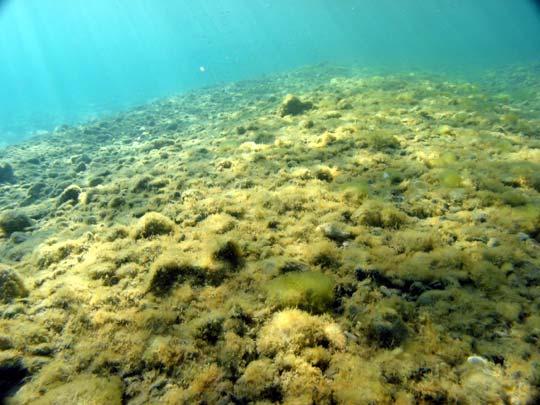
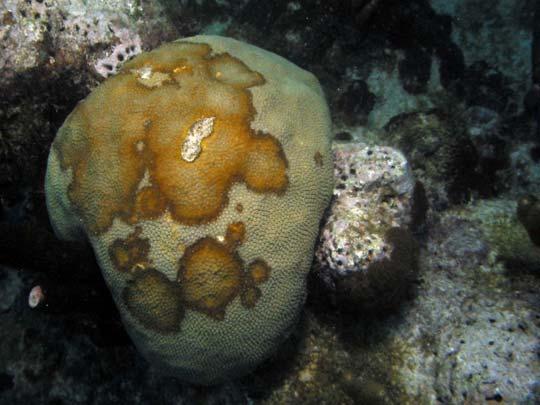
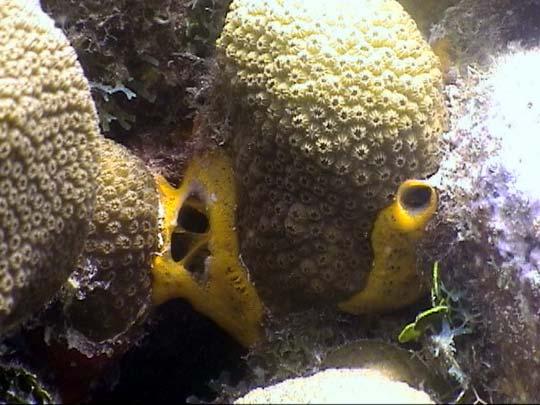
FIGURE 47. Aftermath of sedimented and nutrient-loaded runoff in Culebra: A) Two-three weeks after heavy runoff loads blooming red algae, Liagora sp., smothers reef benthic fauna; B) Cyanobacterial blooms are also typical following significant runoff events; C) Filamentous green algae are fairly common indicators of nutrient pulses associated to runoff events; D) Several colonies of Montastraea annularis showed signs of the suspected Dark Spotted Syndrome following a major rainfall event; D) A major runoff event during the early 1990s caused major mortality of almost an entire Acropora palmata stand located at Tamarindo Bay and close to the Municipal Landfill; and F) Sponge Mycale laevis thrieve at reefs exposed to nutrient loading.
Low herbivory or selective herbivory: The top-down model.
The fact that total algal cover has increased and that macroalgae have rocketed from the 1997 levels within the LPCNR are in complete agreement with other studies which have documented coral mortality within other no take reserves. MacClahan et al. (2001b) found at a MFR in Kenya that, following the major coral mortality after the 1998 El Niño-related coral bleaching event, there was a 88% and 115% increase in turf and macroalgal cover, respectively, within a year within the MFR boundaries, and a 220% increase in macroalgal cover, with no significant change in filamentous turfs in those coral reefs under fishing pressure. These results suggested that low herbivory activities upon macroalgal groups in overfished coral reefs, including no take reserves, rocketed algal cover atop of recently dead coral colonies. Thus, it is suggested that one of the alternative explanations to the observed algal increase could be that herbivory levels within the 4-years old LPCNR are still low enough to allow a rapid increase in macroalgal cover following coral mortality, in this case, caused by lethal disease outbreaks.
But a major question arises. Is there a lack of herbivory or actually selective herbivory upon palatable algal species, leaving behind the unpalatable ones? The observed condition of coral reefs in Culebra Island in this study resembles to what might be considered to be the early signs of a catastrophic chronic degradation rate similar to that observed in Jamaican coral reefs. There is evidence of dramatical increases in the percentage of algal cover in Jamaica following the mass mortality of Diadema antillarum (Liddell and Ohlhorst, 1986, 1987; Hughes, 1994). Coral reef fish stocks have also been
severely overfished in Jamaica, including piscivore predators and large herbivores, such as scarids and acanthurids (Munro, 1983; Koslow et al., 1988). In addition, there is circumstantial evidence suggesting that territorial damselfishes (Pomacentridae) are the dominant fish group in many Jamaican coral reefs (Smith et al., 1993), thus further suggesting the onset of a cascade top-down driven effect caused by fishing activities, and providing a possible explanation to the increasing biomass of filamentous algal turfs in shallow coral reef zones.
Coral mortality triggered by diseases during this study was immediately followed by a rapid preemptive colonization by filamentous algae (Hernández-Delgado, 2000, 2001). Filamentous algae and macroalgae play a dominant role in the trophodynamics of coral reefs (Hatcher, 1997). Turf algae take advantage on the complex coral reef topography and are grazed by a diversity of species (Carpenter, 1997; Hixon, 1997, Penning, 1997) and are kept at exponential growth rate by continuous grazing (Carpenter, 1986). Until year 2002, filamentous algal cover at LPCNR kept consistently high due to the high densities of territorial damselfishes (Pomacentridae) (Hernández-Delgado, 2000, 2001, 2002). Hatcher and Larkum (1983) observed that turf algal stands showed little fluctuations under intensive grazing over time. Hernández-Delgado (2000) also documented experimental evidence that damselfish territorial behavior caused a significant decline in the tissue regeneration abilities of Montastraea annularis, due to preemptive competition by filamentous algae that rapidly colonized bare coral skeletons. Coral ability to regenerate tissue lesions is known to decline with lesion size (Bak and Van Es, 1980). Thus, large-sized lesions caused by coral disease outbreaks, bleaching-
related mortality, and by parrotfish and damselfish bites are unlikely to recover due to the preemptive competition exerted by algae as suggested by other experimental studies (Lirman, 2001; McCook, 2001; McCook et al., 2001).
Filamentous algal turfs are the dominant stage in coral reefs under eutrophic conditions but with moderate herbivory (Hernández-Delgado, 2000; Fabricius and De’ath, 2001), suggesting that down-top regulatory processes (i.e., increasing frequency of dissolved nutrient inputs from sedimented and nutrient-loaded runoff) can also have a chronic mid- to long-term effect in shifting the structure of coral-dominated to filamentous algal-dominated, further to macroalgal-dominated reef habitats (Knowlton, 1992). In spite of the fact that there are no evident direct signs of eutrophication at the study site (e.g., sewage outfalls, major sedimented run-off plumes), a major shift towards dominance by macroalgae have been occurring during recent years. Hernández-Delgado (2000) demonstrated that damselfish densities showed a consistent significant increase at the study site, in combination with declining piscivore fish populations due to recreational spearfishing, suggesting that overfishing-related top-down regulation, in combination with coral lethal disease outbreaks, had become important indirect factors causing phase-shifts in the structure of coral reef epibenthic communities. Damselfish densities are still considerably high at the LPCNR. However, predator fish populations are showing a significant recovery at the study site (Hernández-Delgado and Sabat, in preparation). Therefore, we can most probably discard the overfishing-related top-down short-term effect on coral decline at this stage. However, there is still selective some illegal fishing pressure upon piscivore and large herbivore species within the LPCNR,
including the study site. Thus, it is suggested, that we might be facing a shift in the structure of the coral reef epibenthic communities as a long-term indirect result of ecosystem overfishing. Also, it suggests that, even under recovering populations of fishery target species within the LPCNR, coral reef epibenthic communities are not showing signs of recovery because the pressure excerted by the environmental effects of sedimented and nutrient-loaded runoff events around Culebra is higher and can mask any benefits from the recovering fish community. This is in agreement with McClanahan et al. (2001a), who found that there were no significant effects of management within the Glover Reef Atoll no take zone, at Belize, and macroalgae were the dominant component of coral reef epibenthic communities regardless of fishing pressure. Thus, a combination of inadequate management in the LPCNR and lack of land use management in Culebra Island (beyond the LPCNR limits) might be negatively affecting its coral reef epibenthic communities.
Another major concern is that most of the observed macroalgal cover increases were produced by the brown algae Lobophora variegata and Dictyota spp. Both species are known to produce secondary metabolites that make them unpalatable to most herbivore fish species. Diadema antillarum was a major herbivore upon both species (Szmant, 2001). This species suffered a massive die-off throughout the wider Caribbean during 1983-84 (Lessios, 1988) and its recovery has been extremely slow (Moses and Bonem, 2001). Lack of sea urchin herbivory results in a major increase of macroalgae (Sammarco et al., 1974). Thus, it is suggested that moderate fish herbivory levels can remove most of the palatable algal cover, but lack of sea urchin herbivory, can allow
brown algae to thrive. This dominance can become even stronger due to the recent association between brown macroalgae and filamentous cyanobacterial mats. The latter also is known to produce toxic secondary metabolites that can deter grazers. But the panorama can be completely different if brown algae and cyanobacteria are fueled up by frequent nutrient loads from runoff and remote raw sewage effluents (Culebra has no sewage treatment facilities).
Interaction among degrading factors: The down-top model
The observed increase in the % of macroalgal cover brings into light some other possible causes of coral decline that have not been completely understood at the LPCNR: dissolved nutrients. According to Carpenter (1997), under elevated nutrient concentrations and reduced grazing pressure, macroalgal biomass and percentage cover can show a significant increase. There is a direct interaction among nutrient concentrations and herbivore activity in determining the dominant benthos in the coral reef (Littler and Littler, 1984). Under low nutrient concentrations, abundant herbivory can shift the epibenthic community structure from one dominated by filamentous algae to one dominated by corals. This is due to the opening of reef substrate to coral recruits (Sammarco, 1980) and the exploitative competition between herbivore fishes and Diadema antillarum (Hixon, 1997). But, under high nutrient concentrations (not necessarily chronic high levels, but from recurrent pulses as well), abundant herbivory could shift the community structure from filamentous-dominated to coralline algaedominated (Smith et al. 2001). However, under low herbivory levels, as a result of the mass mortality of D. antillarum (Liddell and Ohlhorst, 1986) and/or as a result of serial
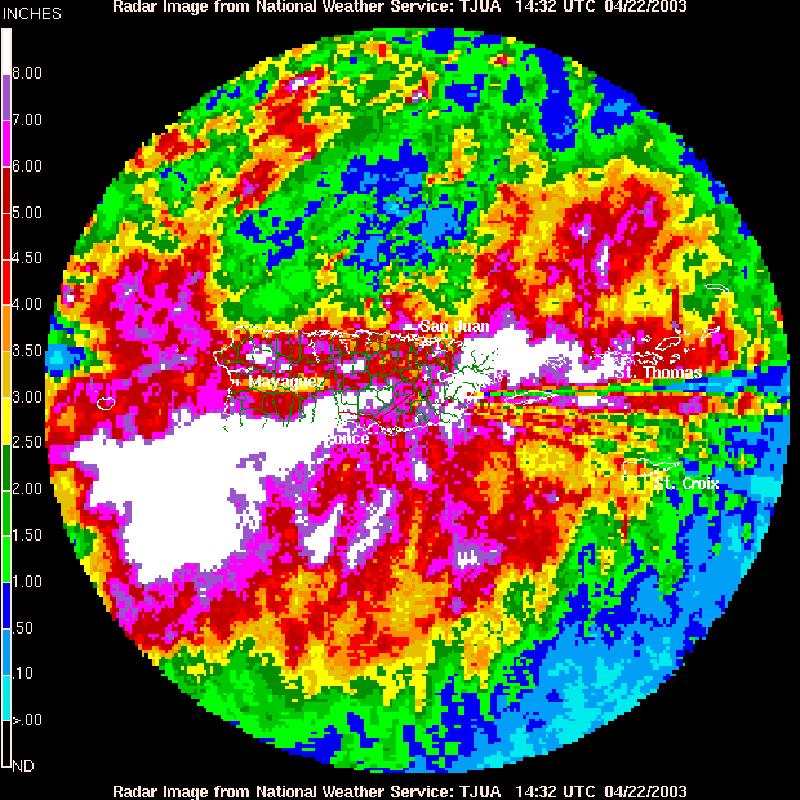
FIGURE 48. Doppler radar image of an extreme rainfall event over Culebra Island (Image from the National Weather Service, San Juan Office: TJUA 14:32 UTC, 04/22/2003). Estimated rainfall in Culebra: 7-8” in less than 24 h; elsewhere around Culebra, 12-20”/24 h. This event caused massive sedimented and nutrient-loaded runoff inputs, followed by selective coral mortality, and a macroalgal and cyanobacterial blooms in most of the Culebra’s fringing reef systems.
or ecosystem overfishing (Williams and Polunin, 2001), coral reef communities could shift from coral-dominated to filamentous algae-dominated. Similar observations were already suggested within the LPCMFR (Hernández-Delgado, 2000, 2001). However, under low herbivory levels, and under moderate to high nutrient levels, the coral reef community structure could shift from coral-dominated, or filamentous algae-dominated, to macroalgae-dominated (Smith et al., 2001; Stimson et al., 2001). Therefore, even a slight increase on dissolved nutrient concentrations (i.e., as a result of remote untreated sewage outfalls, infiltration of septic tanks, and/or increasing volumes of sedimented and nutrient-loaded run-off), could trigger a major mid- to long-term increase in macroalgal cover. The effects of these three anthropogenic threats to coastal water quality in Culebra, has increased dramatically in recent years due to a major outburst in land development activities that have resulted in several hundreds of acres of cleared steep lands, an increase in coastal development and a higher number of habitat fragmentation associated to the construction of dirt roads and private houses.
The eutrophication hypothesis suggests that increasing nutrient levels as a result from recurrent major rainfall events (Figure 48) can produce a frequent input of sedimented and nutrient-loaded runoff into coastal habitats, coupled with still low fish herbivory levels, should have produced an increase in the palatable macroalgal cover. However, this study showed that actually unpalatable brown algal corticated macrophytes Lobophora variegata and Dictyota spp. are the dominant components of the algal community, thus suggesting that the low densities or nearly absence of Diadema antillarum appears to be more significant than the moderately low densities of large
herbivore fishes such as parrotfishes (Scaridae). McClanahan et al. (2001a) found also that brown fleshy algae were the dominant algal group within a no take fishery reserve in Belize. However, Cho and Woodley (2002) observed a significant recovery of degraded Jamaican coral communities with simultaneous declines in the percentage cover of macroalgae where densities of Diadema antillarum have also increased in recent years.
Recent studies regarding the ecological aspects of algal community dynamics have failed to find effects of nutrient enrichment on individual taxonomic algal groups (Thacker et al. 2001). However, Steneck and Dethier (1994) suggested that algal functional groups, instead of taxonomic groups, can show a more predictable response to disturbance in a long-term basis. The observations made within the LPCNR are in complete agreement with the model of Steneck and Dethier (1994) for a Caribbean coral reef algal community, which predicts that under low to moderate physical disturbance, and a high productivity potential, there will be a high biomass production by corticated macrophyte functional groups. Also, the relatively unchanged abundance of cyanobacterial mats during early years of this study, with the exception of years 2001 to 2003, was in agreement with the finding of Thacker et al. (2001), which found no response in this group to nutrient enrichment, even under low herbivory levels. This was also in agreement with the model of Steneck and Dethier (1994) for Caribbean coral reefs, which predicted no major changes with disturbance for this functional group. But then, it could be possible that the 3-year long cyanobacterial bloom could be an indirect consequence of the increasing cover by brown unpalatable macroalgal groups by taking
advantage of the “natural refuge” created by the lack of herbivory upon the unpalatable algae. This is something that requires further studies. Most of the macroalgal cover documented in this study (>90%) was actually the brown algae Lobophora variegata and Dictyota spp., which are known to produce secondary metabolites that provide them with a sort of unpalatable chemical compounds (Hay and Fenical, 1988). Similar observations were made by Goreau (1991) in Negril, Jamaica. Most herbivore fishes do not graze upon these algae. But, Diadema antillarum, has shown preference for these algal groups (Szmant, 2001). This can suggest that: 1) although densities of large individuals of herbivore parrotfishes are still low to moderate within the LPCNR, fish herbivory activities within the LPCNR could still be high enough to exclude most of the other foliose palatable macroalgae; and 2) the low densities or nearly absence of D. antillarum has allowed both brown algal groups to dominate over filamentous and palatable foliose algae. Thus, it is hypothesized that actual shifting trends at the LPCNR could be the result of the long-term top-down effects of natural mass mortalities of D. antillarum (Liddell and Ohlhorst, 1986; Hughes et al., 1987), the indirect long-term top-down effects of serial and ecosystem overfishing (Roberts, 1995), a combination of both (Hughes, 1994), and the possible down-top effect of slowly, but steadily increasing nutrient concentrations (Lapointe, 1997), which benefit nutrientlimited algal groups over nutrient-sufficient groups (Delgado and Lapointe, 1994; Schaffelke, 1999, 2001).
Finally, the low, but steady increase in the abundance of incrusting red algae during our study, could point out an unsuspected sedimentation problem (Steneck and Dethier, 1994; Fabricius and De’ath, 2001), which has not been quantitatively assessed yet at the study site. There are no river plumes in the area, but major deforestation elsewhere in Culebra causes rapid highly-sedimented runoff to reach the ocean only in a few minutes. In addition, frequent recreational boat traffic can resuspend fine sediments in shallower areas near reefs (Hernández-Delgado, personal observations). There are no boat speed limit regulations within the LPCNR. But, it is suggested that boat speeding could be causing sediment resuspension and a chronic long-term localized sedimentation effect on corals in some areas. This requires also further investigation.
Increasing frequency of nutrient and sedimentation pulses are the most threatening cause of concern that could explain the observed changes in the structure of the LPCNR coral reefs epibenthic communities. Hernández-Delgado (2000; in press)
reviewed the existing literature regarding sedimentation effects in Puerto Rican coral reef communities and concluded that the majority of coral reefs have been subjected to heavy chronic sedimentation rates that have caused considerable long-term degradation. In the particular case of Culebra Island, there is an increasing concern that the rapidly increasing land clearing activities and development will adversely affect the coral reef and fish communities in a relative short time span, affecting the most significant tourist attraction of the Island. Hernández-Delgado et al. (2002) already observed highly significant differences in the structure of seagrass communities in Culebra Island when comparing the LPCNR and other control stations outside the reserve that have been
severely degraded due to major sedimented runoff events from cleared lands. The other major potential source of nutrients in Culebra is raw sewage. There is no sewage treatment plant, thus raw sewage is continuously reaching the ocean via illegal discharges or through groundwater infiltration of septic tanks. Another potential source of nutrients and sediments is the Culebra Island municipal landfill that is located in the eastern boundary of the LPCNR, and is a major source of runoff (Hernández-Delgado, 1994; personal observations). Hernández-Delgado et al. (2002) informed a high frequency of cyanobacterial mats in the seagrass habitats located close to the landfill, which might suggest potential groundwater infiltration. But this is something that will require further investigation. A proposed mechanism of coral reef decline.
Rapid coral decline, in combination with macroalgal increases in Culebra reefs suggest that nutrient pulses, sedimentation pulses or a combination of both, could be one of the major causes of concern for the observed decline. The most feasible hypothetical explanation could be that the most significant cause of coral mortality has been the recurrent White Plague Type II disease outbreaks (Figure 49). Fueled by increasing nutrient pulses (i.e., from remote sources of raw sewage and sedimented run-off), macroalgae have successfully occupied recently opened coral skeleton surfaces by preemptive outcompetition of coral tissue and of other algal groups. McCook (2001) found experimental evidence that, even under eutrophic conditions, algal turfs did not outcompeted Porites lobata in the Great Barrier Reef, Australia. In contrast, coral tissue was able to regrow and outcompete algal turfs under eutrophic conditions. Hernández
R ecurr ent Whi te Pla gue Type I I Outbre aks
No d ise ase
- Reduce d coral mor tal it y
- Cora l t issue regrow th f oll owi ng m inor m ort al it y
- Lim it ed m acroa lgal gr owt h (under ol igotr ophic condit ions)
Massi ve cor al mo rtal ity
Co ral /Al gal T urf Co mmun ity
- I ncreas ed cora l m orta li ty
- Lack of t is sue re ge nerat ion
- I ncreas ed fi lam entous algal overgrow th fol low ed by mac roal ga l dom inance
- O vergrow th , abrasi on, outc ompet it ion of cor als
- Event s rec urre nt on 1-year ti me s cale s
Macro alg ae Co mmun ity D ist urbance ???
FIGU R E 49 Top- down r egulat ion m odel of a Whit e Plague Type II disea se outbr eak Each out brea k could caus e maj or c oral ti ssue m orta li ty C oral s can not regener ate l ost ti ssue and c an becom e rapi dly overgr own by al ga e Dam sel fis h ter ri tori al acti vit ies , low herbi vory by D anti ll arum and i ncreas ing nut rie nt conce ntra ti ons coul d accel erat e t he onset of an al gal- domi nated stabl e st ate
Mas s Mort ality
Lack of re covery
+ Di ade ma
- Reduce d algal biom ass
- D omi nance by fi la ment ous al ga l t urfs
- H igh survivors hip of coral recrui ts
- Expl oit ati ve com peti ti on bet ween Diadem a and her bivor ous fis hes
- Di ade ma
Co ral /Al gal T urf Co mmun ity
- I ncreas ed al ga l bi omass
- D omi nance by m acroa lgae
- D ecr eased s urvivors hip of cor al re crui ts
- O vergrow th , abrasi on, outc ompet it ion of cor als
- I ncreas ed popula ti on sizes of herbi vorous fi shes ( if not affe cted by overf ishi ng)
Macro alg ae Co mmun ity D ist urbance ???
FIGU R E 50. Top- down r egulat ion m odel of herbi vory by t he Long- Spined Sea U rchi n, D iadem a anti ll arum . Low densi ti es of D . anti ll arum can r esul t i n incr eased bi oma ss of unpal at able br own al gae (e .g. D ict yota spp., Lobophora var iegat a) w hic h can occupy re centl y exposed cor al s kelet ons fol low ing m ajor dist urbanc e (e.g., cor al di seas e outbr eaks). I ncrea sing nut rie nt l evels c ould acc eler ate the ons et of a n algal -dom inat ed st able stat e. Modi fi ed aft er C arpent er ( 1997)
RIEN T LEVE LS Micr ofi lament ous Alg ae
FIGU RE 51 Theore ti cal pr edi cted i nte ract ions a mong herbi vory and l ong- ter m eut tophi cat ion e ffect s in de ter mi ning the domi nant epibent hic com ponents on shal low coral reef sys tem s (fr om Lit tl er a nd Li tt ler , 1984) Da ta fr om t his study suggest s that herbi vore a cti vit y w ithin the LPCMFR is st il l moderate t o low and the observed shi ft from coral -dominated communities to macr oalga l-dom ina ted com muni ti es suggest s t hat nut ri ent conc entr ati ons coul d be inc reasi ng. How ever, a compr ehensi ve wat er qual it y moni tor ing progra m i s requi red t o asse ss such a m aj or concer n
Mo derate to low herb ivore fis h dens ities
Predato r o v erfi s h n g
In crea si ng da ms e fish dens t ie s
D ecline s in A. cervico rnis
(p ri mary h ab ta s )
I nc re a si ng lo ca liz e d ni tro ge n f ixa tio n
( high e r c o nc e ntr a tion )
In va si o n o f s eco n da ry ha bi a (p red a on o f co ra s by d am se lfi s he s)
Low densities o f D. an tillarum
Coral m ortality asso ciated to r ecur ren t Wh ite Plague Type II ou tbr eaks
In te rfere nce w th c or al t is s ue reg era ti o n
In crea si n g su s cep ib li t y of co ra ls to p athog en s
In crea si n g fil am en to u s al g al co ve r
Declining co ral rec ru it men t
Bleach ing-related mo rtality of E rythrop odium carib baeoru m
In crea s n g co ral mo rt al i ty
In crea s n g bi o ero s io n ra es
(l o ng -t erm effet s o f eco s ys t em ov erf is h in g )
Mi grat io n of herb ivore f sh s chools aw ay of fi s he d areas as a b eh avi o ral re sp o n se o ove f s h ing
Declinin g ov era ll her bivor y
In crea si n g mac roa g al c ov er
O b st ru ct o n of s u bs tra es av ai a bl e for co ral t ss u e reg en era i o n an d rec rui t men t (p re-e mp ti ve o u tc ompetition)
Cyano bacterial b loom
In creasing localized nitrogen fixation ( higher co ncen tratio n)
In creasing eutroph icatio n an d sediment inp uts (e.g., rem ote raw sewag e, ru n-off )
In creasing diss olved nu trient pu lses
Redu ced water transp arency due to ph ytoplan kton b loom s, increased concentr ations of susp en ded solid s, increased sedim en tation r ates
Redu ced coral gr owth r ates N ET CO RAL RE
D ECLIN E FI GU RE 5 2 Co mb in ed t op - do w n and b o tt o m- up t h eor et ical m echan isms inv olv ed in th e r ecent co ral r eef d ecli ne do cu men ted i n th e LPCN R A co mb in ati on o f Car ibb eanw id e an d l ocal f acto r s ar e b ei n g po in ted o u t as m aj o r caus es o f d eclin e ( mo d if ied af ter H ern and ez- Delgad o , 2 0 00 , 20 0 1)
Delgado (2000) observed that tissue regeneration in Montastraea annularis was more vigorous under eutrophic conditions in Fajardo, P.R., when compared to coral colonies from Culebra Island, under more oligotrophic conditions. But, Hernández-Delgado (unpublished data) has never observed tissue regeneration on White Plague Type IIinfected colonies of M. annularis in Culebra Island. Thus, it is suggested that some factor, directly or indirectly associated to the disease itself, could prevent tissue regeneration to occur. Therefore, algal turfs and/or macroalgae can become dominant by means of pre-emptive outcompetition of corals. Damselfish territorial behavior could also be influencing coral mortality rates (Kaufman, 1977; Lobel, 1980; HernándezDelgado, 2000) and opening new reef surface to algal colonization. In addition, low herbivory associated to the still low densities of Diadema antillarum and still moderately low densities of Scarid herbivore fishes can allow for a still high algal biomass (lack of top-down regulation of algal communities) (Figure 50). Finally, the cyanobacterial bloom could also influence to deter herbivores due to their intermingled growth with macroalgae and their production of toxic secondary metabolites. An integration of the herbivory and nutrient concentration interactions and the overall mechanisms has been outlined in Figures 51 and 52, respectively.
However, no attempts have been made yet to systematically measure sedimentation rates and/or sedimentation potential of cleared steep slopes and dirt roads in Culebra as done in other studies in the U.S. Virgin Islands (MacDonald et al., 1997; Anderson and MacDonald, 1998; MacDonald et al., 2001). Nutrients from sedimented run-off are known to promote heavy algal growth (Costa et al., 2000; 2002). This has
been already suggested for seagrass habitats in Culebra Island (Hernández-Delgado et al., 2002). A high density of unpaved roads in St. John (USVI) was associated to high sedimentation potential, high sedimentation rates, declining coral cover, poorer coral health and dominance by sediment-tolerant coral species (Nemeth et al., 2001). Thus, sedimentation potential and sedimentation rates must be incorporated to any future longterm monitoring activities within the LPCNR.
Effects on species diversity: Regional vs. local factors, threshold effects, multiple stable states, and Allee effects
The use of univariate Caswell test showed that there was a significant decline in coral species diversity at both sampling stations within the LPCNR. This brings into discussion if such a condition can cause a shift towards an alternate stable state (Knowlton, 1992) in the coral community structure or in the overall coral reef community structure. The maintenance of high coral species richness, as well as many other vital coral reef processes, can be influenced by a combination of regional and local factors, which can affect recruitment and post-recruitment processes (Cornell and Karlson, 1996).
Regional factors include coral species pool, and larval transport, effects of lethal disease outbreaks, coral bleaching, sea surface current patterns, sea surface temperature, and the frequency and severity of hurricanes. Local factors include environmental conditions of the coral reef (i.e., water quality, sedimentation rates), local oceanographic processes, local coral species pool, success of larval recruitment and post-recruitment processes, and a sort of anthropogenic factors, which include land clearing, sewage pollution and overfishing, among many others. Hernández-Delgado (2000) predicted that the onset of
severe local chronic or recurrent acute anthropogenic disturbances could significantly modify the environmental conditions of coral reefs in a long-term basis by significantly influencing coral reefs over regional factors. For example, in the case of coral reefs in northeastern Puerto Rico, sedimentation and eutrophication is having the long-term effect of restricting the availability of local habitats suitable for recruitment to the regional pool of potential colonists. A similar effect can have the rapid algal overgrowth within the LPCNR. It is being proposed that local factors might have become more important in determining coral species richness in coral reefs under chronic anthropogenic degradation by eliminating rare and sensitive coral species. This may help to explain the dominance of disturbance-tolerant species and the absence of rare and low-recruiting coral species in anthropogenically-disturbed coral reefs. In addition, disturbance-tolerant species are typically brooding species characterized by having a highly aggregated distribution, a short larval stage, and high recruitment rates (Harrison and Wallace, 1990). Thus, coral reefs under degraded conditions do not depend much on the regional species pool to maintain richness, since disturbance-tolerant species are already dominant in a local scale. This can explain the slight increase observed in coral recruitment during 20022003 at the LPCNR by disturbance-tolerant species.
Another important aspect regarding the influence of local vs. regional factors is that it is predicted that an increasing severity or frequency of local anthropogenic disturbances (i.e., sedimented and nutrient-loaded runoff) can significantly enhance the adverse effects of any regional-scale disturbance (i.e., hurricanes, disease outbreaks, bleaching events) by producing a negative synergistic effect. Natural recovery of coral
reefs from chronic disturbance is significantly slower than recovery from acute disturbance (Connell et al. 1997). Under this prediction, it is proposed that local anthropogenic stressors such as the increasing frequency of sediment and nutrient pulses could trigger a severe negative effect over regional factors, thus accelerating coral mortality rates and significantly reducing coral tissue regeneration abilities. This could produce a cascade phase shift from a coral-dominated stage towards an algal-dominated one (Knowlton, 1992). Such type of potential sudden changes can be referred to as threshold effects (Knowlton, 2001).
Threshold effects can be described as non-linear responses of biological systems, including coral reefs, to any individual or group of environmental factors, where a variable (i.e., coral calcification rate) may remain constant over a range of saturation states, but then drop abruptly below some threshold value. Threshold effects are still unknown for many of the coral parameters (i.e., growth rates, calcification rates, reproduction, survival rates). Thus, it is not surprising that massive coral declines are not linear events through time and future trends can not be accurately predicted unless we find a way to understand threshold effects. Allee effects (Knowlton, 1992, 2001) are classic threshold phenomena. For example, one immediate consequence of declining coral densities for a given species (e.g., Acropora palmata, Acropora cervicornis) will be a decline in gamete densities at a reef-wide scale caused by low population densities. This could result in gamete wasting, asynchronous reproduction, or low reproductive output per individual that can lead to recurrent reproductive failure. In the long-term, a sustained coral decline rate as the one documented in this study could produce a
significant Allee effect for many rare coral species that could impair reproduction and might result in a long-term decline in coral species diversity. The observed decline in coral species diversity in our permanent transects could be reflecting the first stages of such process.
Modeling alternate states of coral reefs in the LPCNR.
Thus far, 6-year long-term data from the LPCNR has shown a rapid coral reef decline, which was associated to a possible synergistic effect of regional factors and local chronic anthropogenic factors. If the actual decline trend sustains during the next few years, we might expect a catastrophic decline in living coral cover and a major phase shift in the structure of epibenthic communities within the next decade, probably beyond a point that could exceed the natural ability of recovery for coral reefs.
A model describing the different alternate states of coral reefs and the processes describing their dynamics was developed by Hernández-Delgado (2000), and applied to the LPCNR coral reef systems (Figure 53). The model predicts that local anthropogenic stresses can rapidly drive a stable coral reef in a natural dynamic equilibrium to a threatened alternate state by means of a cascade threshold effect. Depending on the frequency and severity of the causal factors, this process could occur in a temporal scale of months to a few years, similar to the one documented during this study in Culebra Island. According to the model, stable coral reefs, which are coral-dominated and characterized by having a high coral species richness, high percentage of living coral cover, high frequency of large colonies, high recruitment rates and low coral tissue
Stable
Hi gh species richn ess
Hi gh coral cov er
Co ral do minated st ate
Severit y of chronic st ress
Na tura l a bil it y t o recover (Mana gement )
Low Low to mod erat e
Hi gh recruitment massiv e species
Rare corals abun dant
Abu ndant large colo ni es
Lo w ti ssue mort alit y
Lo w bi oerosi on M ann ulari s domi nant
T hre aten ed
Decl in e in sp ecies ri ch ness
Decl in e in coral co ver
Non-reef builders do minant
Resto ration
M anagem ent
Sus ceptibility
Decl in e in r ecrui tment massive sp ecies
Decl in e in r are coral s
Lo w abund an ce of l arge colo nies
Increased t issue mor tali ty
Lo w to moderate bi oerosion
Dominance variab le
Lo w species r ichness
Lo w coral cover
Al gae beome domi nant
Stabl e Threat ened
Lo st High
Cr it ical
Lo w
Months Years Decades
Time
Mo derate t o hi gh
Recruitment massiv e corals rar e or non- ex ixt ent
Rare corals n early ab sent
Los t C r it ica l
Large col oni es r are o r absen t
Hi gh t issue mortal ity
Mod er at e t o h igh bioerosi on
S radi an s, Pori tes spp do mi nant
Hi gh t o severe
Dramat ic decli ne in species r ichness
Dramat ic decli ne in coral cover
Fau na domi nated by opp ort uni sti c sp ecies
Filamentous alg ae/macroalgae domi nant
No r ecrui tment massi ve co ral s Rare corals absent
Large col onies absent
High t o sever e b ioero sion
S radi an s an d no n-reef bui l din g t axa do mi nant
FIGU RE 53 Theore ti cal pr edic ti ons of al ter nate stabl e st ate s of the LPCNR cora l re efs (ba sed on H ernández- Del gado, 2000) The m odel predi cts t hat the ac tual condi ti on of the LPCN R is a t hreat ened one. But gi ven the actua l t rends, and i f t here i s no change i n te rms of the r apid c oral re ef decl ining rate, it is predi cted that wi thin the next decad e or so, the LPCNR may s hift from a t hreat ened condi ti on to a cri ti cal c ondit ion, and t o a los t condi ti on wi thi n the next t wo dec ades or s o
mortality, would shift to a gradual decline to an alternate threatened state. In this alternate state, there would be a decline in coral species richness and non-reef-building species may become dominant. Also, there would be a decline in the percentage of living coral cover and in recruitment rates, particularly in massive, low-recruiting species (e.g.,Montastraea annularis) within the next 5 to 10 years. In addition, there would be a decline in the abundance of large coral colonies, an increase in partial tissue mortality, and bioerosion rates would be low to moderate. It is predicted that threatened coral reefs could still naturally revert to previous stable conditions if stressful conditions disappear or are eliminated though adequate management. This is where the LPCNR coral reefs are standing now. Thus, it is imminent that further decline should continue unless immediate adequate management measures are implemented and enforced regarding the fishing prohibition and regarding controlling water quality, erosion and sedimentation controls, the operation of the Culebra Municipal Landfill, and the development activities in the steep slopes that characterize the western coast of the Island. This points out at the imperative need of a Culebra Island-wide management plan and land use plan beyond the actual efforts to develop a management plan for the LPCNR. The actual non-sustainable land development in Culebra Island is negatively affecting its coral reef and seagrass habitats. Although there is no evaluation of the economic impact on tourism and other long-term benefits of this predatory behavior by developers, it is suspected that the shortterm loss (i.e., 10 years) has been in the order of several million dollars.
The model predicts that any further increase in the severity and/or frequency of chronic anthropogenic stressing conditions (i.e. sedimented and nutrient-loaded runoff
pulses) within or nearby the LPCNR would drive threatened coral reefs within a decade or two into a critical condition (Figure 53). In this case, the alternate critical state would be characterized by having lower coral species richness, higher algal dominance and a significant decline in coral cover. Recruitment of massive coral species would be almost non-existent and recruitment would be dominated by local opportunistic species. Rare coral species would be largely absent. Coral colonies would also suffer high partial tissue mortality and moderate to high bioerosion rates. Critical coral reefs may not have the ability to naturally recover from this state and may require a major time-consuming and costly restoration and management efforts.
An additional increase in the severity and or frequency of chronic anthropogenic stress will drive critical coral reefs into a lost state within the next two decades, which will be irreversible in terms of a human generation time scale (Figure 53). Severe degradation would include a dramatic decline in species richness and normally abundant coral species would become rare. Also, coral reef fauna would be dominated by opportunistic and non-reef-building species. Macroalge would become the dominant epibenthic component, a trend which has already been documented within the LPCNR coral reefs. Also, there will be a dramatic decline in coral cover, usually to values below 10 to 5%, as elsewhere in the main island of Puerto Rico (Hernández-Delgado, 2000; in press; García et al., 2003). Recruitment of massive coral species would be basically nonexistent and rare coral species would be extremely rare or absent. Coral mortality would become a major cause of reef decline. Finally, these coral reefs would be subjected to severe bioerosion rates and will loss their economic potential.
Conclusions.
Coral reef communities within the LPCNR in Culebra Island are showing unequivocal signs of a severe rapid decline from a coral-dominated stage to a macroalgaldominated stage. Such coral reef decline rate is among the highest ever documented through the entire Caribbean region and is the highest ever documented in the northeastern Caribbean sub-region. Multivariate analysis showed that the major cause of changes in the structure of coral reef communities have been produced by shifts in the stucture macroalgae, total algae, filamentous algae and cyanobacteria. This study suggests that we are starting to face the early results of a combination of adverse effects associated to Caribbean-wide natural acute factors, such as recurrent White Plague Type II disease outbreaks, and the long-term local chronic anthropogenic effects of ecosystem overfishing, and sedimented and nutrient-loaded runoff pulses, which could accelerate this phase shift through different simultaneous top-down and down-top cascade pathways which will require further investigation.
These observations bring us back several facts. First, the LPCNR is still lacking continuous vigilance as previously reported by Hernández-Delgado (2001, 2002). Therefore, illegal fishing activities are still occurring within the no-take reserve boundaries without any regular enforcement by the PRDNER personnel. Moreover, boundary buoys have been continuously vandalized and illegally removed by pouchers. It is of paramount importance that fishing prohibition regulations are strictly enforced in a daily basis. This is difficult to accomplish when there is a lack of a full time
management officer, trained personnel and patrolling personnel. There is a need to assign a higher budget and permanent full time management and patrolling personnel for the LPCNR.
In addition, land-clearing and construction activities in Culebra Island have increased significantly in recent years due to the fast tracking procedures in the government permitting processes, which have resulted in an accelerated rate of project development and land-clearing activities (Hernández-Delgado, 2002). This trend has kept unchanged during year 2003. There has to be a serious commitment by the State Government of Puerto Rico and the Municipal Government of Culebra Island to cease approving, endorsing and/or carrying out development projects through a fast tracking procedures for the ecologically-sensitive Culebra Island without the proper environmental conservation measures (i.e., required erosion and sedimentation controls).
Third, there is an almost total lack of enforcement of environmental laws and regulations in Culebra Island. Land-clearing permits can be easily obtained at the DNER Humacao Regional Office without environmental permitting processes, and without the required evaluation of environmental impacts. Therefore, land-clearing activities in Culebra are undergoing basically unmonitored and unregulated in a daily basis. Thus, sedimented and nutrient-loaded run-off has become one of the most severe anthropogenic threats to the coastal habitats of the Island, including seagrass and coral reefs. Furthermore, it appears that the State, Municipal Government and private sectors in Culebra have forgotten that all coastal habitats within 3 nm (5.6 km) from Culebra are
classified as Resource Category I critical habitats for the endangered Green Turtle, Chelonia mydas, therefore strict management and conservation measures are required by the US Federal Government. There is a need to establish Culebra Island-wide measures to prevent sedimented and nutrient-loaded run-off to access sensitive coastal communities. This needs to be enforced by the PR Planning Board, PRDNER and by the Culebra Conservation and Development Authority (Municipal Government).
Moreover, it is still alarming that, without a few exceptions, Diadema antillarum is nearly absent from most of the LPCNR. Thus, it is suggested that, together with a more serious enforcement of the fishing prohibition regulations within the limits of the LPCNR, an experimental re-introduction of D. antillarum should be implemented to test if they can control the increasing brown macroalgal densities. A similar suggestion was already made by Hernández-Delgado (2002). In addition, there is a need to carry out a systematic characterization of water quality parameters within and around the LPCNR, including sedimentation rates. The long-term effects of increasing small amounts of sedimented run-off and nutrients derived from storm waters, run-off and untreated wastewaters (due to the lack of a sewage treatment plant in Culebra Island) could be starting to have negative chronic effects in the structure of coral reef epibenthic communities within the LPCNR. Therefore, a permanent water quality monitoring program should be incorporated immediately to any long-term monitoring protocol for the LPCNR. A preliminary water quality study is being carried out, but additional funds are required to enhance sampling efforts.
A final recommendation to the DNER is that they should review their top priorities of the long-term coral reef conservation strategy and put more attention into studying the causes of coral reef decline in the LPCNR, as well as in other Natural Reserves. This might require major funding for experimental studies. Another priority must be coral reef restoration, particularly within Natural Reserves. Population levels of candidate endangered species Acropora cervicornis and A. palmata have collapsed during the last 20 years and there might be an Allee effect strong enough that natural recovery is mostly impossible and will require a major restoration effect by means of coral farming methods. A preliminary experimental effort (Hernández-Delgado et al., in preparation) has shown that coral propagation has been successful in Culebra. But a larger coral propagation program will require major funding as well. All of these research efforts should provide the DNER with the basic tools to prepare a sound coral reef conservation and management plan for the LPCNR. This is number one priority at this moment and collaborative efforts between the Culebra Conservation and Development Authroity, DNER and community stakeholders are focused on the development of a management plan that should be completed some time during 2004. However, there is an imperative need that the Culebra Municipal Government develop a Culebra Island-wide management plan to address the major land use problems as well.
Too much funding and research efforts are being put into isolated merely scientific-based research projects, and more attention should be given in the future to managementoriented research.
It has been already shown that a marine protected area designation has not been enough to prevent further loss of coral species and living coral cover. This major decline requires management action well beyond the limits of the LPCNR by the Culebra Municipal Government and by other State authorities. The development model of Culebra Island requires a major review and reconceptualization from the actual one to an ecologically sustainable one. Particular attention should be put into controlling raw sewage inputs, sedimentation and nutrient-loaded runoff. Otherwise, we will face a total coral reef collapse within the next decade or two. A co-management or collaborative model between DNER, Muncicipal Government and the community stakeholders seems to be one of the best alternatives to establish and enforce conservation-oriented regulations within and outside the LPCNR.
Acknowledgments.
This study was funded through the University of Puerto Rico-Sea Grant College Program Project R-101-3-00. Partial funding was also provided by the U.S. Coral Reef Initiative under Award No. NA17OA2712 through the Department of Natural and Environmental Resources, the University of Puerto Rico-Dean of Graduate Studies and Research, the Caribbean Marine Research Center (National Undersea Research Program), and by PADI Foundation. Special thanks to the unconditional collaboration of many voluntary field and logistic assistants during long and tedious field surveys during 2003, including Jean M. Lassus, Jaime Fonseca, and Mary Ann Lucking.
Cited literature.
Anderson, D.M., & L.H. MacDonald. 1998. Modelling road surface sediment production using a vector geographic information system Earth Surf. Process. Landforms 23:95-107.
Aronson, R.B., & W.E. Precht. 1997. Stasis, biological disturbance and community structure of a Holocene coral reef. Paleobiology. 23:326-346.
Aronson, R.B., & W.E. Precht. 2001. White-band disease and the changing face of Caribbean coral reefs. 460:25-38.
Antonius, A., & E. Ballesteros. 1998. Epizoism: a new threat to coral health in Caribbean reefs. Rev. Biol. Trop.. 46:145-156.
Bak, R.P.M., & B.E. Luckhurst. 1980. Constancy and change in coral reef habitats along depth gradients at Curacao. Oecologia. 47.
Bak, R.P.M., &G. Nieuwland. 1995. Long-term change in coral communities along depth gradients over leeward reefs in the Netherlands Antilles. Bull. Mar. Sci. 56:609619.
Bak, R.P.M., & Y.S. Van Es. 1980. Regeneration of superficial damage in the scleractinian corals Agaricia agaricites f. purpurea and Porites astreoides. Bull. Mar. Sci. 30:883-887.
Borowitzka, M.A., A.W.D. Larkum, & L.J. Borowitzka. 1978. A preliminary study of algal turf communities of a shallow coral reef lagoon using an artificial substratum. Aquat. Bot. 5:365-381.
Bray, J.R., & J.T. Curtis. 1957. An ordination of the upland forest communities of southern Wisconsin. Ecol. Monogr. 27:325-349.
Bruckner, A.W., & R.J. Bruckner. 1997. The persistence of black-band disease in Jamaica: impact on community structure. Proc. 8th Int. Coral Reef Symp. 1:601606.
Bythell, J.C., E.H. Gladfelter, & M. Bythell. 1993. Chronic and catastrophic natural mortality of three common Caribbean reef corals. Coral Reefs. 12:143-152.
Bythell, J.C., Z.M. Hillis, & C.S. Rogers. 2000. Local variability but landscape stability in coral reef communities following repeated hurricane impacts. Mar. Ecol. Prog. Ser. 204:93-100.
Carleton, J.H., & T.J. Done. 1995. Quantitative video sampling of coral reef benthos: large-scale application. Coral Reefs. 14:35-46.
Carpenter, R.C. 1986. Partitioning herbivory and its effects on coral reefs algal communities. Ecol. Monogr. 56:345-363.
Carpenter, R.C. 1997. Invertebrate predators and grazers. 198-230. In, C. Birkeland (ed.), Life and Death of Coral Reefs. Kluwer Academic Publishers, Boston, MA. 536 pp.
Caswell, H. 1976. Community structure: a neutral model analysis. Ecol. Mongr. 46:327354.
Cervino, J., T.J. Goreau, I. Nagelkerken, G.W. Smith, & R. Hayes. 2001. Yellow band and dark spot syndromes in Caribbean corals: distribution, rate of spread, cytology, and effects on abundance and division rate of zooxanthellae. Hydrobiologia. 460:53-63.
Cho, L.L., & J.D. Woodley. 2002. Recovery of reefs at Discovery Bay, Jamaica and the role of Diadema antillarum. Proc. 9th Int. Coral Reef Symp. 1:331-337.
Clarke, K.R. 1993. Non-parametric multivariate analysis if changes in community structure. Aust. J. Ecol. 18:117-143.
Clarke, R. 1996. Population shifts in two competing fish species on degrading coral reef. Mar. Ecol. Prog. Ser. 137:51-58.
Clarke, K.R., & R.H. Green. 1988. Statistical design and analysis for a “biological effects” study. Mar. Ecol. Prog. Ser. 46:213-226.
Clarke, K.R., & R.M. Warwick. 1994. Similarity-based testing for community pattern: the 2-way layout with no replication. Mar. Biol. 118:167-176.
Clarke, K.R., & R.M. Warwick. 2001. Change in Marine Communities: An Approach to Statistical Analysis and Interpretation. 2nd Ed. PRIMER-E, Ltd., Plymouth Marine Laboratory, UK.
Colwell, B.C., & P.S. Potts. 1994. Factors influencing the distribution, abundance and growth of Lyngbia wollei in Central Florida. Aquat. Bot. 49:1-17.
Connell, J.H., T.P. Hughes, & C.C. Wallace. 1997. A 30-year study of coral abundance, recruitment, and disturbance at several scales in space and time. Ecol. Mongr. 67:461-488.
Connell, J.H. 1978. Diversity in tropical rain forests and coral reefs. Science. 199:13021310.
Cortés, J. 1993. A reef under siltation stress: a decade of degradation. A8-A14. In, R.N. Ginsburg (ed.), Global Aspects of Coral Reefs, Health, Hazards, and History, June 10-11, 1993, Univ. of Miami, Miami, FL.
Costa, O.S., Jr., Z.M.A.N. Leão, M. Nimmo, & M.J. Attrill. 2000. Nutrification impacts on coral reefs from northern Bahía, Brazil. Hydrobiologia. 440:307-315.
Costa, O.S., Jr, M.J. Attrill, A.G. Pedrini, & J.C. De-Paula. 2002. Benthic macroalgal distribution in coastal and offshore reefs at Porto Seguro Bay, Brazilian Discovery Coast. Proc. 9th Int. Coral Reef Symp. 1:499-507.
Delgado, O., & B.E. Lapointe. 1994. Nutrient-limited productivity of calcareous vs. fleshy macroalgae in a eutrophic, carbonate-rich tropical marine environment. Coral Reefs. 13:151-159.
Doyle, R.D., & R.M. Smart. 1998. Competitive reduction of noxious Lyngbia wollei mats by rooted aquatic plants. Aquat. Bot. 61:17-32.
Dustan, P., & J.C. Halas. 1987. Changes in the reef coral community in of Carysfort Reef, Key Largo, Florida – 1974 to 1982. Coral Reefs. 6:91-106.
Edmunds, P.J. Long term dynamics of coral reefs in St. John. In review.
Edmunds, P.J., & J.D. Witman. 1991. Effect of Hurricane Hugo on the primary framework of a reef along the south shore of St. John, United States Virgin Islands. Mar. Ecol. Prog. Ser. 78:201-204.
Fabricius, K., & G. De’ath. 2001. Environmental factors associated with the spatial distribution of crustose coralline algae on the Great Barrier Reef. Coral Reefs. 19:303-309.
Fisher, R.A., A.S. Corbet, & C.B. Williams. 1943. The relation between the number of species and the number of individuals in a random sample of an animal population. J. Anim. Ecol. 12:42-58.
Fong, P., R.M. Donohoe, & J.B. Zedler. 1993. Competition with macroalgae and benthic cyanobacterial mats limits phytoplankton abundance in experimental microcosms Mar. Ecol. Prog. Ser. 100:97-102.
García, J.R., C. Schmitt, C. Heberer, & A. Winter. 1998. La Parguera, Puerto Rico, USA. 195-212. In, B. Kjerfve (ed.), CARICOMP-Caribbean Coral Reef, Seagrass and Mangrove Sites. UNESCO, Paris.
García, J.R., J. Morelock, R. Castro, C. Goenaga, & E. Hernández. 2003 Puerto Rican reefs: Research synthesis, present threats and management perspectives. 111-130.
In, J. Cortés (ed.), Latin American Coral Reefs. Elsevier Publ., Amsterdam, Holland. 497 pp.
Gardner, T. 2002. Coral reefs of the tropical western Atlantic: a quantitative summary of recent temporal change and the relative importance of hurricane impacts. M.Sc. Thesis, Dept. Applied Ecology and Conservation, University of East Anglia, Norwich, U.K. 94 pp.
Gardner, T.A., I.M. Côte, J.A. Gill, A. Grant, & A.R. Watkinson. Long-term region-wide declines in Caribbean corals. In review
Garrison, V., E.A. Shinn, J. Miller, M. Carlo, R. Rodríguez, & K. Koltes. 2000. Isla de Culebra, Puerto Rico, changes in benthic cover on three reefs (1991-1998). Tech. Rept. for the Water Res. Div., U.S. Geological Survey, St. Petersburg, Fl.
Garzón-Ferreira, J. 1998. Bahía de Chengue, Parque Natural Tayrona, Colombia. 115125. In, B. Kjerfve (ed.), CARICOMP-Caribbean Coral Reef, Seagrass and Mangrove Sites. UNESCO, Paris.
Garzón-Ferreira, J., D.L. Gil-Agudelo, L.M. Barrios, & S. Zea. 2001. Stony coral diseases observed in southwestern Caribbean reefs. Hydrobiologia. 460:65-69.
Garzón-Ferreira, J., & M. Kielman. 1993. Extensive mortality of corals in the Colombian Caribbean during the last two decades. A15-A21.
Gladfelter, W B. White-band disease in Acropora palmata: implications for the structure and growth of shallow reefs. Bull. Mar. Sci. 32:639-643.
Goenaga, C., & R.H. Boulon, Jr. 1992. The State of Puerto Rican and U.S. Virgin Islands Corals: An Aid to Managers. Report submitted to the Caribbean Fishery Management Council, Hato Rey, P.R. 66 pp.
Goreau, T.J. 1991. Coral reef health in the Negril area: survey and recommendation. Final Report Of The Negril Reef Mooring Buoy Workshop & Installation Project.
Goreau, T.J. J. Cervino, M. Goreau, R. Hayes, M. Hayes, L. Richardson, G. Smith, K. DeMeyer, I. Nagelkerken, J. Garzón-Ferreira, D. Gil, G. Garrison, E.H. Williams, L. Bunkley-Williams, G. Quirolo, K. Patterson, J.W. Porter, & K. Porter. 1998. Rapid spread of diseases in Caribbean coral reefs. Rev. Biol. Trop. 46 Suppl. 5:157-171.
Harrison, P.L., & C.C. Wallace. 1990. Reproduction, dispersal and recruitment of scleractinian corals. 133-207. In, Z. Dubinski (ed.), Coral Reefs. Ecosystems of the World, 25. Elsevier Science Publishers B.V., Amsterdam, The Netherlands. 550 pp.
Harvell, C.D., K. Kim, J.M. Burkholder, R.R. Colwell, P.R. Epstein, D.J. Grimes, E.E. Hofmann, E.K. Lipp, A.D.M.E. Osterhaus, R.M. Overstreet, J.W. Porter, G.W. Smith, & G.R. Vasta. 1999. Emerging marine diseases-climate links and anthropogenic factors. Science. 285:1505-1510.
Harvell, D., K. Kim, C. Quirolo, J. Weir, & G. Smith. 2001. Coral bleaching and disease: contributors to 1998 mass mortality in Briareum asbestinum (Octocorallia, Gorgonacea). Hydrobiologia. 460:97-104.
Hatcher, B.G. 1997. Organic production and decomposition. 140-174. In, C. Birkeland (ed.), Life and Death of Coral Reefs. Kluwer Academic Publishers, Boston, MA. 536 pp.
Hatcher, B.G. & A.W.D. Larkum. 1983. An experimental analysis of factors controlling the standing crop of the epilithic algal community on a coral reef J. Exp. Mar. Biol. Ecol. 69:61-84.
Hay, M.E., & W. Fenical. 1988. Marine plant-herbivore interactions: the ecology of chemical defense. Ann. Rev. Ecol. Syst. 19:111-145.
Hernández-Delgado, E.A. 2000. Effects of anthropogenic stress gradients in the structure of coral reef fish and epibenthic communities. Ph.D. Dissertation, Dept. Biology, University of Puerto Rico, San Juan, P.R. 330 pp.
Hernández-Delgado, E.A. 2001. Effects of the Luis Peña Channel Marine Fishery Reserve (Culebra Island) in the structure of coral reef epibenthic communities: I. Ecological change of coral reefs (1997-2001). Technical Rep. submitted to the USCRI, PRCZMP, DNER. San Juan, P.R. November 13, 2001. 150 pp.
Hernández-Delgado, E.A. 2003. Suplemento técnico al Plan de Manejo para la Reserva Natural del Canal Luis Peña, Culebra, Puerto Rico. I. Caracterización de habitáculos. Informe Técnico sometido al Programa de Manejo de la Zona Costanera, DRNA. San Juan, PR. 109 pp.
Hernández-Delgado, E.A. Historia natural, caracterización, distribución y estado actual de los arrecifes de coral Puerto Rico. In, R.L. Joglar (Ed.), Historia Natural de Puerto Rico. (In press)
Hernández-Delgado, E.A. White plague, mat tunicate Trididemnum solidum (Ascidiacea: Didemnidae), and damselfish territorial behavior: Sources of coral mortality. (In review)
Hernández-Delgado, E.A., L. Alicea-Rodríguez, C.G. Toledo-Hernández, & A.M. Sabat. 1998. Baseline characterization of coral reef epibenthic and fish communities within the proposed Culebra Island Marine Fishery Reserve, Puerto Rico.Proc. Gulf Caribb. Fish. Inst. 51:537-556.
Hernández-Delgado, E.A., & A.M. Sabat. 1998. Ecological status of essential fish habitats through an anthropogenic environmental stress gradient in Puerto Rican coral reefs.Proc. Gulf Caribb. Fish. Inst. 51:457-470.
Hernández-Delgado, E.A., & B.J. Rosado-Matías. 2001. Restauración del hábitat esencial de peces juveniles mediante la replantación de corales fragmentados en la Reserva Pesquera Marina del Canal de Luis Peña, Culebra. Mem. XXIV Simp. Rec. Nat. 77-97.
Hernández-Delgado, E.A., M.A. Lucking, J. Márquez, K. García, C. Martínez-Rubio, D. Martinó, J. Lassus, C. López, & E. Acosta. 2002. Status of the shallow-water seagrass communities and Conch populations within the Luis Peña Channel Marine Fishery Reserve, Culebra Island, Puerto Rico. Tech. Report submitted to the Caribbean Fishery Management Council, NOAA. San Juan, P.R. 54 pp. + App.
Hernández-Delgado, E.A., & B.J. Rosado-Matías. 2003. Suplemento técnico al Plan de Manejo para la Reserva Natural del Canal Luis Peña, Culebra, Puerto Rico. II. Inventario biológico. Informe Técnico sometido al Programa de Manejo de la Zona Costanera, DRNA. San Juan, PR. 60 pp.
Hixon, M.A. 1997. Effects of reef fishes on corals and algae. 230-248. In, C. Birkeland (ed.), Life and Death of Coral Reefs. Kluwer Academic Publishers, Boston, MA. 536 pp.
Hughes, T.P. 1993. Coral reef degradation: a long-term study of human and natural impacts. C20-C25. In, R.N. Ginsburg (ed.), Global Aspects of Coral Reefs, Health, Hazards, and History, June 10-11, 1993, Univ. of Miami, Miami, FL.
Hughes, T.P. 1994. Catastrophes, phase shifts, and large-scale degradation of a Caribbean coral reef. Science. 265:1547-1550.
Hughes, T.P., & J.H. Connell. 1999. Multiple stressors on coral reefs: A long-term perspective. Limnol. Oceanogr. 44:932-940.
Hughes, T.P., D.C. Reed, & M.J. Boyle. 1987. Herbivory on coral reefs: community structure following mass mortalities of sea urchins. J. Exp. Mar. Biol. Ecol 113:39-59.
Huston, M. 1979. A general hypothesis of species diversity. Am. Nat. 113-81-101.
Kaufman, L. 1977. The three-spot damselfish: effects on benthic biota of Caribbean coral reefs. Proc. 3rd Int. Coral Reef Symp. 559-564.
Keller, B.D. (ed.). 2001. Sanctuary Monitoring Report 2000. U.S. Environmental
Protection Agency, Florida.
Knowlton, N. 1990. Case study of natural population collapse: post hurricane predation on Jamaican staghorn corals. Smithsonian Contrib. Mar. Sci. 31:1-25.
Knowlton, N. 1992. Thresholds and multiple stable states in coral reef community dynamics. Amer. Zool. 32:674-682.
Knowlton, N. 2001. The future of coral reefs. Proc. Natnl. Acad. Sci. USA. 98:54195425.
Koslow, J.A., F. Hanley, & R. Wicklund. 1988. Effects of fishing on reef fish communities at Pedro Bank and Port Royal Cays, Jamaica. Mar. Ecol. Progr. Ser. 43:201-212.
Lambshead, P.J.D., H.M. Platt, & K.M. Shaw. 1983. The detection of differences among assemblages of marine benthic species based on an assessment of dominance and diversity. J. Nat. Hist. 17:859-874.
Lapointe, B.E. 1997. Nutrient thresholds for bottom-up controls of macroalgal blooms on coral reefs in Jamaica and Southeast Florida. Limnol. Oceanogr. 42:1119-1131.
Larkum, A.W.D. 1988. High rates of nitrogen fixation on coral skeletons after predation by the crown of thorns starfish Acanthaster planci Mar. Biol. 97:503-506.
Laydoo, R.S., K. Bonair, & G. Allen. 1998. Buccoo Reef and Bon Accord Lagoon, Tobago, Republic of Trinidad and Tobago. 171-176. In, B. Kjerfve (ed.), CARICOMP-Caribbean Coral Reef, Seagrass and Mangrove Sites. UNESCO, Paris.
Lessios, H.A. 1988. Mass mortality of Diadema antillarum in the Caribbean: what have we learned? Ann. Rev. Ecol. Sist. 19:371-393.
Lirman, D. Competition between macroalgae and corals: effects of herbivore exclusion and increased algal biomass on coral survivorship and growth. Coral Reefs. 19:392-399.
Liddell, W.D., & S.L. Ohlhorst. 1986. Changes in benthic community composition following the mass mortality of Diadema antillarum in Jamaica. J. Exp. Mar. Biol. Ecol. 95:271-278.
Liddell, W.D., & S.L. Ohlhorst. 1987. Patterns of reef community structure, North Jamaica. Bull. Mar. Sci. 40:311-329.
Liddell, W.D., & S.L. Ohlhorst. 1993. Ten years of disturbance and change on a Jamaican fringing reef. Proc. 7th Int. Coral Reef Symp. 1:144-150.
Littler, M.M., & D.S. Littler. 1984. Models of tropical reef biogenesis: the contribution of algae. Progr. Phycol. Res.3:323-364.
Lobel, P.S. 1980. Herbivory by damselfishes and their role in coral reef community ecology. Bull. Mar. Sci. 30:273-289.
Loya, Y. 1978. Plotless and transect methods. 197-217. In, D.R. Stoddart, & R.E. Johannes (eds.), Coral Reefs: Research Methods, UNESCO, Paris, France. 581 pp.
MacDonald, L.H., D.M. Anderson, W E. Dietrich. 1997. Paradise threatened: Land use and erosion on St. John, U.S. Virgin Islands. Environ. Mgmt. 21:851-863.
MacDonald, L.H., R.W Sampson, & D.M. Anderson. 2001. Runoff and road erosion at the plot and road segment scales, St. John, U.S. Virgin Islands. Earth Surf. Process. Landforms. 26:251-272.
MacDonald, L.H., & C.E. Ramos-Scharron. 2000. St. John erosion study. Final Report to the Water Resources Research Institute, Univeristy of the Virgin Islands, 1 March 1998 to 31 August 1999. 63 pp.
Márquez, L.M., F.J. Losada, & M. Rodríguez. 1997. Zonation and structure of a gorgonian community in Venezuela. Proc. 8th Int. Coral Reef Symp. 1:447-450.
McClanahan, T.M., R.B. Aronson, W.F. Precht,, & N.A. Muthiga. 1999. Fleshy algae dominate remote coral reefs of Belize. Coral Reefs. 18:61-62.
McClanahan, T.R., M. McField, M. Huitric, K. Bergman, E. Sala, M. Nyström, I. Nordemar, T. Elfwing, & N.A. Muthiga. 2001a. Responses of algae, corals and fish to the reduction of macroalgae in fished and unfished patch reefs of Glovers Reef Atoll, Belize. Coral Reefs. 19:367-379.
McClanahan, T.R., & N.A. Muthiga. 1998. An ecological shift in a remote coral atoll of Belize over 25 years. Environ. Conserv. 25:122-130.
McClanahan, T.R., N.A. Muthiga, & S. Mangi. 2001b. Coral and algal changes after the 1998 coral bleaching: interaction with reef management and herbivores on Kenyan reefs. Coral Reefs. 19:380-391.
McCook, L.J. 2001. Competition between corals and algal turfs along a gradient of terrestrial influence in the nearshore central Great Barrier Reef. Coral Reefs 19:419-425.
McCook, L.J., J. Jompa, & G. Díaz-Pulido. 2001. Competition between corals and algae on coral reefs: a review of evidence and mechanisms. Coral Reefs. 19:400-418.
McField, M.D., P. Hallock, & W.C. Jaap. 2001. Multivariate analysis of reef community structure in the Belize Barrier Reef Complex. Bull. Mar. Sci. 69:745-758.
Meier, O.D.W. 1996. A long-term study of reef coral dynamics in the Florida Keys. University of Georgia, Athens, GA.
Miller, M.W., M.E. Hay, S.L. Miller, D. Malone, E.E. Sotka, & A.M. Szmant. 1999. Effects of nutrients versus herbivores on reef algae: a new method for manipulating nutrients on coral reefs. Limnol. Oceanogr. 44:1847-1861.
Munro, J.L. (ed.). 1983. Caribbean coral reef fishery resources. ICLARM Stud. Rev. 7:1276.
Murdoch, T.J., & R.B. Aronson. 1999. Scale-dependent spatial variability of coral assemblages along the Florida Reef Tract. Coral Reefs. 18:341-351.
Nagle, D.G., & V.J. Paul. 1998. Chemical defense of a marine cyanobacterial bloom J. Exp. Mar. Biol. Ecol. 225:29-38.
Nagle, D.G., & V.J. Paul. 1999. Production of secondary metabolites by filamentous tropical marine cyanobacteria: ecological functions of compounds. J. Phycol. 35:1412-1421.
Nemeth, R.S., L.H. MacDonald, & C.E. Ramos-Scharron. 2001. Delivery, deposition and effects of land-based sediments on corals in St. John, U.S. Virgin Islands. Final Report to the Water Resources Research Institute, Univeristy of the Virgin Islands. 49 pp.
Ogden, J.C., & N.B. Ogden. 1993. The coral reefs of the San Blas Islands: Revisited after 20 years. A35-A40. In, R.N. Ginsburg (ed.), Global Aspects of Coral Reefs, Health, Hazards, and History, June 10-11, 1993, Univ. of Miami, Miami, FL.
Ostrander, G.K., K. Meyer-Armstrong, E.T. Knobbe, D. Gerace, & E.P. Scully. 2000. Rapid transition in the structure of a coral reef community: The effects of coral bleaching and physical disturbance. Proc. Natl. Acad. Sci. USA. 97:5297-5302.
Pagán-Villegas, I.M., E.A. Hernández-Delgado, & V.P. Vicente. 1999. Documento de designación de la Reserva Natural del Canal Luis Peña, Departamento de Recursos Naturales y Ambientales, San Juan, P.R., 21 de mayo de 1999.
Pennings, S.C. 1997. Indirect interactions on coral reefs. 249-272. In, C. Birkeland (ed.), Life and Death of Coral Reefs. Kluwer Academic Publishers, Boston, MA. 536 pp.
Pennings, S.C., A.M. Weiss, & V.J. Paul. 1996. Secondary metabolites of the cyanobacterium Microcoleus lyngbyaceus and the sea hare Stylocheilus longicauda: palatability and toxicity. Mar. Biol. 126:735-743.
Pennings, S.C., S.R. Pablo, & V.J. Paul. 1997. Chemical defenses of the tropical benthic marine cyanobacterium Hormothamnion enteromorphoides: diverse consumers and synergisms. Limnol. Oceanogr. 42:911-917.
Pielou, E.C. 1966a. The measurement of diversity in different types of biological collections. J. Theor. Biol. 13:131-144.
Pielou, E.C. 1966b. Species diversity and pattern diversity in the study of ecological succession. J. Theor. Biol. 13:370-383.
Porter, J.W 1989. Biannual report on long-term monitoring of coral reef organisms in Byscaine National Park, Phase I. University of Georgia, Athens, GA.
Porter, J.W., V. Kosmynin, K.L. Patterson, K.G. Porter, W.C. Jaap., J. Wheaton, K. Hackett, M. Lybolt, C. Tsokos, G. Yanev, D.M. Marcinek, J. Dotten, D. Eaken, M.E. Patterson, O.W. Meier, M. Brill, & P. Dustan. 2002. Detection of coral reef change by the Florida Keys Coral Reefs Monitoring Project. 749-769. In, J.W. Porter, & K.G. Porter (eds.), The Everglades, Florida Bay, and Coral Reefs of the Florida Keys. An Ecosystem Sourcebook. CRC Press, Boca Raton, Fl.
Porter, J.W., & O.W. Meier. 1992. Quantification of loss and change in Floridian reef coral populations. Am. Zool. 32:625-640.
Richardson, L.L. 1998. Coral diseases: what is really known? Trends Ecol. Sist. 13:438443.
Richardson, L.L., W M. Goldberg, K.G. Kuta, R.B. Aronson, G.W Smith, K.B. Ritchie, J.C. Halas, J.S. Feingold, & S.L. Miller. 1998. Florida’s mystery coral killer identified. Nature. 392:557-558.
Roberts, C.M. 1995. Effects of fishing on the ecosystem structure of coral reefs. Conserv. Biol. 9:988-995.
Rogers, C.S., G. Cintrón, & C. Goenaga. 1978. The impact of military operations on coral reefs of Vieques and Culebra. Report submitted to the Department of Natural Resources, San Juan, PR. 25 pp.
Rogers, C.S., V. Garrison, & R. Grober-Dunsmore. 1997. A fishy story about hurricanes and herbivory: seven years of research on a reef in St. John, U.S. Virgin Islands. Proc. 8th Int. Coral Reef Symp. 1:555-560.
Rogers, C.S., L.N. McLain, & C.R. Tobias. 1991. Effects of Hurricane Hugo (1989) on a
coral-reef in St. John, USVI. Mar. Ecol. Prog. Ser. 78:189-199.
Ruíz-Rentería, F., B.I. van Tussenbroek, & E. Jordán-Dahlgren. 1998. Puerto Morelos, Quintana Roo, México. 57-66. In, K. Kjerfve (ed.), CARICOMP-Caribbean Coral Reef, Seagrass and Mangrove Sites. UNESCO, Paris.
Rützler, K., D.L. Santavy, & A. Antonius. 1983. The black band disease of Atlantic reef corals. 3. Distribution ecology and development. Mar. Ecol. P.Z.N.I. 4:329-358.
Sammarco, P.W 1980. Diadema and its relationship to coral spat mortality: grazing, grazing, competition, and biological disturbances. J. Exp. Mar. Biol. Ecol. 45:245-272.
Santavy, D.L., & E.C. Peters. 1997. Microbial pests: coral disease in the western Atlantic. Proc. 8th Int. Coral Reef Symp. 1:607-612.
Schaffelke, B. 1999. Short-term nutrient pulses as tools to assess responses of coral reef macroalgae to enhanced nutrient availability. Mar. Ecol. Prog. Ser. 182:305-310.
Schaffelke, B. 2001. Surface alkaline phosphatase activities of macroalgae on coral reefs of the central Great Barrier Reef, Australia. Coral Reefs. 19:310-317.
Shannon, C.E., & W. Weaver. 1948. The Mathematical Theory of Communication. University of Illinois Press, Urbana, IL. 117 pp.
Shulman, M.J., & D.R. Robertson. 1996. Changes in the coral reefs of San Blas, Caribbean Panama: 1983 to 1990. Coral Reefs. 15:231-236.
Simpson, E.H. 1949. Measurements of diversity. Nature. 163:688.
Smith, G.W., C.D. Harvell, & K. Kim 1998. Response of sea fans to infection with Aspergillus sp. (Fungi). Rev. Biol. Trop. 46 Suppl. 5:205-208.
Smith, G.W., L.D. Ives, I.A. Nagelkerken, & K.B. Richie. 1996. Caribbean sea-fan mortalities. Nature. 383:487.
Smith, J.E.., C.M. Smith, & C.L. Hunter. 2001. An experimental analysis of the effects of herbivory and nutrient enrichment on benthic community dynamics on a Hawaiian reef. Coral Reefs. 19:332-342.
Smith, S.L., J.C.Ogden, P.M. Alcolado, D. Bone, P. Bush, J. Cortés, J. Garzón-Ferreira, R. Laydoo, H.A. Oxenford, J. Ryan, J. Singh, J. Tschirky, F. Ruiz, S. White, & J. Woodley. 1993. Status and recent history of coral reefs at the CARICOMP network of Caribbean marine laboratories. M43-M49. In, R.N. Ginsburg (Ed.), Global Aspects of Coral Reefs, Health, Hazards, and History, June 10-11, 1993, Univ. of Miami, Miami, FL.
Smith, S.R. 1998. Bermuda. 247-257. In, B. Kjerfve (ed.), CARICOMP-Caribbean Coral Reef, Seagrass and Mangrove Sites. UNESCO, Paris.
Steneck, R.S. 1993. Is herbivore loss more damaging to reefs than hurricanes? Case studies from two Caribbean reef systems (1978-1988). C32-C34. In, R.N. Ginsburg (ed.), Global Aspects of Coral Reefs, Health, Hazards, and History, June 10-11, 1993, Univ. of Miami, Miami, FL.
Steneck, R.S., & M.N. Dethier. 1994. A functional group approach to the structure of algal-dominated communities. Oikos. 69:476-498.
Stimson, J., S.T. Larned, & E. Conklin. 2001. Effects of herbivory, nutrient levels, and introduced algae on the distribution and abundance of the invasive macroalga Dictyosphaeria cavernosa in Kaneohe Bay, Hawaii. Coral Reefs. 19:343-357.
Szmant, A.M. 2001. Introduction to the special issue of Coral Reefs on “Coral Reef Algal Community Dynamics”. Why are coral reefs world-wide becoming overgrown by algae? ‘Algae, algae everywhere, and nowhere a bite to eat!’. Coral Reefs 19:299-302.
Thacker, R.W., D.W Ginsburg, &V.J. Paul. 2001. Effects of herbivore exclusion and nutrient enrichment on coral reef macroalgae and cyanobacteria. Coral Reefs. 19:318-329.
Thacker, R.W., & V.J. Paul. 2001. Are benthic cyanobacteria indicators of nutrient enrichment? Relationships between cyanobacterial adundance and environmental factors on the reef flats of Guam. Bull. Mar. Sci. 69:000-000.
Tsuda, R.T., & H.T. Kami. 1973. Algal succession on artificial reefs in a marine lagoon environment in Guam J. Phycol. 9:260-264.
Warwick, R.M. 1986. A new method for detecting pollution effects on marine macrobenthic communities. Mar. Biol. 92:557-562.
Weil, E. E.A. Hernández-Delgado, A.W. Bruckner, A.L. Ortiz, M. Nemeth, & H. Ruiz. 2002. Distribution and status of Acroporid (Scleractinia) populations in Puerto Rico. Proc. of the Caribbean Acropora Workshop: Potential Application of the U.S. Endangered Species Act as a Conservation Strategy. NOAA Tech. Report (In press).
Wilkinson, C. (ed.). 1998. Status of coral reefs of the World: 1998. AIMS/ICLARM., Queensland, Australia. 184 pp.
Williams, I.D., & N.V.C. Polunin. 2001. Large-scale associations between macroalgal cover and grazer biomass on mid-depth reefs in the Caribbean. Coral Reefs. 19358-366.
Witman, J.D. 1992. Physical disturbance and community structure of exposed and protected reefs-a case study from St. John, United States Virgin Islands. Am. Zool. 32:641-654.
Zar, J.H. 1984. Biostatistical Analysis, 2nd Ed. Prentice-Hall, Inc., Englewood Cliffs, N.J. 718 pp.