Los Angeles County Housing Report: The Speed Factor
June 9, 2025
The Los Angeles County housing market varies significantly from one price range to another, as well as between detached homes and attached condominiums and townhomes.
Price Range Differences


Market speeds vary by price and whether a home is detached or attached, but across the board, the market is significantly slower than it was in the last couple of years.
It is nearly time for the annual 4th of July 5K. For some, it's a race, but for others, it's a fun walk in the sunshine with friends by their side. The elite runners line up right in front of the starting line and run the course at an incomprehensible pace. Others jog pushing strollers or holding an American flag. Small kids speed past, weaving in and out of pedestrian traffic. Many briskly walk the entire route and enjoy a great conversation while exercising. There is a variety of running speeds in every 5K race.
Similarly, when the Los Angeles County housing market is divided into various price ranges and separated between single-family detached homes and attached condominiums and townhomes, there is a variety of different speeds. Some ranges take weeks, while others take months or close to a year.
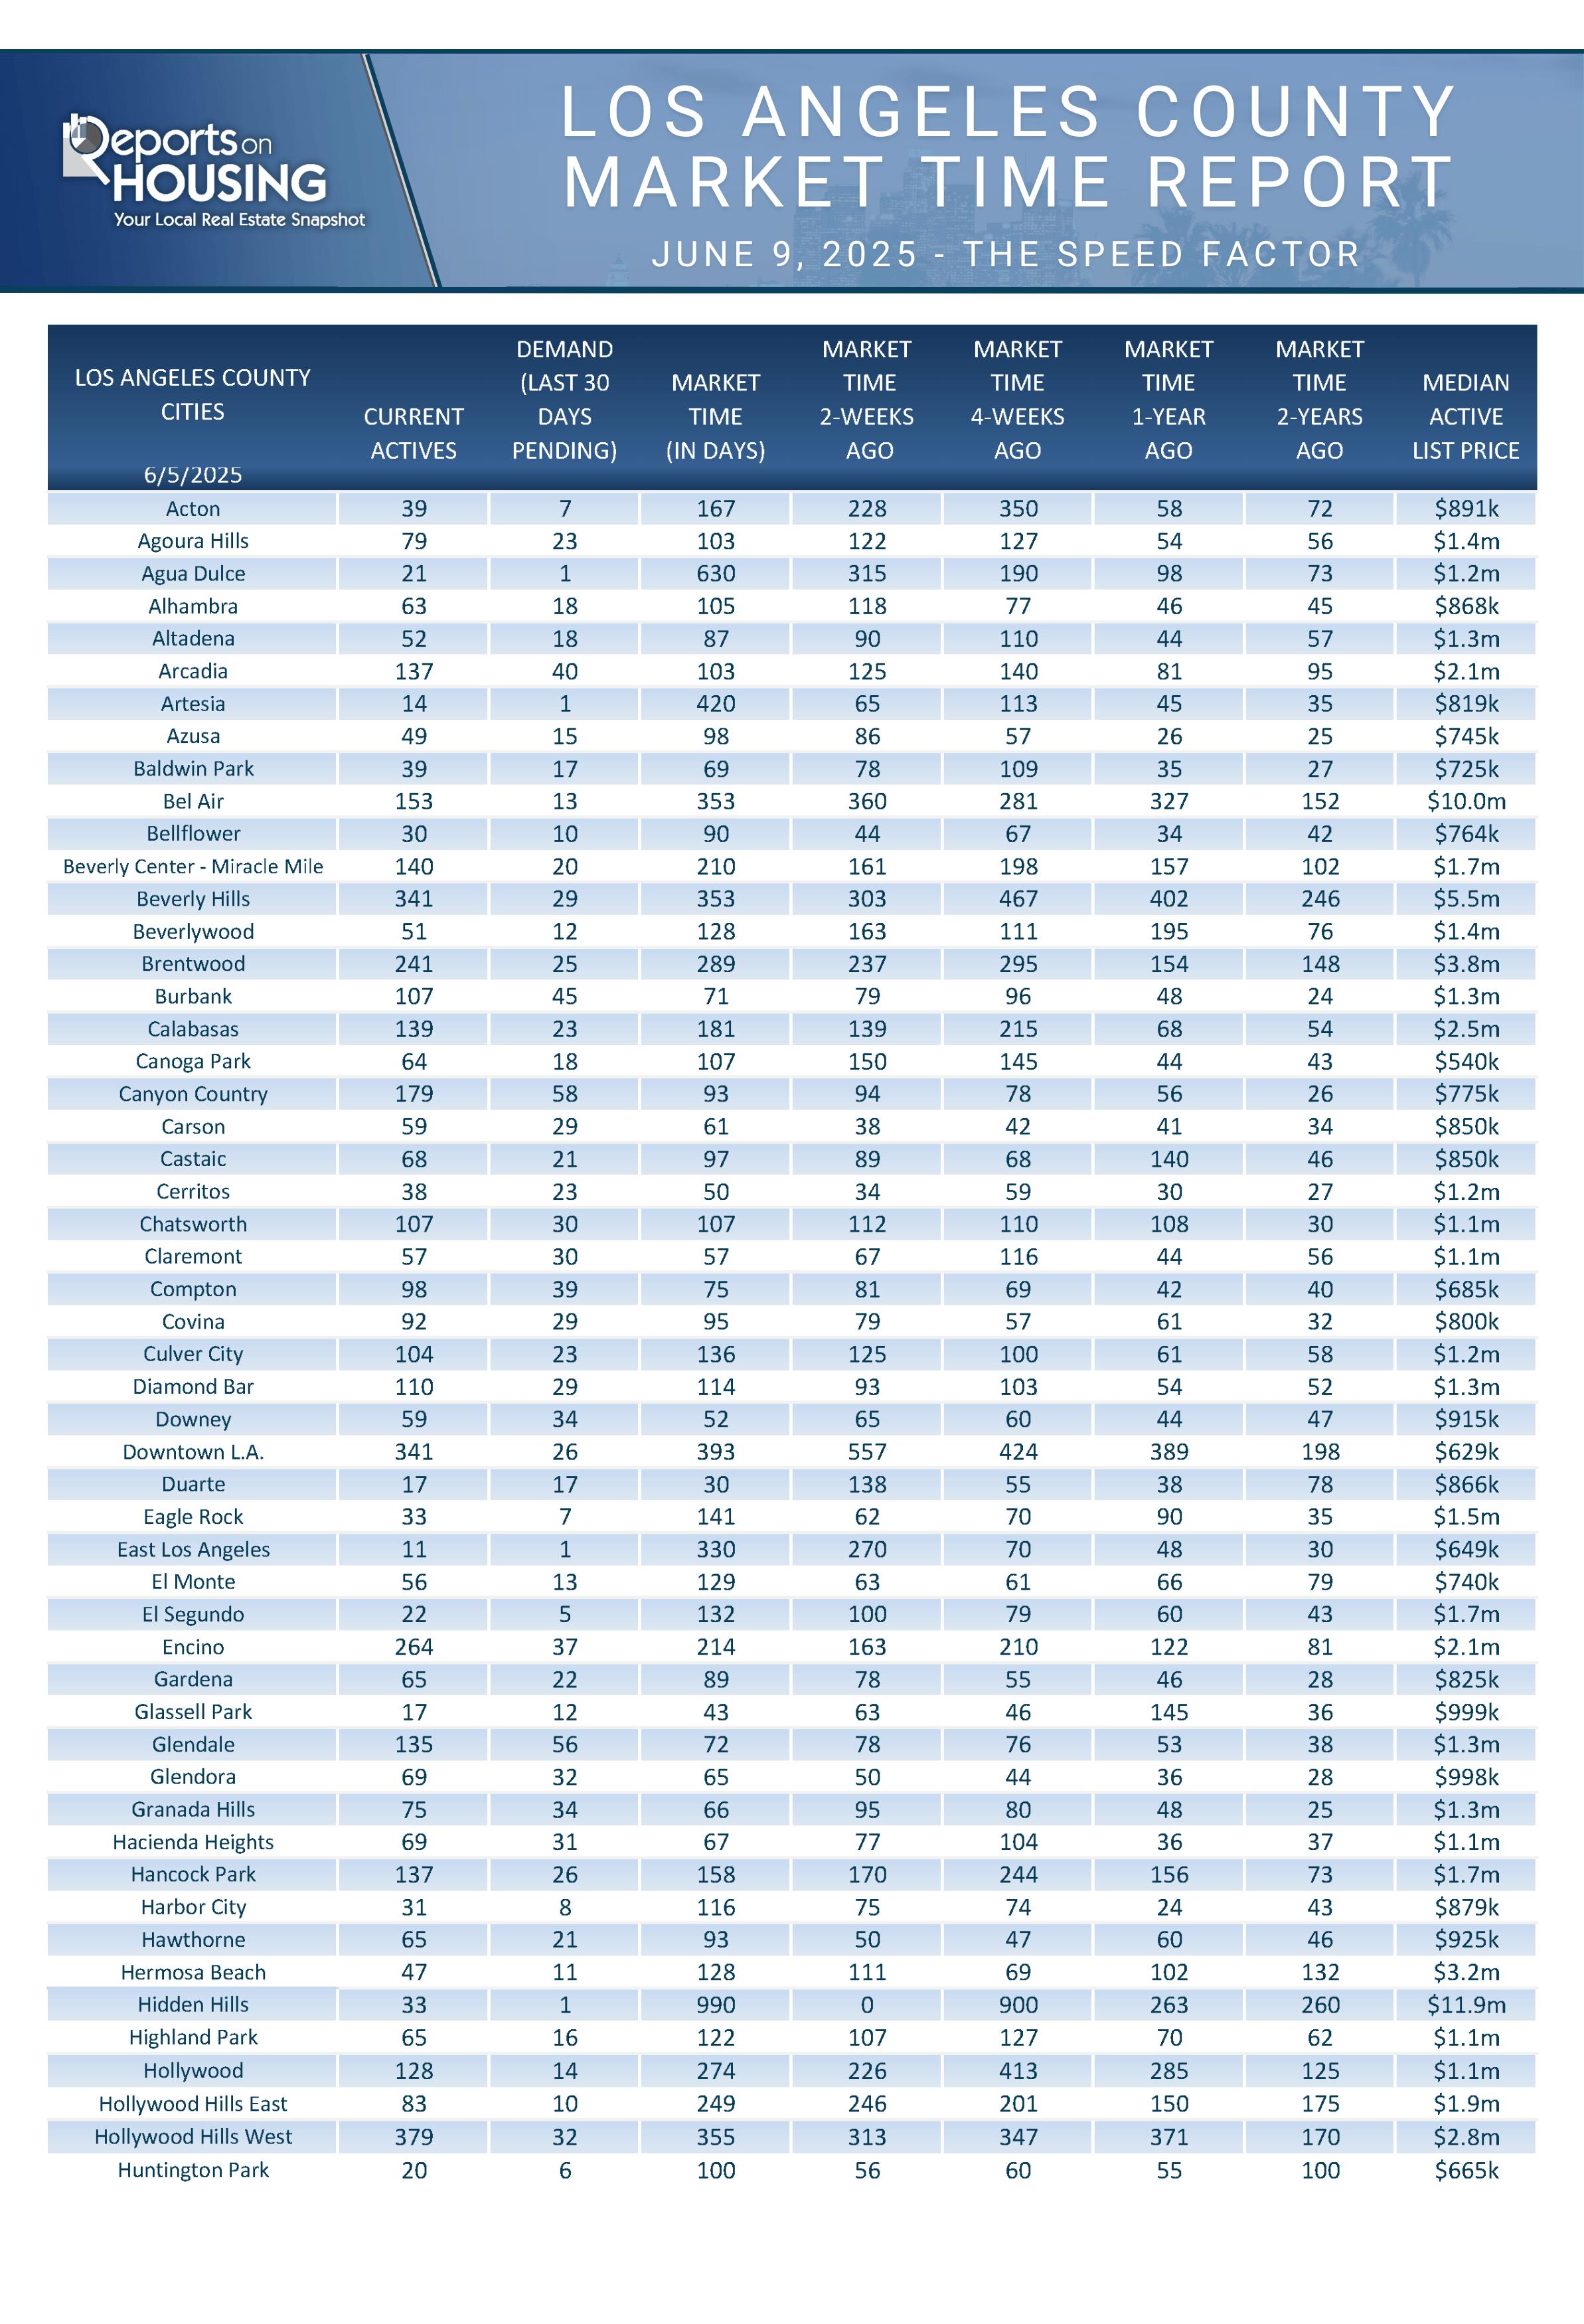
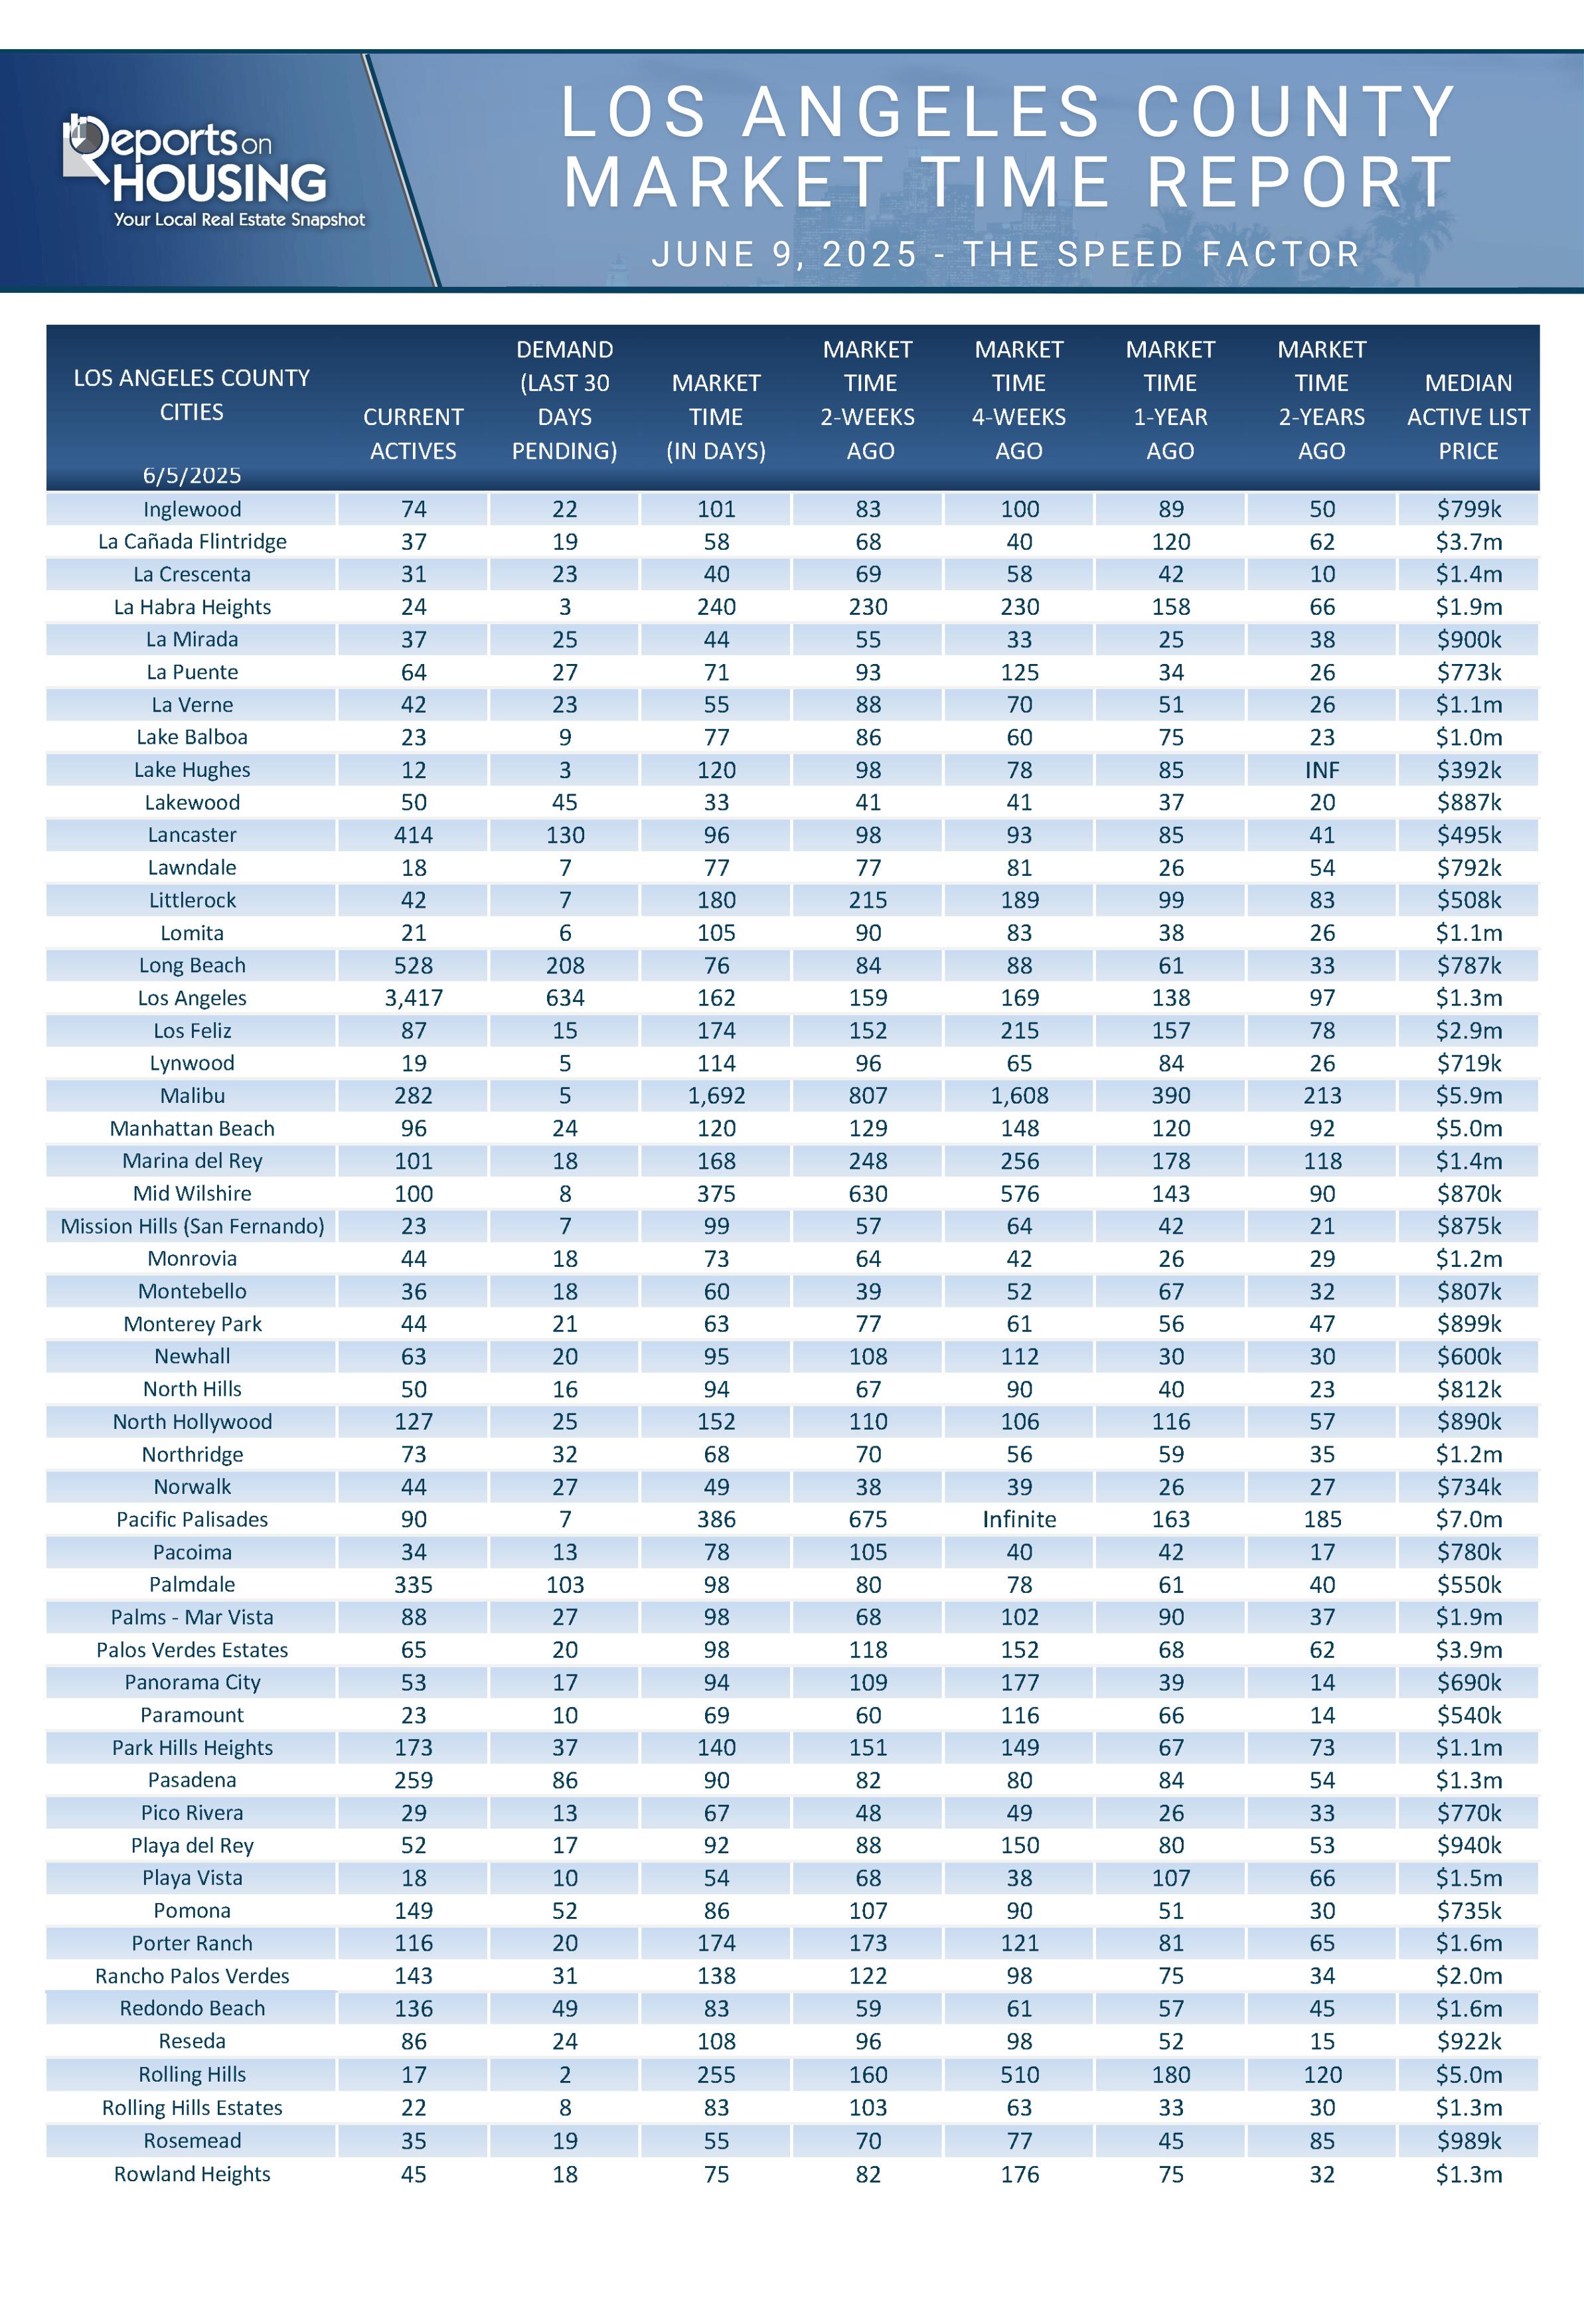
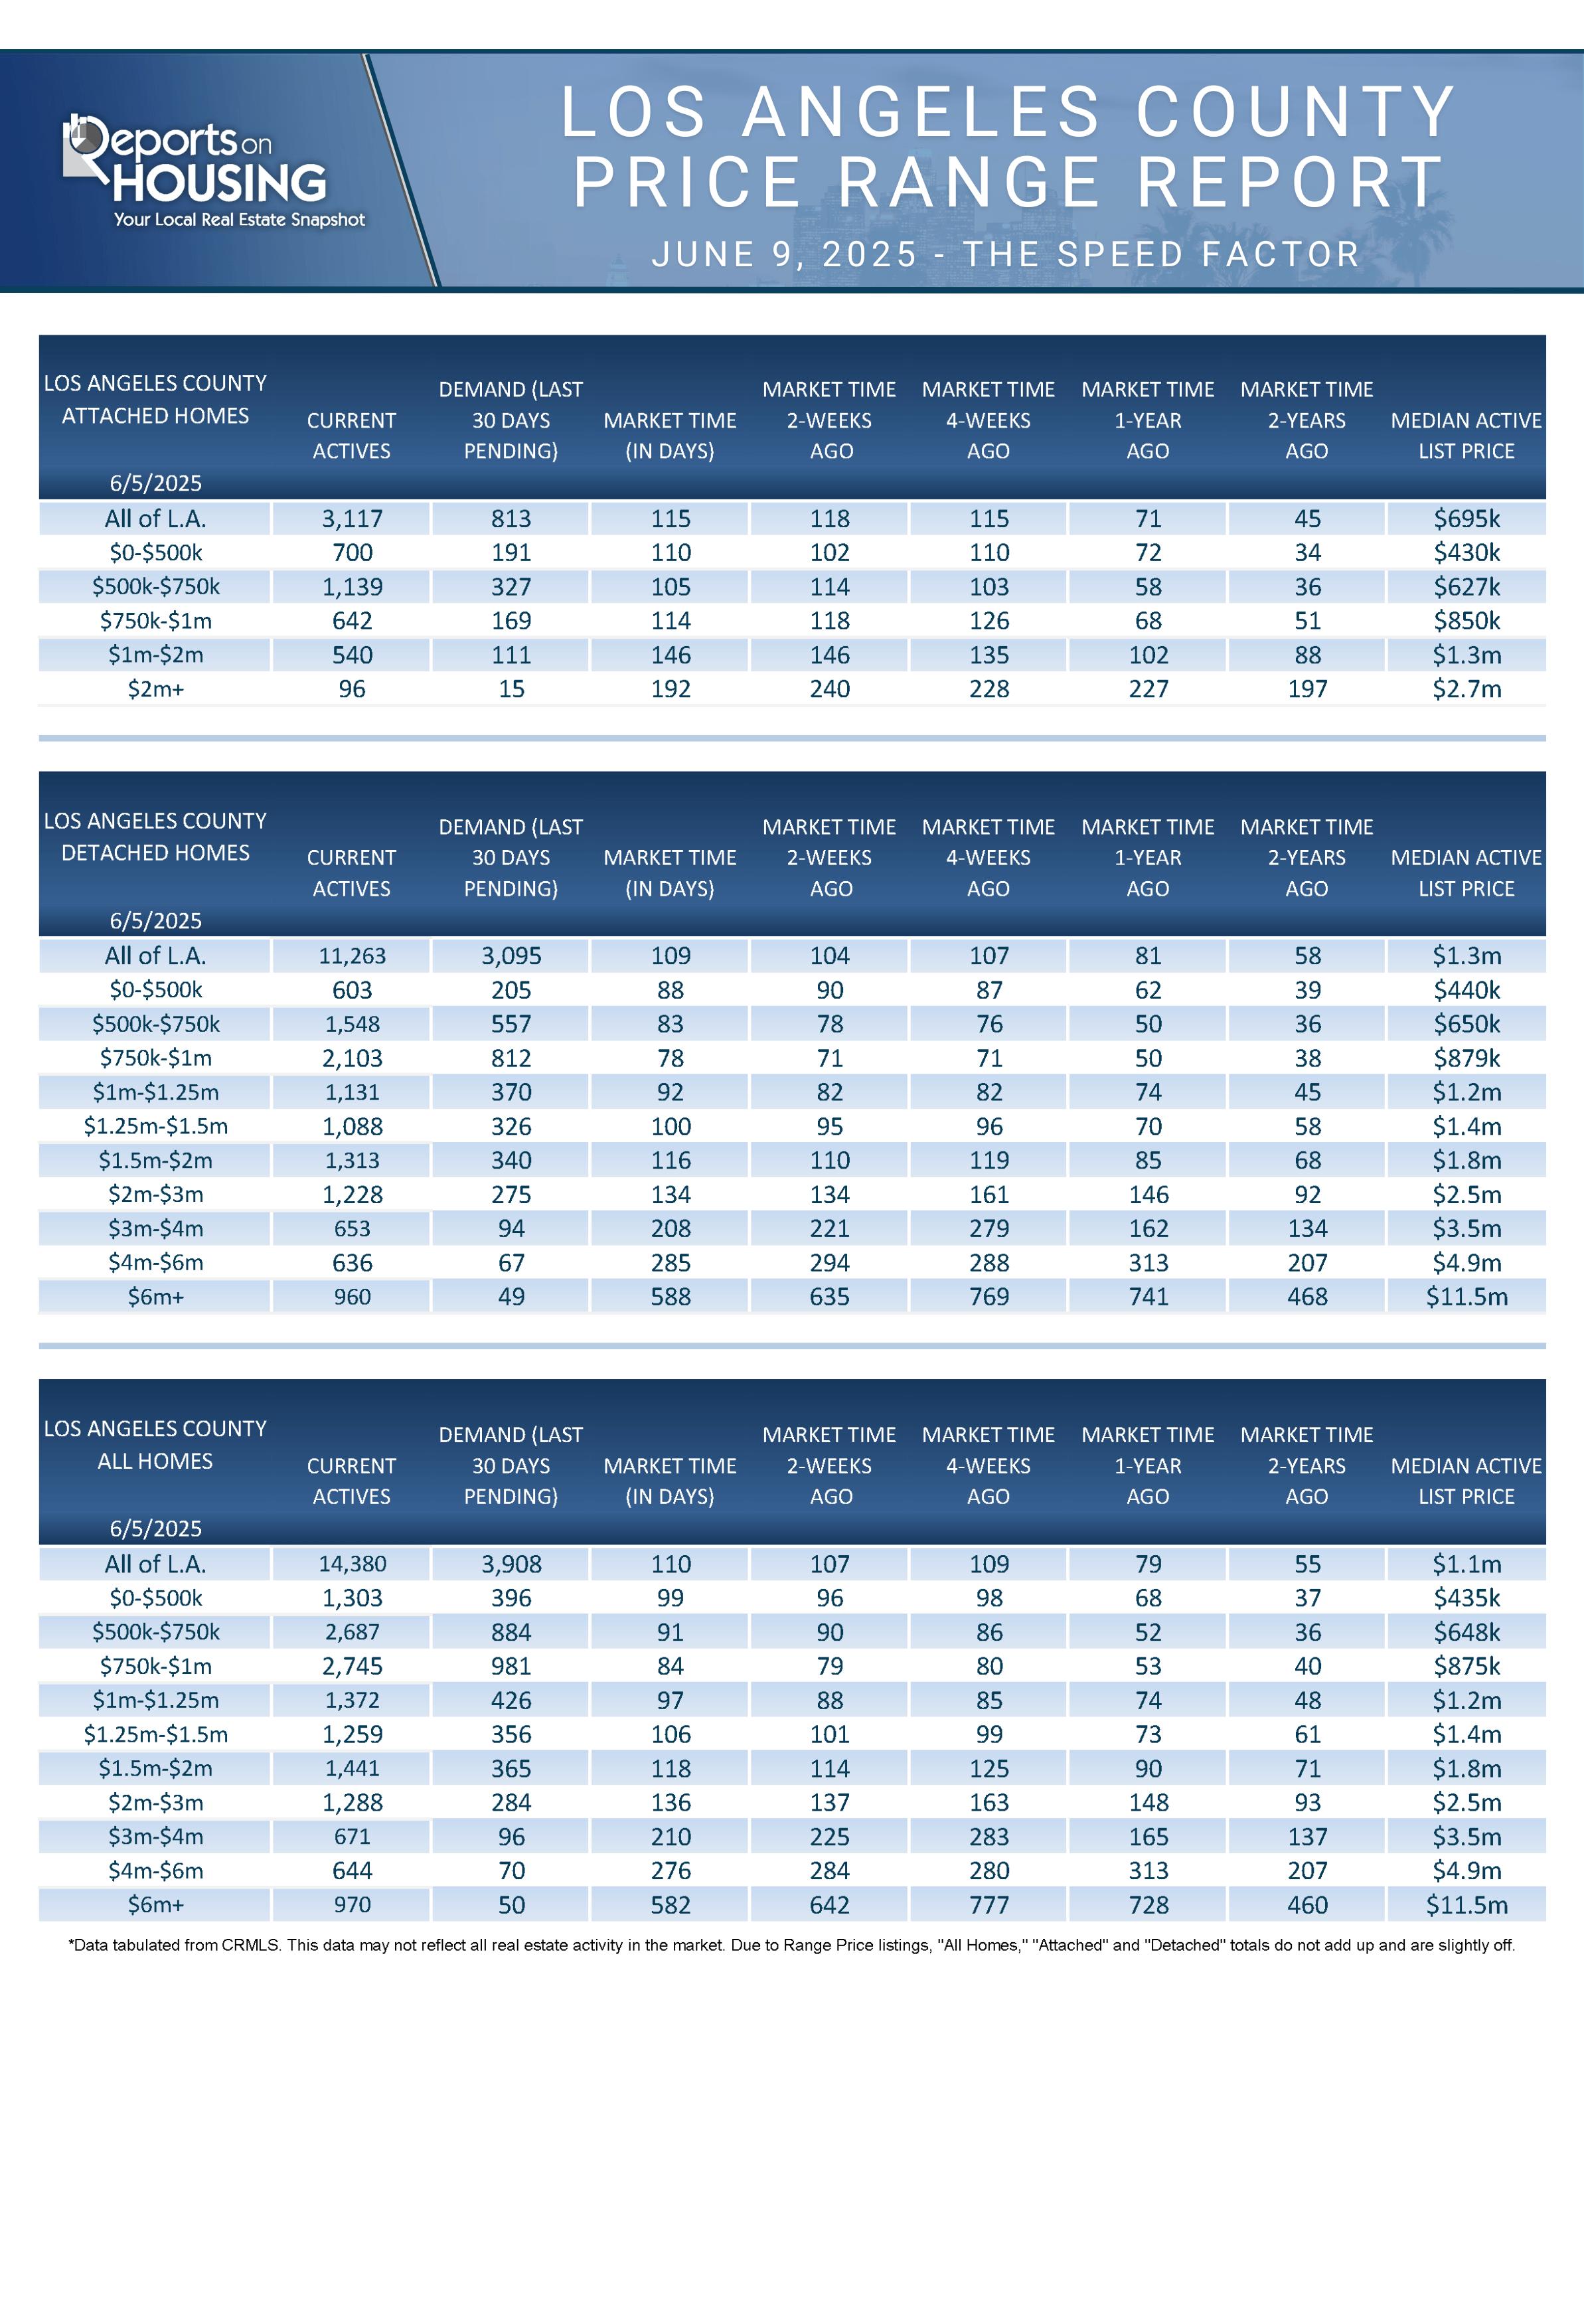
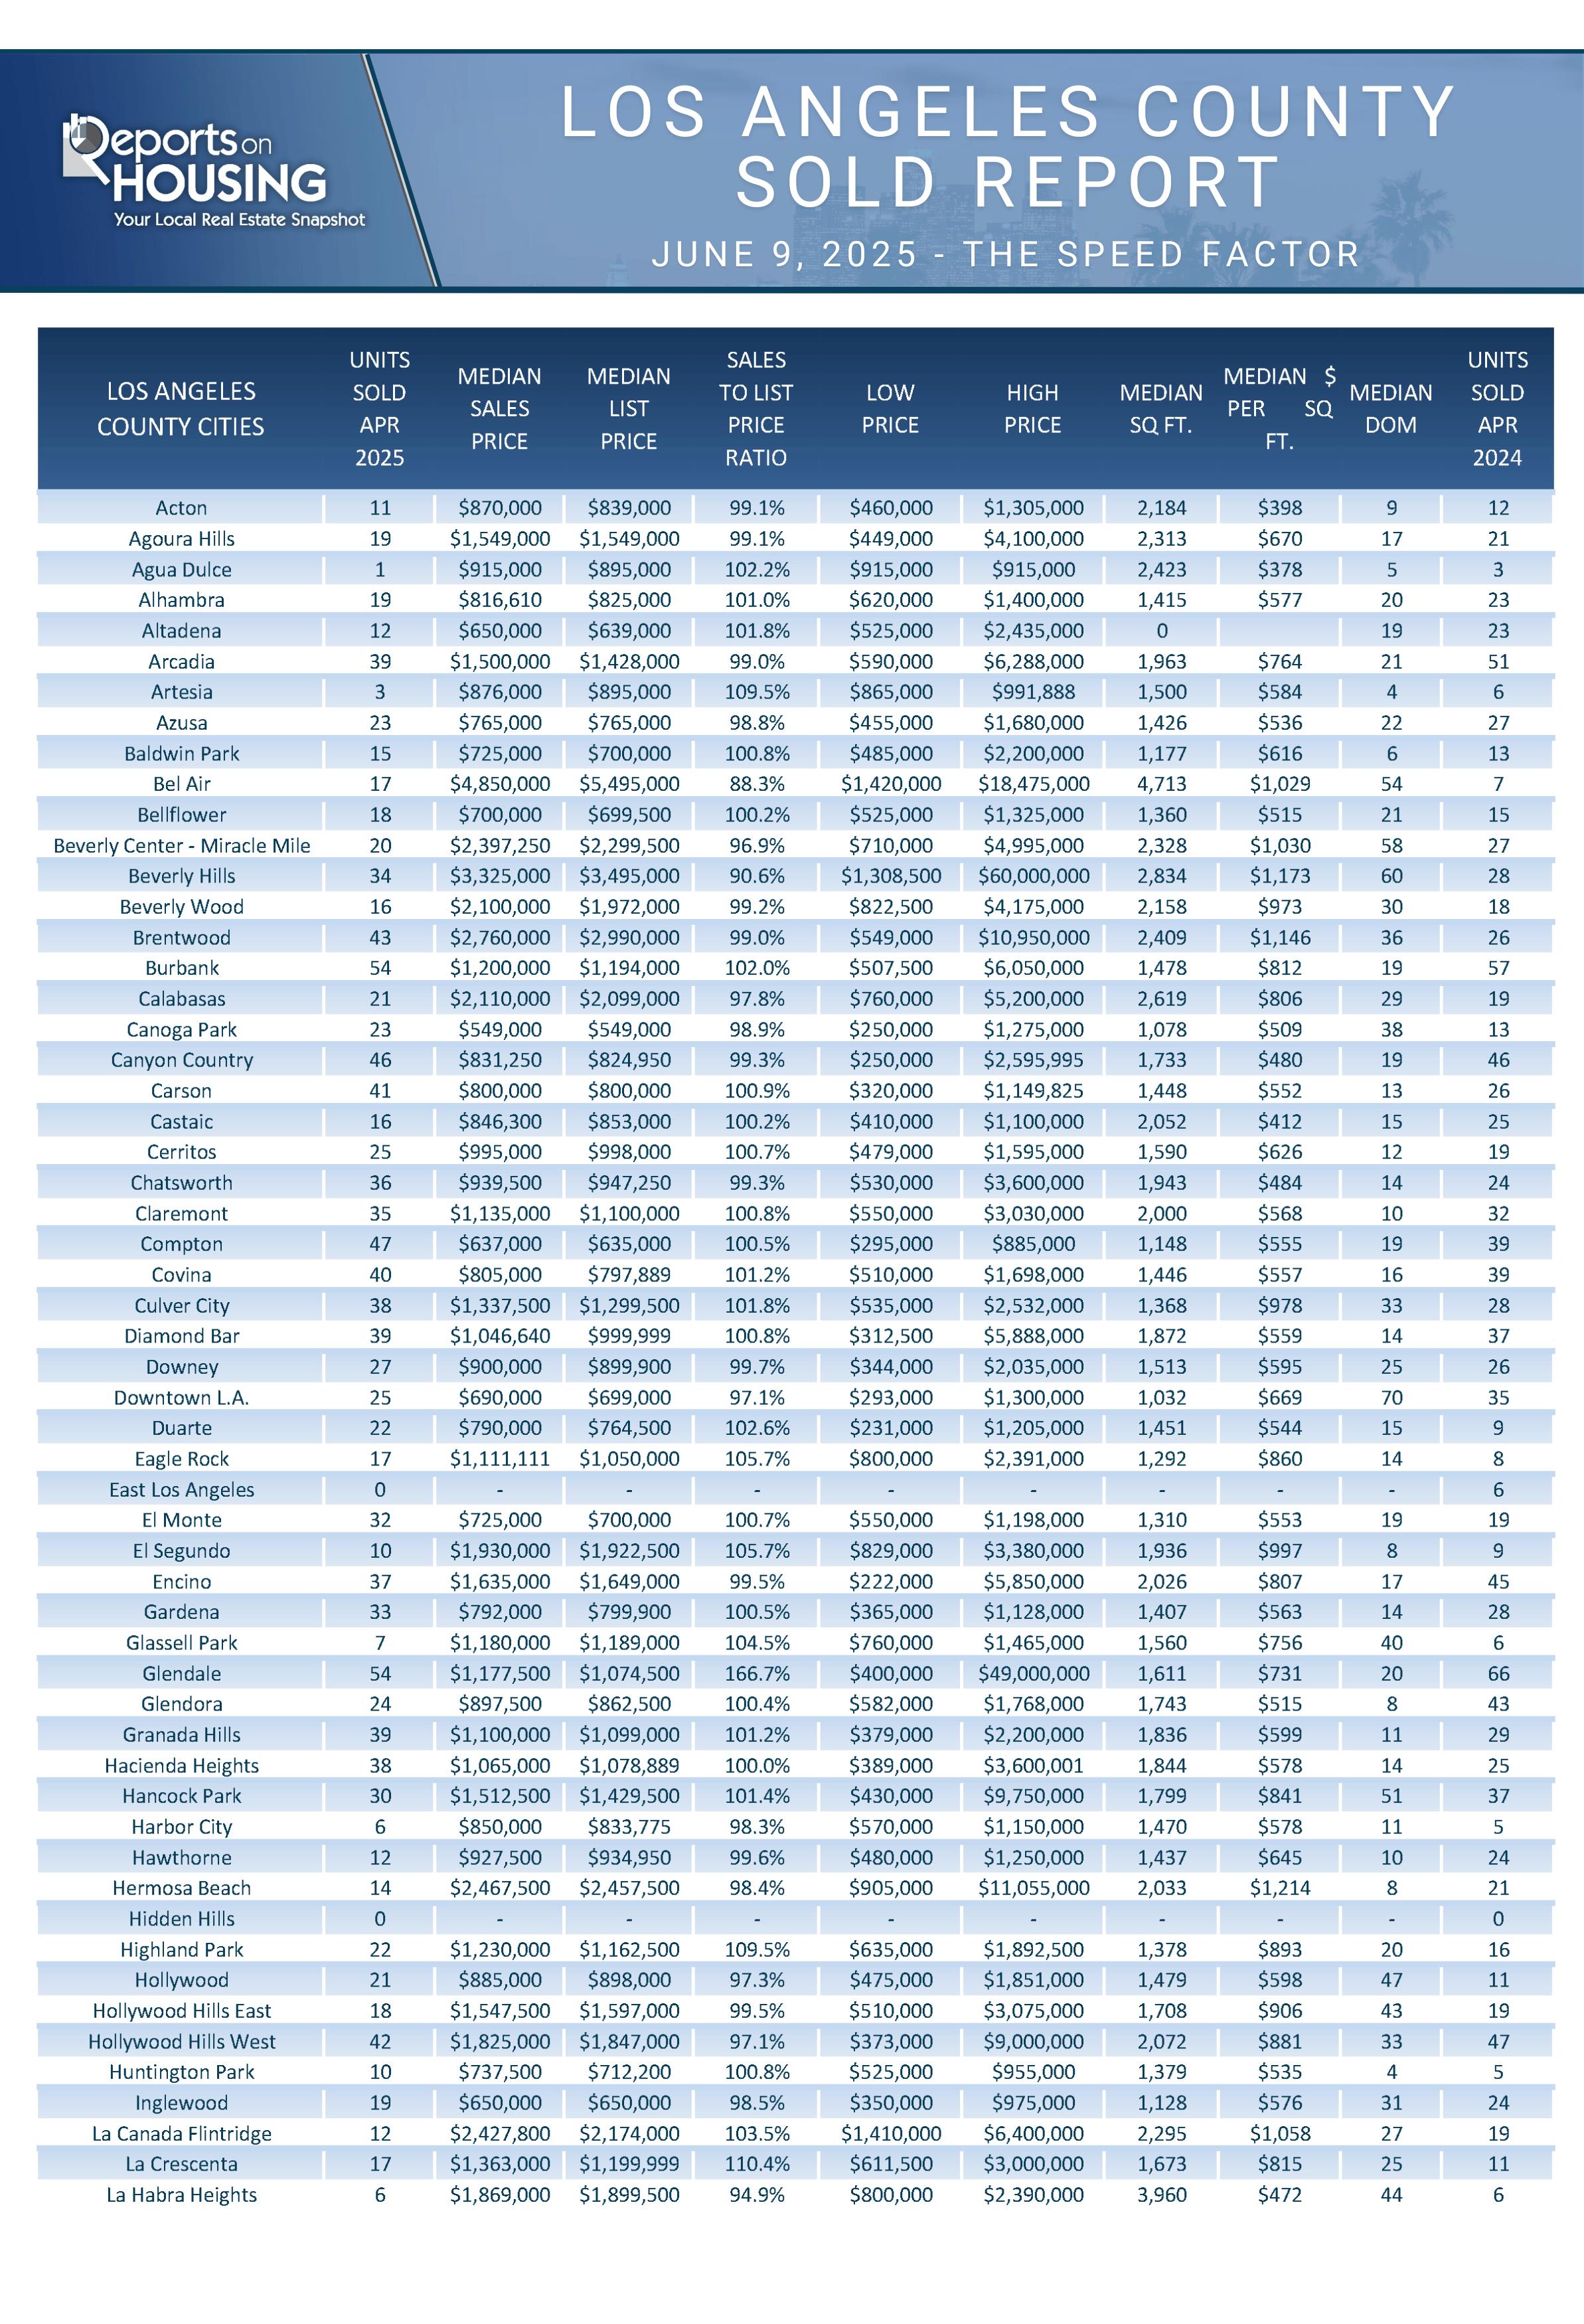
For years, one of the hottest price points has been detached homes priced between $750,000 and $1 million. While not as fast as last year’s 52-day Expected Market Time (the number of days it takes to sell all Los Angeles County listings at the current buying pace) or 37 days two years ago, the current speed for these homes is 78 days. A turnkey home between $750,000 and $1 million, nicely appointed, in excellent condition, and priced appropriately, will attract considerable attention and sell quickly, often with multiple offers.

For detached homes priced below $750,000, the Expected Market Time slows slightly and stands at 85 days, not as fast as it has been in the past couple of years. The market decelerates for all homes priced at $1 million or higher. For detached homes priced between $1 million and $1.5 million, the Expected Market Time is a little over 3 months. The higher the price, the longer it takes to sell. It takes 116 days to sell homes priced between $1.5 million and $2 million, and 134 days to sell homes priced between $2 million and $3 million. It takes eight months to sell homes priced between $3 million and $6 million, and 588 days, nearly 20 months, for homes priced over $6 million.
Overall, across all price ranges, detached homes take over three months from the time the FOR SALE sign is hammered in the yard to becoming a pending sale. It is taking a lot longer to sell due to the increased number of homeowners opting to sell this year compared to the last couple of years. The supply of detached homes has increased by 39% year-overyear, rising from 8,114 homes last year to 11,263 homes today. Yet, demand (a snapshot of the number of new pending sales over the prior month) has not changed significantly, rising from 3,022 last year to 3,095 today, an increase of 2% or 73 pending sales. The increased seller competition has resulted in the Expected Market Time rising from 81 days a year ago to 109 days today. It takes 28 days longer to sell this year. In comparison to two years ago, when the Expected
Market Time was at an extremely fast 58 days, the supply was 5,994, which is 47% fewer available homes. Again, demand was not much different, with slightly more pending sales at 3,116.
There is also a big difference between attached condominiums and townhomes. With rapidly increasing monthly association fees due to rising insurance costs and required balcony inspections in the state of California, the attached homes market is slower than the detached homes market. The fastest price ranges are condominiums and townhomes priced between $500,000 and $750,000, with an Expected Market Time of 105 days. The Expected Market Time rises to 110 days for attached homes priced below $500,000. It is 114 days for attached homes between $750,000 and $1 million. The Expected Market Time jumps to 146 days for homes priced between $1 million and $2 million, and slows to 192 days for luxury attached properties priced over $2 million, over six months.
Like detached homes, the market speed was considerably faster for condominiums and townhomes last year, and nearly instant two years ago. The inventory is up 58% compared to last year, and up 161% compared to 2023. Demand is down 2% compared to last year, down 18 pending sales, and up 1%, or 10 pending sales, compared to two years ago.
That is how the market has developed. Demand is not changing much from year to year, but more homeowners are participating and contributing to the build-up of today’s rising inventory. Rates exploded higher in 2022, rising from 3.25% in January to 7.37% in October 2022. At the start of 2022, 89% of Californians with a mortgage had a rate at or below 5%. 72% had a rate at or below 4%. As a result, in 2023, homeowners in Los Angeles County “hunkered down” in their homes, unwilling to move due to their underly ing, locked-in, low fixed-rate mortgage, and 33% fewer homeowners came on the market compared to the 3-year pre-pandemic average (2017-2019). In 2024, it dropped to 22% fewer. The additional sellers contributed to the supply of available homes, and inventory rose at a faster pace. This year, there are 12% fewer sellers. In matching more sellers with similar year-over-year demand, the active inventory has grown rapidly, and the market has downshifted considerably.
There are different speeds to the market, depending on price and whether a home is detached or attached. It is incumbent upon housing participants to consider the speed factor in approaching the market with the best strategy. A buyer looking to purchase a detached home at $850,000 will have a much different game plan than a buyer looking for a $1,600,000 home. Yet, it is also crucial for sellers to understand that as the supply of homes continues to grow and demand remains relatively the same, dropping slightly through the summer months, the Expected Market Time will also increase. The accumulation of extra homes means more seller competition.
To find success at ALL price points, it is vital that sellers carefully price their homes according to their Fair Market Values by meticulously scrutinizing recent comparable pending and closed sales. Overpriced homes result in wasted market time and prolonged periods on the market with little to no success, even in the hottest price ranges. Many sellers will fall victim to overpricing and will not achieve their objective until they correct their asking price with a reduction more aligned with their true Fair Market Value
Active Listings
The inventory again grew by 4% over the past couple of weeks.
The active listing inventory increased by 563 homes over the past two weeks, up 4%, and now stands at 14,380, its largest rise since March. It is the highest inventory level since November 2018 and the highest end-of-May reading since 2012, when it reached 14,406 homes. Summer has arrived, along with longer days and hotter temperatures. This is the season with a lot of distractions, from traveling to cooling off at the pool. Spring is the peak season for housing, characterized by the strongest demand. In summer, demand slowly drops due to all the distractions. Yet, many homeowners mistakenly believe that summer is the best time of the year to sell. As a result, the inventory continues to grow until it finds its peak between July and August. The peaks have occurred in the fall over the past couple of years due to high rates. This year will be no different. If rates climb above 7% during the second half of the year, the peak will come later. Yet, if rates drop, demand will rise and Los Angeles County will reach its normal summer peak.
Last year, the inventory was at 10,086 homes, 30% lower, or 4,294 fewer. The 3-year average before COVID (20172019) was 12,604 homes, 1,776 fewer, or 12% lower.
Homeowners continue to “hunker down” in their homes, unwilling to move due to their current underlying, locked-in, low fixed-rate mortgage. This trend has been easing from the lows established in 2023. Through May, 35,662 homes were placed on the market in Los Angeles County, 4,888 fewer than the 3-year average before COVID (2017-2019), 12% less. In 2024, only 30,155 homes entered the market, and in 2023, it was only 25,495. More sellers are opting to sell in 2025.

Demand

Demand increased slightly in the past couple of weeks.
Demand, a snapshot of the number of new pending sales over the prior month, increased from 3,885 to 3,908 in the past couple of weeks, representing a 23-pending-sale rise, or 1%. It appeared as if demand reached a peak in April at 3,857 pending sales, but has now risen to 3,908, an increase of 51 pending sales or 1%. This is the latest peak since the midJune peaks of 2016 and 2018. The Mortgage Bankers Association of America (MBA) has a purchase application index that has been higher than last year for 18 straight weeks. It has not yet translated into extra demand due to negative sentiment across the U.S. stemming from the tariff announcement a couple of months ago. While there may have been a “tariff effect” on buyer demand, it has waned, and buyers are now turning their attention back to housing. It will be essential to watch the direction of rates from here. Any dramatic improvement in mortgage rates will immediately impact buyer demand. Similarly, a jump in rates could squash potential demand.


Last year, demand reached 3,853, with 55 fewer pending sales, representing 1% less. The 3-year average before COVID (2017-2019) was 5,908 pending sales, 51% more than today, or an additional 2,000
As the Federal Reserve has indicated, watching all economic releases for signs of slowing is essential. That is the only path to lower mortgage rates at this time. These releases can cause mortgage rates to move higher or lower, depending on how they compare to market expectations. This week, the Producer Price Index (PPI) and the Consumer Price Index (CPI) will be released, two key indicators of inflation. Next week, the Federal Reserve will meet and conduct a press conference to announce its decision on the Federal Funds rate, ultimately revealing its appetite to cut rates in the near future and into 2025.
Expected Market Time
The Expected Market Time increased to its highest level since mid-January.
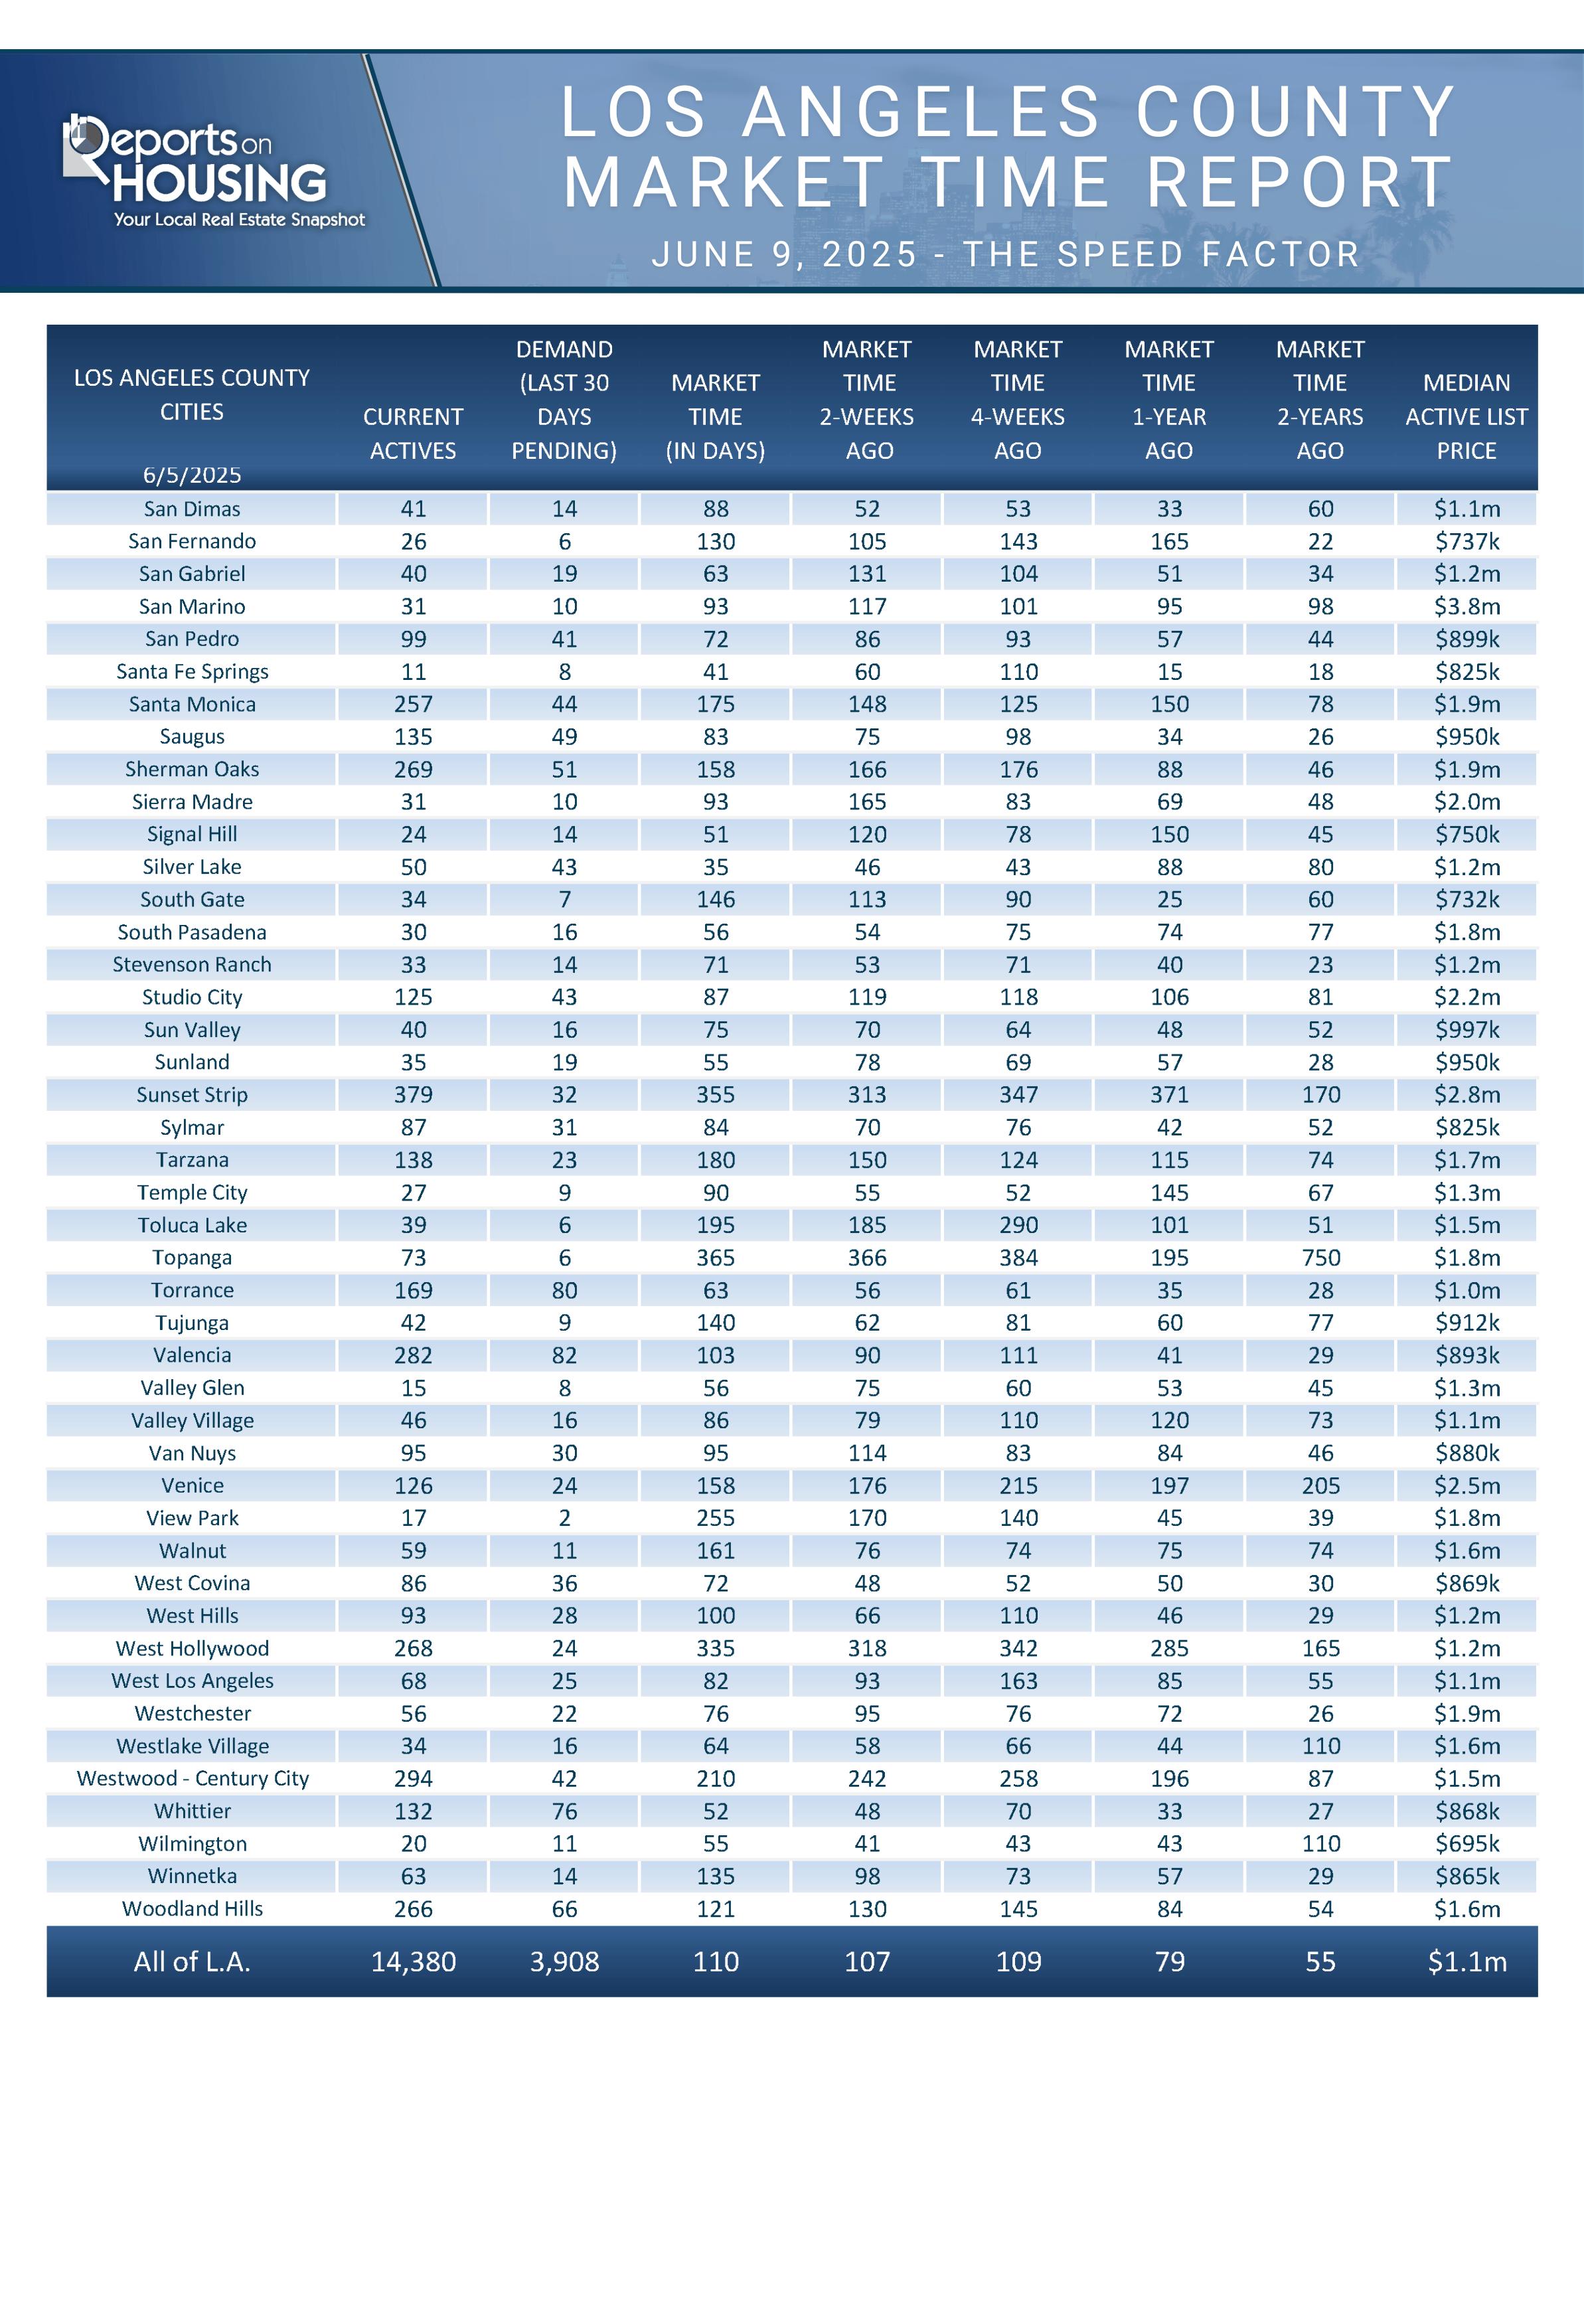
With the supply of available homes rising by 563 homes, up 4%, and demand increasing by 23 pending sales, up 1%, the Expected Market Time (the number of days it takes to sell all Los Angeles County listings at the current buying pace) increased from 107 to 110 days in the past couple of weeks, its highest level since mid-January.
Last year, it was 79 days, substantially faster than today. The 3-year average before COVID was 65 days, which is also much quicker than today.
The Expected Market Time for condominiums and townhomes decreased from 118 days to 115 days in the past two weeks. It was at 71 days last year. For detached homes, the Expected Market Time increased from 104 to 109 days. It was 81 days last year. The detached homes market is stronger than the attached home market.


Luxury End
The luxury market continued to improve.
Over the past couple of weeks, the luxury inventory of homes priced above $2 million (the top 10% of the Los Angeles County housing market) increased from 3,498 to 3,573 homes, a rise of 75 homes, or 2%, its highest level since tracking began in 2012. Luxury demand increased by 22 pending sales, up 5%, and now sits at 500 pending sales, its highest level since May 2022. With demand rising faster than supply, the Expected Market Time for luxury homes priced above $2 million decreased from 220 to 214 days. The luxury market typically downshifts and cools a bit during the Summer Market. Year over year, the active luxury listing inventory has increased by 660 homes, or 23%, and luxury demand has risen by 100 pending sales, or 25%. Last year’s Expected Market Time was 218 days, similar to today.
In the past two weeks, the Expected Market Time for homes priced between $2 million and $3 million decreased from 137 to 136 days. The Expected Market Time for homes priced between $3 million and $4 million decreased from 284 to 210 days. The Expected Market Time for homes priced between $4 million and $8 million decreased from 284 to 276 days. The Expected Market Time for homes priced above $8 million decreased from 783 to 737 days. At 737 days, a seller would be looking at placing their home into escrow around June 2027