remsenburg
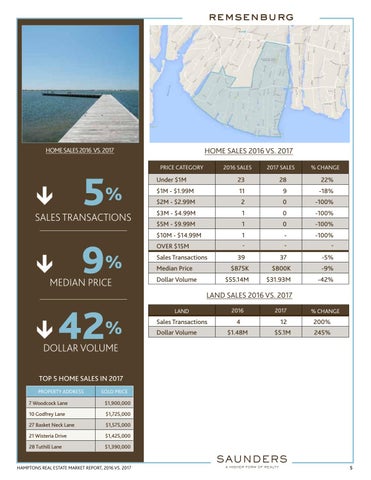
HOME SALES 2016 VS. 2017
HOME SALES 2016 VS. 2017 PRICE CATEGORY
5
%
SALES TRANSACTIONS
9
2016 SALES
MEDIAN PRICE
% CHANGE
Under $1M
23
28
22%
$1M - $1.99M
11
9
-18%
$2M - $2.99M
2
0
-100%
$3M - $4.99M
1
0
-100%
$5M - $9.99M
1
0
-100%
$10M - $14.99M
1 -
-
-100% -
39
37
-5%
OVER $15M
%
2017 SALES
Sales Transactions Median Price Dollar Volume
$875K
$800K
-9%
$55.14M
$31.93M
-42%
LAND SALES 2016 VS. 2017
42%
LAND
2016
Sales Transactions
4
12
200%
$1.48M
$5.1M
245%
Dollar Volume
2017
% CHANGE
DOLLAR VOLUME
TOP 5 HOME SALES IN 2017 PROPERTY ADDRESS
SOLD PRICE
7 Woodcock Lane
$1,900,000
10 Godfrey Lane
$1,725,000
27 Basket Neck Lane
$1,575,000
21 Wisteria Drive
$1,425,000
28 Tuthill Lane
$1,390,000
HAMPTONS REAL ESTATE MARKET REPORT, 2016 VS. 2017
5