MEASURING SUSTAINABILITY THROUGH TRADE

Dr. Rebecca Harding, CEO Coriolis Technologies
Research initiated and funded by Saskia Bricmont and the Greens/EFA Group
TECHNOLOGIES 1 TECHNOLOGIES
2

Dr. Rebecca Harding, CEO Coriolis Technologies
Research initiated and funded by Saskia Bricmont and the Greens/EFA Group
2
What happened to the ambitions of COP26? In December 2021 analysts and commentators alike were talking about 2022 as though it was likely to be the most important year for sustainability since the Paris Climate Accord. Policy makers set ambitious net zero goals, there were further bans on deforestation and targets to reduce the amount of methane produced by cattle.
Alongside this, regulators in the EU in particular introduced stringent mandatory reporting requirements in the form of the Sustainability Financial Disclosures Regulation1 and the EU taxonomy,2 as well as in the form of the imminent Supply Chain Act,3 and the “Ecodesign for sustainability” regulations.4 All of these measures will be introduced during the course of 2022 and by 2023/4 there will be requirements to report on both the “E” (environment) and “S” (social) aspects of ESG (Environment, Social and Governance) criteria. The Security and Exchange Commission has similarly announced its intention to make mandatory sustainability reporting.5 It opens an avenue for further collaboration between the EU and the US under the Trade and Tech Council, some working groups addressing “climate and clean tech” and “global trade challenges” issues.
Even though the crisis in Ukraine initially diverted attention away from this focus on sustainability, the EU’s reliance on Russia for oil and gas in particular has put a spotlight on the need to source energy from alternative suppliers as well as from alternative means. The requirement to limit financial transactions with Russia because of sanctions are now affecting the types of goods traded as well as individuals and entities.6 As a result of all this, the “G” (governance) in ESG has increased in importance as well.
Yet the “how” of all of this remains vague. At present, the problem for financial services organisations and for businesses alike is the same: what to measure is clear but exactly how to do this in a consistent and standardised way is not. There is a heavy reliance on self-reporting at a company level which means that the whole move towards making business and trade comply with sustainability standards will be at risk from incomparable, incomplete or simply missing data. Thus, in order to avoid inevitable accusations of “Greenwash” as well as the compliance quagmire that was experienced with Anti-Money Laundering and Know Your Client legislation, it is imperative that the definition of how to measure sustainability in a
1. https://ec.europa.eu/info/business-economy-euro/banking-and-finance/sustainable-finance/sustainability-related-disclosure-financial-services-sector_en
Commission: EU
https://ec.europa.eu/info/business-economy-euro/banking-and-finance/sustainable-finance/eu-taxonomy-sustainable-activi ties_en The EU
in June 2020: https://eur-lex.europa.eu/legal-content/EN/TXT/?uri=CELEX:32020R0852
3. https://ec.europa.eu/commission/presscorner/detail/en/ip_22_1145
4. https://ec.europa.eu/info/energy-climate-change-environment/standards-tools-and-labels/products-labelling-rules-and-requirements/sustainable-products/ecodesign-sustainable-products_
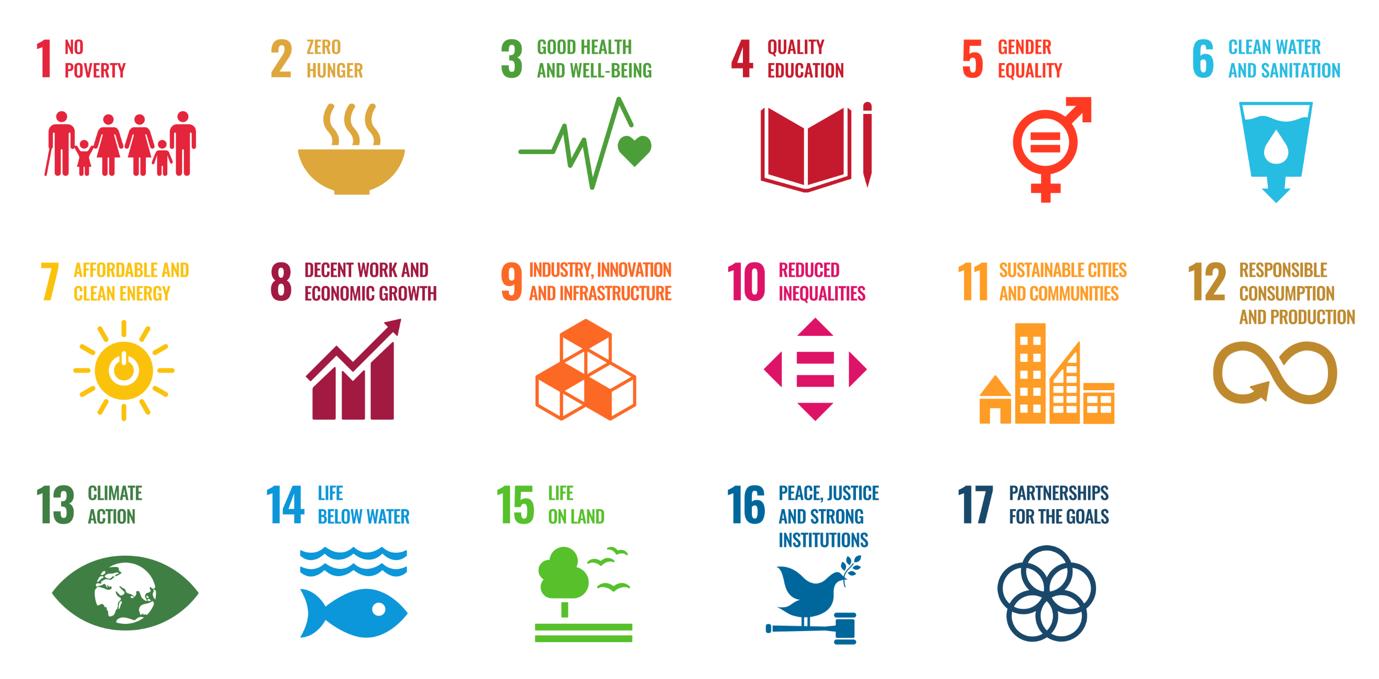
Source: United Nations Sustainable Development Communications Materials13
standardised way has itself become a regulatory prerequisite.7 This latter issue is a well-known weakness of current practice – of some 115 of the largest banks in the euro area, none is currrently adequately reporting their exposure to climate-related and environmental risks, according to the ECB.8
In the current climate, where there is an imperative for the EU in particular and the West in general to move away from its reliance on fossil fuels for geopolitical as well as climate reasons, the imperative to report ESG in all its guises cannot be understated. This is particularly relevant to trade, as highlighted in the European Council conclusions which point to the critical role that trade plays in the implementation of the 2030 agenda. It argues that open and rulesbased trade contributes to the achieving the SDGs and focuses in particular on trade agreements as a mechanism for promoting socially and environmentally sustainable development and inclusive and sustainable trade entirely consistent with the goals of the World Trade Organsiation.9
This paper is an initial contribution to the process of creating an automated and consistent mechanism for measuring sustainability. It builds on the approach taken by the International Chamber of Commerce’s
joint position paper on measuring sustainable trade10 which puts forward a proposal to use the Sustainable Development Goals (SDGs) as a framework for the approach to financial reporting. This is a useful framework, yet there is little guidance on exactly what needs to be measured, how it aligns with the SDGs and most importantly of all, the base unit of measurement. It looks first at the challenges of measurement and then looks at how to measure trade flows between countries, within the EU and between the EU and the rest of the world in a consistent way using the match of product HS codes (used in international customs and excise records) to Sustainable Development Goals as illustrated in the 17 SDG icons (Figure 1).
The approach taken here is developed from the United Nations ESCAP matching of SDGs to the HS codes first published in 201911 and the subsequently released “R” code that provides a schema for matching SDGs to Non Tariff Measures (NTMs).12 The research conducted by the UN ESCAP both highlights the materiality of trade to the broader sustainability agenda, but similarly provides an excellent baseline for improving the matching. In particular, Coriolis Technologies has taken this paper and added to the number of products, as represented by their HS code, by undertaking an analysis for each product not covered in the paper,
and using Python code to conduct a global discourse analysis of how these products are reported in relation to the key words contained in the SDGs positively or negatively. This approach maintains the objectivity of matching SDGs to HS codes and means that around 90% of traded products are now covered in this approach which is significantly more than the coverage in the original concordance. The remaining proportion of trade is classified as neutral and, for the sake of clarity, omitted from this paper.
The approach reveals some interesting findings.
First, trade generally across the world creates more negative contributions to SDGs than it does positive ones. On a scale of -1 to +1 where -1 is all trade makes negative contributions, zero is neutral and +1 is all trade makes positive contributions, world trade comes out at a score of -0.58. In other words, the balance between positive and negative contributions to SDGs is tipped predominantly towards negative SDGs: some 80% of the value of world trade is unsustainable in this sense. Emerging economies on a simple match like this are slightly more “sustainable” although still largely negative, simply because of the fewer consumer products they trade. The EU, and nations within the EU, perform particularly badly: intra EU trade scores -0.68 and extra EU trade scores -0.71 due to the heavy reliance on fossil fuels, automotives, electronics, machinery and components and aerospace in the trade profile of the region.
Second, if we break down the SDGs into their “Environmental”, “Social” and “Governance” elements, again using the trade profile of a country as the proxy, then the picture shows potentially where the macro policy levers may be. For example, world trade scores -0.73 on its environmental balance against SDGs, and -0.91 for its social balance against SDGs. However on Governance, measured largely from positive
contributions to decent work and economic growth, and good health and well-being, the score is a positive one of 0.43. In other words, the world of trade and trade finance, alongside regulators, has put in place the governance structures to minimise economic risks in the form of employment, economic growth and provisions of basic health, but the price for the environment and for social equality and justice is over-whelmingly high. Particularly high negative contributions of exports and imports are attributable to SDGs 12, 16, 7, 11 and 6 from the icons above suggesting that trade policy can do significantly more to promote the basic human rights of trade as represented by the commitment to fair and open trade to promote sustainable cities and communities, responsible consumption, and to shore up the institutions of trade that help peace and justice.
Creating a sustainability trade profile like this is a useful conceptual first step along the way to creating a fully-fledged country ESG risk trade profile. HS codes in themselves are not products, they are product categories and matching them beyond the category to sector and activity levels so that the EU taxonomy’s activity-based approach is potentially over-aggregating in the interests of creating a stylised picture. The risks of false positives, or false negatives at a company level using this approach needs to be balanced against the imperative for finding a quick and simple measurement that creates an effective call to action. This is what we hope to have achieved here and the paper concludes with some areas where further research would be helpful in building out from this starting point.
One simple premise must prevail if we are to measure ESG properly and in a standard way: we must agree on the base unit of measurement. Since all countries, and all commercial entities, have one thing in common – they trade in goods or services – it stands to reason that those products are appropriate as that base unit.

Products are grouped for customs and excise purposes in international trade into HS Codes. This represents a degree of imprecision from the outset, but it has the advantage of being the principle classification system for export controls, dual use goods, banned products (such as those associated with illegal logging), and attribution to low, medium or high carbon emissions.14 In short, in the absence of any other base unit, the advantage of the HS code is that it links what the company produces to its trade flow (measured through bills of lading) to the country-level regulatory and tariff/non tariff measures to support ESG, and to the country’s trade profile.15
The next step is to use a “best fit” definition of ESG. Since there is a general acceptance globally that the Sustainable Development Goals are the agreed policy targets internationally, and since these apply equally in all countries, it similarly appears logical to match the
14 https://stats.oecd.org/Index.aspx?DataSetCode=TRADEENV_IND9
product (or indeed the service) to those SDGs. The concept of the SDG is important because the regulations that are being developed are all based on these in one form or another – it is an agreed, standardised starting point since both the definition of a product and of the SDGs are already agreed.
The data highlighted in the country scoring illustrated here does just that. It looks at products only in the first instance and uses the country’s product-based profile of trade using refined United Nations Comtrade data16 at a six digit HS code level.17 As discussed above, it matches the country’s imports and exports to the 17 SDGs using an accepeted methodology first crafted by the UN ESCAP18 in terms of their negative or positive contribution. The approach then weights them for the value of trade in each SDG from the trade profile of the country concerned. Because it uses HS codes at six digit level it is able to distinguish between, for example, a diesel car (870332) and an electric car (870380) or, indeed, a hybrid car (870360).
The method is developing an existing approach associated with tariff and non-tariff measures since these have been already subjected to policy scrutiny
Note – for ease of illustration, this paper focuses on HS codes but Coriolis Technologies has also mapped the service equivalent, EBOPS codes, to SDGs as well
and country trade flow (imports and exports) to plug gaps in the trade data for under-reporting nations or sectors. The average of two flows is taken and
refinement is a bilateral mirroring by
in
of the most “trustworthy” dataset. Trustwortiness is derived from reporting regularity and consistency over time.
Harmonised Standard code is the code assigned to a
for customs and excise purposes (www.un.org/comtrade)
around the world. The association with tariff and nontariff measures is an indirect way of creating a standard since this has been formed over the years by custom and practice.
There are limitations to the approach of course. For example, HS codes themselves are product categories for customs and excise purposes and not products. At present, because of their acceptance as the means for structuring export controls, tariffs and non-tariff measures, this is the best possible approach that can be taken. As more of trade becomes digitally recorded, for example through GS1 codes, it will be possible to map products to their SDGs and their Scope 1-3 carbon emissions more precisely.19
A second weakness is the capacity to match this through the supply chain automatically. This leads to some products counting against several SDGs, the total annual values are higher than the value of trade in a country. These aggregated totals are therefore crude totals rather than a “trade in (sustainable) value added” amount either negatively or positively but serve to emphasise that there are vasts amounts of money that can be attributed to negative contributions. It also means that the scope to distinguish between resource utilisation for the same product in different countries is limited: for example, a fruit such as a strawberry produced in the Middle East requires more water and energy to produce than in its indigenous environment. Thus, an important development of this work is now being undertaking to use input-output tables aggregated HS codes to NACE code and therefore sector based. This will provide a better picture of the Trade in Sustainable Value Added and supply chain scores than is currently possible to do.
For this paper, and for simplicity of comparison, the score is normalised on a ranking of -1 (where everything is negative) to +1 where everything is positive and little reference is made to the values at this stage except for illustrative reasons. A score of 0 means that trade is neither negative nor positive.
A second step, after this preliminary mapping is to take each SDG and break it down into the “Environmental”, “Social” and “Governance” components. Doing this adds necessary extra granularity to the process since the SDGs themselves are vaguely constituted. It also has the advantage of adding policy levers to each SDG – for example if a country scores badly on the “S” component of “no poverty”, then it may need to look at its labour markets and inclusive work.
One final methodological note is worth making here. The EU taxonomy is defined in terms of sector and activity codes and their capacity to “Make a Significant Difference” or “Do No Significant Harm.” However, not all sectors and activities have been mapped over to the six targets of the EU taxonomy (climate adaption, climate mitigation, sustainable use and protection of marine and waterways, transition to the circular economy, pollution prevention and control, and protecting and preserving biodiversity). While this mapping remains partial, it has not been possible to look at trade at a country-level in relation to the EU taxonomy – the results have not suggested sufficient robustness as they are unrepresentative of all trade. Once more of these categories are filled, this problem can be overcome.
19 One approach would be to use GS1 barcodes here: https://www.gs1uk.org/ but this is not fully developed as yet across all sectors and preliminary attempts by Coriolis Technologies to do this have proved cumbersome, thus the aggregation of an HS code is seen as an important first step, especially when combined with the HS code matching to carbon emissions developed by the OECD, which is being adapted for this scoring mechanism to add more granularity from this source by Coriolis Technologies: https://stats.oecd.org/Index.aspx?DataSetCode=TRADEENV_IND10.
Using the methodology above, this section looks at some preliminary results for the EU – its member states, its intra-regional trade and its extra-regional trade. It begins with a global benchmark by looking at world trade and then looks at the G20 to get an idea across the world of where large economies, albeit at differing stages of economic development, compare in terms of their trade profile matched against SDGs. Interestingly, European countries within a global or G20 context like this tend to fare better than they do as part of the EU’s internal market, or than the EU as a trading bloc with the rest of the world does. This can be explained by the heavy concentration of trade within Europe on supply chains which are focused in unsustainable sectors such as automotives, electronics, aerospace and machinery and components. When trading with the rest of the world at a country level, these supply chain effects are diluted somewhat.
World trade is not sustainable in its current form.
Overall, the score for trade across the world is -0.58. Nearly 80% of world trade contributes negatively to SDGs. In other words, for each SDG, there was the equivalent in value terms of some $122.7 trillion US dollars in 2020 that undermined the achievement of SDGs. In the EU, the equivalent value of positive
contributions was just $19.3 trillion, or 17% of its trade with the outside world; that is, 83% of EU trade is contributing negatively to SDGs. While this is to some extent a “crude” number with some double counting as discussed above, the ratio holds when the double-counting is removed in preliminary input-output testing, and can be seen as a powerful wake-up call nevertheless.
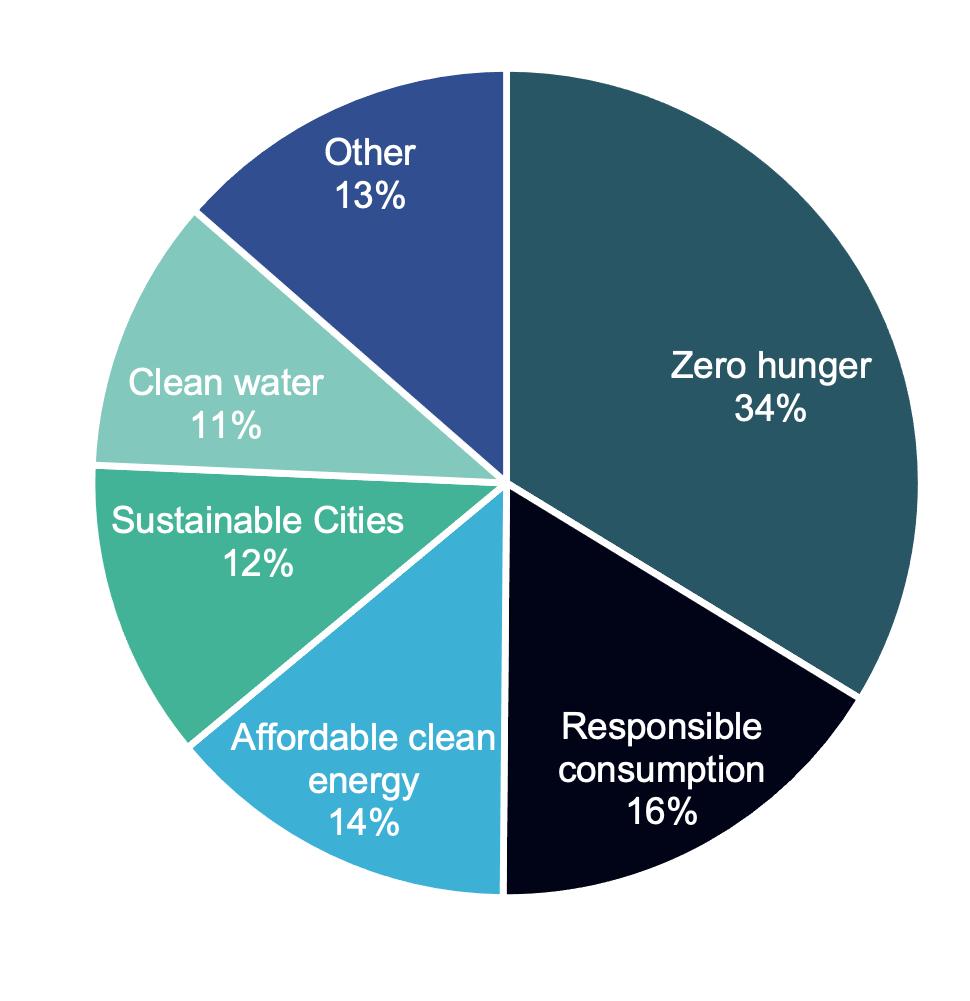
A breakdown for the top five negative contributions to SDGs in value terms is illustrated in Figure 2.
Figure 2: Percentage of total negative value contributed by global trade by largest negative contributions
Source: Coriolis Technologies
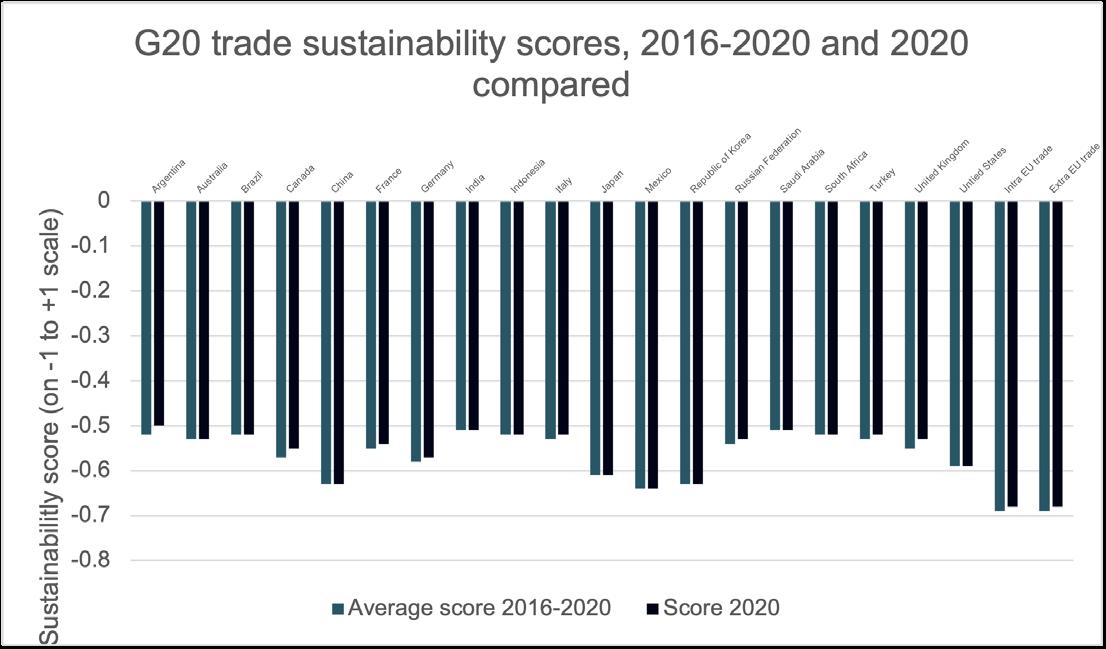
Two aspects of this scoring system are really interesting however, and both are positive. The first is that for many countries, 2020 was better in terms of sustainability than an average for the past five years. This is unsurprising since 2020 was the year when pandemic induced reductions in global trade meant that for a few months the amount of fossil fuels, manufactured items and consumer goods was considerably lower (Figure 3).
because exporting fossil fuel is necessarily a good thing, but because they are less reliant on imports for their own energy requirements.
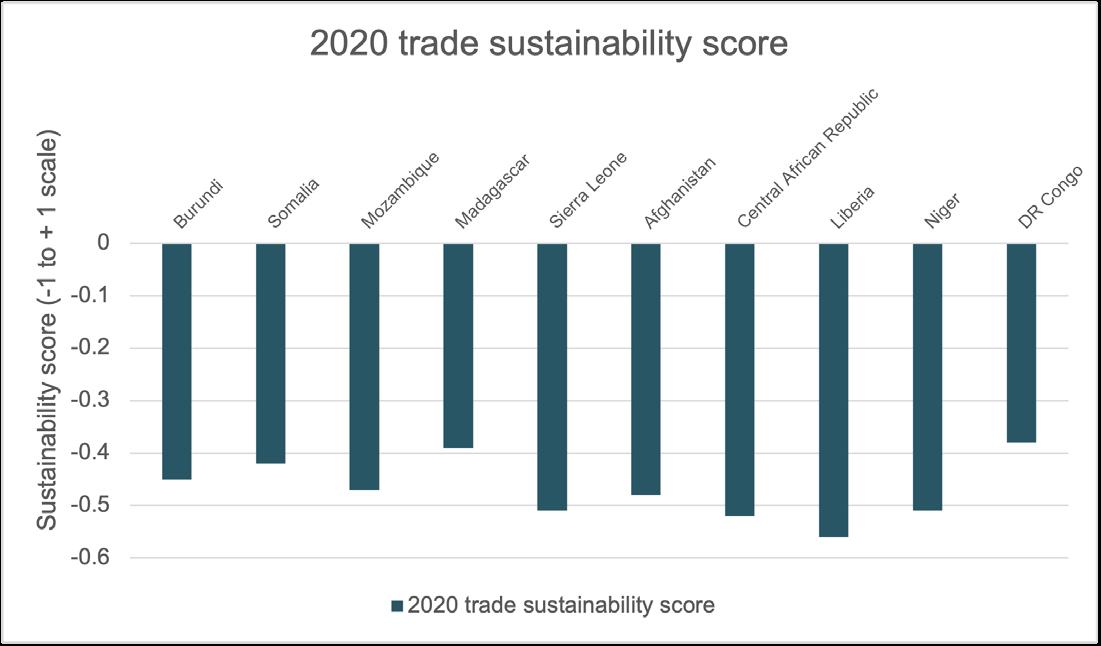
For the poorest nations in the world, the scores are materially lower – between -0.39 and -0.52 (Figure 4)
Figure 3
Source: Coriolis Technologies
By way of example, Germany’s global trade improved from -0.58 to -0.57, for example, and while this may not seem a huge improvement, it was caused by nearly 14% annualised growth in vaccines to the end of 2020; a result of the Covid 19 pandemic.
The largest and most manufacturing-heavy economies fare the worst of the G20 in terms of the sustainability of their trade: The EU’s trade, whether within the region itself or between the region and the rest of the world, has the worst score, but China, South Korea (Republic), Japan and Mexico also tip above the -0.6 mark. These are economies where automotives, consumer electronics and machinery and components (including computing) are routinely among the top five sectors for both imports and exports. Interestingly, the UK has one of the better scores for the developed economies, but this reflects a smaller manufacturing base and a higher contribution of sectors such as “Works of Art” – its 10th largest sector for exports – which are not measured against SDGs.
The other positive aspect of this scoring system is that it does not bias the sustainability risk against emerging economies, or oil producing economies. Within the G20 it is the emerging economies, with the exception of China and Mexico, that have the best scores, albeit still negative. Within the G20, the oil producing economies are the ones that have among the better scores – not
Figure 4 Source: Coriolis Technologies
Figure 3 highlights the fact that trade in the poorest economies has a completely different structure to trade in developed world economies. For example, Madagascar’s cereal imports were some $206m in 2020, while automotive imports were similar at just $214m and on a steady downward path since 2017. In other words, imports are often for subsistence purposes rather than aimed at meeting luxury or consumptionbased markets.
Under these circumstances, a “better” ranking, insofar as it reflects lower economic development, is not a good thing. But what it does mean is that the SDG-related risks of trade are lower and that such countries should not be excluded from trade deals or trade finance on the grounds of sustainability since, comparing like with like, their trade is less environmentally damaging.
If all this were not worrying enough in its own right, the trade profiles of developed economies with heavy manufacturing bases are generally less sustainable than emerging economies. For example, intra-EU trade scored -0.68 in 2020, while extra European trade (that is, the EU27’s total trade with the rest of the world) scored -0.67 for imports into the EU and -0.71 for exports from the EU (Figure 5).
a simple look at the EU’s trade profile with the rest of the world – it’s extra regional trade. The EU 27, as a bloc of countries, imports from and exports to the rest of the world, oil and gas, electricity, machinery, automotives and pharmaceuticals. As a result, some $4.7tn of trade in 2020 contributed negatively towards the elimination of hunger, $2.2tn of trade contributed negatively towards repsonsible consumption and production, and a further $1.6tn made negative contributions towards affordable and clean energy. In contrast, only $2.3tn went contributed positively towards decent work and only $257.5bn went towards good health and wellbeing, even in a year where health was a primary public policy concern.
This is illustrated in Figure 6 which shows the sustainability of each EU member state’s trade with all non-EU countries in 2020.
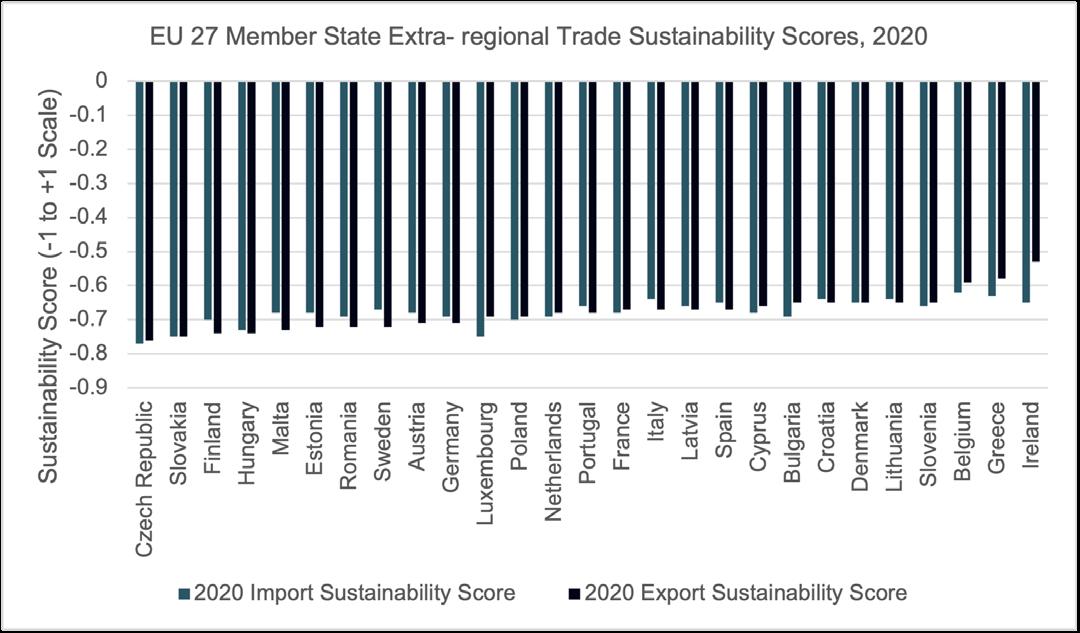
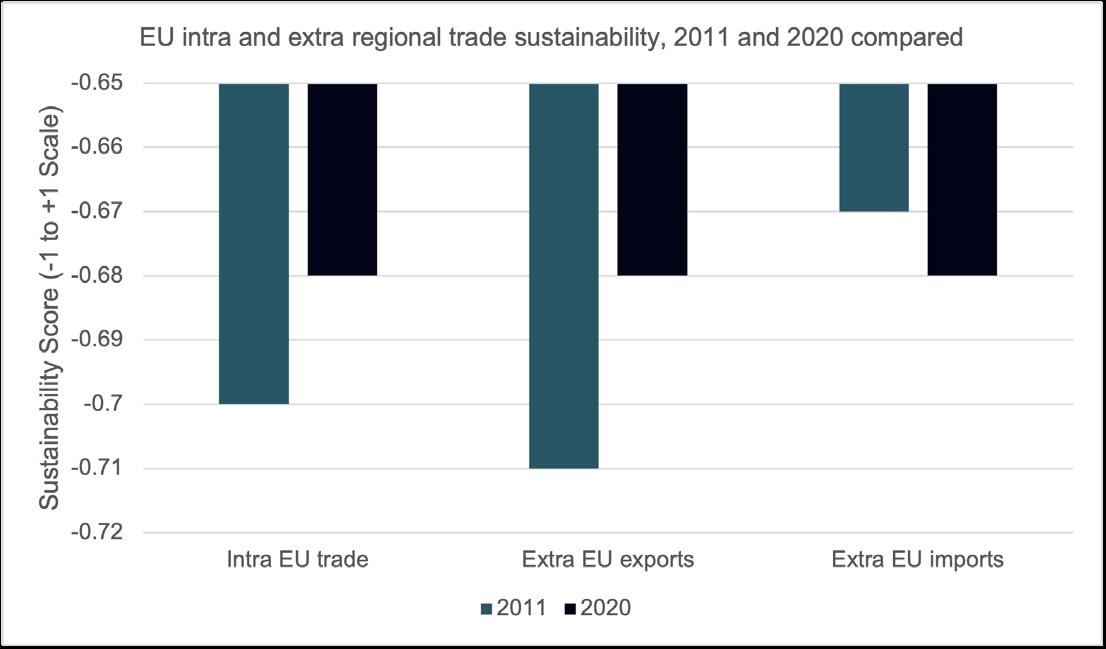
Figure 5
Source: Coriolis Technologies

The chart shows a significant improvement between 2011 and 2020 in intra-European trade, although the picture is still worse than the global average. There also has been a similar improvement in the sustainability of European exports to the rest of the world, but not in the sustainability of European imports from the rest of the world.
The reason why this is happening can be explained by
Figure 6
Source: Coriolis Technologies
The first point to note from Figure 6 is that the difference between the Czech Republic, which has the lowest ranking for exports, and the Republic of Ireland, which has the best, is 0.23 which roughly equates to around 10% of the whole spectrum between -1 and +1. There are differences in the structure of trade which explain this. For example, Ireland’s top export sectors are aircraft, machinery and components, pharmaceuticals, automotives and food and beverages. Pharmaceuticals’ growth in 2020 helps to explain its better position, and the relative improvement between 2011 and 2020 in the sustainability of Irish trade from -0.54 to -0.53. Interestingly, of the top five countries in terms of export sustainability performance, Ireland, Belgium and Slovenia have all improved in terms of their export sustainability and all have seen very rapid growth in pharmaceutical trade.
The second point to note is that of the five countries performing least well in terms of export sustainability, all except Hungary have seen a drop in the sustainability of their imports. This suggests that they are taking in less sustainable imports in order to service both their exports and domestic consumption. All score below -0.7 for exports and imports and the trade of all five countries is dominated by automotives, machinery, electronics, and oil and gas. Finland’s trade profile is slightly different but its imports of paper, oil and gas and iron and steel have grown significantly over the past 10 years.
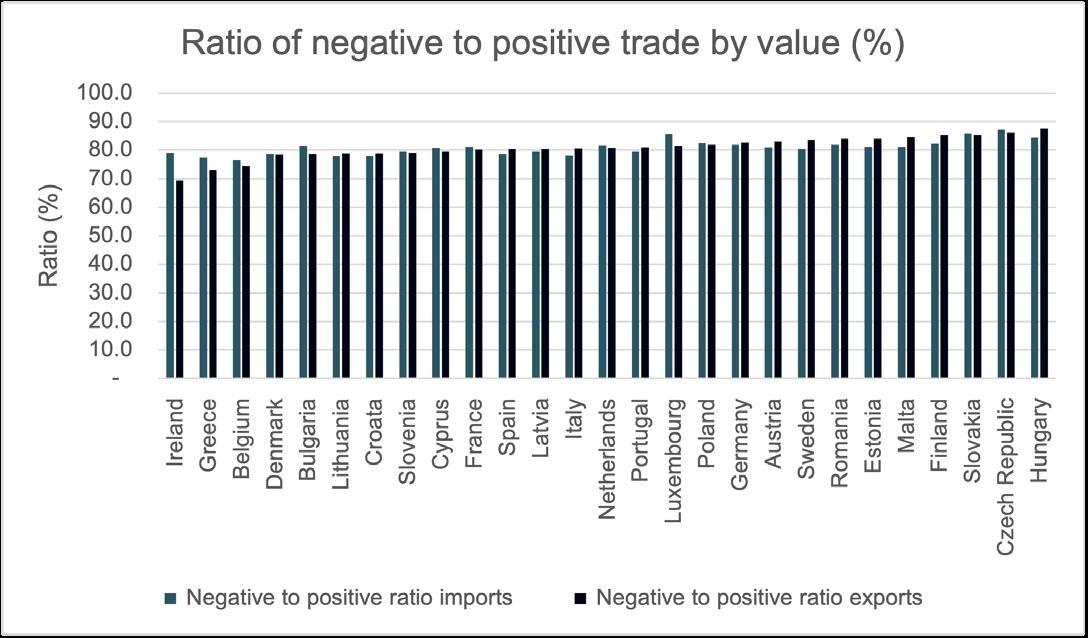
Looking at each countries proportion of negative trade in relation to positive trade is illustrated in Figure 7 for trade with non-EU countries.
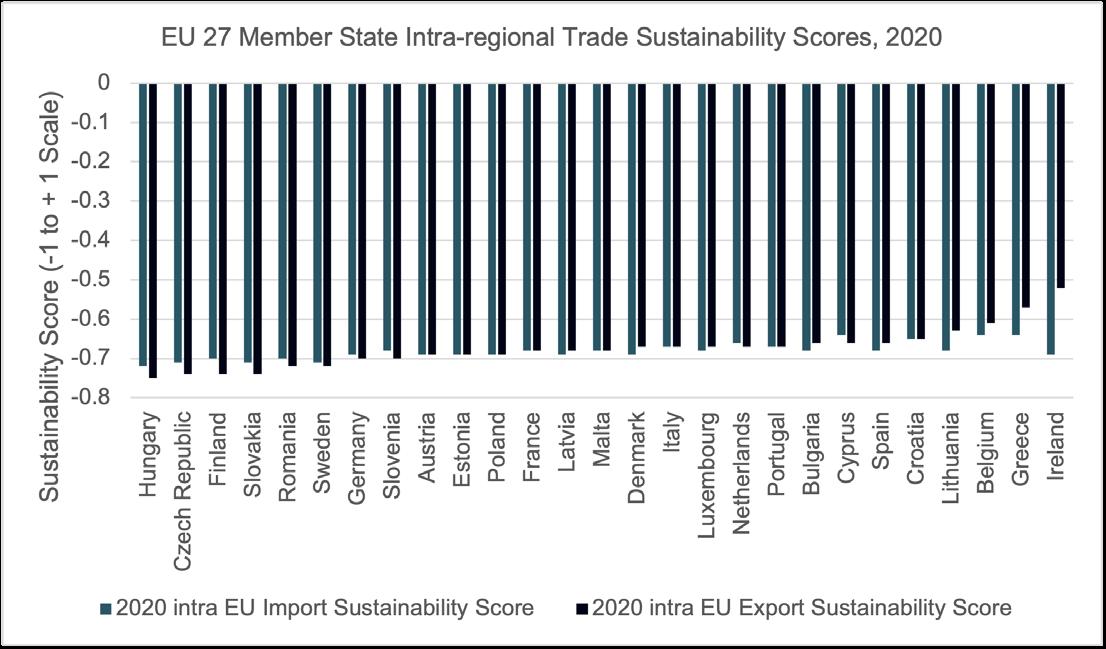
Intra-European trade has a similar profile – all of which reflects the fact that the EU’s regional supply chains that fuel its exports to the rest of the world are equally unsustainable (Figure 8).
Figure 7
Source: Coriolis Technologies
Of the 27 countries, 15 have an export profile that is more negative than their import profile. This the case for the ten countries with the most negative export profiles suggesting that what is being imported is being exported in an even more unsustainable form beyond the EU.
In 2020 Hungary’s exports to the rest of the EU were at -0.75 on the ranking of -1 to +1. The reason was its heavy reliance on imports and exports of plastic components to automotive and electronic supply chains. Romania and Slovakia have similar trade profiles in terms of ESG. While all improved during 2020 compared to an average score since 2011, this was largely due to an overall drop in trade in automotives and oil and gas, rather than an intrinsic improvement in the sustainability of trade.
There are several things that can be brought out of this analysis:
1. Although there is a bigger differential between Ireland’s intra-European exports and Hungary’s than there is for extra European exports, generally across EU nations, the values for intra and extra European trade are more consistent. This is because of the nature of intra European trade which is heavily focused around EU supply chains.
2. Intra European trade, as noted above, has improved in terms of its sustainability profile over the past decade and is now very similar in its profile to extra EU trade which serves to highlight the sector and supply chain focus of all European trade.
3. Irelands imports are much less sustainable than its exports and the gap between exports and imports is wider for trade within the EU than it is for Ireland’s trade outside the EU. This may suggest that many of Ireland’s imports go towards exports outside of the EU while the growth in trade with the EU in pharmaceuticals over the past five years has lowered the negative value of its exports to the EU.
Of course, the trade profile of each country is very different to the values of trade that contribute positively or negatively to SDGs. Germany’s external EU trade, as the largest trading nation, contributed $3.3tn to negative SDGS in terms of imports in 2020, and $4.4tn in terms of exports. In terms of positive contributions to trade, as noted above for the world and EU as a whole, these were predominantly in the form of contributions to SDG 8 (Decent Work and Economic Growth) and SDG 3 (Health and Well Being). This holds for other European nations and the pattern is similar for internal and external EU trade. The total positive contribution in 2020 for Germany’s imports from the rest of the world was $607.7bn and in terms of exports was $765.4bn.
This leads to the final point. Noted above was the fact that when the “E”, “S” and “G” components of trade are broken down, “G” is a positive contribution, while “E” and “S” are over-whelmingly negative. The same holds for Europe with governance scores that are similar to those as for the World as a whole. In other words, trade is effectively contributing to economic growth, employment and health of nations in the most basic sense, but is failing in its responsibilities to make that growth and employment sustainable socially or environmentally. This is the policy wake up call.
This scoring system is a wakeup call for world trade and policy makers all around the world. Some of the most advanced economies have the least sustainable trade accounting for some $18.5tn in value terms in negative contributions to responsible consumption and production (SDG 12). If we are to meet the ambitious targets laid out at COP 26, we cannot afford to ignore the messages here – that the majority of world trade is unsustainable, and where it is not, it is a symptom of under-development.
There is work to be done on this type of metric as has been highlighted throughout. For example, creating a “secondary” set of ESG allocations across the SDGs will mean that we can more accurately assess the spillover effects of negative impacts in one SDG into another. Similarly, it is vital to incorporate a Trade in (Sustainable) Value Added approach as an urgent next step in order to address the issue of doublecounting and ensure the monetary values of trade more effectively reflect the sustainability value added by removing overlapping sectors and indicators. Country scores also need to reflect the regulatory context of each country and the extent to which the tariff and non-tariff systems reflect sustainability objectives. This however, will bias the results back in favour of those countries with better regulatory regimes, so what has been presented here represents a neutral model based on the trade profile and patterns of any given country.
It’s other advantage is in its potential policy application. First, since we know the sustainable development goals where the largest negative contributions are likely to be across world trade, we know the levers we should pull. Too much of world trade contributes negatively either to zero hunger (in other words it potentially makes access to food worse), or to negative climate conditions such as affordable and clean energy, clean water and sustainable cities.
Second, we also know the sectors which are to blame for the low scores of some countries: automotives, consumer electronics, machinery and components, plastics, iron and steel, and oil and gas. Oil and gas alone contributes some 10% to the value of EU trade so if we can reduce our dependency on it, we can also reduce the negative contributions that SDGs make. Similarly, the countries that have the worst scores all have automotives in their top five imports and/or exports. If policy incentives towards the use of electric cars and clean energy can be implemented then this may address some of the negative role that automotive and fossil fuel trade play at present.
These are age-old challenges, and addressing them will be neither quick nor easy. However, if we know how to measure them, we can also measure progress towards addressing them. This feels like progress.
Dr. Rebecca Harding, CEO Coriolis Technologies
Research initiated and funded by Saskia Bricmont and the Greens/EFA Group