DesigningwithaCarbonConscienceV2�
Aweb-basedapplicationtoinformplanningand urbandesignprojectsonpotentialcarbonimpacts.

Authors: Chris Hardy, Michael Frechette
ResearchTeam:
Danielle DeCarlo, Shuai Hao, Alison Nash, Ekaterina Trosman, Tamar Warburg, Chris Winkler
ProductTeam:
Ken Goulding (PIC), Armin Akhavan, Timothy Gale, Patrick Murray, Thiyagarajan Adi Raman, Eric Youngberg
Editors:
Kelly Farrell, Alison Nash, Anna Scherling
SponsoringPrincipal:
Michael Grove, FASLA

CopyrightandCitation
This research is supported by Sasaki Associates and the Landscape Architecture Foundation. All work is derived from existing studies as represented in primary and secondary literature, and as such represents an aggregated literature review. The software is developed from open-source software and in-house coding by Sasaki Associates. The associated application, graphics, dataset, and work are provided for free and public use and are licensed under a Creative Commons
Attribution-NonCommercial 4 0 International License We have made this research free and open source in the hopes that others use and build on it; however, we ask for attribution and for any derivative works to be made free and open source as well. We will need more innovation and collaboration to steer the way we build our cities and communities toward a low-carbon future.
For attribution and for reporting or representing studies in Carbon Conscience, please refer to the application as “Carbon Conscience.” If you are using collected data from the dataset, or the dataset in its entirety, please attribute “Carbon Conscience Dataset by Sasaki.” If you are using individual data points, please reference them based on the original source
If you cite this article in another paper or study, please use the citation information below:
Hardy, C , & Frechette, M (2023) Designing with a Carbon Conscience V2: A web-based application to inform planning and urban design projects on potential carbon impacts. Sasaki Associates.
Acknowledgments
Thanks to the beta testers, LAF cohort, interviewees, academics, and advisors who have helped guide this ongoing work. Special thanks go to the following individuals and organizations for providing mentorship, peer review, and advice throughout the development of this work:
Lucinda Sanders, Laura Solano, Barbara Deutsch; Landscape Architecture Foundation; https://www.lafoundation.org/
Pamela Conrad & Eustacia Brossart; Climate Positive Design; https://climatepositivedesign.com
Atelier Ten; https://www atelierten com
Jack Rusk; EHDD Architecture; https://ehdd.com
Alejandra Hinojosa, Climate & Sustainability Specialist; SWA Group; https://www.swagroup.com/ Dr. Stewart L. Pimm; Duke University; https://savingnature.com/
Stacy Smedley; Building Transparency and EC3; https://www buildingtransparency org/
Stephanie Carlisle; Carbon Leadership Forum; https://carbonleadershipforum.org
Vincent Martinez; Architecture 2030; https://architecture2030.org/
“To achieve great things, two things are needed; a plan, and not quite enough time.”
~Leonard Bernstein
“A society grows great when we plant trees in whose shade we may never sit.”
~Greek ProverbAbstract
This paper provides a summary of the research used to build Carbon Conscience, a web-based application developed to evaluate the potential carbon footprints of planning and urban design projects. We began with a multi-disciplinary literature review that investigated the carbon impacts of the built environment, inclusive of architecture, landscape architecture, civil engineering, infrastructure, and ecology. The literature review included reviewing industry tools, curated aggregated resources, and academic literature This article also details the subsequent methodology for the creation of the Carbon Conscience database, and how that database translates into land use assemblies. The key metrics per land use considered (inclusive of site and building land uses) are embodied carbon emissions, storage, and sequestration. Together, this application is a whole-project-life-cycle-assessment (WPLCA) generator, accounting for site and architectural carbon investments in the constructed environment. Carbon Conscience enables the evaluation of early design phase decisions in light of upfront carbon impacts. This paper replaces and updates the Carbon Conscience Version 1 white paper, including revised methods and citations associated with the Version 2 release of the tool
Background
Across the design industry, from architecture to landscape architecture, civil engineering to city planning, professionals are grappling with how to meaningfully address global climate change and the Anthropocene in our work As designers, we are optimists and are looking for a way to build visions for a healthier, more equitable future. As an industry, building and construction accounted for 39% of global emissions in 2019 (WGBC, 2020). Architecture 2030 estimates that the built environment and infrastructure combined contribute over 50% of current global greenhouse gas (GHG) emissions (Architecture 2030, 2023b) With warming now anticipated to exceed 1 5℃ within the next five years, by 2027 (WMO, 2022), the pressure to immediately address emissions has become a moral imperative and professional obligation for all practices sharing in the culpability of climate change.
The design industry has already been addressing these issues through a host of high-performance, low-energy, and sustainable facility management strategies. For the last two decades, these e�orts
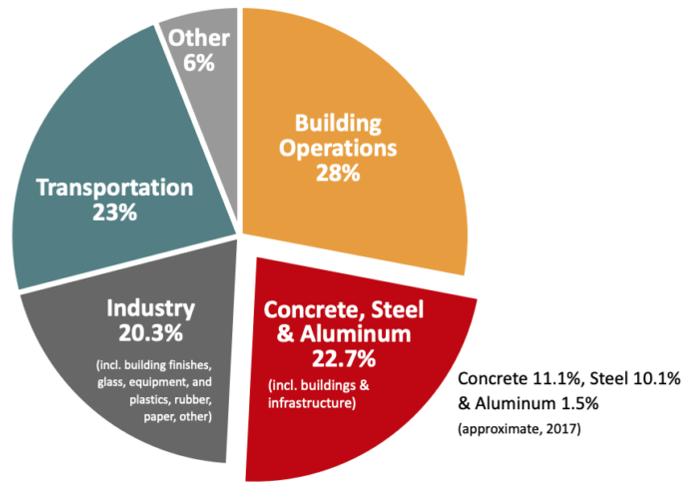 Figure1�Globalemissionsbysector,courtesyofArchitecture2030�Architecture2030,2023b)
have broadly followed the Hannover Principles (McDonough & Braungart, 1992), developed and codified through the U.S. Green Building Council (USGBC), Building Research Establishment Environmental Assessment Methodology (BREEAM), Living Building Challenge, other NGOs, and building codes. Compared to earlier conventional approaches, these e�orts represent a more environmentally responsible design and development ethic, with a focus on higher-performance facilities with lower or net-zero carbon operations costs.
As early as the 1960s, manufacturing companies and industrial design academics began to study the life cycle impacts of manufactured products and chemicals through Life Cycle Assessments (LCAs) (McManus & Taylor, 2015). However, these studies generally omitted the study of carbon impacts until the 1990s, when concerns around the global warming potential of GHG emissions became well documented in academic literature. During the early 2000s, an explosion of LCA research took place, with a variety and wide range of approaches and methods, distilling into a common set of approaches that laid the foundation for the codification of common standards for LCAs and Environmental Product Declarations (EPDs) through ISO standards and EN codes These standards laid the groundwork for the ability to start to understand the global warming potential (GWP) of the materials used in construction, such as concrete, steel, and manufactured goods. Starting in the 2000s and gaining momentum in the 2010s, the architectural and structural engineering sectors started to quantify the actual carbon costs of material procurement and construction of buildings (Foxwell, 2014). Previously, even for high-performance certified facilities, the upfront carbon costs of construction were generally not accounted for, even though approximately half of the total carbon impacts for an average building are in the embodied carbon costs to build the facility, and the other half in the operations and use of the facility (Architecture 2030, 2023b; Sizirici et al , 2021) We note, based on project case studies within Sasaki’s practice, that for landscape architectural land uses such as parks, plazas, and streetscapes, the proportion of embodied to operational carbon may be closer to 90:10 due to the comparatively low operation carbon costs of most landscapes
Academic, non-profit, and private practice thought leaders, from Bjørn Berge to Serge Salat, WRNS Studio to KieranTimberlake, Carbon Leadership Forum to Building Transparency, have initiated significant investigations into embodied carbon in construction, and have applied that information to lower the carbon footprint of construction.
Academics led the initial theory and individual case studies, such as the seminal book The Ecology of Building Materials,(Berge, 2009), or the collected early works by Kate Simonen that lead to the development of the Carbon Leadership Forum (CLF). One of the first comprehensive approaches for a common methodology for Whole Building Life Cycle Assessments (WBLCAs) was developed in the 2010s and published in 2014 by the Athena Sustainable Materials Institute (Athena Institute, 2020b; Rodriguez & Simonen, 2017), and since then, means and methods for WBLCAs have been widely studied, tested, and ultimately standardized through ASTM E2921 and ISO 21932. Initial WBLCAs were extremely time-consuming to produce, requiring extensive calculations to develop bills of quantities for materials and products selected and then to correlate those quantities with carbon data per material Third-party consultants with relevant expertise, such as Atelier Ten or the Athena Institute, began providing WBLCA professional services to supplement architectural practices. Due to the time
and expense involved, WBLCAs were primarily owner-driven or provided by academic or activist architects who were pushing the boundaries of sustainability in practice.
Scaling up the capacity to do WBLCAs as a profession was not feasible until the development of aggregate databases of material and product LCAs and of EPDs, such as the U.S. Life Cycle Inventory Database, the Embodied Carbon in Construction Calculator (EC3) by Building Transparency, the Environmental Performance in Construction (EPiC) database by the University of Melbourne, or the Athena Institute’s materials inventories. These datasets laid the groundwork for tool development to enable incorporation of LCA analysis into digital tools that would make integration of WBLCAsmore feasible for general practice.
In 2013, KieranTimberlake developed a robust Autodesk Revit application Tally (Kieran Timberlake, 2020), which accounts for embodied carbon and life cycle analysis and provides clear graphic outputs using peer-reviewed baseline data, primarily sourced in GaBi 8.5 using GaBi 2018 databases. This tool integrated the capacity for Building Information Modeling (BIM) for bills of quantities with the latest EC3 data on embodied carbon, providing a workflow for integrated WBLCA study within the working BIM model. This tool rapidly became the standard for this type of analysis now with an application that can be purchased for subscription through BuildingTransparency.org and is accepted as a basis of documentation for LEED V4 Life Cycle Impact Reduction (KieranTimberlake, 2017) Tally enabled the scaling up of WBLCAs to broader practice and enabled other seminal works, such as the CLF’s 2017 Embodied Carbon Benchmark Study, which was the first aggregate review of many WBLCAs thatenabled the idea of benchmarking and providing a basis for goal-setting for various architectural typologies (CLF, 2017) The aggregate databases also enabled the development of material baseline studies, which then enabled standard assumptions per material for additional tool development, such as Thornton Tomasetti’s Beacon Revit plugin for embodied carbon structural studies (Embodied Carbon Lab, 2023), or Payette’s Kaleidoscope tool for facade and assembly evaluation (Payette, 2023)
All of these tools required fairly specific design intentions, material decisions, and quantities to develop reporting on potential carbon impacts. To enable more informed architectural concept design decisions, EHDD Architecture created the architectural concept design tool Early Phase Integrated Carbon Assessment (EPIC) to estimate the carbon impacts of detailed concept designs for buildings without having a Revit model and accurate bills of quantities (EHDD, 2023). WBLCAs are now established enough that sustainability certifications are directly addressing embodied carbon as well as operational carbon, such as the International Living Future Institute (ILFI) Zero Carbon Certification, established in 2018, and USGBC’s expansion of the LEED Zero program in V4.1 to include embodied carbon.
Until recently, landscape design and planning disciplines had been tangential to these investigative trends, but in the last few years, a blossoming of research and tool development has brought their impacts into consideration (King, 2019). This has been an oversight, as only in the living landscape can we design and plan for economically viable carbon sinks, where carbon is drawn out of the atmosphere in the form of living materials that sequester carbon over their lifetime (Lal et al , 2013) In design rhetoric, carbon-negative design through planting is often overstated or poorly understood, and the reality of landscape construction includes potentially massive carbon costs akin to architectural construction (Bernal et al., 2018; G. E. McPherson et al., 2008; Sto�berg, 2016). However, planning and design decisions can significantly change the balance of this equation, with the landscape potentially being a net carbon sink (Conrad, 2020). The balance of emissions associated with embodied carbon comes through carbon sequestered by vegetation, e�ectively locking that carbon in living and dead biomass and soils
To enable the study of carbon impacts inclusive of carbon sequestration potential, academics again led the way, this time from the urban forestry and natural resources disciplines. Carbon sequestration accounting was born out of the multi-decade e�ort to ascribe a monetary value to ecosystem services Ecosystem services was a term coined in 1866 by Ernst Haeckel to broadly describe all the resources and system values provided by natural systems, and was not popularized until the environmental movement of the 1960s (Gómez-Baggethun et al., 2010). With Garrett Hardin’s “The Tragedy of the Commons” article of 1968, for the first time, a challenge was made to the economic community to ascribe a monetary value to ecosystem services in a systematic way, to avoid environmental catastrophe (Hardin, 1968). Ecosystem services studies and valuation methodologies exploded in the 1990s with the intersection of a deeper understanding of the climate crisis and the advent of computer models and geographic information systems (GIS) for more e�ective natural resources management and analytics. In the urban environment, the initial focus on ecosystem services focused on stormwater management, but quickly grew to include public health, habitat, and carbon variables. The development of i-Tree by Dr. David Nowak of the U.S. Forest Service aggregated, for the first time, this data in a way that enabled urban foresters and landscape managers to report on the ecosystem services of the trees in their inventories (D. J. Nowak, 2021). Dr. Greg McPherson, Dr. Dewayne Ingram, and others investigated the balance of carbon sequestration with management and cultivation costs (Ingram, 2013; E. G. McPherson et al., 1999, 2015; Petri et al., 2016). These studies created initial datasets that could inform designers of the carbon sequestration potential of the living environment.
In 2018, Pamela Conrad with CMG Landscape Architecture, in collaboration with Atelier Ten, started a project with the Landscape Architecture Foundation (LAF) to apply the existing landscape research to practice Her project led to the development of the first detailed tool for evaluating carbon in the built landscape, the Pathfinder tool, hosted by the new nonprofit, Carbon Positive Design (Conrad, 2019).
In the broad literature review and testing of all of the aforementioned applications, at Sasaki we found the existing tools excellent for detailed design phases, when applied to Revit models or used on projects with accurate comprehensive cost estimates. However, we realized we needed a tool for integrating architecture and landscape design data into an overall planning tool, enabling rapid iteration that would allow designers to e�ciently use it to inform early design processes:a tool for early sketches that brought architecture and landscape together, informed by civil engineering and ecology. The identification of this need led to the development of the Carbon Conscience tool.
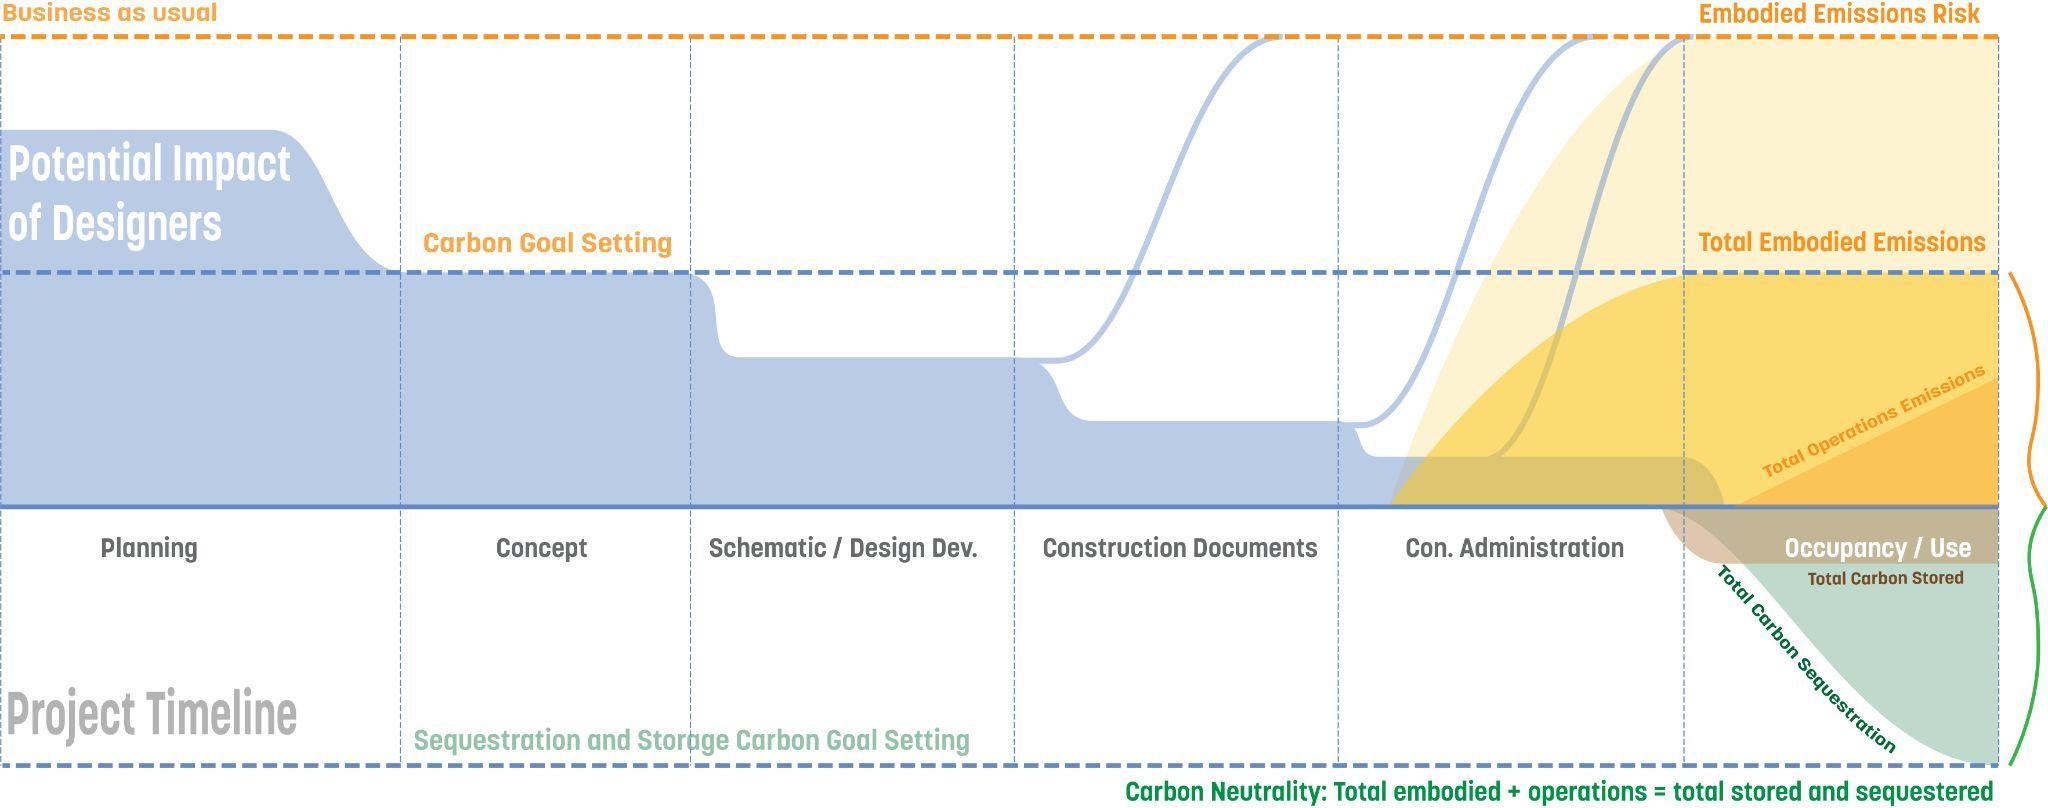
Figure3�Conceptdiagramofthepotentialimpactofdesignersregardingcarbonbudgetsofprojectsover theprojectlife.Thegreatestpotentialforchangingexpectationsisattheplanningandconceptphases whenthedesignismostlyflexible However,ateachtechnicaldocumentationphase,thereisalwaysapull tobusinessasusual,soplanningandconceptphasegoal-settingstudiesarenotsufficientwithoutfollow through
To develop Carbon Conscience, our team first engaged in a broad literature and existing platform review, testing existing tools, comparing LCA certification programs, and compiling existing peer-reviewed data sets on carbon emissions, storage, and sequestration. As part of our research, we applied existing carbon calculators to all or portions of a common project Bonnet Springs Park with which members of our research team were familiar from their roles in design and construction administration processes. This project included a number of buildings, restoration ecology, and active park space, making it suitable to test methods that reached across design disciplines. To read about our conclusions for existing tools and platforms, please see Appendix A: Additional Carbon Calculators and Workflow Recommendations To see our full bibliography for all sources cited and used in the development of Carbon Conscience, please see Appendix B: Full Application Bibliography.
All carbon calculators are essentially tools that input material takeo�s, multiply them by their carbon costs, and sum the carbon costs for all materials. In the case of Pathfinder, in addition to costs, the tool accounts for carbon sequestration in the case of living materials that will store carbon as they grow. For Carbon Conscience, we wanted to bring together embodied carbon, carbon sequestered, and carbon stored, which we considered the key carbon impacts, positive and negative, associated with construction.
Our research reinforced our early perception that a gap exists in current tools for early design phases and interdisciplinary projects. To encompass the types of materials and inputs that would be relevant across disciplines and specifically from a planning and urban design perspective, we needed to develop a tool that projected embodied carbon per unit area of land use to create an even unit of measurement across diverse types of intervention. To do so required developing a database of land uses, the expected material masses for each land use’s unit area (taken from larger land use coverages and averaged per square meter), and the types of work performed in constructing that land use. The calculator could then sum those inputs to estimate carbon impacts per unit area
We chose land use as the common convention for reporting quantities as it is through land use that we have our primary unit of decision making in early phase planning and urban design projects; land use is the practical theoretical construct defining much of GIS analysis, regional planning, zoning, and ecosystem services accounting. We defined land use following U.S. Environmental Protection Agency (EPA) typical practice as the term used to describe the human utilization and management of land (US EPA, 2017b) Land use also transcends discipline, having been part of landscape architectural and urban design studies since pioneering works by Ian McHarg and Lane Kendig, to geographic and natural resources management GIS analytics by Roger Tomlinson and Jack Dangermond. In our research and datasets, we didaddress existing ecosystems, considering these within the realm of land use, even if the only human use is through the articulation of preservation structures To define land uses, we attributed average land covers to defined land use, with land covers being the physical composition of what is on a given piece of land. For this research, we refer to land use in reference to both the physical land cover and the usage of that land.
To enable the contributions of both buildings and site land uses to a given carbon assessment, we needed to expand the study from WBLCA to Whole Project Life Cycle Assessment, or WPLCA. Part of the iteration and advancement of this research into Carbon Conscience Version 1 was the grounding of the system boundaries for the WPLCA, using both standards from Europe and best practices identified by academics from within the United States. For Version 1, we chose to include defining the geographic boundaries by the two-dimensional area of a site. This would correspond to the area painted or annotated in the application, and would be a simple workflow from a hand drawing of measured plans, CAD tools, Adobe tools, or GIS shape or raster files. The included temporal boundaries are the limits of the study period within the overall life cycle of a project (McDonough, 2002). For this study, the temporal boundaries were Cradle to Handover, with the addition of replacement cycles and sequestration o�sets Another way to codify this type of LCA system boundary is through the ISO 1040 / EN 15978 approach, which is useful for standardization.
In the ISO and EN terminology, Carbon Conscience Version 2 includes the embodied carbon of the Product Stage (A) through referenced carbon factors to provide A1: Raw Material Supply, A2: Transport, and A3: Manufacturing. A user-supplied multiplier is included for transportation to the site for A4: Transpor,t and a global factor is added for A5: Construction and Installation. This study omits most of In-use Stage (B), namely B1-B4 and B6-B7 operational carbon, but does include B5 Replacement Cycles, mainly because of the direct relationship between material selection and likely replacement cycles for landscape materials, which is less impacted by operations decisions and management. End-of-Life Stage (C) is also omitted for the same rationale that disposal decisions can happen independently of the selection of what goes on site, and the potential range of options and associated costs for any given material introduces too much uncertainty to be useful in planning design stages. Because ISO 1040 and EN15978, as well as ASTM E2921 and ISO 21932, currently omit carbon sequestration methods and accounting from their WBLCA standards, we are broadly grouping carbon storage in materials on site, as well as carbon sequestration, in Circular Economy Stage (D) Carbon storage refers to a deduction or negative carbon value for given carbon stored in building and
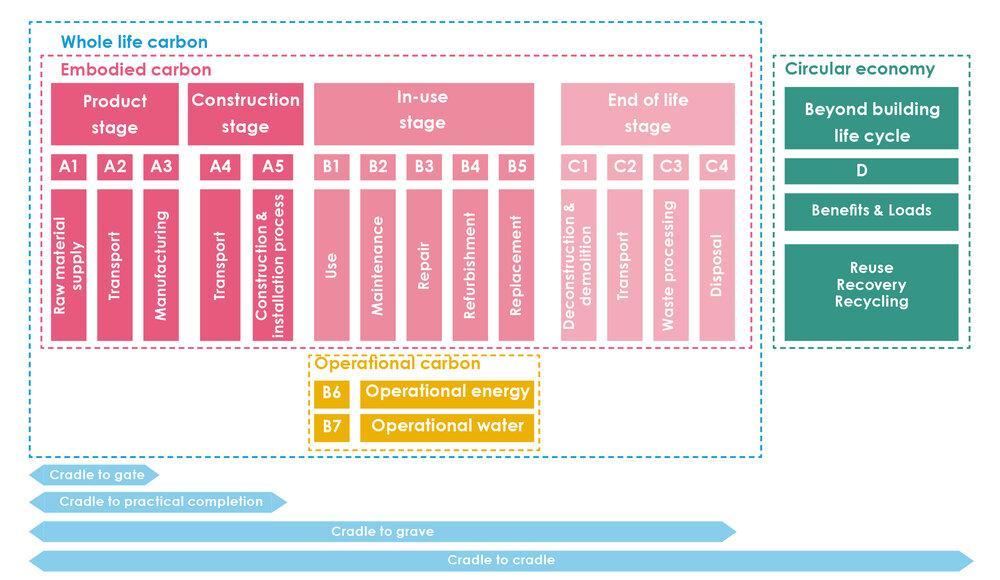 Figure5�GraphicguidetoLCAstagesfollowingISO1040/EN15978,courtesyofLETI�LETI,2022�
site materials, following the principle of biogenic neutrality. Following EN Code 16485, we consider wood from sustainable sources to be considered a negative emission and note that in our datasets, 50% of the dry biomass of wood is considered e�ectively stored carbon (R Bergman & Bowe, 2008) Due to a lack of standardization around carbon sequestration, we developed a unique model for the Carbon Conscience Dataset, which is explained in more detail later in this paper. In general, we collectively refer to the carbon stored and sequestered in living ecosystems, inclusive of living and dead biomass and soil organic carbon, as Ecological Carbon, to di�erentiate from the carbon stored in building materials. This overall structure and understanding of ISO 1040 / EN15978 were informed both by the direct code and also the Embodied Carbon Primer by LETI (formerly the London Energy Transformation Initiative) (LETI, 2022).
In Carbon Conscience, sequestration estimates are provided on a fixed study time period because of the variable sequestration rates over the growth of vegetation and decline or balancing with net respiration and decay (depending on the ecosystem) at maturity (Pugh et al., 2019; Radford, 2019). In addition, a static projection at maturity avoids overestimating a landscape given that most landscapes have an upper limit of carbon sequestration and storage capacity, which is their carbon-carrying capacity (Braakhekke et al., 2019). Also, given the highly variable response to transplant stress and urban tree mortality (Büntgen et al , 2019; G E McPherson et al , 2008; Sohngen, 2009), Carbon Conscience sequestration projects are per unit land area projected to the end of the study period, as incremental growth is too variable to provide predictable year-by-year projections.
In Carbon Conscience Version 2, we have revised the length of time of the study period to 60 years, from 80 years in Version 1 We previously selected 80 years as that is what the U S Forest Service notes as the typical time for a stand to reach maturity (USFS, 2003). While seemingly arbitrary, given the huge variety of maturation rates of landscapes, this value is the common number employed in all lands managed by the U S Forest Service and the Bureau of Land Management In Version 1, we used 80 years as the static study period to account for carbon sequestration through maturity and limit carbon projections to maturity, to not overestimate carbon sequestration beyond probable site carbon carrying capacity. In Version 2, the decision to revise to 60 years aligned Carbon Conscience WPLCA estimates with the 60-year timeline of most WBLCA methods we evaluated, inclusive of Tally, Athena, and EPIC approaches.
While these classifications e�ectively describe Phases A through D of WPLCA criteria, we also wanted to include a few additional criteria typically not described in EN 15978 scope to help designers be mindful of project impacts. One was the inclusion of site demolition and existing to remain land uses, e�ectively broadening the Phase A5 definition. Another educational feature provides an analysis of potential o�site investments in restoration ecology so that designers would be able to see the equivalent areas of restoration needed to o�set their projects e�ectively a carbon o�set recommendation, and, for our purposes, lumped in Stage D.
In assigning embodied carbon costs and sinks to various types of land use, we found that depending on the data source, a wide margin exists in estimated carbon factors for any given material, or carbon sequestration for any given ecosystem type in some cases up to 50% of the mean value of the variables. This margin brought the realization that for this tool to be accurate, it would be unrealistic
to estimate a precise carbon value for a designed project. Rather, it could supply projected carbon metrics, document all assumptions and citations used in supplying those metrics, and encourage designers to compare design options based on a common reference As a general philosophy, we follow Arthur Ashe’s saying, “Start where you are. Use what you have. Do what you can.”
With these considerations in mind, we intentionally targeted our dataset to bring together existing architectural, landscape, and ecological data with a square meter resolution The ideal project for this scale would be at a campus or neighborhood master plan scale or larger, including multiple landscape and architectural land uses. We also strove to include enough specificity for a building- or site-scale landscape concept design.
Methodology Overview
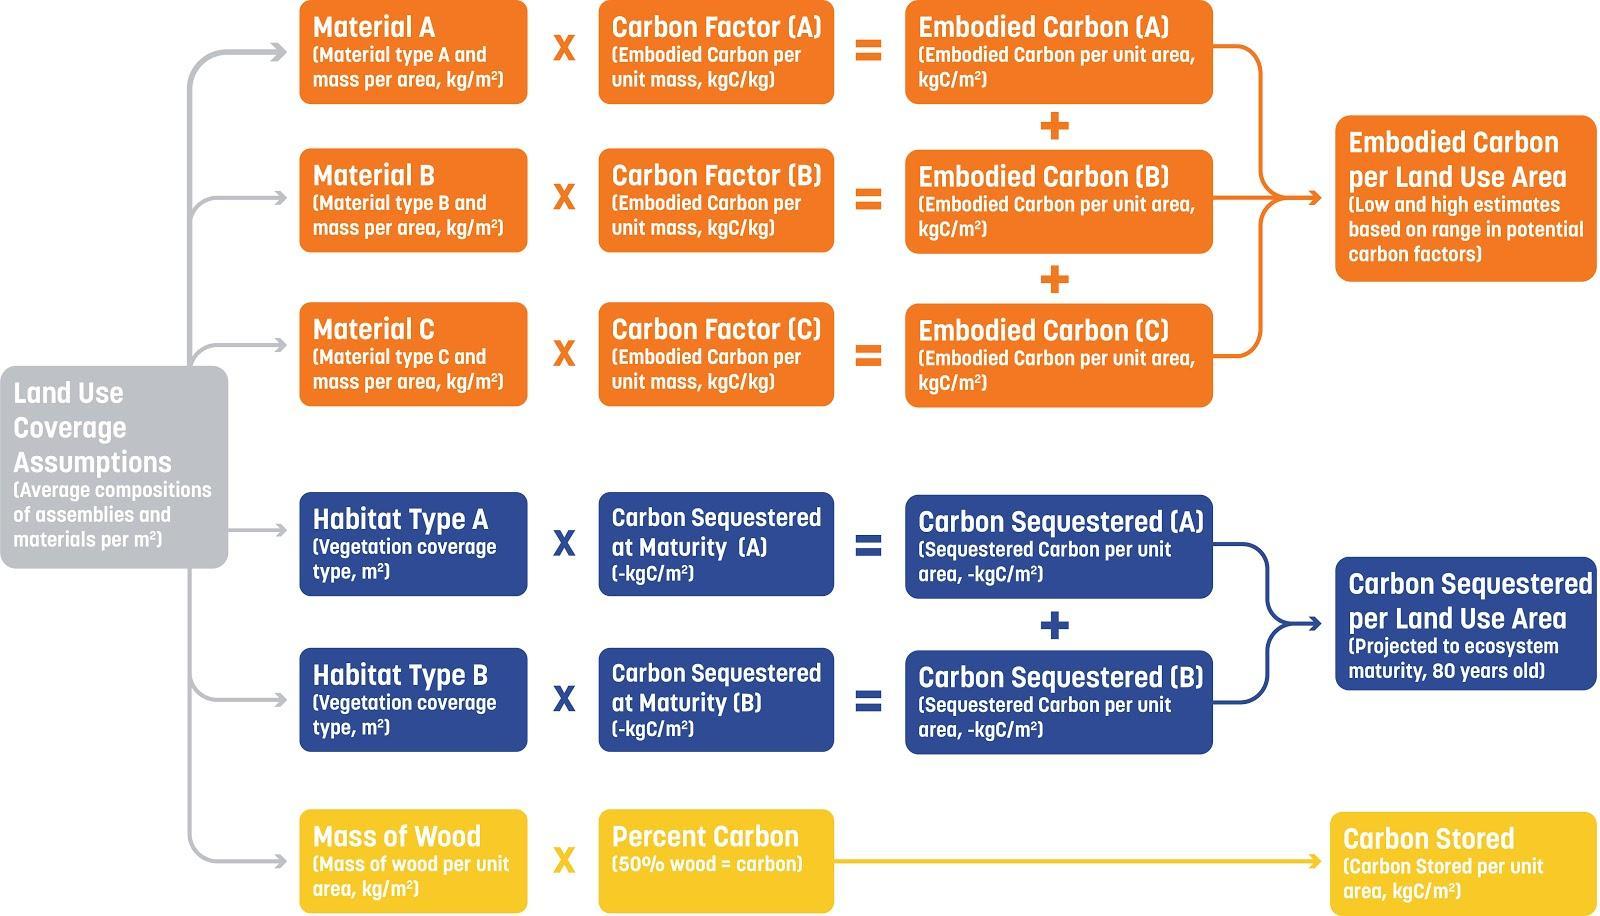
The Carbon Conscience tool uses a similar methodology for estimating a project’s carbon impacts as other early design phase carbon calculators by multiplying the mass of included materials by carbon emission, sequestration, or storage factors, and summing the aggregated results for a given project. The value of the Carbon Conscience tool is the application of estimated carbon impacts per given land use, rather than relying on precise takeo� measurements for specific materials. This fundamental di�erence from other available tools requires Carbon Conscience to use a detailed set of assumptions per land use type to project anticipated carbon impacts per unit area because of the lack of specificity of design inputs and quantity analysis
As described in the background section above, a valuation decision was made early in the development of this tool to focus exclusively on embodied carbon costs, carbon sequestration at maturity, and carbon stored per land use area, rather than considering the myriad decisions that would influence a project’s operational energy usage and subsequent carbon costs from energy production and use. This decision was made in light of which key factors are most helpful to inform planning stage work and to not duplicate existing and highly e�ective operations assessment and energy modeling tools From a land-use scale perspective, operational standards are a complementary but di�erent set of considerations, necessary decisions, and studies from the physical installation of a given land use.
These key factors together summarize the impact of the constructed environment and could be considered complementary and supplementary to energy modeling and designing for net-zero carbon operational environments. While we omitted operations and maintenance carbon costs, focusing on embodied carbon alone would ignore the ecological contribution of the landscape in terms of carbon sequestered by planted material and carbon stored in existing ecosystems; therefore, we included carbon stored and sequestered in the Carbon Conscience calculations. Together, these variables represent the impact of a constructed project, for both buildings and site, inclusive of architectural, landscape, and civil disciplines, in terms of carbon emissions.
While embodied carbon emissions and carbon stored are largely realized by the completion of construction, carbon sequestered is an estimate of net carbon sequestered per land use type projected to maturity. Carbon sequestration, as a variable or factor per habitat type, turned out to be the singularly most variable projection within our research, and for this study, we developed a set of
specific assumptions pulling together a range of references to make estimates that are proportionally relative and matching in units across di�erent vegetative coverage types.
StandardUnits
To translate the volumetric complexity of architecture and the surface extents of landscape, as well as bring together such disparate datasets, we needed to establish a common set of units and equivalents. The following are the common units and unit assumptions for the Carbon Conscience Dataset:
● Area: M^2 (square meter)
● Carbon Mass: KgC (kilograms of carbon)
● Mass: Kg (kilogram)
● Global Warming Potential: GWP in the narrative; kgCO2e in tables (kilograms of carbon dioxide equivalent) (kgCO2e = KgC*3.66)
● Carbon Factor: Kg/Kg (kgCO2e/kilogram of material)
● Distance: Km (kilometer)
● Transportation Factor: kgCO2e/(Kg/Km) (kilograms of carbon dioxide equivalent per kilogram of material transported for a given distance in kilometers)
● Carbon Sequestration Rate: kgCO2e/M^2/Yr (kilograms of carbon dioxide equivalent per square meter per year)
StandardDefinitions
In addition, for clarity and specificity, we needed a common set of definitions for the basis of comparison and standardization of reporting Below are the key common definitions for this e�ort and for use when discussing Carbon Conscience inputs and results:
● Life Cycle Assessment (LCA): A material or product data sheet or study that estimates a variety of impacts for that material on the environment over the material life span. Generally, LCAs referred to in the Carbon Conscience Dataset conform to ISO 1040 standards.
● Whole Building Life Cycle Assessment (WBLCA): A study that calculates the environmental impacts of an entire building inclusive of materials, construction, and operations over the building life span. WBLCAs can be completed with a variety of methods, with current best practices defined by EN15978, ASTM E2921, and/or ISO 21932.
● Whole Project Life Cycle Assessment (WPLCA): A study that calculates the environmental impacts of an entire project inclusive of site and building impacts, materials, construction, and operations over the project’s life span.
● Carbon Emissions: Carbon dioxide emitted through an activity or process, such as material extraction, fabrication, transportation and assembly, and possible demolition.
● Carbon Equivalent: The equivalent mass of carbon dioxide in terms of GWP. This simplifies emissions of various GHGs into one metric and is the basis for most LCA estimates of the carbon impact of materials
● Carbon Factor: A multiplier that refers to the embodied carbon emissions per mass of a given material.
● Embodied Carbon: Estimate of the probable carbon emission from a material or product’s sourcing, fabrication, transport, and installation on a site
● Carbon Stored: The mass of carbon locked up within building materials, vegetation, or soils that is not readily o�gassed into the atmosphere. For the purposes of this project, we counted carbon stored for at least 20 years. Carbon stored is equal to 50% of the dry biomass The GWP of carbon stored is the mass of the carbon times 3.66 to equal carbon dioxide equivalent.
● Land Use: A description of the human utilization and management of land, which may include many types of physical land coverage. This tool enables the user to define land uses based on reference land uses, each with a set of land coverage assumptions for probable assemblies and materials included.
● Carbon Sequestration: The active storing of carbon from the atmosphere into vegetation or soils
● Projected Carbon Sequestered: The amount of carbon actively stored or fixed from the atmosphere in vegetation or soils, after construction. For the purposes of this project, we used the net sequestration of carbon within a given habitat or vegetation coverage in living and nonliving biomass and soil organic carbon, accounting for respiration and decay Carbon sequestered is equal to 50% of the dry biomass accumulated in the study period, plus any additional carbon stored in soils or moved o�site, minus respiration and carbon released through decay. The GWP of carbon sequestered is the mass of the carbon times the molecular weight factor of 3 66 to equal the carbon dioxide equivalent
● Allochthonous Carbon: Carbon sequestered in biomass or root exudates that may move o�site, but remains out of the atmosphere, such as forest litter that is transported in waterways, or carbon that leaches into subsoils
● Ecological Carbon: A collective term coined by these authors for the carbon stored in live and dead biomass and soil organic carbon, describing all carbon locked up in a living system.
● Decomposition Emissions: Carbon emission from the decay and decomposition of biomass.
● Soil Organic Carbon (SOC): Solid carbon stored in soils through the living and dead biomass of the soil. This is distinct from mineral soil carbon; in general, mineral soil carbon is static, while SOC can accumulate
● Preserved Ecosystems: Existing ecosystems to be protected in place.
● Restored or New Ecosystems: Newly planted ecosystems that either restore or introduce living landscapes to a given site.
● Carbon O�sets: The investment in o�site carbon sequestration and storage measures to mitigate onsite carbon emissions.
GlobalAssumptions
As a global high-level estimator, we had to include numerous assumptions to aggregate the literature review into a dataset that could service a common platform Below are the updated global assumptions included in Carbon Conscience Version 2:
● We assume materials are sourced and fabricated following industry typical practices as of 2023
● We assume energy used to fabricate materials, unless otherwise indicated, is solely from non-renewable resources. This is the most likely scenario for work within North America. In countries with a high percentage of renewable energy sources, we have found EPDs reflect a corresponding drop of almost 50% for materials such as timber, and 25% for materials such as concrete and metals.
● We assume one replacement cycle for most materials and more replacements for outdoor materials with known shorter lifespans. The exception would be materials that can last 60 years with minimal inputs, such as stone that can be reset, aggregate that can be restabilized, or metals that develop a superficial patina.
● We assume materials are transported to the site using ground truck transportation in general, and provide a range of baseline distance estimates depending on material or assembly These assumptions are made variables in Version 2 for users to be able to edit.
● We assume baseline materials have no recycled content. These assumptions are made variables in Version 2 for users to be able to edit.
● We include a global installation contingency for the installation of materials on site or movement of materials on site assuming large diesel-fueled construction vehicles, based on proportion averages found in the literature. This contingency accounts for field installation methods, including carbon costs associated with field welding, fastening, and hand-craftsmanship, and is universally applied to all materials.
● For Carbon Stored and Sequestered, we convert the kgC to the global warming equivalent, kgCO2e. (1 Kg of carbon equals 44/12 = 11/3 = 3.67 Kg of carbon dioxide.)
● We assume structures generally under 12 stories tall, and do not account for exotic structural systems in buildings, such as in seismic or hurricane zones. Those factors would need consideration as additional contingencies if relevant for given projects.
● Our landscape land uses include baseline values for irrigation, site drainage infrastructure, lighting, and infrastructure, but not any trunk-line infrastructure utilities, telecom, or large-scale infrastructure elements. Proxy land uses for those elements are added as separate infrastructure land uses in Version 2.
● We do not include emissions from fire, volcanic activity, or changing hydraulic regimes in our ecosystem land uses
These assumptions per land use category are discussed further in this paper; however, before we could develop those assumptions, we also needed to add more specificity to the working definitions for our key land uses, as we also found a wide range of interpretations for these names across our literature review.
We developed a tiered approach to land use mapping, starting by splitting between Landscape and Architecture typologies (site versus building), then by high-level land use or program categories, then subdivided into finer designations. The high-level categories for Landscape include Existing to Remain, Demolition and Site Preparation, Hardscape, and Softscape. The equivalents within Architecture are defined by the building program, described more below, then refined through the facade and structural decisions Each of these categories drew upon very di�erent references and data sets to bring together carbon estimates on a per-unit land area basis.
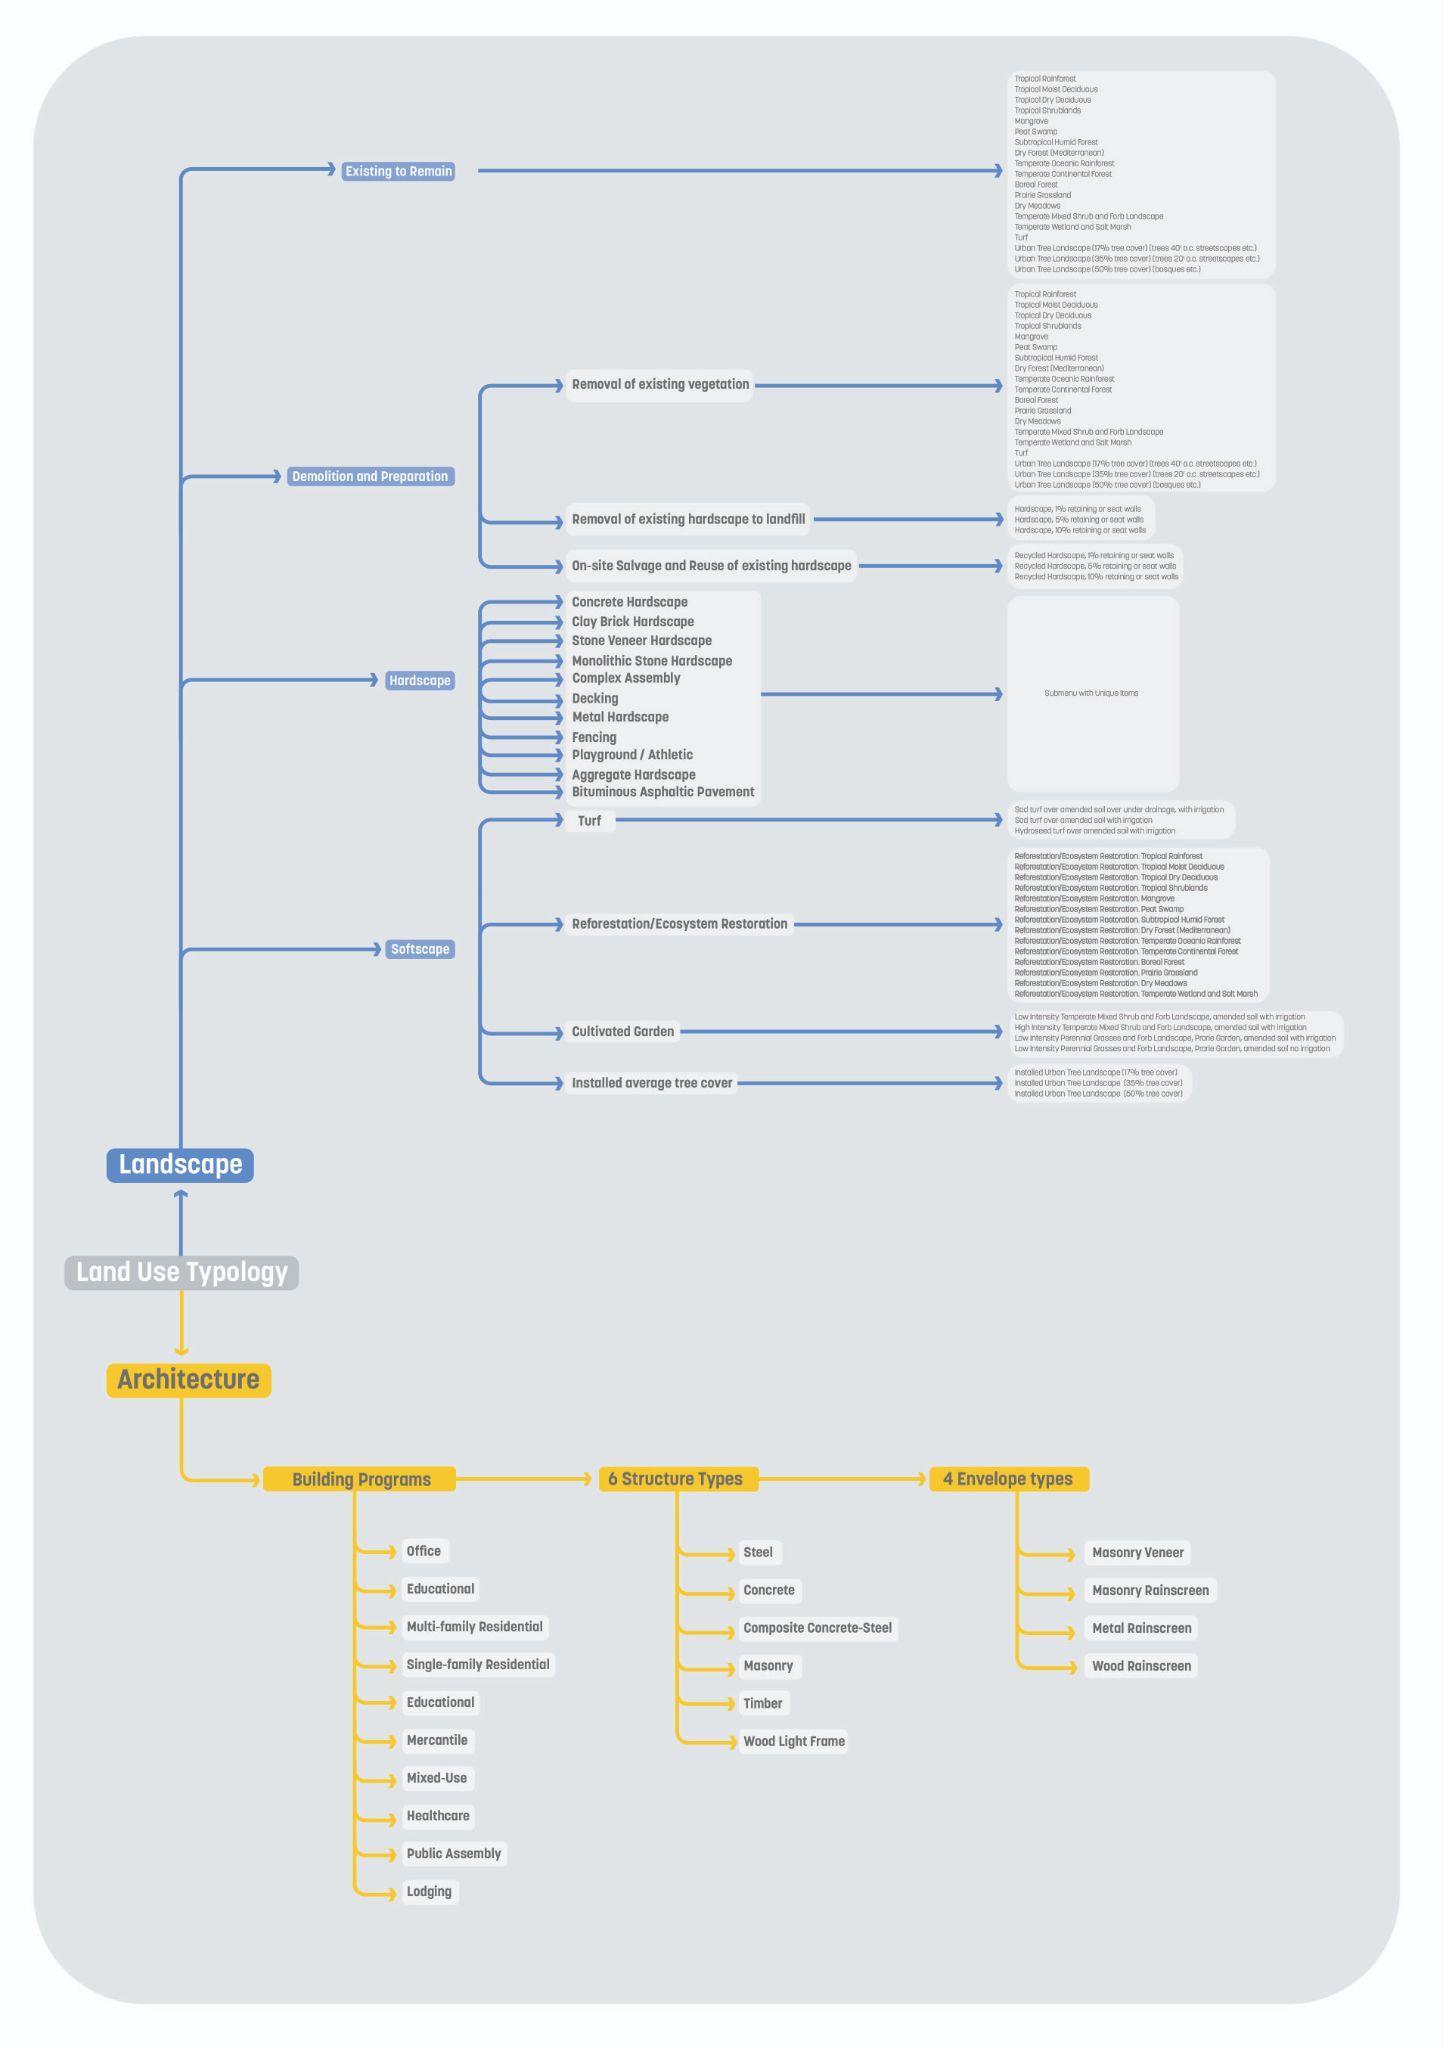
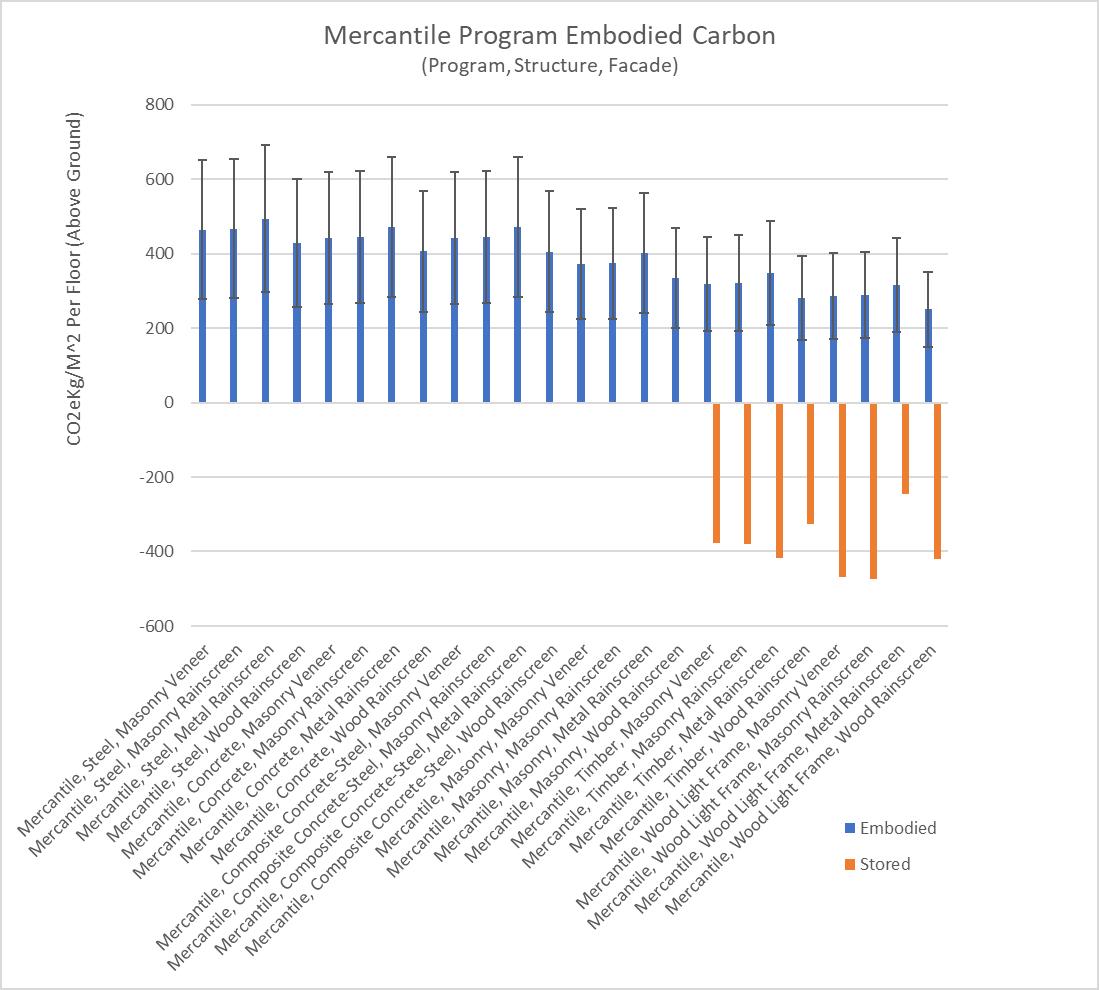
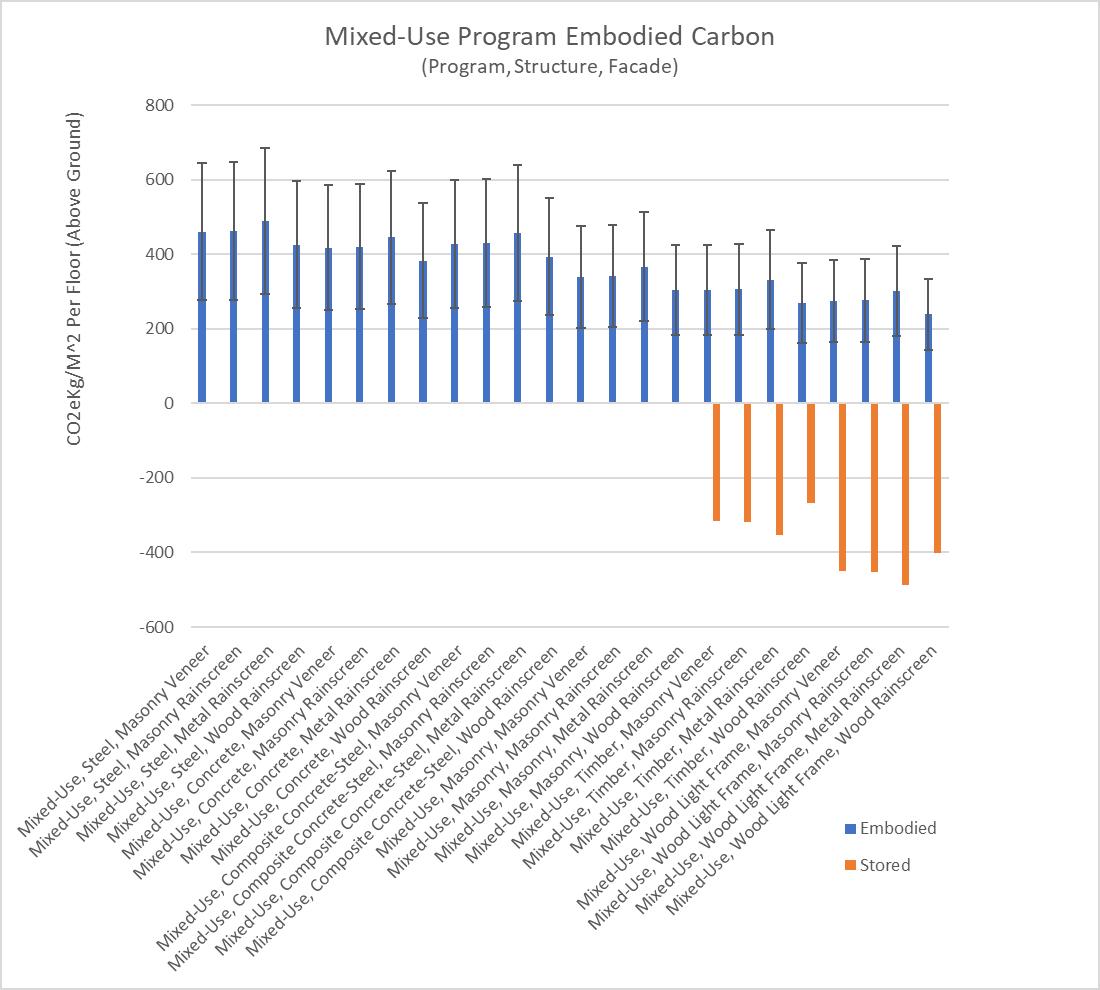
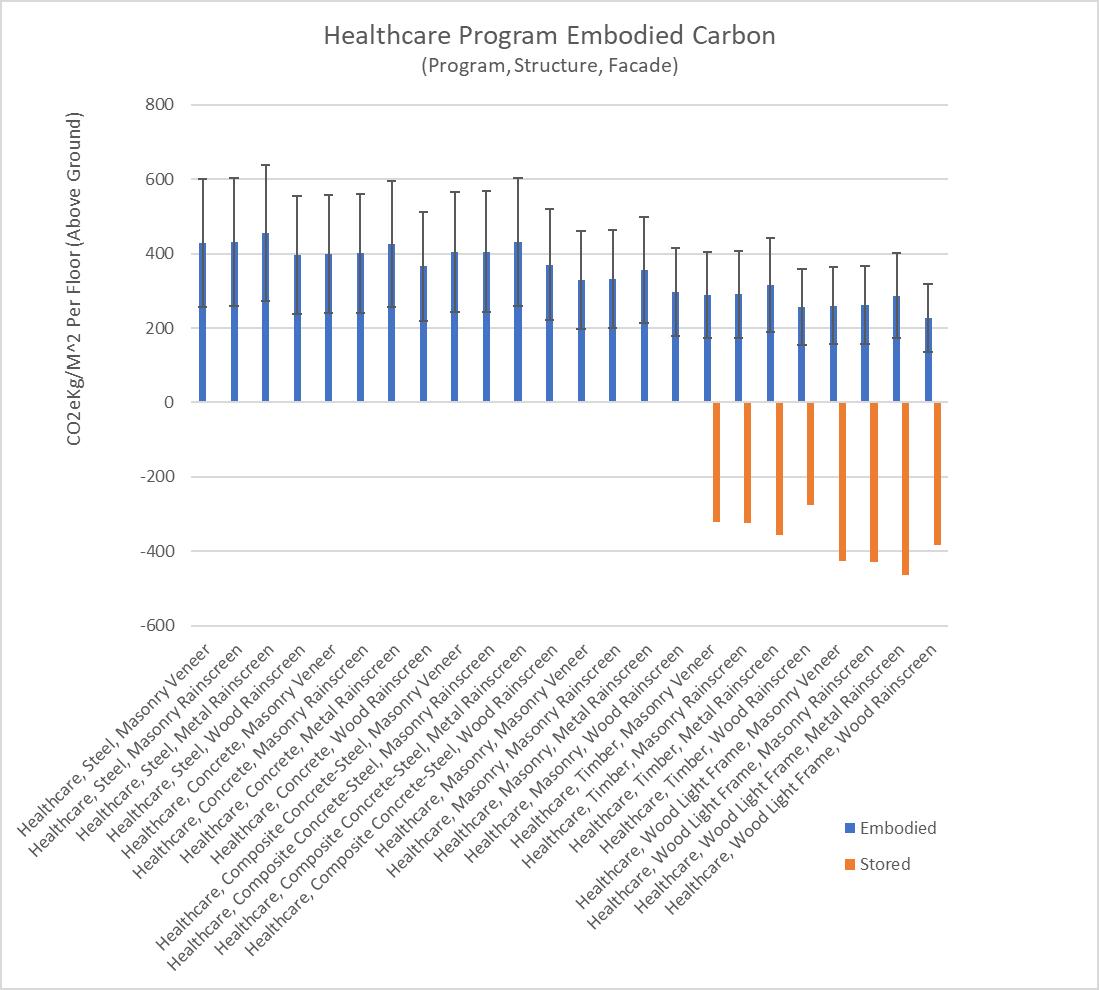
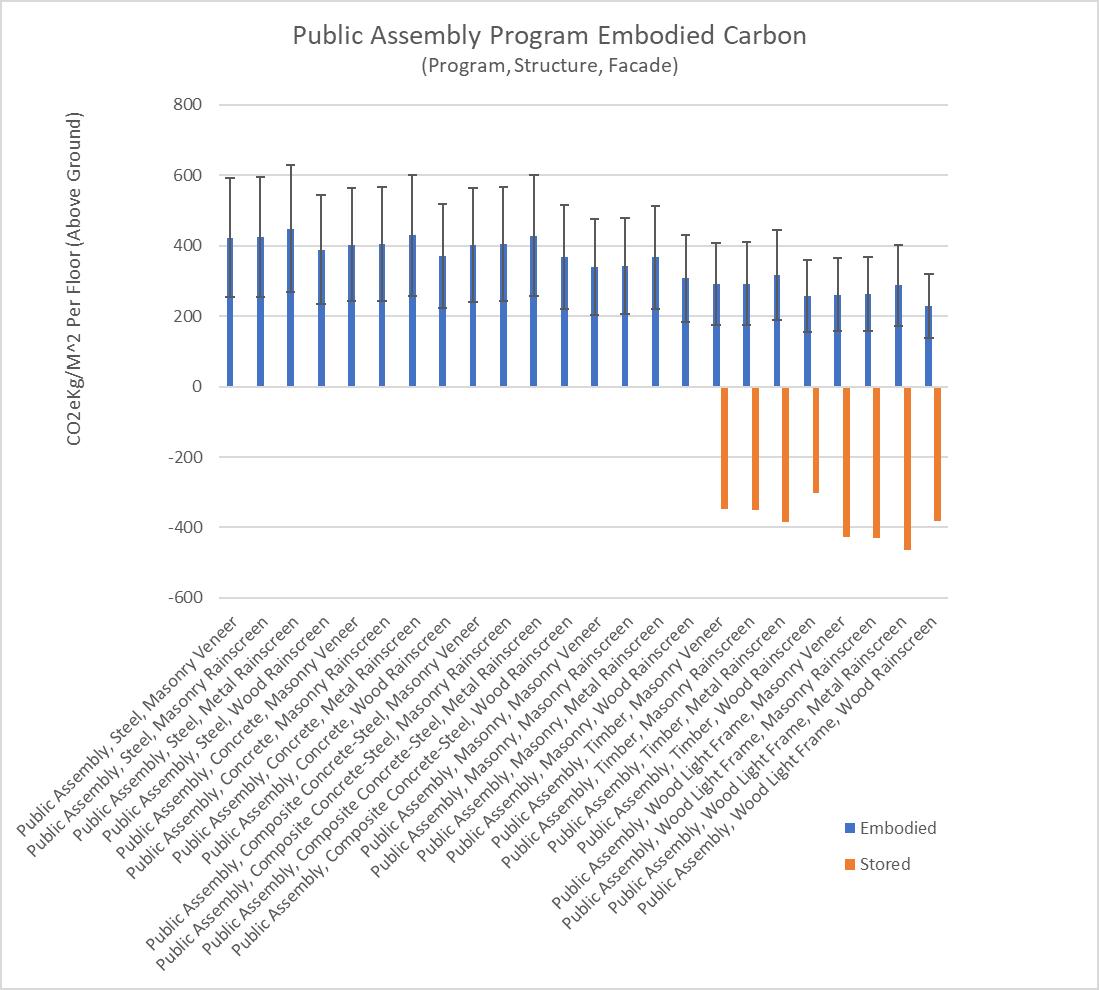
The Architecture land-use typology was broken down into programs based on building use. These programs included O�ce, Educational, Multi-family Residential, Single-family Residential, Mercantile, Mixed-use, Healthcare, Public Assembly, and Lodging Each program had a di�erent profile, developed through a combination of the data accessible through the CLF’s Embodied Carbon Benchmark Study, (CLF, 2017), the Database of Embodied Quantity Outputs (deQo) by MIT (deQo, 2014), and KierranTimberlake’s Tally platform applied to representative Revit models (Kieran Timberlake, 2020) The goal of combining these sources was to provide Carbon Conscience users the option to delve into greater detail in additional tiers of information by specifying the structural system and façade system. We developed each of these building land uses through evaluations of complete buildings, and averaged and divided industry databases by stories to develop high and low estimates of embodied carbon and carbon stored for each building element per square meter per story
CarbonConscienceDatasetIntroduction
To summarize the complexity of the built environment in the comparatively coarse resolution of land-use mapping required di�erent approaches per discipline and were based on di�erent levels of maturity in the available literature All low and high estimates per material, structure, or program reflect a range found in the cited literature, reference projects, or ranges within the specifications of a given material. As the Carbon Conscience application is intended to be a living tool and document, the values for given materials are iteratively evaluated given new information. Version 2 reflects the advancement and restructuring primarily of the landscape dataset; we anticipate releasing Version 3 with advancements to the architectural dataset in 2024. Given the constantly changing basis of understanding of carbon in the built environment, and shifting energy regimes and policies, we anticipate iterative advancements and revisions of the data.
ArchitecturalDatasetOverview
We selected a few key variables that have a major impact on embodied carbon: the building program, the structural system, and the facade material, multiplied by the building area. Using a range of embodied carbon values for each of these key variables derived from recent databases, we can determine a planning-level estimate of embodied carbon for each architectural land use
The Architectural dataset starts with the provision of the range of potential embodied carbon per program type derived from averages per unit area from the CLF 2017 baseline study of over 1,000 WBLCAs (CLF, 2017) These programs are then subdivided into proportions based on facade and structure typology. Facade datasets came from detailed standard Revit models in the Sasaki standards library analyzed using Tally software from the 2020 version (Kieran Timberlake, 2020), and then cross-referenced with Payette’s Kaleidoscope tool to backcheck (Payette, 2023) . The proportion factor for the structure was modified based on the structural database compiled at MIT for the deQo platform (De Wolf, 2014), and then cross checked with Beacon by Thornton Tomasetti (Embodied Carbon Lab, 2023).
For the architectural land uses, after the user defines the program, facade, and structure, a simple linear multiplier is added for floors above ground and floors below ground. Above-ground floors are assumed to have the same average share of structural and facade benefits. This means that prorated carbon costs for exotic structures or skyscrapers will not reflect the exceptional structural carbon costs for said structures Based on a comparison with Tally projections and examples from EPIC, we believe these estimates are reasonable for comparing options for structures lower than 15 stories. For floors below ground, we assume a generic reinforced concrete structure for all typologies. This dataset does not take into account regional variations in EPDs or energy regimes, and it does not take into account complex underground structures or supplemental piers or piles for variable geotechnical conditions. The thought behind this is that geotechnical and structural general requirements will apply for a given site for any building typologies of a certain massing, and so we concentrate where the design or planner has agency with decision-making for lowering potential carbon impacts. To reference the architectural dataset, and backtrack calculations to source data, please refer to the Carbon Conscience website, Table A: Architecture Land Use Carbon Data Set.
ArchitectureLandUses
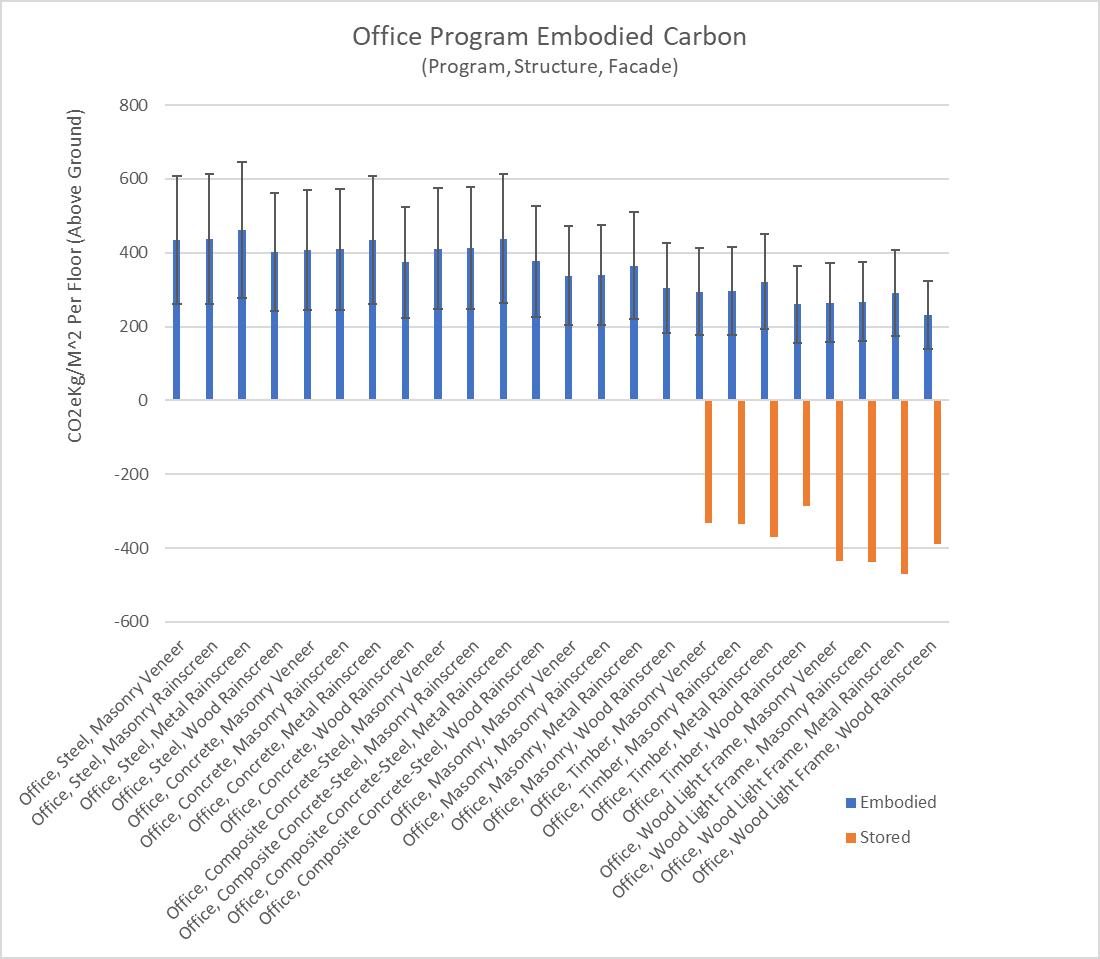
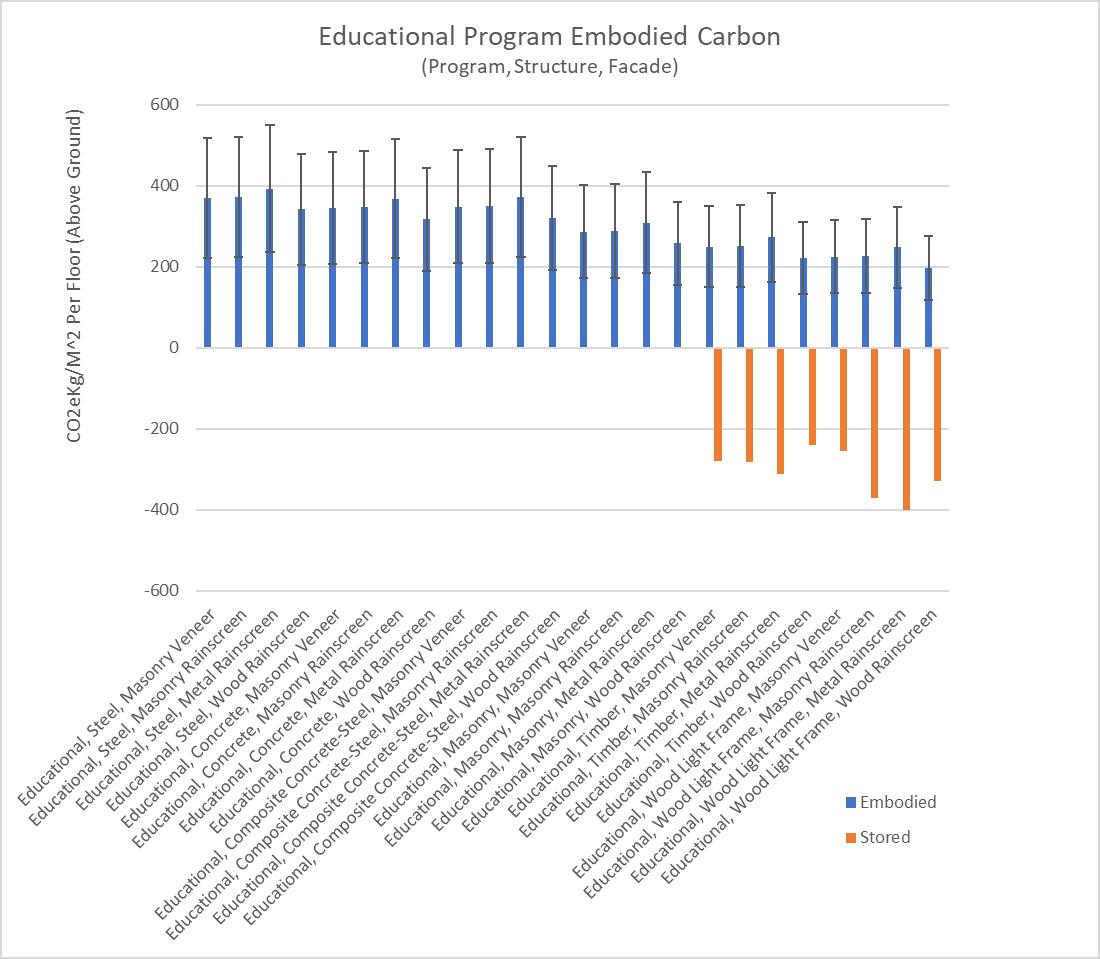
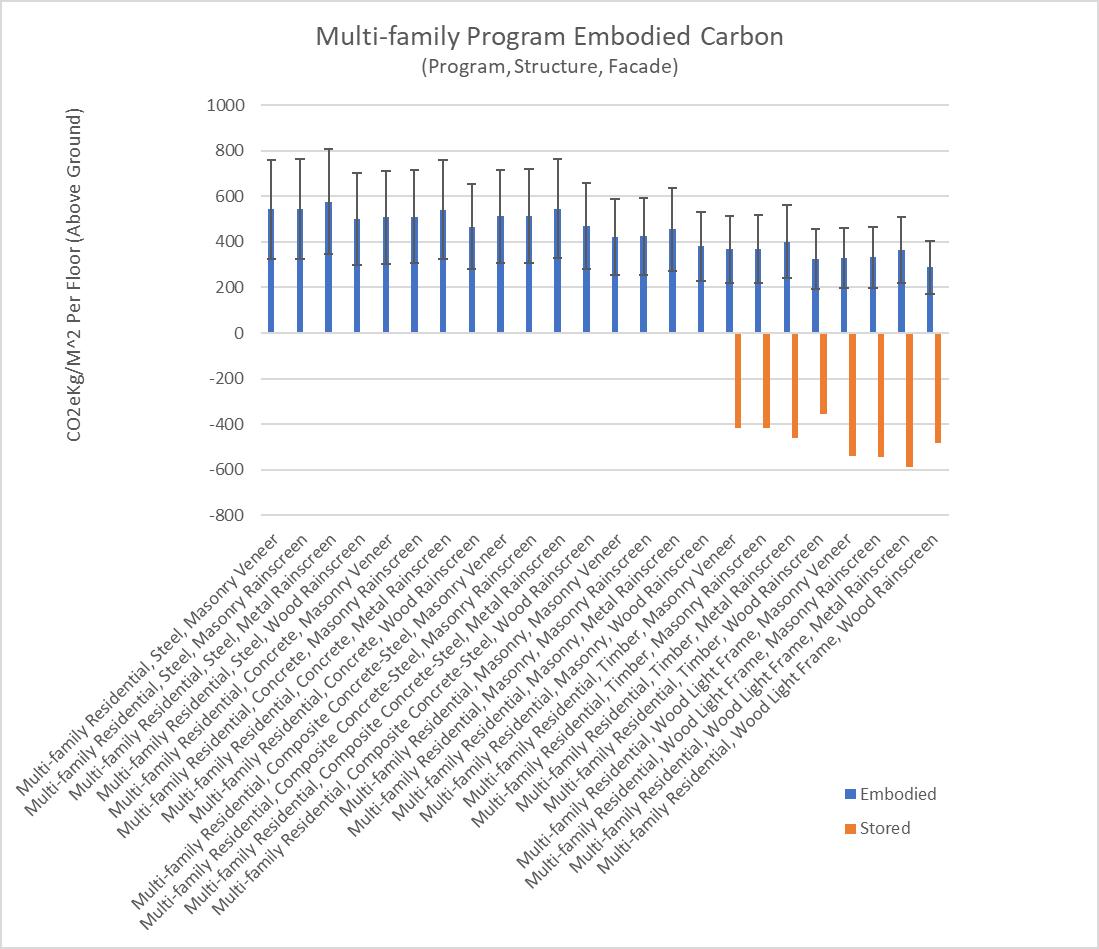
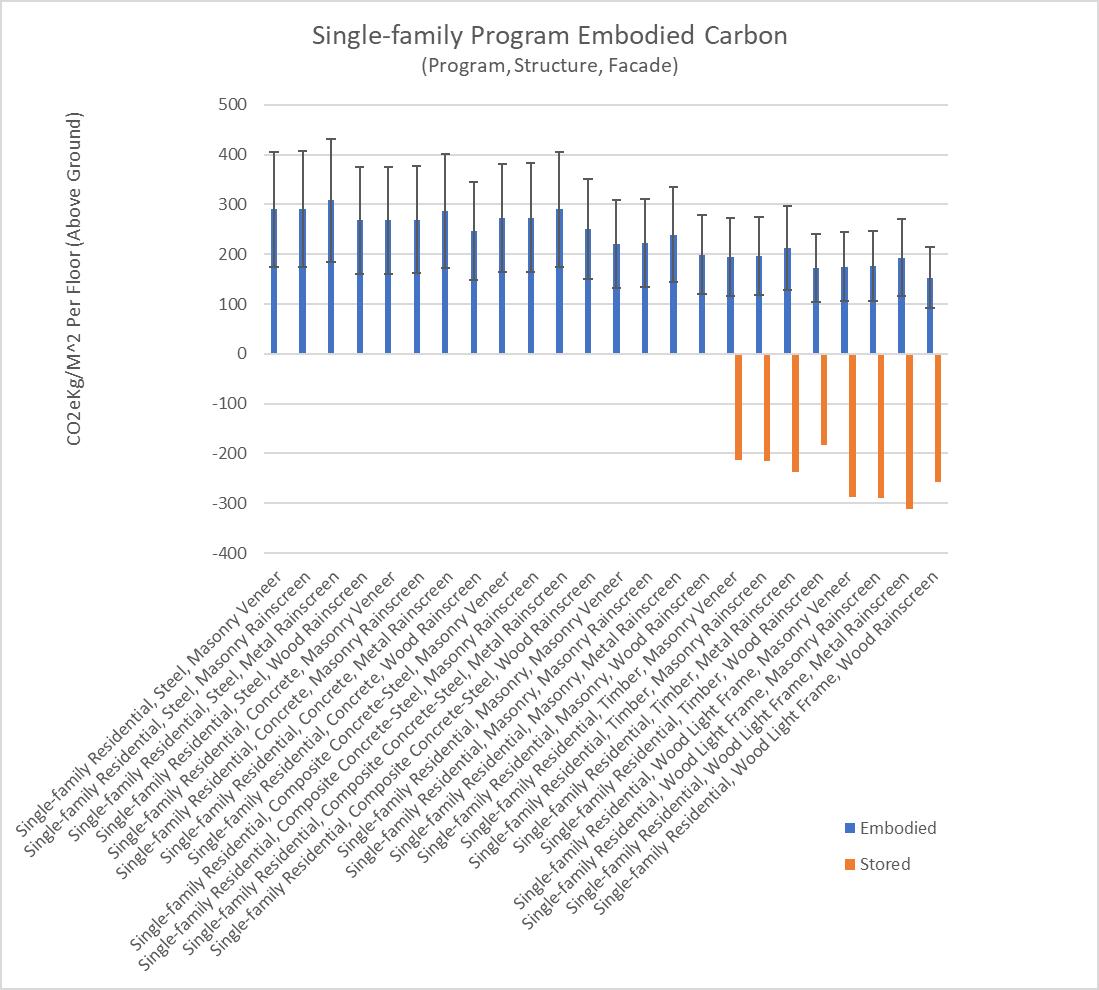
For architectural land uses, start by selecting the proposed building program. Each has a unique embodied carbon estimate sourced from the CLF’s Embodied Carbon Database (CLF, 2017) This database is the largest of its kind for WBLCA embodied carbon reporting, consisting of calculations of over 1,000 built projects across a broad range of program types. Filtered by program, ranges were reported from the database using the lower and upper quartile values for nine program types: O�ce, Educational, Multi-family Residential, Single-Family Residential, Mercantile, Mixed-Use, Healthcare, Public Assembly, and Lodging, and include the full building scope (foundations, structure, enclosure, and interiors). These initial estimates can then be refined by the user by assigning a structural system and facade type to the building, as additional optional tiers are described below.
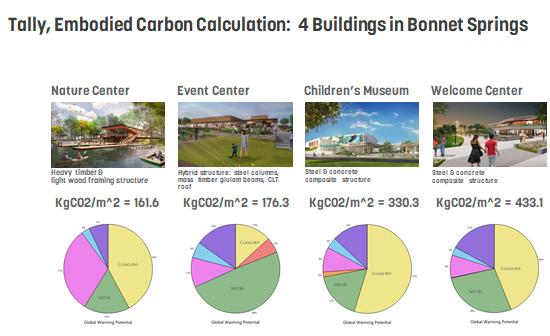 Figure7�ComparingcarbonimpactsoffourbuildingsatBonnetSpringsPark,comparingthreestructural systemsaswellasvariousenvelopeandrooftypeswithTally�ArchitecturebySasaki,Tallyby KieranTimberlake,nowpartofBuildingTransparencyorg)
StructuralSystem
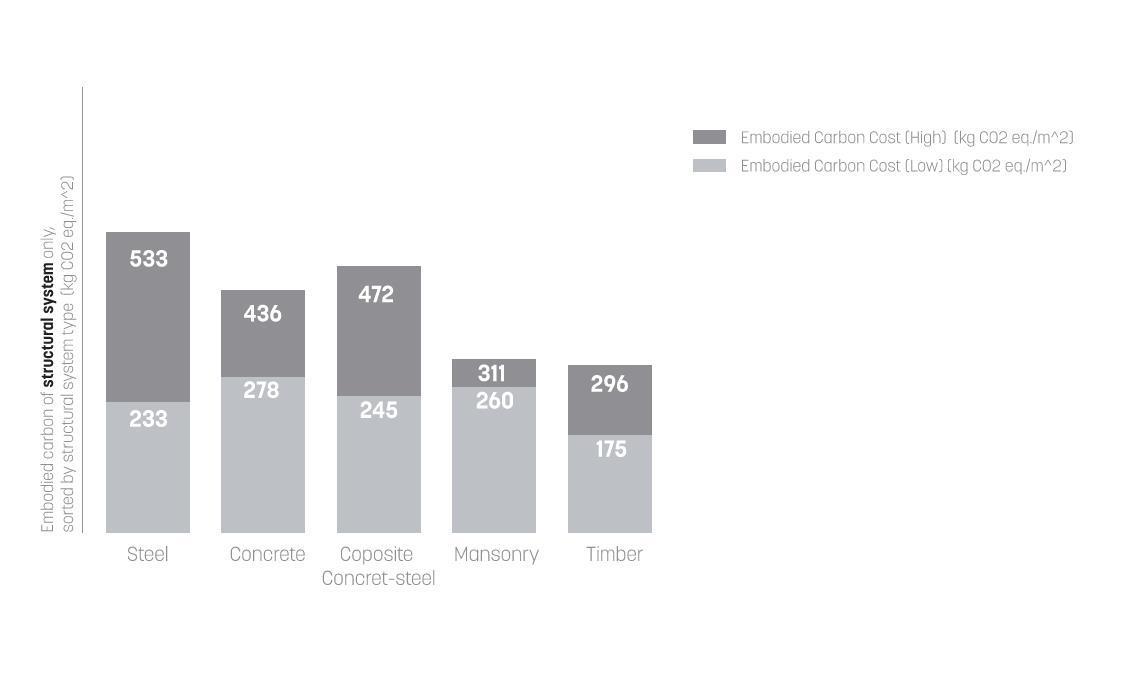
The structural system of a building can account for approximately 75% of a building’s total embodied carbon, according to Sasaki’s internal WBLCA assessments. Other studies have corroborated these findings and posited that up to 80% of embodied carbon emissions are from building structures (Architecture 2030, 2021, 2023a). In the early planning stages of a project, the composition of the structural system is not always known. However, once a structural system can be determined, it can be very helpful in refining the embodied carbon estimate of a project. For our calculator, we have defined six structural categories: concrete frame, steel frame, concrete-steel composite, masonry, mass timber, or wood light frame. To estimate embodied carbon from structure, estimates from the CLF database were refined using the factors derived from the deQo, (De Wolf, 2014). The deQo contains data on both the mass of the structural material of five types of structural systems and their corresponding embodied carbon per building area (CO2eKg/M^2), providing ranges sourced from over 500 built projects.
To represent the structural contribution of embodied carbon to the building and refine the range from the CLF database (inclusive of foundations, superstructure, envelope, and finishes), we used the range as defined by the upper and lower quartiles of each given structural system. We developed factors for each structural system based on each category’s relationship to the average mean value of all structural categories. To refine the CLF database range, we multiplied this structural factor for each category by the original ranges of the CLF data for each program type, to arrive at a more targeted range, more representative of each structural system’s embodied carbon. To represent the significance of the structural systems’ impacts on a building’s embodied carbon, we applied this targeted range modified from the CLF data to 75% of the building’s total embodied carbon calculation, with the remaining 25% to be a modifier based on the buildings’ envelope systems
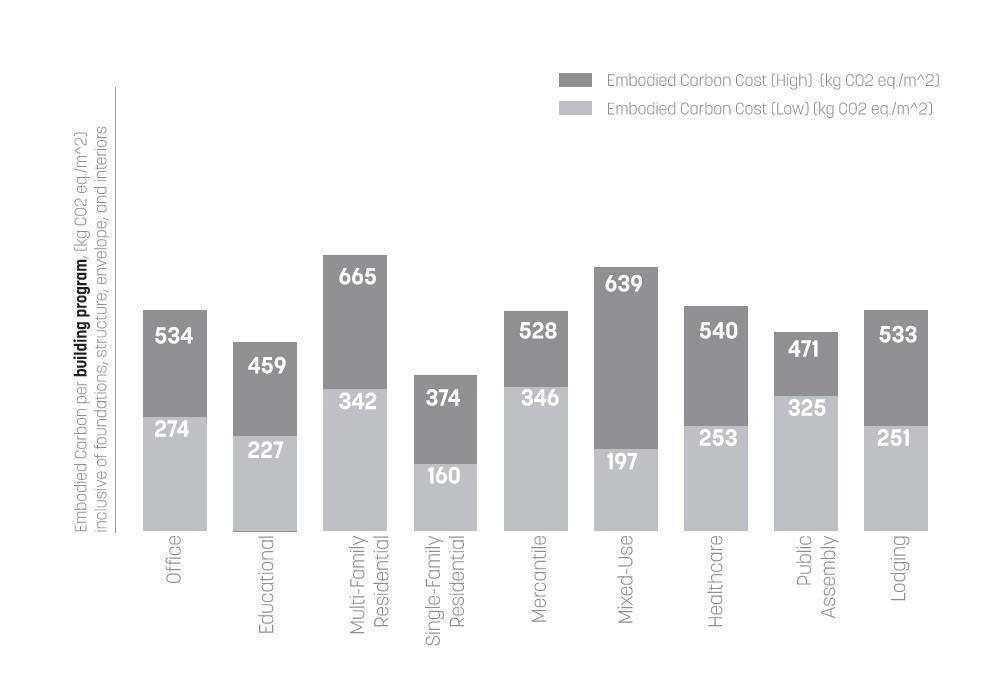 Figure8�Comparingcarbonimpactsbybuildingprogramlanduse,perflooraboveground,basedonthe CLFBenchmarkStudy,�CLF,2017�.
Figure9
Structure:Concrete
Concrete is the most consumed building material; it is durable and widely used in construction across a broad range of project scales, program types, and geographic locations. Given its inherent non-combustibility, not requiring any additional applied fireproofing product, concrete is an ideal choice for tall buildings and has preferential treatment in many building codes, typically allowable for buildings of unlimited height for most program use groups (Hattan et al , 2015; Ochsendorf et al , 2011), giving it a clear advantage over other structural systems for high-rise applications. It is also best suited for below-grade stories and foundations, with its solidity making it an ideal substrate for most waterproofing systems.
However, concrete is extremely carbon-intensive, with the production of cement being the main contributor to concrete’s GWP. Concrete is the highest embodied carbon masonry hardscape material due to the carbon costs of cement fabrication, requiring high energy inputs to produce clinker through sintering, and emitting CO2 as a chemical byproduct of its formation (Athena Institute, 2005; Choate, 2003; FHA, 2011). Concrete has been estimated to account for approximately 8% of the world’s carbon emissions (Lehne & Preston, 2018). Per the deQo, the values for embodied carbon for concrete structures ranged from 278 to 436 CO2eKg/M^2, (inclusive of reinforcing steel,) placing them together with steel among the most carbon-intensive structural systems (De Wolf, 2014, 2017)
A substantial ongoing e�ort exists in the construction industry to mitigate the embodied carbon emissions of concrete through a range of strategies, including the reduction of the quantity of cement in concrete mixes and its replacement with supplementary cementing materials (SCMs) such as slag or fly ash, as well as carbon capture technologies (Jafari, 2021). Since various forms of concrete are prevalent in many building components (floor slabs, foundations, and below-grade stories) these are key considerations for reducing the embodied carbon of architecture.
Structure:Steel
Steel structures are also well-suited to a broad range of building programs and scales. When protected by either applied fireproofing or enclosed by fire-resistance-rated assemblies (most often gypsum wallboard,) it is considered a Type I structural system and can be used on buildings of almost any size and program use group (ICC, 2021). Per the deQo, and cross-referenced with Beacon, the values for embodied carbon for steel structures ranged from 233 to 533 CO2eKg/M^2, a broader range than concrete, with the upper limit being the highest of all structural systems evaluated (De Wolf, 2017; Embodied Carbon Lab, 2023).
The embodied carbon impacts of structural steel are most a�ected by the recycled content of the steel itself, and therefore, by the availability of scrap steel material While recovery rates are high, globally in 2020, the amount of recycled steel used in structural steel production was only approximately 26% of total global steel production, (Nicholas & Basirat, 2021), and primary steel requires a more carbon-intensive production method using a basic oxygen furnace, which requires nearly three times as much energy to produce as recycled steel produced in an electric arc furnace (De Wolf, 2017)
E�ective strategies for reducing the embodied carbon of structural steel include sourcing steel from facilities utilizing recycled scrap materials, producing steel with electric blast furnaces, and designing structural systems for maximum material e�ciency.
Structure:Composite
Composite concrete-steel structures encompass a range of di�erent configurations, but all utilize the structural characteristics of concrete and steel to achieve material e�ciencies, as well as a reduced structural depth for horizontal members This can be an advantage for high-rise projects where floor-to-floor heights are especially critical for marketability and e�ciency. Per the deQo, the values for embodied carbon for steel structures ranged from 245 to472 CO2eKg/M^2, with the uppermost range being lower than that of both concrete and steel systems (De Wolf, 2017). Design strategies for minimizing embodied carbon of this structural system include the use of hollow-core precast planks to minimize the volume of concrete required for floor slabs.
Structure:Masonry
Masonry, along with timber, is a relatively low-embodied carbon structural system, with its range in deQo being 266 to 311 CO2eKg/M^2 (De Wolf, 2017). Applications of masonry structural systems are generally limited to six stories in model building codes when the exterior load-bearing walls are masonry (ICC, 2021), and are limited accordingly in the Carbon Conscience application.
The variability of the embodied carbon of masonry structures is due to two key factors. The first is the composition of the masonry units used (most often concrete masonry units (CMU)), brick, or stone. When specifying CMU, the cement content of the masonry units itself, as well as that of the mortar binding the units together, is an important consideration The second key factor when designing masonry structures is the complementary structural systems. While masonry is well-suited for vertical applications such as load-bearing walls, the horizontal elements of this system (beams and decking) are typically composed of wood, steel, or reinforced concrete.
Structure:Timber
Use of natural materials such as wood has clear benefits in reducing upfront embodied carbon in buildings Timber sequesters carbon by transforming carbon dioxide in the atmosphere through photosynthesis. If timber is harvested from sustainably managed forests, a range of timber and lumber products are the lowest possible embodied carbon structural systems for buildings. In Carbon Conscience, we considered the carbon dioxide equivalent stored as a negative carbon value, following the LCA practice of biogenic carbon neutrality, as codified in EN building codes (EN Code 16485, 2014)
The use of mass timber has grown rapidly over the last decade and is employed in an expanding range of project types and scales. As continued laboratory testing and built projects have demonstrated its capabilities, it was approved for use in the 2021 International Building Code for buildings up to 18 stories tall, when certain conditions are met to enhance the innate fire resistance rating of the timber structure (ICC, 2021; Place et al., 2021; Structurlam, 2022). By using cross-laminated timber (CLT) for floor and roof slabs and exterior walls, and glulam beams and columns, entire structural systems, excluding foundations, can be constructed of mass timber elements; these structural systems would otherwise require substantial amounts of concrete and steel. Many applications of mass timber construction allow these elements to be exposed to view due to their inherent fire resistance properties, allowing for material and embodied carbon e�ciency by avoiding additional finishes and enclosures
Per the deQo, timber structures ranged from 175 to 296 CO2eKg/M^2 (De Wolf, 2017). Given that softwood species are about 50% carbon by weight, mass timber can e�ectively store atmospheric carbon, which, when paired with sourcing from sustainable forestry practices, can result in a reduction of atmospheric carbon (R. Bergman & Bowe, 2008; Bushi, 2022). CLT can also be used in hybrid structural systems paired with either steel or concrete, reducing the carbon intensity of floor slabs, which in commercial structures contribute 47% of the structure’s embodied carbon (Embodied Carbon Lab, 2023; Pierobon et al , 2019) Mass timber structural systems, or hybrid structural systems employing mass timber elements, are strongly encouraged to be considered for all new construction project types and scales to reduce overall embodied carbon impacts.
A wood light frame is a common structural system for low- and mid-rise residential and commercial project types and uses dimensional sawn lumber and engineered lumber as the primary structural elements for exterior load-bearing walls, beams, and roof framing. Due to the use of smaller dimensional members, there is a certain economy to these systems for both construction cost and material quantities While this structural system has the lowest embodied carbon impacts of all structural systems, based on precedent studies it has been assigned a range of 150 to 258 CO2eKg/M^2 (Athena Institute, 2020a; Embodied Carbon Lab, 2023; Himes & Busby, 2020; Perez-Garcia et al., 2005) It is also the most limited in the range of project types and scales for which it can be employed Wood light frame construction is often used in single-family residential, multi-family residential, and mixed-use programs in projects up to six stories above grade when paired with non-combustible stories at grade used in a podium configuration, (ICC, 2021).
BuildingFacades
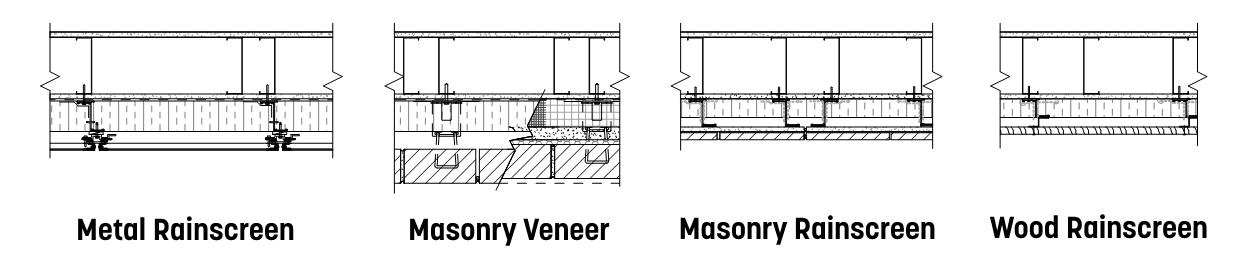
Once the building program and structural system has been determined, the next tier of information used to refine a building’s embodied carbon is its facade material The Carbon Conscience application
considers four types of facade systems: masonry veneer, masonry rainscreen, metal rainscreen, and wood rainscreen. We determined the embodied carbon of each facade type by Tally analysis of Sasaki’s library of standard exterior wall assemblies (Kieran Timberlake, 2020) We analyzed each facade cladding type using three exterior wall backup types: cast-in-place concrete (assumed 8 inches thick), concrete masonry units (assumed hollow, nominal 8 inches thick), and cold-formed metal framing (assumed 6 inches deep, 16 gauge studs at 16 inches on-center). We analyzed 24 of these assemblies using Tally’s Full Building Assessment method, and grouped the results for GWP, expressed in kgCO2e/M^2 were grouped into four facade groups: masonry veneer, masonry rainscreen, metal rainscreen, and wood rainscreen. The results of these in-house calculations were corroborated by Payette’s Kaleidoscope facade carbon calculator tool, released in 2020 (Payette, 2023).
The contribution of the embodied carbon to the Carbon Conscience application’s calculation is an average of all assemblies within the facade group. Each facade group is then weighted against the average of all, to derive a modifying factor. The product of this factor and the CLF average of embodied carbon per building program yields the embodied carbon value for the remaining 25% of the building’s total embodied carbon, with the other 75% being sourced from the structural factor.
FacadeGroups:GeneralAssumptions
● All facade types that were modeled shared some common components:
○ 3-inch high-density mineral wool continuous insulation
○ Air barrier for concrete substrates: self-adhered sheet air barrier applied directly over cast-in-place concrete and concrete masonry unit substrates
○ Air barrier for cold-formed metal framing substrates: ⅝ inch fiberglass mat gypsum sheathing modeled as the substrate
● Metal Rainscreen: this group of rainscreen panel claddings includes aluminum composite material (ACM) and metal plate panel rainscreen systems and their related subframe The average GWP of this category was the highest of the four
● Masonry Veneer: this group includes masonry-type exterior claddings between 2 and 4 inches thick, composed of brick, precast concrete, and stone anchored with galvanized steel masonry ties or stone anchors. The continuous mineral wool insulation is assumed to be installed with fasteners
● Masonry Rainscreen: this group of thinner masonry panel rainscreen cladding systems is less than 2 inches thick, and includes precast concrete and terracotta systems and their related subframe.
● Wood Rainscreen: this group of rainscreen cladding consists of domestic softwood species installed horizontally over the subframe. Given the low embodied carbon of wood cladding, including its potential to sequester carbon, this category has the lowest GWP of the four.
Figure10�Exteriorwallassemblydetailsofeachfacadegroupanalyzedforarchitecturallanduses
In many areas of our research, we identified a range of metrics, methods, or results for the various carbon factors investigated. As a result, we realized the need to provide a range estimate for embodied carbon per land use based on the ranges found in literature and accounting for variation in the potential detailing of constructed elements. For certain elements, we extrapolated for specific assemblies based on data from similar or comparable elements found in the literature The Architectural data set currently reflects the literature review conducted from 2018 to 2020, with an anticipated update in Carbon Conscience Version 3, planned for 2024. Note, the Landscape data set is updated as of Carbon Conscience Version 2, 2023.
LandscapeDatasetOverview
At the start of the Carbon Conscience research, a baseline materials dataset for landscape design and construction did not exist. The pioneer application Pathfinder primarily cited the Athena Institute dataset and did not address civil engineering or restoration ecology-associated assemblies and land uses To broaden the WPLCA boundaries to include all site scopes, this literature review focused first on creating a baseline materials dataset for all typical materials used in landscape architecture and civil engineering, with the ambition of this baseline materials dataset becoming a common platform to support Carbon Conscience for planning and concept phases, and perhaps other applications such as Pathfinder and other future applications for detailed design phases This ambition required a higher degree of research to cover the ground already aggregated for architectural studies but was limited by time. As such, we make no claim to the comprehensiveness of this dataset but put it forward as a basis for ongoing curation and collaboration.
The landscape dataset is organized into five sheets that collectively provide a step-by-step approach to generating land-use carbon impact assessments. These tables can all be accessed through the Carbon Conscience website, Carbon Conscience Version 2 Landscape Data Set. Table 1: Materials Carbon Data, includes a group of tables that cover global assumptions, carbon factors for materials, and a summary of the carbon sequestration data. Generally, values for materials are provided as carbon dioxide equivalent in kilograms per kilogram of material; in some cases values are provided per unit area. This table is the source data for Table 2: Site Elements Data. The Site Elements Data includes specific elements and provides a volume factor to achieve a percent per cubic meter, and then uses material densities per cubic meter to provide the mass of each element. This mass is then multiplied by the associated carbon factors. In addition, this table includes dropdown options sourced from Table 1 for specifying options between materials, such as percent recycled content, or cement substitution assumptions This table takes the mass of the element and multiples it by the transportation factor and distance assumptions both of which have options that are editable in
Carbon Conscience Version 2. This table includes the first results of embodied, stored, and sequestered carbon per element per square meter, inclusive of transportation, and the global construction contingency
Table 3: Site Land Use Dataset, is the finished dataset per land use. Each land use includes a detailed set of Land Cover assumptions, inclusive of percentages of types of site elements. These are then summed by land use, resulting in the overall output values for a given land use The details of the Site Elements and Land Use data tables are not detailed within this paper as they are a collection of assumptions for a given land use developed primarily by the authors’ built work experience and through references from key project examples at Sasaki, as well as in review from peer professionals, engineering partners, and Atelier Ten We do include in detail within this paper the methodology of developing the materials’ and ecosystems' carbon metrics, as those values are the baseline input data taken from cited sources. All assumptions per site element and per land use are detailed within the tables themselves and made transparent within the Carbon Conscience Land Use Editor.
This overall linear structure was a major revision in Carbon Conscience Version 2, to allow for easier and more iterative editing of carbon factors in the future, and to allow for users to take more control over modifying key assumptions within a given land use description In the application, the additional customization that is now provided is the ability to define land uses as a composition of multiple percentages of di�erent pre-stocked land uses, including the ability to have more than 100% of land use coverage. With over 230 landscape land uses and over 200 architectural land uses prestocked, the ability to mix land uses to better approximate designers' intent has limitless combinations The ability to have over 100% coverage now allows designers to add demolition land uses as another layer in a defined user land use, or to add composite assemblies, such as adding residential floors on top of commercial floors, or adding a green roof landscape land use on top of an architectural land use.
LandscapeMaterialsCarbonData
The following sections of the methodology dive more deeply into the methods and assumptions, including the cited data that serves as a basis for the land-use projects. Due to the size of the tables, the full dataset is not included in this paper, but links to the dataset for review are included. Please note that the creative commons license applicable to this paper extends to the dataset and application itself For a detailed review, we recommend reviewing this narrative in parallel with reviewing the spreadsheets. The tables include narratives to clarify assumptions as well as citations and methods throughout.
Table 1: Materials Carbon Data is as mentioned above the baseline materials data set Table 1a includes global modifiers. These are factors referenced in the Site Elements table to modify specific assumptions and contingencies for a given site element.
InstallationContingency
The first global modifier, which is not editable by users, is the Installation Contingency. This is the factor added as a global contingency to a given element's embodied carbon to account for the carbon emitted through on-site installation and workmanship, accounting for A5 LCA phase carbon costs per ISO 1040 / EN 15978 This is added as a percentage: low 1%, Average 3%, and High 4% These
percentages are entirely sourced from WBLCAs that broke out A5 stage costs: the high range from an aggregate study comparing various wood versus steel structures (Puettmann et al., 2021), and the low range from some more typical university building structures (Kumanayake & Luo, 2018) No studies were found looking at installation construction carbon cost (A5) assessments for complex built landscape projects; we note this would be a valuable research opportunity.
SupplementaryCementingMaterials
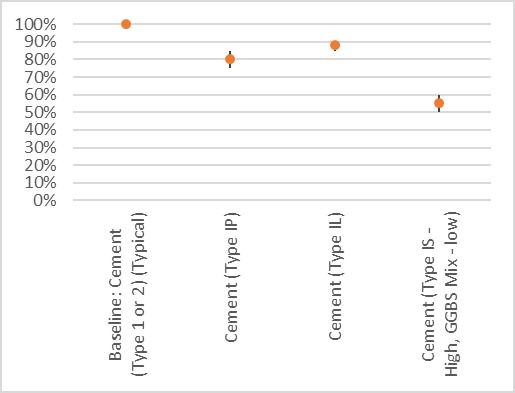
Table 1a also includes modifiers for cement substitution options with SCMs, citing percentage savings for Type IP, IL, IS, and GGBS. These substitutions can have a huge impact on emissions of concrete, which is usually the single highest GWP material in typical landscape designs due to the combination of the relatively high carbon factors and large amount of material used Typical cement has a high carbon factor due to the embodied emissions associated primarily with the manufacturing of the clinker through crushing and heating limestone (Athena Institute, 2005). Another factor is the weight of the material, which has high transportation to site costs, as well as the replacement cycles in the landscape; typical exterior concrete can last as little as 20 to 50 years depending on the climate (Antti, 2013; Choate, 2003; Johansen et al., 2006). In general, all types of cement and concrete used in Carbon Conscience assume a generic 4,000 PSI, and a baseline Type 1 or 2 Cement. The percentage savings in Table 1a are predicated on that comparison. The values for savings were mostly taken from the aggregate study by the Rocky Mountain Institute but also cross-referenced with academic study and U.S. Federal Highway Association standards (Cannon et al., 2021; FHA, 2011; Lehne & Preston, 2018).
Figure11�PotentialcarbonsavingsperSCMalternativeincludedinCarbonConscienceVersion2
We added SCMs to this baseline dataset as percentage factors, as specific cement and concrete EPDs can vary widely by region, but the propionate savings per SCM are relatively static. However, we note that SCMs are only included as a modifier for the users to elect to edit within a land use, as many SCMs are geographically limited, and some are not appropriate in all regulatory contexts.
Asphalt
Similar to SCMs, the modifier table includes a few strategies for global modifications to hot-mix asphalt (HMA) materials The first is the use of wax additives Sasobit brand (and similar wax products) can be added to asphalt mix to lower the working temperature necessary for HMA, saving as much as 10% of the total embodied carbon for asphalt (Almeida & Sergio, 2019; Gao et al., 2018; Gui et al., 2022; Hamzah et al., 2010). Another strategy included is the use of recycled rubber blend the more recycled rubber used the lower the embodied carbon (up to 26% savings) (FHWA, 2014; Wang et al., 2020). Sasobit and recycled rubber can also be combined for higher savings, but we note not all state DOTs accept these additives, and they are most commonly used in warm climates (Wang et al., 2020).
RecycledContent
The last global modifier in Table 1a includes percentage savings for recycled content. Using recycled content is the single best way to reduce emissions associated with plastic, rubber, and metal materials, but it is not a one-to-one savings to the process and refining of the recycled content This table includes percentage modifiers that are mostly taken from the EPA iWarm database but also cross-referenced with additional academic studies looking at specific recycled material manufacturing pathways (Antti, 2013; EPA, 2023; GLE, 2018; Mohan, 2016; Shash et al., 2014; Sizirici et al , 2021; Stephen, 2020) We used these percentage factors as rough coe�cients for typologies of materials. For example, recycled steel savings are applied to cold and hot-formed, galvanized, and stainless steels uniformly, and do not account for the relatively small variations between typologies of steel.
Transportation
Table 1b includes the transportation values and assumptions. Raw factors of emissions for the transportation of materials are collected from the EPA emissions factors database which sets the standards for all transportation emissions reporting (EPA, 2022) These factors are split between truck, rail, shipping, and plane typologies, and report in carbon dioxide, methane, and nitrous oxide. In our table, we convert methane and nitrous oxide to CO2e by multiplying by the equivalent radiative forcing factor ( 1 unit of methane = 25 units of CO2, 1 unit of nitrous oxide = 298 units of CO2) (EPA, 2022) In Carbon Conscience Version 1, we assumed all transport was trucking After informal interviews with Hill International, Davis Construction, Structural Stone LLC., and BrightView representatives during ongoing construction projects, this assumption appeared to be overly simplistic. While in the United States trucking is the default for most landscape materials, for extremely heavy, durable materials, such as dimensional stone, aggregates, or sand, long-distance transportation is generally more economically feasible through a combination of rail and trucking. For materials sourced from abroad, such as tropical timber, or manufactured products, usually these goods are shipped rather than trucked from Central America or Asia. Version 2 now has transportation modifiers per site element, where the user can be more specific, and select between hybrid rail+truck, hybrid shipping+truck, hybrid air+truck, and a ‘null’ set - defined as assuming entirely by bicycle or renewable energy for transit.
Emissions associated with transportation are just accounting for the emissions for fuel burned Emissions associated with embodied carbon of the vehicles themselves (or calories for a cyclist) are not accounted for. In addition, this dataset includes distance assumptions, including Onsite (moving the element 1 km or less), Hyper-Local (16 km), Local (160 km to correspond to LEED 100-mile radius targets), Regional (800 km), and Long Distance (4800 km) These values are broad generic assumptions, and in the prestocked land uses, a general rule of thumb has already been applied, that materials such as concrete, gravel, or soil that are typically locally available in the U.S. are pre assigned as local, and materials that are international in origin are noted as Long Distance, for example The users modify these assumptions within the land uses, which we encourage, to promote maximizing commitments to and consideration of local procurement.
HardscapeMaterialsCarbonData
The most significant aggregation of information within the literature review is collected in Table 1c: Landscape Materials Carbon Data. This table is the baseline materials survey, bringing together hundreds of citations for over 100 di�erent landscape materials. The format of the table includes the general category of the material, the material's unique name, the low carbon factor (LCf), the median carbon factor (MCf), and the high carbon factor (HCf) Within Table 1c, all carbon factors are converted to CO2eKg/Kg material for comparison sake. The MCf in some cases is a true median value when enough data points (greater than five individual citations) are available to run a reasonable box plot, with LCf and HCf representing standard deviations above and below the median. For materials with few or single references, the median may be a simple average, and low and high values simply reflect low and high values found in cited material. Super References are sometimes elected to be used as single citations; they include either industry-wide EPDs for a given material, or baseline materials reports that already study aggregated EPDs, like the CLF 2021 Baseline Materials Report (Carlisle et al., 2021) To understand the rationale behind individual materials, please refer to the Assumptions and Citations columns within the spreadsheet.
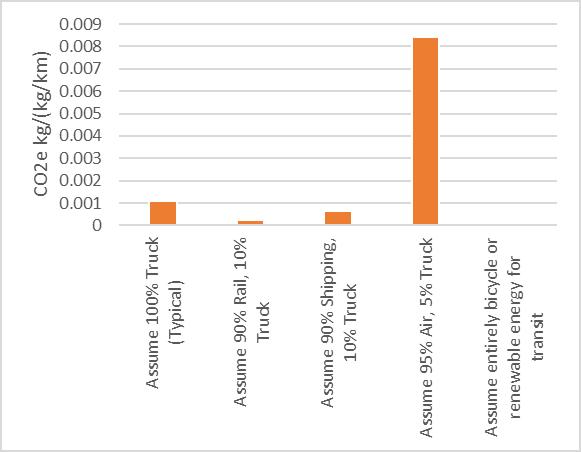 Figure12�Comparingemissionsbetweentransportationtypologies
A complication for the Landscape Materials Carbon Data tables (and part of the reason there was not a landscape architectural version of a Baseline Materials Report) is that as an industry, landscape material vendors and suppliers are relatively new to LCA and EPD reporting. Landscape architects have increasingly become aware of the need for EPDs with the work of Climate Positive Design and Pamela Conrad. In 2022, the American Society for Landscape Architecture (ASLA) released its first Climate Action Plan, which includes recommendations on EPDs and carbon accounting The ASLA Climate Action Plan was the first commitment from ASLA, the largest professional association of landscape architects in the world, to climate action, and is inaugurating a subsequent sea change in climate-associated education, research, and best practices within the discipline and tangentially with the landscape materials vendor community (ASLA, 2022)
Due to the relatively recent awareness of EPDs for the landscape materials industry, few EPDs were previously available. However, many material typologies cross disciplines, such as concrete and steel, so when EPDs were available we used them as the priority to develop carbon factors While the dataset is intended for global use, in general, we preferred North American EPDs and references for use in developing carbon factors, and only when an insu�cient amount of North American EPDs were available did we extend to other international EPDs (preferring EPDs meeting ISO 14040 or 14025), or academic LCA references In general, we found North American data has higher carbon factors than the UK, EU, Australia, and China, largely due to the proportionate use of fossil fuel energy, and is accordingly more conservative in determining carbon factors. Note, EPDs vary in reference between A1-A3 and A1-A5 We chose to select data from A1-A3 phases in general, as usually 90%+ emissions or more are in A1-A3 (Athena Institute, 2022), and A4 and A5 are covered by transport and fabrication factors in our global assumptions.
Within Table 1c, new materials with a specific carbon factor include relevant citations For derivative materials, the citations are not repeated For example, Concrete (1:2:4, type 1 or 2) (Typical) is cited with the range of values found with the Super Reference highlighted: L.179, M.236, H.324, (Carlisle et al., 2021), 0.1-0.107 (Mohan, 2016), 0.23-0.48 (Athena Institute, 2005), and .03-.057 (Hammond & Jones, 2008) For the derivative materials, Type IP, IL, and IS, they are simply the typical material multiplied by the percentage factors in Table 1a. To see the citations justifying the percentage savings of Type IP, for example, refer to the associated citation in Table 1a ((Cannon et al., 2021), (Lehne & Preston, 2018), (FHA, 2011)). Note, these citations are written here in the format of the current tables, and not matching the typical APA format within this paper for multiple references
A conceptual di�erence between most architectural baseline materials reports and how landscape architecture and civil engineering scopes are designed and built is the comparative lack of repetition in site design In architectural datasets, there are generally complex, multi-material, products defining assemblies that are more or less repeated hundreds or thousands of times in a given building, and as such bills of quantities of specific products (such as a window assembly) times the associated product EPD for GWP is both a viable and logical method for carbon accounting. For landscape and civil engineering, large volumes of simple materials are often composed in bespoke ways, with the percentage of materials used on a given project heavily weighted to pavements, walls, soils, and infrastructure, with relatively small amounts of materials in furnishings and lighting. To account for
this, both Pathfinder and Carbon Conscience focus first on volumetric quantities of pure materials to define quantities of landscape assemblies.
In the following charts, common materials used in landscape architecture are shown in the light of their pure carbon factors (Co2ekg/kg), and an estimate of the cradle-to-gate embodied carbon to deliver one cubic material to the site (assuming truck shipping for 100 kilometers for all materials). When comparing materials, we recommend reviewing the cradle-to-gate estimates for evaluating pure materials, as most designers can better compare materials by volume. In all charts, the dots indicate median value with low-high lines indicating Q1 and Q3, or simple low-high values where there was insu�cient data to produce a box plot assessment.
In each of the charts, replacement costs for materials that break down in 60 years or corrode are not included. The carbon factor is only considering material extraction and fabrication of embodied carbon, and the cradle-to-gate estimate only includes transportation to the site, but not on-site assembly or replacement cycles Note the Carbon Conscience model does include replacement costs and installation contingencies in the development of the site elements tables and they are also included in land use estimates.
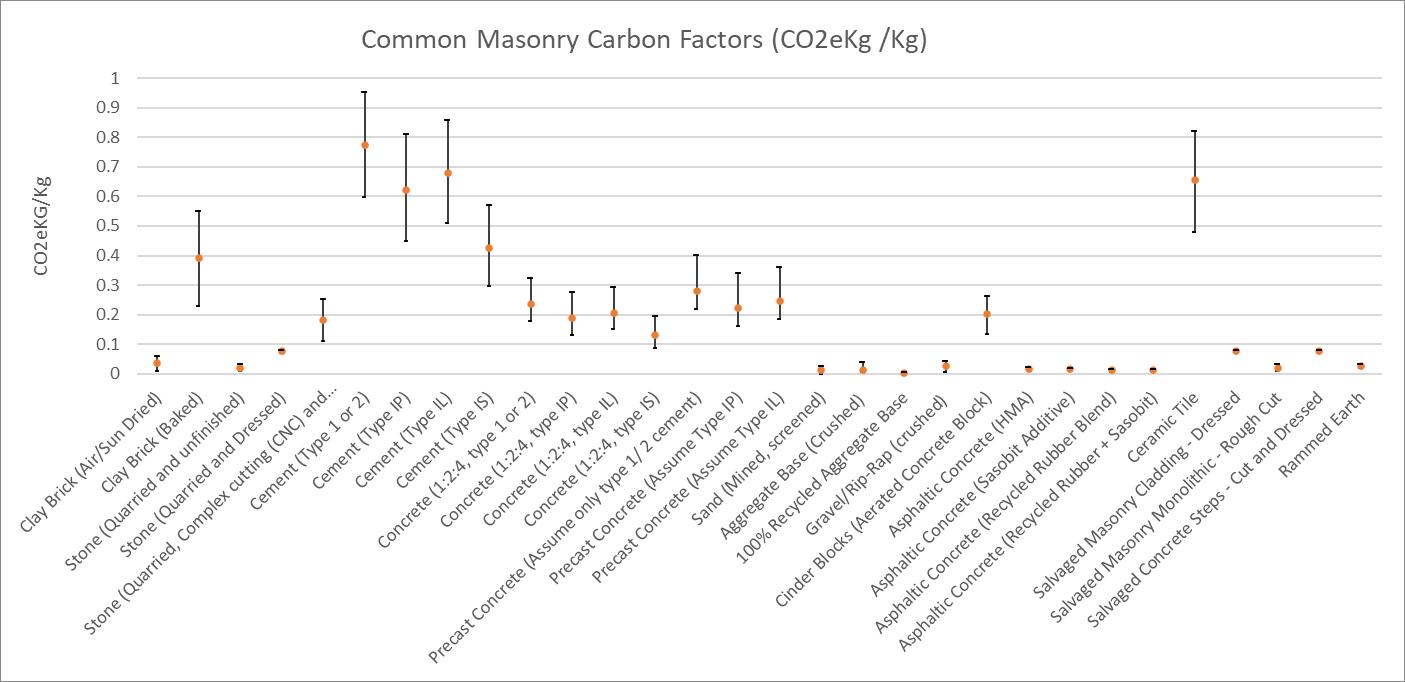
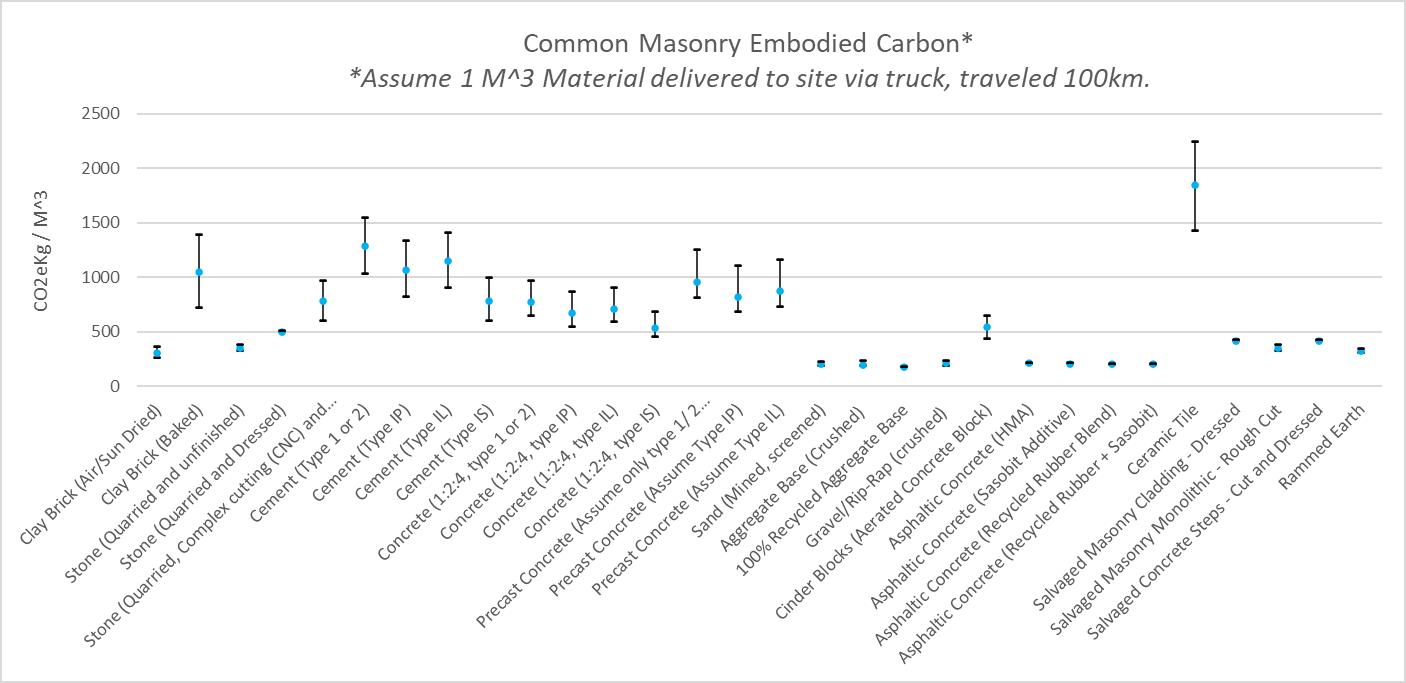
Carbonfactorsforcommonlandscapemetalmaterials.Thetopchartshowsthecarbonfactor ratioascarbonemissionspermassofmaterial Thebottomchartshowsembodiedcarbonofacubicmeter deliveredtothesite,havingtraveled100kilometersonatruckintransit.
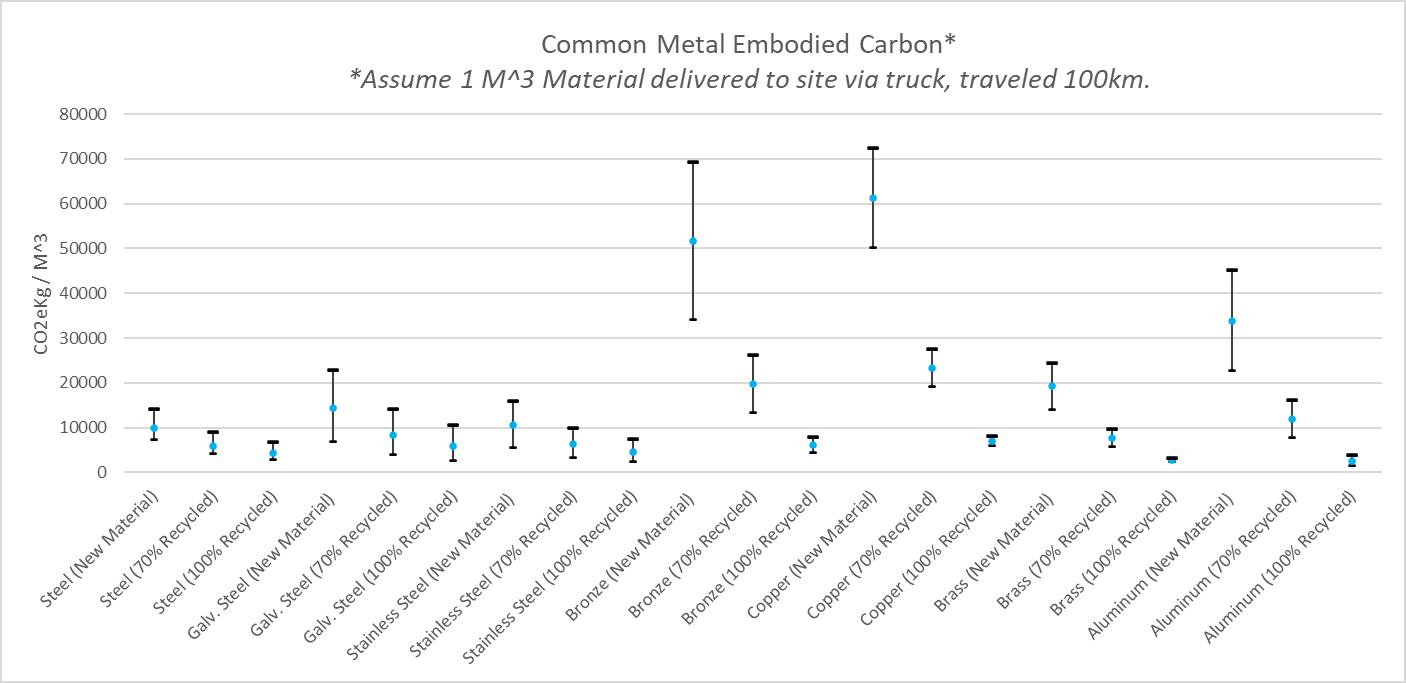
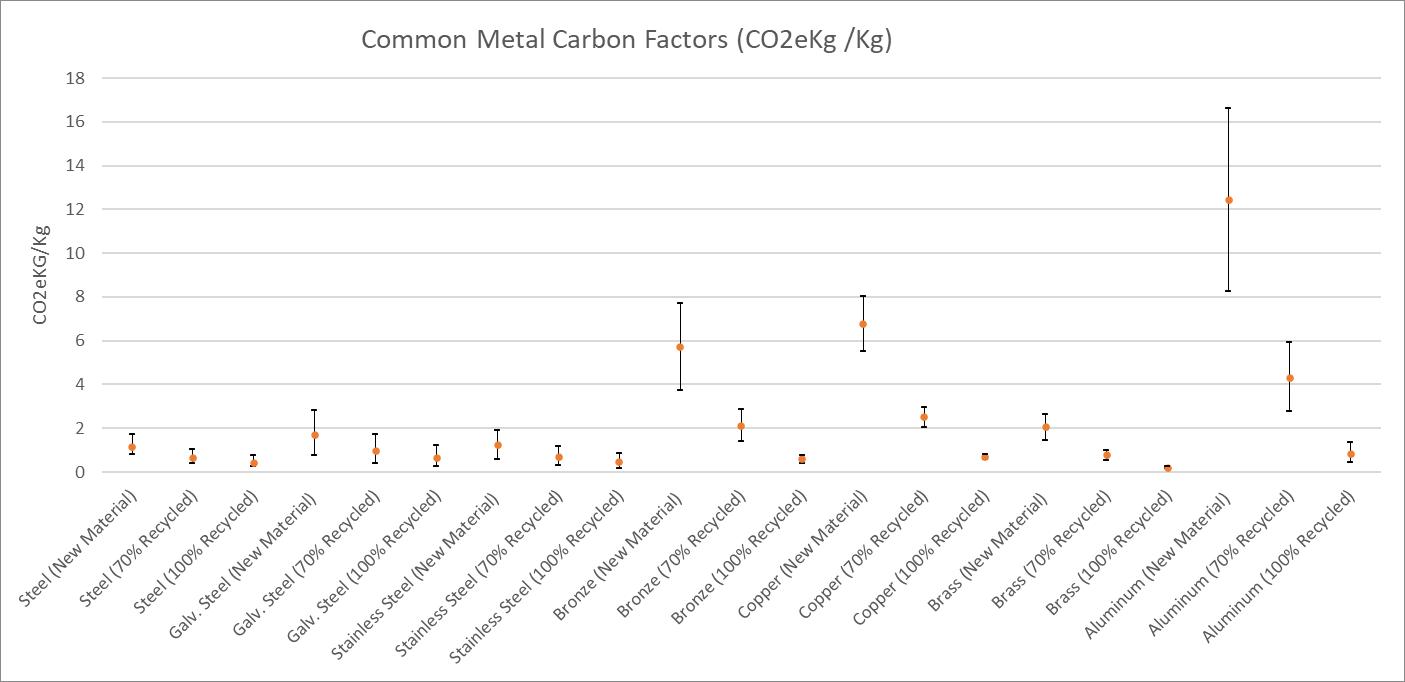
Figure15�Carbonfactorsforcommonlandscapewoodmaterials Thetopchartshowsthecarbonfactor ratioascarbonemissionspermassofmaterial.Thebottomchartshowsembodiedcarbonofacubicmeter deliveredtothesite,havingtraveled100kilometersonatruckintransit,aswellasshowingthecarbon storedinthewoodandthenetGWPpotential.Note,weassumesustainableforestedwoodproducts, conformingtoENCode16485
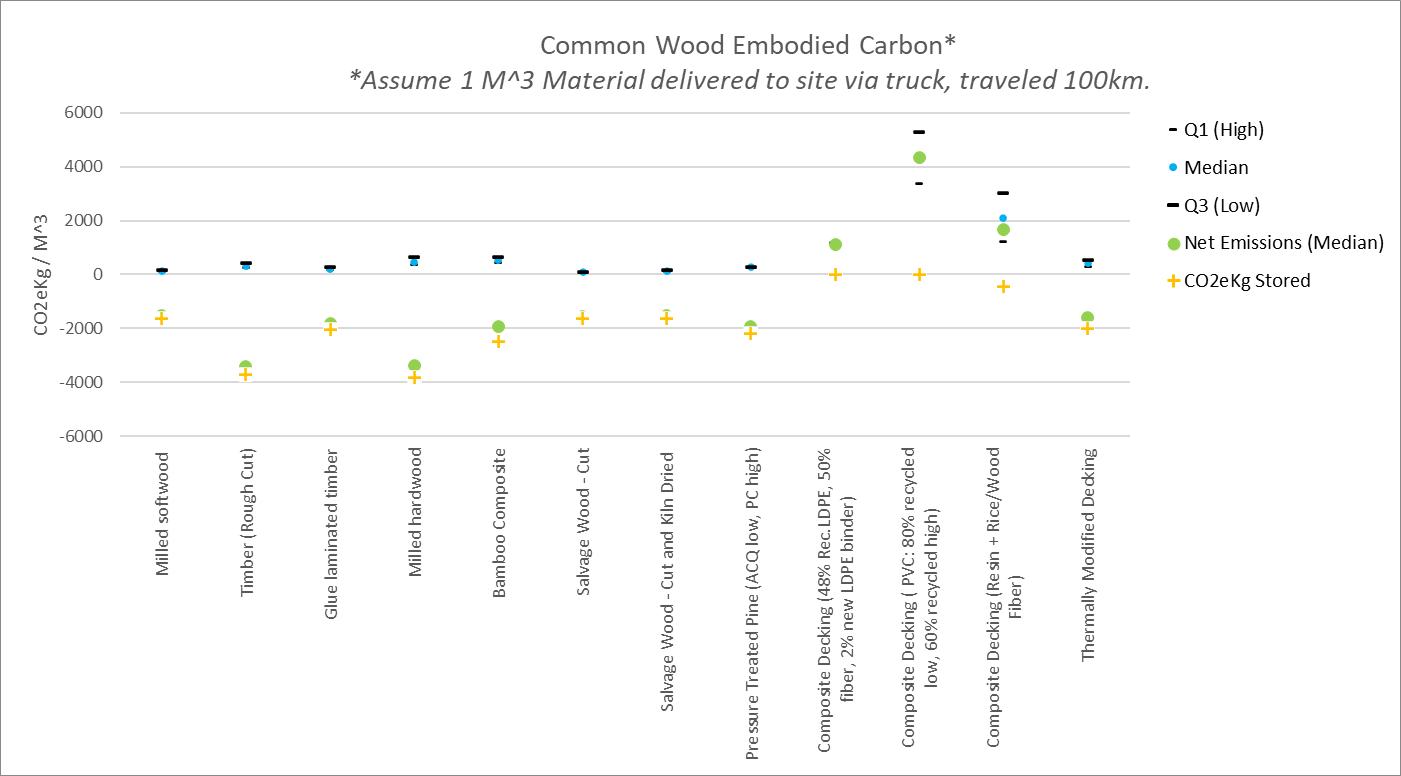
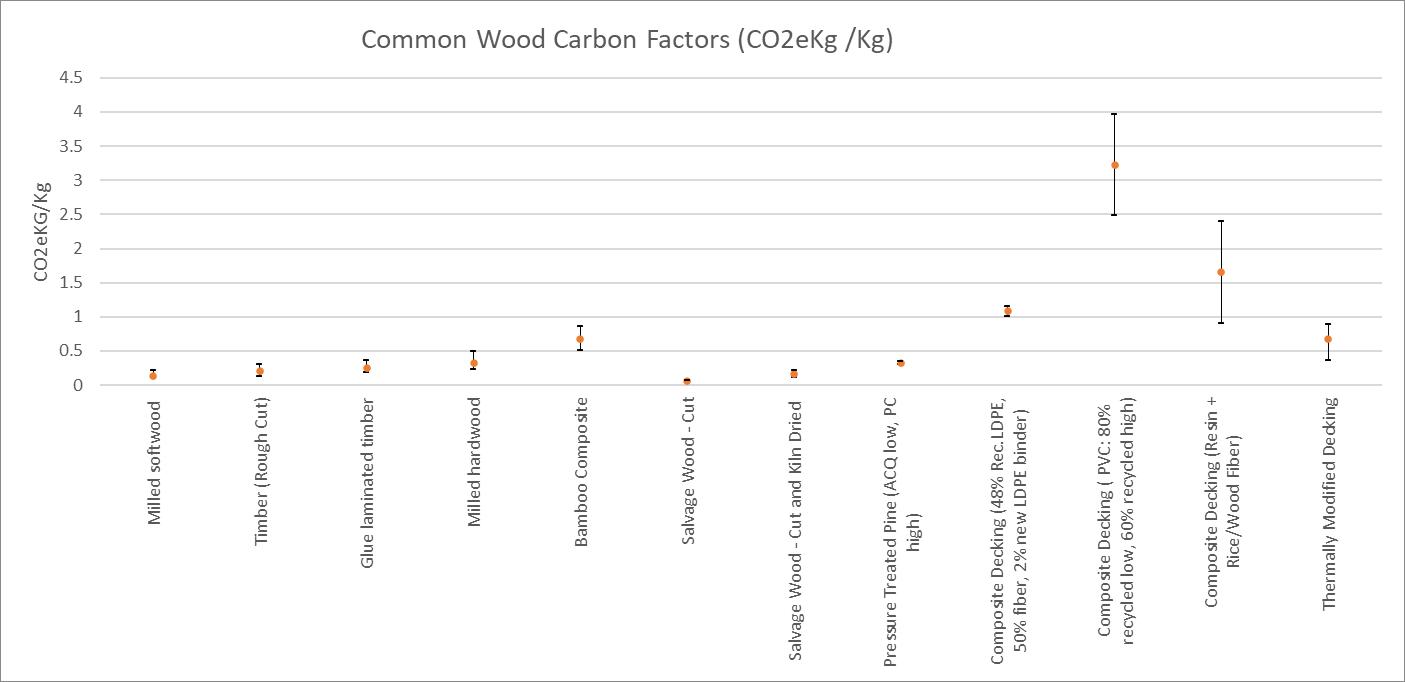
Carbonfactorsforcommonlandscapeplasticandfoammaterials Thetopchartshowsthe carbonfactorratioascarbonemissionspermassofmaterial.Thebottomchartshowsembodiedcarbonof acubicmeterdeliveredtothesite,havingtraveled100kilometersonatruckintransit
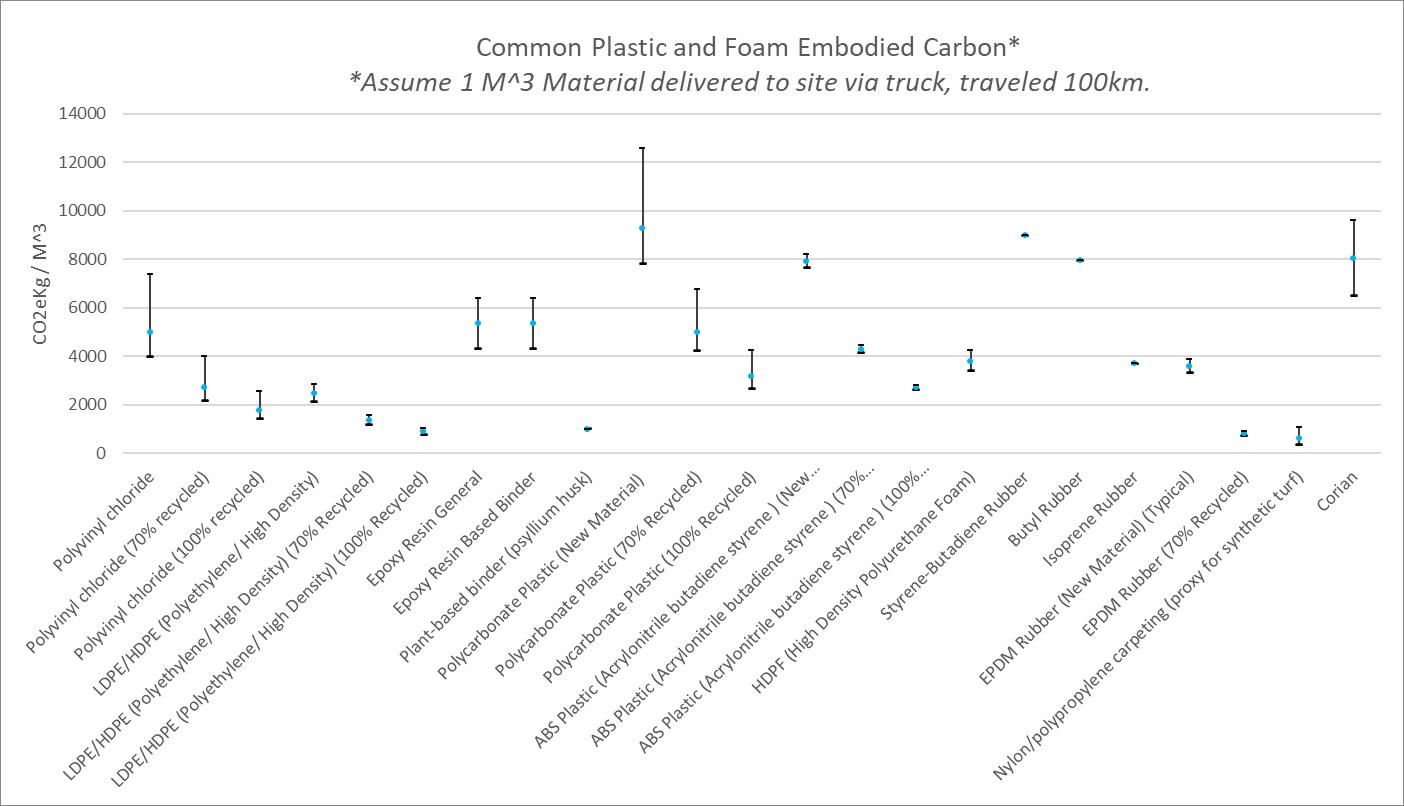
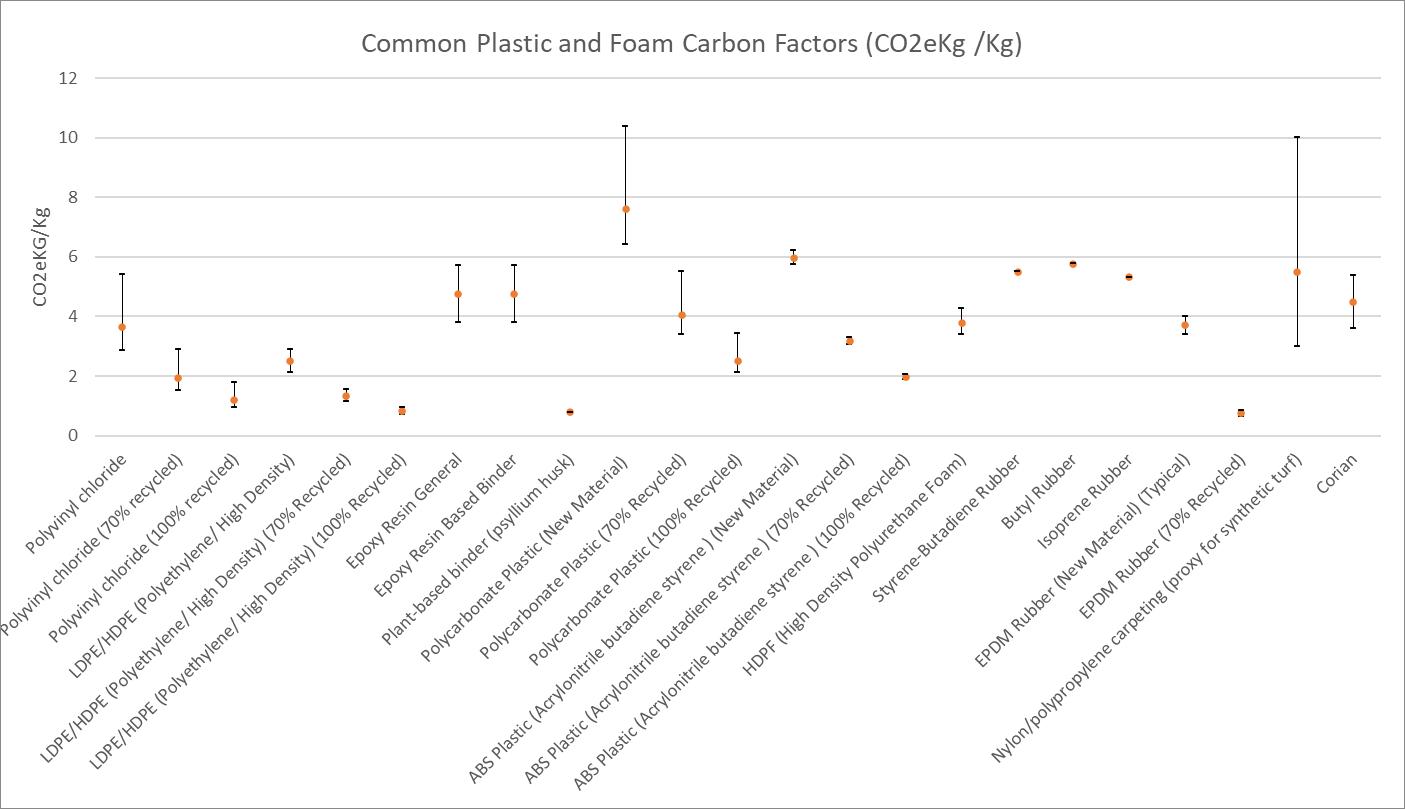
Figure17�Carbonfactorsforcommonlightweightstructuralfillmaterials Theleftchartshowsthecarbon factorratioascarbonemissionspermassofmaterial Therightchartshowsembodiedcarbonofacubic meterdeliveredtothesite,havingtraveled100kmonatruckintransit
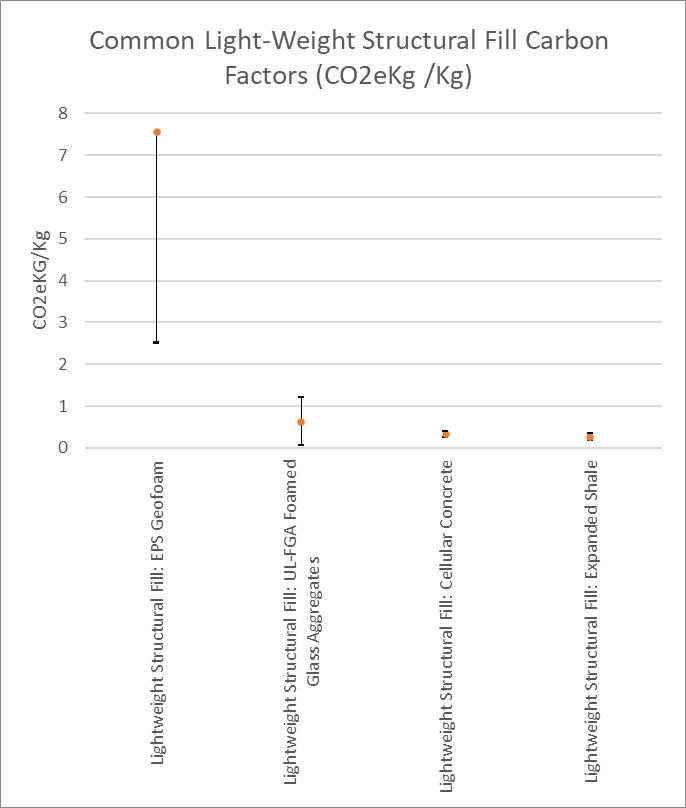
Version 1 of Carbon Conscience included a limited amount of information for site lighting and infrastructure assumptions. After beta testing and developing a detailed review for case study projects with the Sasaki civil engineering team and Atelier Ten, we decided to develop reasonable proxies to e�ectively account for these former externalities. We added the Product Placeholders below the pure materials section of Table 1a This section includes carbon budgets based on reference EPDs for lighting, electrical, irrigation, fountain, and telecom products that were otherwise not accounted for in pure materials or Site Elements. For some of these products, no reference information was available with the Version 2 update. In those cases, we included assumptions based on the mass of materials for typical products and added a contingency For these items, since there is no formal LCA or EPD, there are no primary source citations and they are considered placeholders until such research is located. We ultimately decided it was better to hold a rough estimate than to let these items remain as externalities, as when we take these disciplines into account in detailed design phases, they collectively have a significant carbon impact
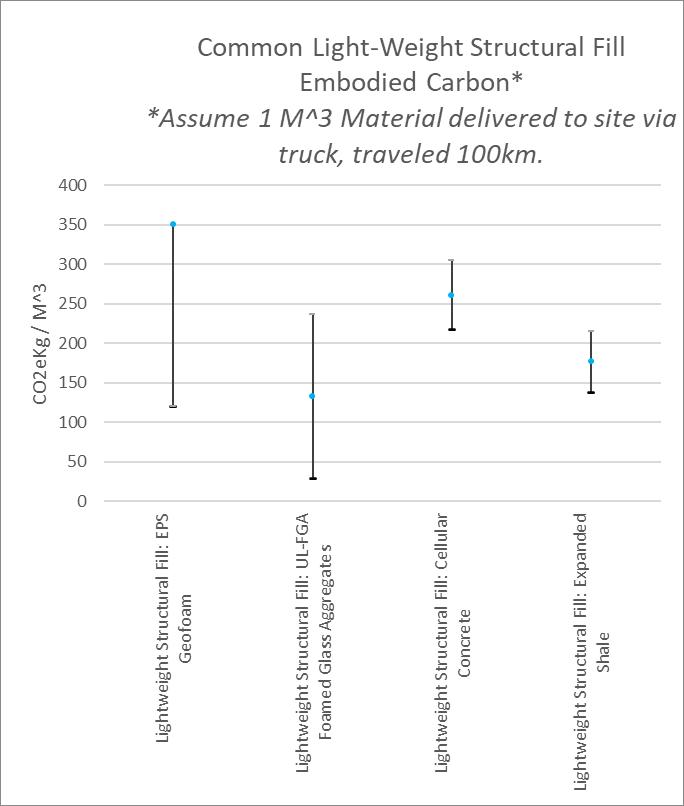
NurseryMaterialsCarbonData
We found that the embodied carbon costs of the nursery industry were the single biggest gap in the literature For other materials, such as cement-related industries, we found hundreds of potential studies, standards, and best practices already well described. Even for Landscape Furnishings, key firms have already started and completed ISO-compliant EPDs. But for nurseries, the “Green
Industry,” only a handful of scientists have been rigorously investigating the embodied carbon on a per unit basis to enable carbon accounting. A summary of what literature we found is provided in Table 1d: Nursery Materials Carbon Data The majority of the citations stem from the work of McPherson, Selhorst, Lal, Smetana, Crittenden, Lasserini, Kendall, and Ingram. Since the data for the carbon costs were method based, and often very specific regionally and in terms of material, we intentionally separated out the embodied carbon values for planting materials based on the planting method from the ecological carbon for stored and sequestered carbon
Figure18�CarbonfactorsfortypicallandscapeplantingtypologiesincludedinCarbonConscience This includesjusttheembodiedcarbonofthenurserymaterial,notsoilpreparation,transportationtothesite,or installation
Without the benefit of clear-cut nursery standards for EPDs, each academic researcher has developed their own methods and conventions. A few unifying considerations we noted across studies include deducting the carbon sequestered during growing the product, accounting for the water used for irrigation during growing (but not installation), and including nutrients and container costs, excluding costs associated with o�ces or secondary operations Generally, transportation to the site was not included in associated studies. With these conventions in mind, we made our LCf, MCf, and HCf evaluations per planting category based on the studies available. There is an inherent risk to this, as many of these studies were species-specific, and given the wide range of growth rates and carbon sequestration capacity by species, these numbers may not easily translate between species It is our hope that as LCAs and EPDs become part of the nursery industry standards, aggregated values for planting typologies will be easier to establish with more certainty.
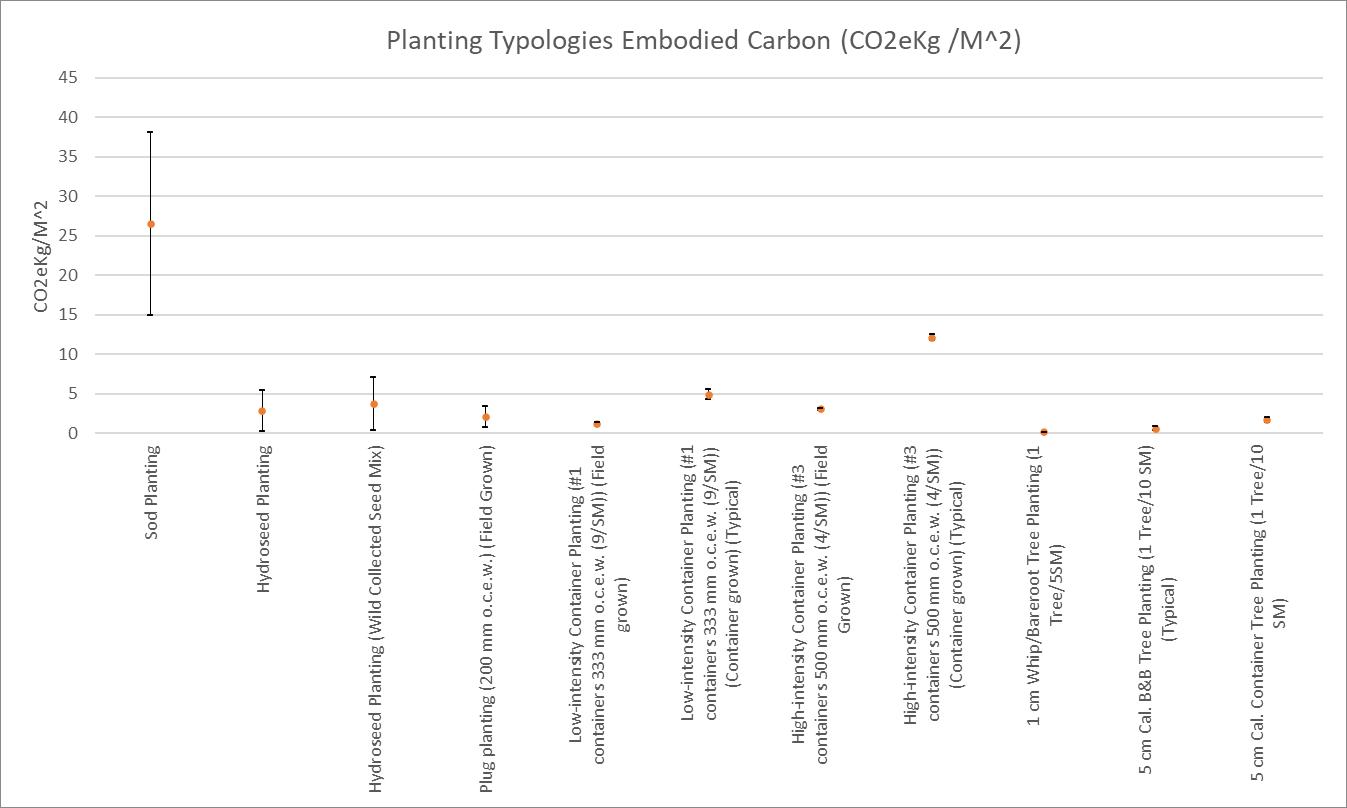
EcologicalCarbonData
The ecological carbon, or carbon stored and sequestered by given ecosystems, is collected in Table 1e: Ecosystem Sequestration and Storage Data. To get the combined carbon impacts of a given ecosystem, the land uses combine the embodied carbon of the planting methods with the carbon sequestration and storage (Table 1d) for a given ecosystem typology. Early in the development of Carbon Conscience, we made the decision to account for carbon sequestration by land area instead of other methods, such as stem density. This was to better align the data with long-term projections not susceptible to factors such as individual tree mortality, as well as make it more viable for land-use planning This does create a systemic bias towards the average planting densities found in the cited materials (primarily natural systems) and does not enable creating a super-charged carbon sequestering landscape through intensive cultivation. While increasing numbers of trees generally increases carbons sequestration, unless they are planted so dense as to increase mortality (Afzal & Akhtar, 2013), mature ecosystems tend to level out a common carbon-carrying capacity regardless of juvenile densities and growth curves (Braakhekke et al., 2019). Since Carbon Conscience is a predictive WPLCA, with operational energy excluded, we did not want to account for the sustainable harvesting of timber on site to account for thinning of dense stands, as this seemed too abstract a commitment for planning phases. This does mean that greater sequestration rates could be achievable in project landscapes through dense tree planting. We recommend those strategies for consideration in more detailed design phases and recommend using stem destiny as a standard method to account for that carbon, such as how Pathfinder and iTree are organized
In Carbon Conscience, we organized our land uses based on mature ecosystem typologies, including living and dead biomass accumulated over time, factors for SOC accumulation, and allochthonous carbon The typologies chosen were selected first from the United Nations Forestry and Agriculture Organization (UN FAO) classification scheme for global ecological zones to be able to e�ectively draw on the many years of carbon stock assessment studies provided, but also to make carbon estimates relevant to a wide range of ecosystem typologies around the world (UN FAO, 2022) These initial typologies were exclusively focused on native and natural ecosystems, such as forests, wetlands, or grasslands, and as such were limited in their applicability to urban spaces. To create assessments for urban spaces, we added additional land use typologies for turf grasses, gardens, and percentage cover of the urban forest We created these categories in light of project typologies, but also taking reference from key academic works, such as David Nowak’s urban tree assessments across various cities (D Nowak et al., 2013; D. J. Nowak & Crane, 2002; Pouyat et al., 2006). While there are relatively few ecological land uses, we have found in beta testing that combining these categories is a very helpful practice to approximate site-specific planting typologies For example, in our work in Athens, we found combining Restored Dry Forest (Mediterranean) (80%) and Restored Temperate Mixed Tree, Shrub and Forb Landscape (Garden) to be a reasonable proxy for a Mediterranean aromatic maqui-inspired garden, assuming less than 20% is irrigated.
Table 1e reports the ecological carbon of carbon stored for existing to-remain land uses and carbon sequestered by existing to-remain or newly planting ecosystems at 60 years (the study period for a Carbon Conscience WPLCA), both reported in CO2eKg/M^2. We extend the principle of biogenic
neutrality to ecological carbon and consider these values as negative in the WPLCA study. The carbon stored is used both as a value to advocate for preservation, but is also considered completely released for associated demolition land uses For example, if a temperate forest has an average of -79 77 CO2eKg/M^2 carbon stored, then we consider +79.77 CO2eKg/M^2 worth of emissions per square meter of temperate forest demolished. Note, the ecological carbon reported in Table 1e also di�ers from the carbon factors of materials in that there is no low, medium, or high estimate. The nature of these broad typologies of ecosystems is that there are not numerous global studies within each ecosystem, and much of our baseline data is coming from global and transnational average studies. To still e�ectively consider ecological carbon in our WPLCA, we then had to rely on straight numbers reflective of our references collected and reporting model. This provides more of a relative comparison between land uses, as opposed to accurate carbon accounting for the specific landscape, which we consider within the bounds of the intent of a land use planning and concept design tool. Table 1e also di�ers from other Table 1 data in that it is an output table of a separate model. To understand and reconstruct Table 1e values, the reviewer must go to Table 5: Sequestration Data.
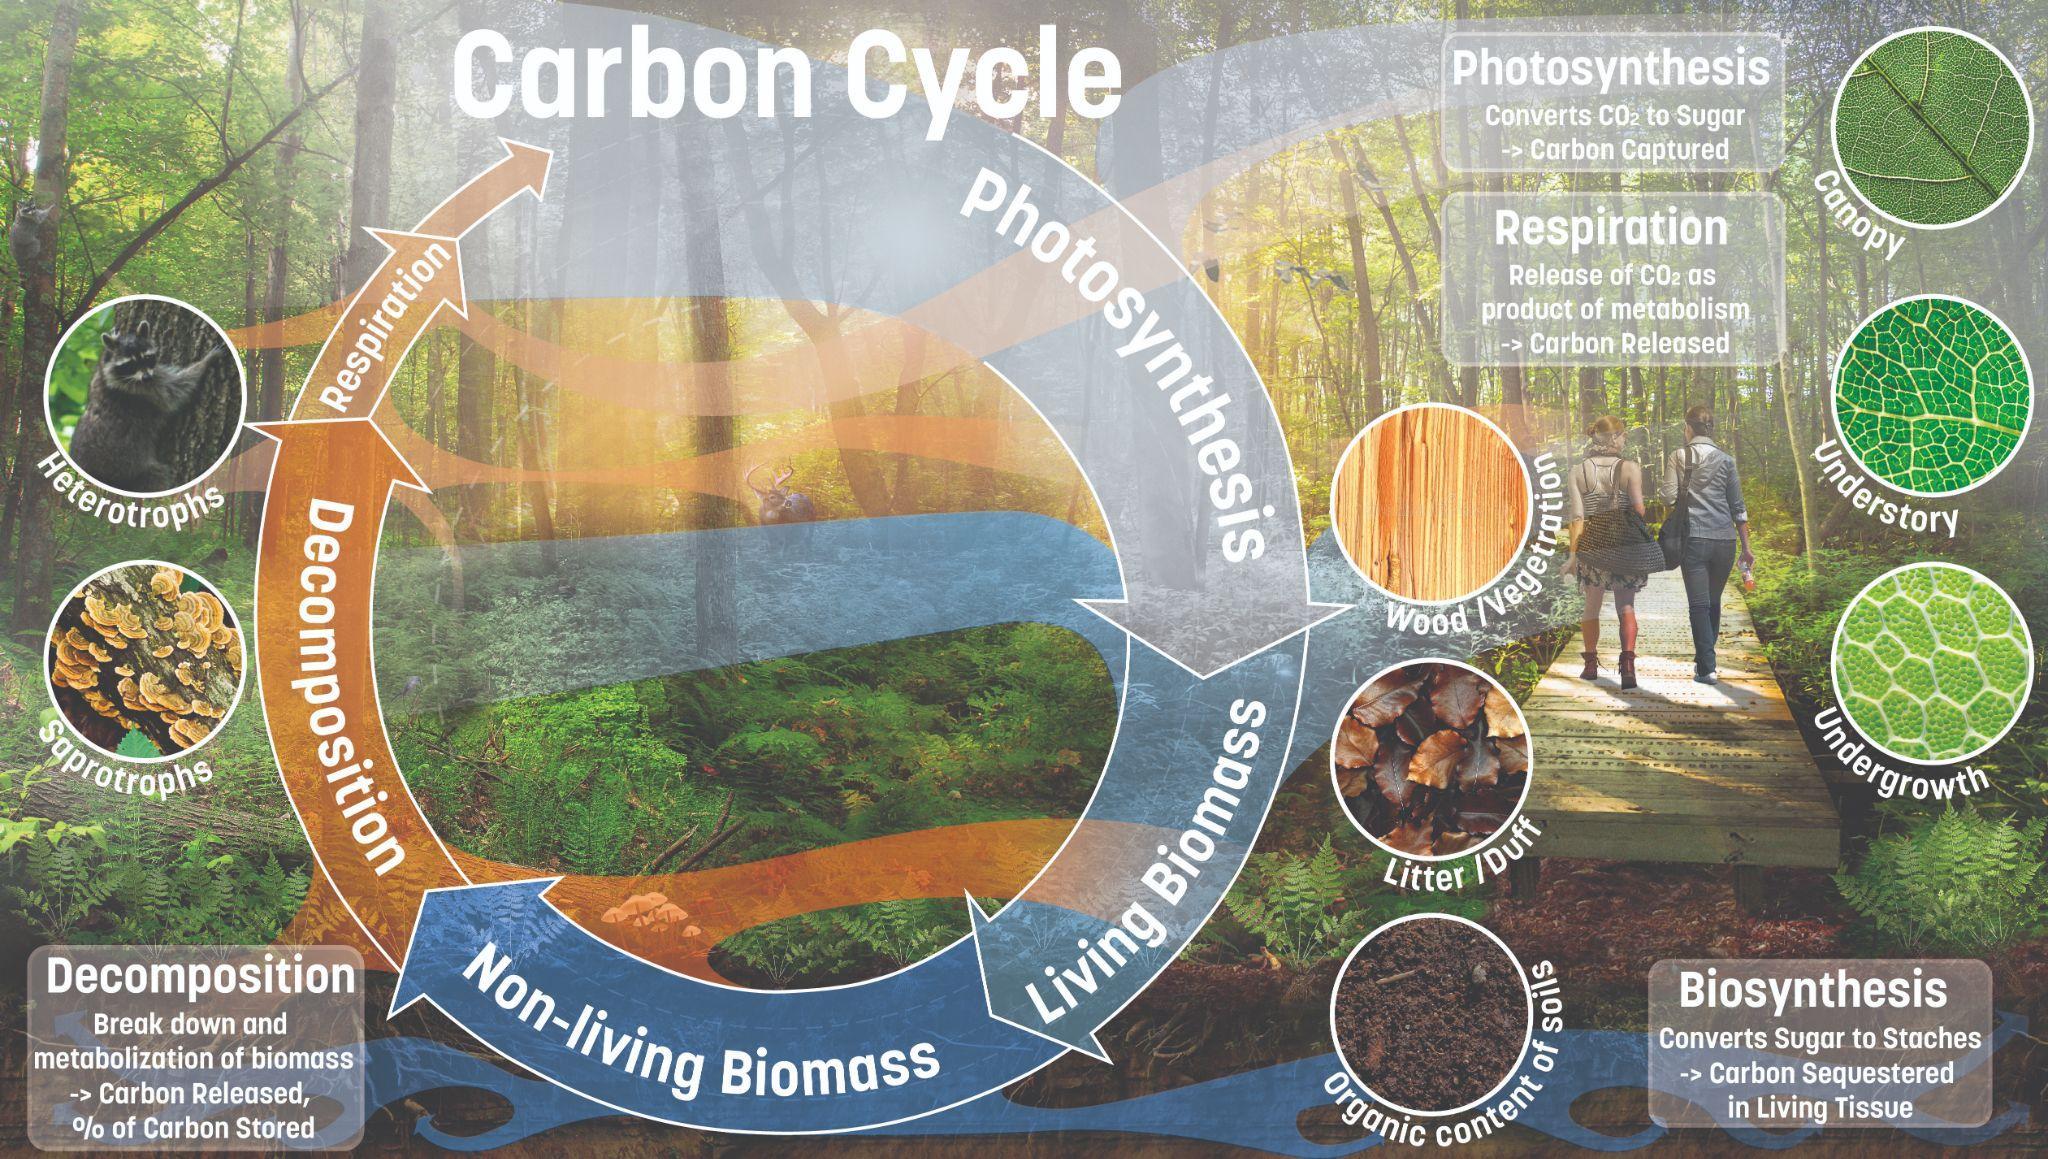
CarbonSequestrationandStorageModel
Table 5: Carbon Sequestration and Storage Model for Carbon Conscience includes the source data, citations, and calculations that provided the output data referenced by Table 1e. We realized in the course of our literature review, there is a wealth of aggregate carbon studies for carbon sequestration in ecological publications, but few of these studies break down to specific ecosystem typologies, and each tends to take a di�erent set of approaches to their calculations.
In some cases, studies merely cite key reference projects and scale up per global quantities. In others, huge sources of multi-spectral information provided the basis for the reporting, with citations for a
Figure19�Carboncycleconceptdiagram.
few field studies to be scaled up to the GIS data scale. Many studies involved specific plots, study periods, and unique or cutting-edge methodologies, and often focused on one aspect or another of ecological carbon within a given ecosystem We realized we needed to create a common format for these numbers to make sense relative to each other.
This table creates that format by allowing us to plug in citations for a given ecosystem typology where we found relevant information A significant revision we made from Carbon Conscience Version 1, after beta testing and peer review, was the consideration of multiple stages of the carbon cycle within a given ecosystem typology. To accomplish this, we formatted our table to seek out living and dead biomass above and below ground, soil organic carbon, and allochthonous carbon, while accounting for reasonable decomposition rates based on climate and growth curves
The first aspect we needed to understand was probable biomass, as 50% of dry biomass is commonly considered carbon (Afzal & Akhtar, 2013; Schlesinger, 1999). At the same time, studies vary on what biomass is studied The vast majority of studies focus on living above-ground biomass (AGB) (Houghton, 2008; Jianjun et al., 2019). Below-ground biomass is notoriously di�cult to study and account for, and as such we often had to rely on extrapolating proportions for reference studies (Johansson, 2006). For the ecosystems where we only had AGB data, we first included that on a kilograms of carbon per square meter basis For ecosystem typologies with multiple references and studies, we simply took a straight average. When we only had ABG citations, we accounted for below-ground biomass (BGB) by using multipliers from literature, specification of the 20% citation (Pan et al , 2013) for forests, 300% for prairie, 200% for dry meadows (Bansal et al , 2021; Jianjun et al , 2019), and 12 5% for grasslands and wetlands (Poorter et al , 2012) We specifically extrapolated the Poorter values to wetlands not because of direct citation, but because of the similar structure of rooting systems, as salt marshes and reed systems are relatively shallowly rooted due to anaerobic benthic conditions (Cormier et al , 2021; Grašič et al , 2022; Neubauer & Megonigal, 2021)
For total biomass (AGB plus BGB), we either simply added the ABG averages with the estimated BGB, or cited studies that reviewed total biomass. In cases where we had ABG plus BGB and total biomass citations, we treated each as an equally viable data point and averaged the results Many of these studies came from UN FAO-sponsored research, the key notable citations being work by Pan, Proulx, Easdale, and Lal for forests (Easdale et al., 2019; Lal et al., 2013; Pan et al., 2013; Proulx et al., 2015). We used a key study by David Nowakfor the urban tree landscapes, which provided both the basis for those average tree coverages and also for street tree land-use typologies (D Nowak et al , 2013)
To account for the nonliving biomass, we relied on the potential soil organic carbon (SOC) per ecosystem. While soils have a huge range of SOC even within a given plot due to localized conditions, such as depth of bedrock, soil texture, bulk density, and hydrology, numerous sources exist for aggregated soil estimates and studies, many of which have proclaimed soil as one of the most vital unrealized potentials for global carbon capture (Adamu et al., 2021; Azian et al., 2022; Bansal et al., 2021; Defrenne et al., 2016). Many of the citations and sources for soils included in this table come from the relatively new work Understanding and Fostering Soil Carbon Sequestration, edited by Dr Cornelia Rumpel, which we recommend for anyone interested in gaining a deeper understanding of SOC (Rumpel, 2022). For ecosystem typologies where we could not find a citation for SOC by area, we
used proxies as identified in the table from other ecosystems. Urban soils proved an exception, as most landscape architects would agree, being both unusually hard to predict but also generally extremely SOC-poor For urban soils, we used a factor of 2 8 times biomass, based on ranges for collective reviews by Pouyat (Pouyat et al., 2006). This assumption seems to fit well with other citations looking at low SOC soils (Bellè et al., 2022; Fonseca et al., 2012). A significant conclusion we found from all soil citations is that the total carbon stored in soils often equaled or exceeded biomass, and if we only account for living biomass in carbon calculations and ignoring soil, we miss a large part of the picture (Carpenter et al., 2014; Hugelius et al., 2020; Nussbaum et al., 2014; Rumpel, 2022). FDR’s axiom never seemed more relevant… “The nation that destroys its soil destroys itself.”
Combining our total biomass (AGB plus BGB) with our SOC provided our total stored carbon potential or TCP. We consider this value a reasonable proxy for the carbon-carrying capacity for a given ecosystem typology, serving as a basis for our carbon stored on existing-to-remain ecosystems.
To account for carbon sequestration, we needed to be able to calculate, over the study period, the carbon net fixed in an ecosystem from the atmosphere. In Carbon Conscience Version 1, we took ecosystem projected growth rates and projected them to 80 years (the former study period), correlating to the U.S. Forest Service definition of ecosystem maturity (USFS, 2003), and then assuming decomposition and respiration equaled sequestration for warm climates, with factors adding to dead biomass for cooler climates, but with broad assumptions. In review and consultation with academic and professional ecologists, we learned that this was an overly conservative approach.
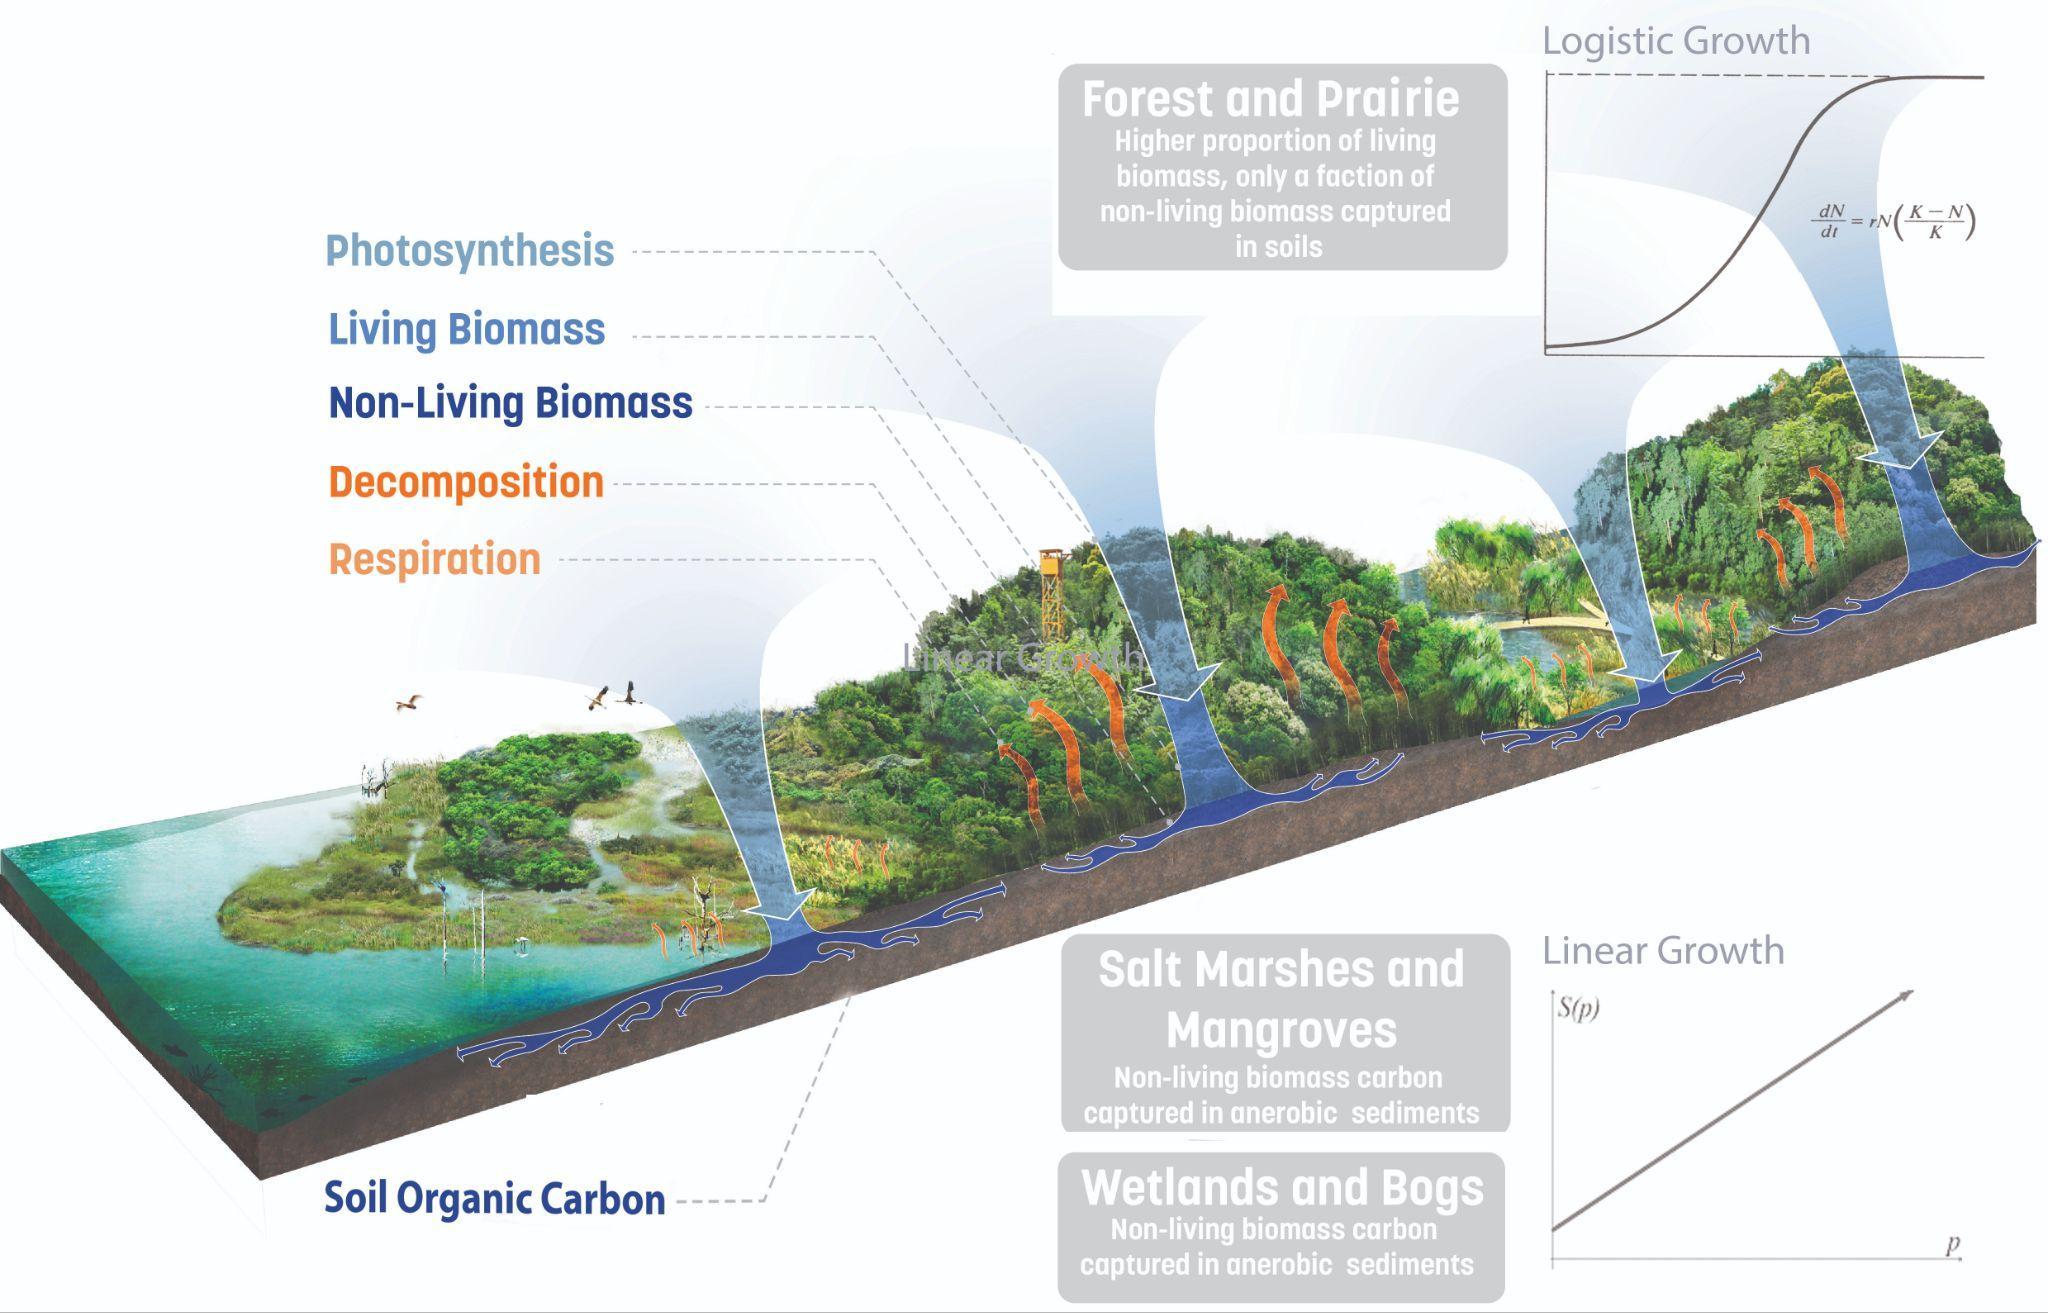 Figure20�Carbonsequestrationgrowthconceptdiagramcontrastingwetlandsandforest
By this logic, tropical rainforests would not net sequester any additional carbon after maturity, when in reality mature rainforests are still drawing down carbon through building up in dead biomass, soil organic carbon, and carbon that moves o�site into waterways or seeps deeper into soils (or allochthonous carbon). A complication is that long-term studies of net biomass and SOC accumulation do not exist for many ecosystem typologies, especially in the tropics.
In Version 2, we started by gathering average annual sequestration rates (ASR) from literature These rates were available from UN FAO data and derived papers, but also from a number of ecosystem-specific studies. These rates included studies from a�orestation and restoration ecology, as well as mature systems, but all accounted for the net carbon drawn down each year.
Most of these studies used the same premise of measuring sequestration rates by rates of living biomass accumulation but through a variety of methods, including extrapolating studies sites to GIS data, and correlating leaf area projections with stem density and diameters. The complicating feedback we also received was that accounting for ASR as a linear model was flawed for most ecosystem typologies, in fact, sequestration as a linear year-to-year rate only applies to wetlands and similar ecosystems where carbon is locked up in sediments that minimize decomposition (Chen et al., 2021; Cormier et al., 2021; Grašič et al., 2022; He et al., 2021; Neubauer & Megonigal, 2021). For dry-land grasslands and forests, sigmoidal curves are more accurate models, both to account for transplant stress, but also, and more significantly, to account for the slowing sequestration rates as ecosystems reach carbon-carrying capacity (Braakhekke et al., 2019; Gough, 2021; Kucharik, 2007). The carbon-carrying capacity of an ecosystem is the total amount of carbon likely to be stored in a mature ecosystem, inclusive of soils, both living and dead biomass Not all ecosystems are equal In fact, orders of magnitude di�erences exist between high and low carbon-carrying capacity ecosystems. For example, in ecosystems such as Mediterranean chaparral or long-leaf pine and wiregrass savannas, where the fire is a major part of the ecosystem management, the ecosystem does not accumulate large amounts of carbon in either soils or biomass due to fire and growth habit constraints (Buotte et al., 2020; Fonseca et al., 2012; Kumar & Nair, 2011). In those ecosystems, the carbon-carrying capacity may be reached well in advance of 80 years, but with a huge range based on local growing conditions At the other end of the spectrum, temperate oceanic rainforests can store vast amounts of carbon (Carpenter et al., 2014; Pan et al., 2013). Because wetlands can continue to e�ectively pump carbon into benthic sediments, wetlands e�ectively build up carbon as long as the water management regime is maintained (He et al., 2021; Kolka et al., 2021; Zhu et al., 2021).
To account for these di�erences in sequestration rates, we first attributed decomposition factors to each ecosystem typology. Since the climate is the primary determinant of decomposition rates, with mass loss proportional to temperature and precipitation, we opted to classify decomposition based on climate zones (Du et al , 2020) Also, in reference studies, it appeared that mass loss on dead leaf and forest litter mass was at the highest rate between 6 to 12 months (Du et al., 2020). We opted for a one-year decomposition period, so we could compare annual growth with annual decomposition. Decomposition rates were accordingly fastest in the tropics and slowest in boreal ecosystems, with up to 24% remaining after 1 year in warm climates and 60% in cold climates (Carpenter et al , 2014; Du et al., 2020; Glassman et al., 2018). For wetlands, these generic factors did not apply to the preservation of carbon in the sediments mentioned above. For salt marshes, freshwater wetlands, and mangroves,
a value of 70% was taken from a long-term study on reedy wetlands in a temperate climate (Grašič et al., 2022). Peat wetlands were found to be unique, with the note that as long as inundation is preserved, they have e�ectively perfect storage capacity (Sleeter, 2021) We assume ideal hydrology management for our projections for wetlands. There is a very real risk that wetlands can become net emitters of methane and carbon dioxide if allowed to dry out (Benscoter et al., 2021; Hugelius et al., 2020; Liu et al., 2022). For the turf ecosystem, the majority of carbon captured through growth in a given year is expected to be released through decomposition, with only 5% adding to SOC (Kopp & Guillard, 2004), and that would be with best management practices, including mulching mowers.
Since the carbon decomposed in a given year is majority leaf matter, with wood accumulation persisting as carbon stored (Kumar & Nair, 2011), we then determined a reasonable proportion of total biomass grown as contributing to leaf or herbaceous growth as a Leaf Percentage of Growth (LPG). Values for this were primarily taken for the allometric studies by Poorter, and cross-referenced with key managed forest stand studies (Konôpka et al., 2020; Poorter et al., 2012). One important clarification from the Poorter study, which served as the basis for our LPG for most ecosystems, was the inclusion of persistent stems in the woody biomass category, as they did not decay within one year. With these values, we then were able to calculate the Leaf Mass Loss (LML) column of the model by multiplying the decomposition factor (DF) by the LML. This enabled us to develop the adjusted total sequestration rate (TSR) by subtracting annual loss to decomposition from the average sequestration rates, resulting in a lower total sequestration rate than the raw values we cited (TSR=ASR-((ASR*LPG)*DF)).
Carbon sequestration tends to decline as systems approach maturity (Radford, 2019; Wohlleben, 2016); we approached projected sequestration rates by selecting a finite period of projected growth, and from two perspectives we found commonly used in related literature. The first was accounting for the annual average sequestration for a land cover type and multiplying that for the projected years of growth, using a mean sequestration rate that would account for the fast-growing years and slower growth years, through using a linear equation (D. J. Nowak & Crane, 2002). The second was through fitting a logistic equation to the anticipated carbon carrying capacity over the period anticipated to maturity (Braakhekke et al , 2019)
Accordingly, the next step in our model (column R) was defining the sequestration rate as either linear or logistic (logistic producing the sigmoidal curves mentioned above). We designated wetland ecosystems as linear, and all other ecosystems as logistic A universal population growth logistic equation was adapted for our study: Ct=M/(1+e^(-r*(t-(M/2))), where Ct= Carbon at a given year, Total Carbon Sequestered (TCS), r is the distributed sequestration rate (DSR), and M is the carbon carrying capacity, defined as the total carbon stored in a mature system. R is fit to match the projected year of maturity for each land use (80 years per USFS standard approach for woody ecosystems (USFS, 2003), 20 years for grasslands (Deng et al., 2022)). For our projections of sequestration in Version 2, we have adjusted the 80-year study period down to 60 years to align with WBLCA standards, as noted earlier in this paper.
These factors and variables described above were brought together in columns A through AA: the columns that are the reference values that serve as inputs into Table 1e. The average GWP stored in
mature ecosystems is simply the total stored carbon potential (TCP) multiplied by 3.66 to convert to carbon dioxide equivalent. The annual average GWP sequestration rate is the average adjusted ASR multiplied by 3 66 to convert to carbon dioxide equivalent The restored ecosystems' anticipated carbon sequestration by study year is calculated by projecting the relevant sequestration equation to year 60 (logistic or linear). We have made a global contingency for the allochthonous carbon to be 5% of the adjusted annual sequestration rate. We selected 5% based on a limited set of references, combing carbon leaching below the typical 0 5 meters included in most SOC calculations (carbon sourced primarily from root exudates) (Adamu et al., 2021; Panchal et al., 2022), plus carbon migrating into waterways (Belenguer-Manzanedo et al., 2021; Doughty et al., 2015; Woo et al., 2021). More direct studies for factors for allochthonous carbon for these ecosystem typologies were not found during this research study period, but ignoring this contribution was considered overly conservative in the informal peer review noted earlier in this paper. Current research indicates a vast amount of the carbon entering marine and riparian sediments are sources from terrestrial ecosystems o�site (65%), and mature systems contribute significant carbon to these cycles; this is relevant for non-wetland, not arid, non-urban ecosystems (Butman et al , 2016; Rumpel, 2022; Woo et al , 2021) The associated percentage of carbon sequestered being allochthonous could be as much as 9.13% of total carbon sequestered per year, (Butman et al., 2016; US EPA, 2017a)(Butman et al., 2016); (US EPA, 2017). This model assumes only 5% for forested moist ecosystems, and only includes that additional number for ecosystems after they achieve the 80-year maturity date, but then adds that amount linearly thereafter. This factor became a critical part of the estimate for total additional carbon sequestered for preserved ecosystems, with the minor addition of the delta between the maturity projection stored and the 60-year projection of growth This is added as a bonus on top of the maturity projection because the practical reality is that most forests are not 80 years old within the United States (especially in urban and suburban areas), and mature forests still have a small, declining, rate of sequestration until they approach full old growth status around 150 years of age (Keith et al , 2009; Luyssaert et al , 2008; Pan et al , 2010; Pugh et al , 2019)
Together, we put forward this model as a method for determining a reasonable estimate of carbon impacts per ecosystem typology, matching values to known citations for biomass and soil organic carbon estimates, growth rates, and survey studies The reality of carbon sequestered and stored per unit area is entirely dependent on what is specifically planted, the local soils, the climate, and the site management regime. This model is only useful for making comparative evaluations between land uses, such as comparing turf with garden spaces or restored temperate forest. These estimates are also the basis for Table 4: O�set Table, to provide high-level estimates of approximately how much restoration or preservation would be needed to o�set a given project logged into Carbon Conscience.
LandscapeLandUses
For the Landscape typology, we made detailed assumptions of the average composition of a particular land use per square meter, either taken from literature or informed by the review of approximately a dozen active projects with our o�ce We then isolated each element or assembly within that land use type and provided high, low, and median estimates of embodied carbon, net anticipated carbon sequestered at maturity, and carbon stored for that element per square meter. We generated these estimates from an aggregated carbon costs materials data table, an aggregated carbon sequestration at maturity data table, and an estimated carbon stored calculation To understand how a land use is
structured with the table, the reviewer can ungroup the land use, and review each of the elements contained within that land use category and for the percentage of site coverage. For example, within the unique land use of “CIP Pedestrian Concrete Hardscape Mostly flatwork, some walls (5%), limited drain structures and furnished,” under the Concrete Hardscape category, there are the following elements:
Figure21�Sampleofproportionsofsiteelementscontainedwithinonehardscapelanduse
For each element, the carbon factors from that element are included per proportion included within the average square meter, and then all elements are summed for the land use values Any element that includes Material Options notes has options within Table 2 (which provides the source data) for alternative materials, such as SCMs or recycled content.
Existing-To-Remain category land uses capture the carbon to be sequestered over an estimated 60 years for preserved-in-place ecosystems. Demolition and Site Preparation land uses include the carbon costs of removal and the release of stored carbon in demolished existing ecosystems (both disturbed soils and vegetation), earthwork and site preparation, and demolition of existing hardscape elements. Hardscape category land uses include a wide range of potential built landscape surface coverage, from concrete buildings to playgrounds and decking systems. Softscape category land uses include all planted conditions, from turf and gardens to various ecological restoration plantings. All of these land uses follow the same logic as the baseline materials to elements, to average compositions per land use.
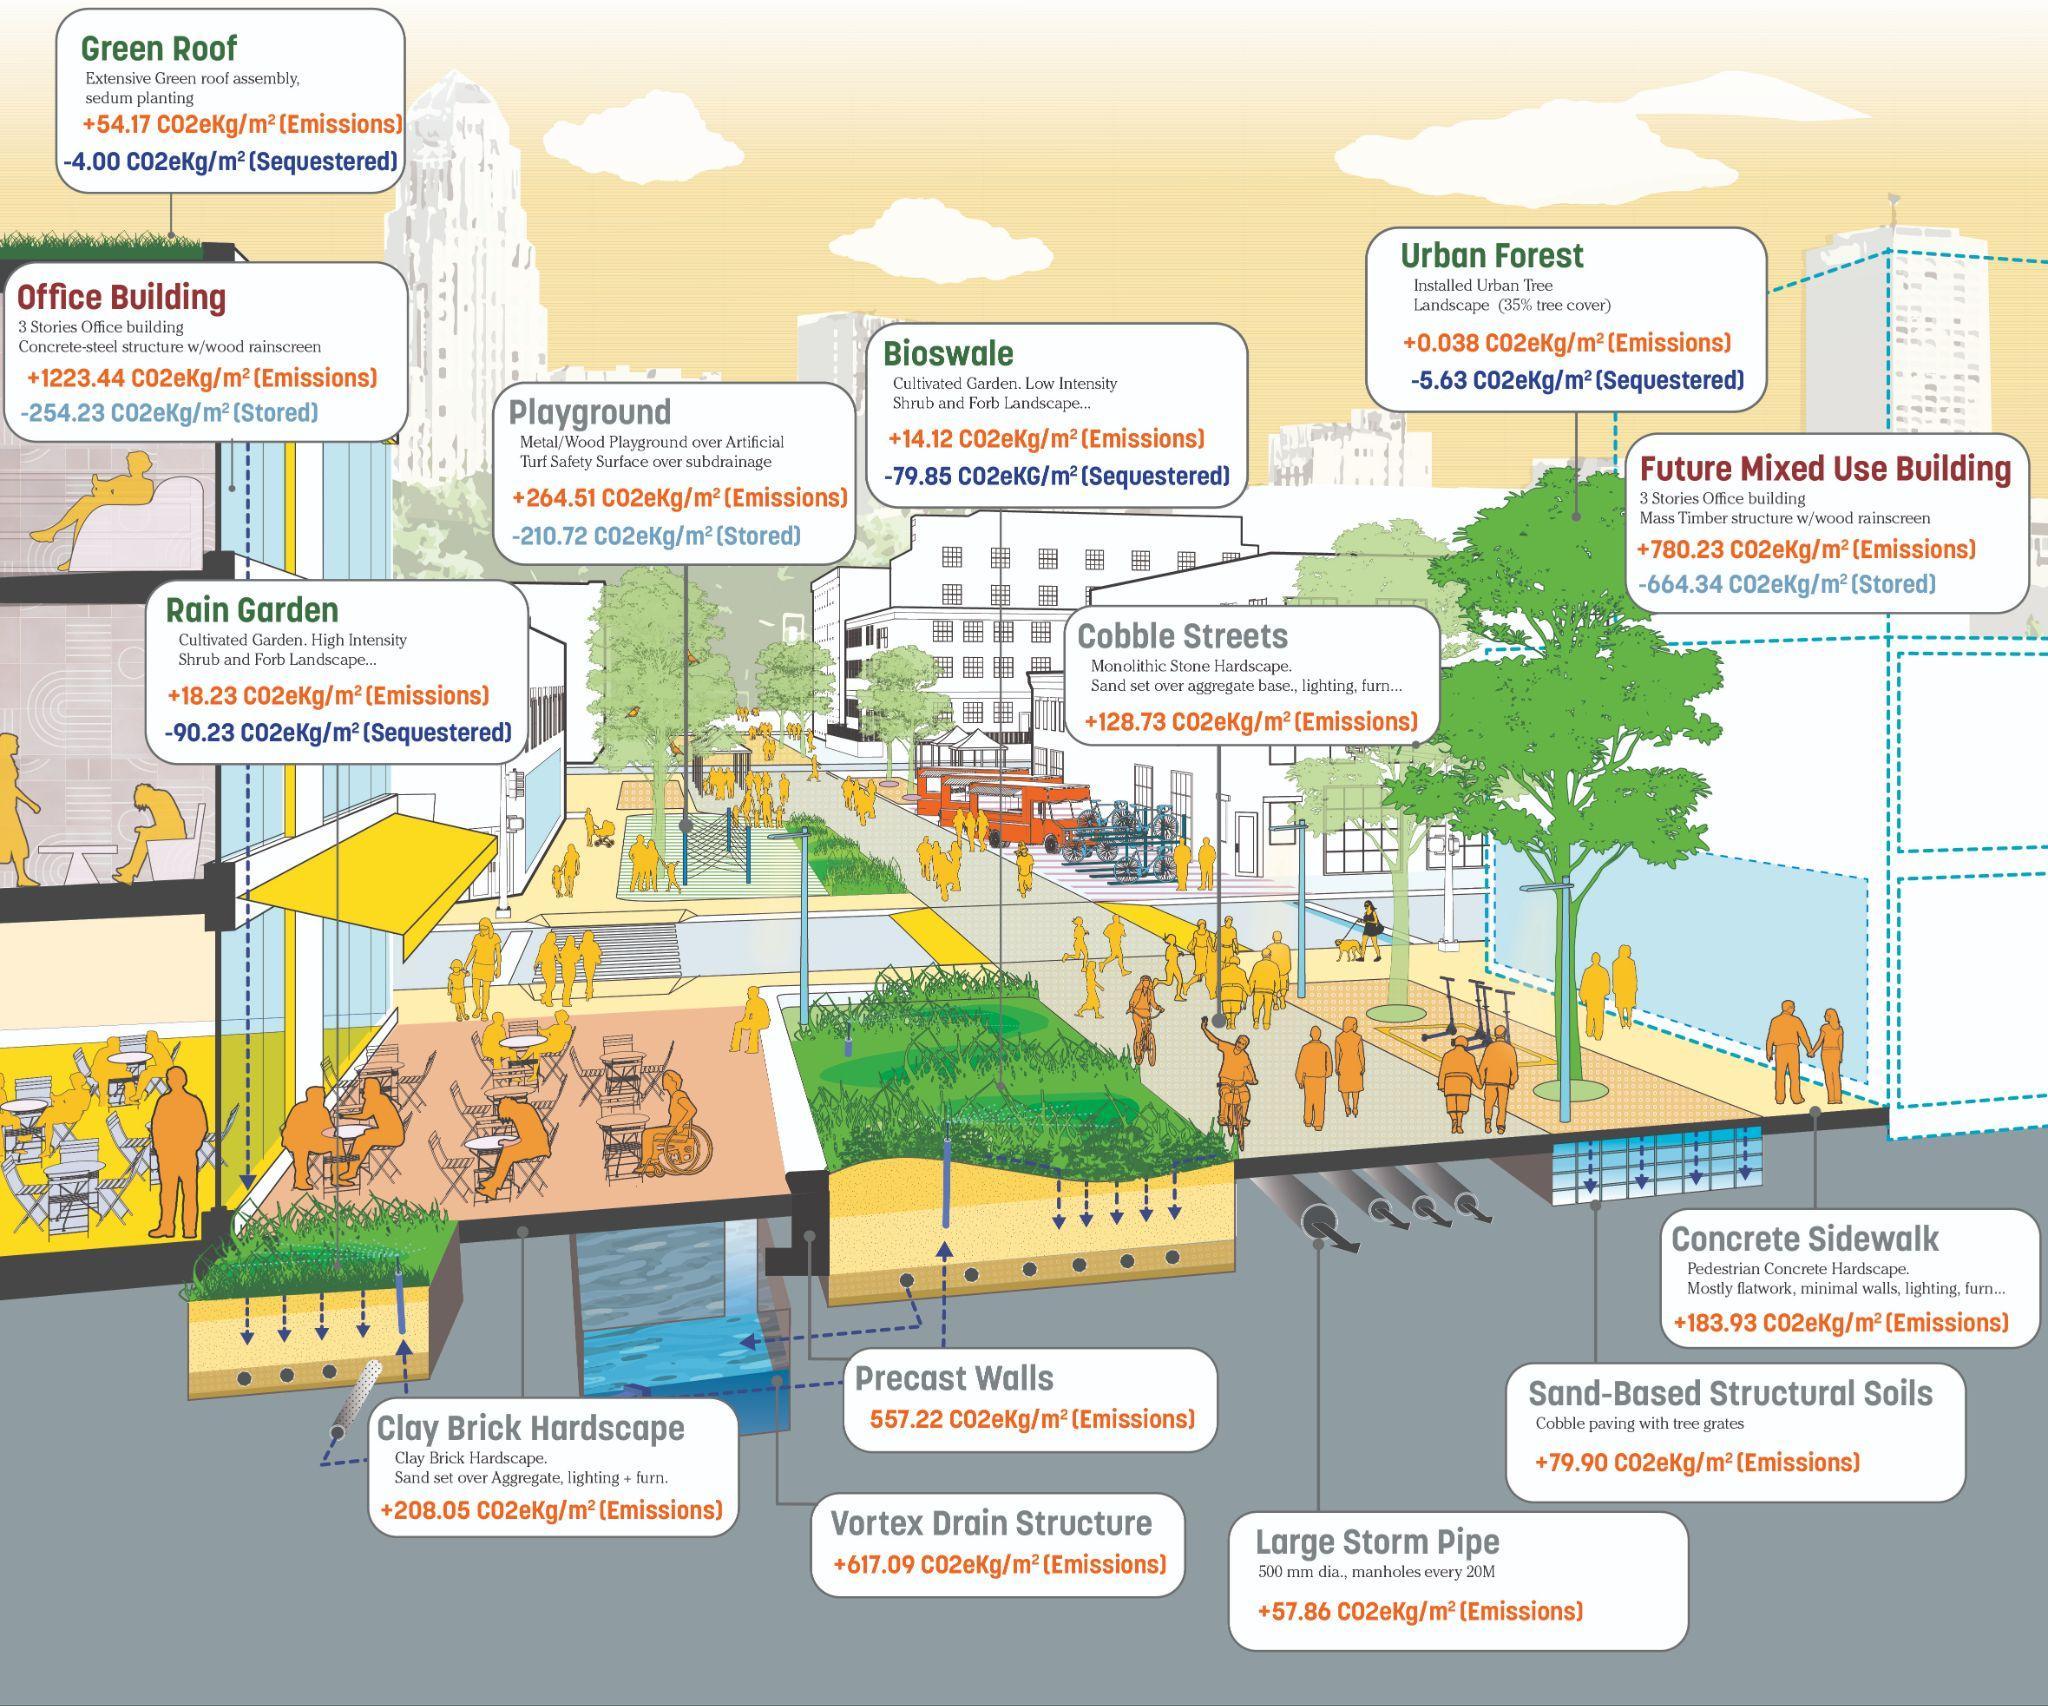 Figure22�Conceptuallymappinglandusestodesignproposals Landscapescanbejustas carbon-intensiveasarchitectureonaper-unitareabasis
New land uses added in Version 2 include Street Trees, Green Roofs, Amendments (under softscape), Additional Infrastructure, Fountains, and Rammed Earth (under hardscape). Tables for comparing key land uses are available in Appendix C and D
Existing-To-RemainLandscape
The Existing-To-Remain land use category is intended to capture vegetated landscape cover that could contribute to the net carbon stored or sequestered for a given project. This recognizes the value of preserving existing living systems from a carbon perspective. Hardscapes are not included within the Existing-to-Remain category as they have negligible impact on carbon emissions, sequestration, or storage and can be e�ectively treated by excluding them from the scope of work. The existing-to-remain land uses within Carbon Conscience are categorized as di�erent mature ecosystem types or horticultural landscapes. Based on sample calculations we performed, it was assumed that any construction costs associated with preservation, such as tree protection or temporary fencing, are negligible when reviewed at campus or neighborhood scales (less than 0.01% of a test project WPLCA).
DemolitionandSitePreparation
The Demolition and Site Preparation land uses are intended to serve as a sketch tool for landscape architects to help them prioritize what kind of landscapes benefit from preservation from a carbon perspective. This category uses the carbon stored data set for vegetative land uses as defined in the Existing-To-Remain description above, and assumes that all organic carbon is released from the site in the act of demolition and site preparation In reality, this would only apply if the existing vegetation is burned or composted, and if soils are disturbed enough to release existing carbon reserves The impacts of the demolition of existing vegetation can be partially ameliorated by careful harvesting of wood and non-wood forest products and the preservation of existing soil structure, mulching of vegetation, and storage of any charred wood within soils (Marinelli, 2019) Given the site specificity and nuisance of these methods, our default assumption is the complete removal of existing carbon and significant grading of soils. We assumed an average 0.5-meter depth of grading globally per square meter, clearing and grubbing, and site protection. We assumed mulching of all existing material, and the removal of all waste to a facility within 16 kilometers through ground transportation, noting that in Version 2, distance and transportation type assumptions can be edited by the user. For equipment emissions per unit volume or mass moved, we used a variety of equipment technical manuals, with a bias toward larger scale equipment commonly used on sites larger than 1 acre (Downeaster, 2020; General Rental Center, 2020; Hajji et al , 2017; Hajji & Lewis, 2017; H Jassim et al., 2016; H. S. H. Jassim et al., 2017; Lawn and Order, 2020).
For hardscape demolition, we assumed the same site preparation and earthwork costs but also included the transportation costs of the removal of waste materials to an o�site facility For salvage materials, the Carbon Conscience calculator accounts for the carbon savings by adding the carbon costs of large in-place-concrete crushers for processing hardscapes into the aggregate base but also subtracts the mining, fabrication, and transportation costs for an equal volume of import. This results in net carbon savings in comparison to removing waste to a disposal facility and importing the equivalent volume in aggregate. As a best practice, we recommend either saving a demolition and preservation version of the project within Carbon Conscience along with a proposed design, and
summing the cumulative impacts of each study, or adding demolition land uses to each proposed land use.
HardscapeLandUses
The hardscape land uses are the largest and most complex category of land uses within the landscape data set, with the intention of informing concept designs for site work. The hardscape typologies are generally first defined by their paving typology as that covers the majority of the surface area, and then made unique by assumptions of densities of walls For example, within CIP Pedestrian Concrete, there are di�erent land uses for 1%, 5%, and 10% of the land use being occupied by walls, reflecting the range in site work for relatively simple flatwork land uses to complex installations with high ratio of walls and stairs. We also scale furnishings and lighting at similar ratios within these categories, all as noted in the assumptions of the given land use Generally, when exploring land uses, a 1% walls item is reflective of simple open plaza spaces; 5% walls as more complex plazas with grade change, planters, and more conspicuous lighting; and 10% walls as highly complex spaces. To relate these spaces in terms of plazas, landscape architects would recognize 1% is reflective of Piazza San Marco in Venice, 5% would be reasonable for Zuccotti Parkin New York, and 10% would be reasonable for Levi’s Plaza in San Francisco. For each material typology that is relevant, Carbon Conscience provides dedicated land uses for pure walls and stairs. We recommend that if designers lay out specific walls and stairs in their concept design sketches, they only use the 1% of walls land uses for the paved spaces, otherwise, they may significantly overestimate their potential carbon impacts As a best practice, for planning level designs, we recommend not using stair or wall-specific land uses and defaulting to 5% walls unless a site is known to require unusual levels of complexity. For planning level projects, we recommend defining split land uses to adjust proportions of the pre-stocked land uses (such as 20% CIP Pedestrian Concrete, 40% Stabilized Aggregate, 40% Garden) to allow for flexibility during concept design, but to be able to inform concept design on some relevant parameters such as recommended green space rations. For landscapes on structure, we recommend land uses are added as multiple layers on top of the architectural land uses.
With the new infrastructure land uses under the hardscape category in Version 2, the new recommended best practice is to only add these when large-scale items are known but otherwise not reasonably included in other land use descriptions. These include items such as large stormwater pipes and manholes, transformers, pump stations, and controllers Users can add them in the same method by assigning to drawing land uses, or by simply adding manually by typing in placeholder area take-o�s.
SoftscapeLandUses
The softscape land uses combine the embodied carbon for planting methodologies with the carbon stored and sequestered from the ecological carbon. In general, these land uses are focused primarily on planting, soil, amendments, and planting transportation and installation, and then the subsequent growth and sequestration of carbon in biomass and soils. The main factors for consideration include planting typologies with import versus amended soil, irrigation or no irrigation, and ecosystem typology.
An exception is the average tree cover land uses. These land uses are for use in overlay studies in large-scale master plans (such as assessing the impacts of adding 50% tree canopy to all the open space in a city) These factors are derived from the work of David Nowak, and only account for the actual trees planted themselves, and no other site preparation work. We recommend using these values as overlay layers for streetscape sidewalks and parking lots, on top of the other land use mapping, or using as one-o� studies not part of a specific layout.
A new collection of street tree typologies under softscape specifically provides for the carbon footprint for the areas within a given tree pit and includes the associated hardscape assemblies. Tree pit typologies include various pavement types and tree grates, as well as proxies for gravel-based, sand-based, and suspended structural soil systems As a best practice, we recommend using these land uses only in the footprint of the tree pits themselves, extending to the limits of anticipated structural soils, and then using the average tree coverage land uses for the remainder of your anticipated crown projection. Similar to the street trees, the extensive and intensive green roof typologies also include the full green roof assembly in the footprint of the green roof, including drain mat, lightweight structural fill, irrigation, etc. Waterproofing and roof assemblies are included within the WBLCAs used as a basis for the architectural land uses, so to calculate a building with a green roof, users need to add a green roof layer to architectural land use.
The last addition to softscape includes a few amendment land uses. These are to be added to other softscape land uses as relevant, adding more mulch, compost, or biochar. From a carbon accounting perspective, adding mulch net adds slightly more embodied carbon to the project, but it will reduce the operational demands for water and can be important for soil maintenance Adding compost (which is generally recommended to be carefully considered during soil testing and specifications development in detailed design phases) can net store more carbon in the site through long-term partial contribution to SOC Adding biochar can store significant amounts of carbon in the soils, as it is almost 100% carbon produced through a relatively low-energy pyrolysis process (Akhil et al , 2021; R D. Bergman et al., 2017; Gaunt & Lehmann, 2008; Joseph et al., 2021; Leppäkoski et al., 2021).
Conclusions:HowtoDesignwithaCarbonConscience
In the course of our research, a few key principles emerged as consistent concepts towards designing with a Carbon Conscience, and are similar to concepts shared in other carbon calculators and aggregate literature reviews of LCAs. These principles address the biggest potential impacts that can reduce the embodied carbon of a project early in the design process. These principles we share below are focused on carbon and do not address social, cultural, biodiversity, aesthetic, or economic values that would also be considerations within the design process On the Carbon Conscience website, we expanded these principles in a collection of interviews with leaders in low carbon design as well as Carbon Conscience Guidelines with short summaries of best practices. Sasaki will actively curate both of these collections.
Keydecisionsearlyinthedesignprocesscanhavebigimpactsonembodiedcarbon. The embodied carbon impacts of new buildings can be 2 to 10 times that of landscape per floor. When dealing with multi-floor structures, the impact is scaled to the number of stories, geometrically increasing the carbon impact Key decisions for buildings early in the process can have the biggest impacts on an overall project's carbon footprint, from size and program to structural and envelope considerations, and the proportion of existing sites preserved or ecologically restored.
Design compact buildings with e�cient use of building materials The use of the Carbon Conscience tool can demonstrate that compact, mid-rise buildings are most e�ective at accommodating a space program with the least amount of structure, foundations, and exterior envelope. When balanced with operational energy reductions for passive solar orientation, daylighting, and ventilation, this strategy can help minimize the impact of our design work on the environment
Wherever possible, consider the adaptive reuse of existing structures before planning for demolition or new construction. Because approximately 75% of the embodied carbon of a building is in the building structure, consider the reuse of an existing building structure while updating the envelope, systems, and interiors. Explore future implications of these choices in terms of code compliance upgrades, phasing and scheduling, and any potential for hazardous waste mitigation. Future versions of Carbon Conscience will allow users to explore adaptive reuse scenarios at the planning scale.
Consider the selection of a structural system early in the design. The Carbon Conscience tool can demonstrate the importance of minimizing the use of concrete and steel. With concrete structures, minimize the use of cement in the concrete mix. For all new building projects, consider the use of mass timber for structural systems, within the constraints of building codes, and limitations for long spans in timber. Understand the implications of structural choices on relevant factors that will impact the future design, including bay spacing, floor-to-floor heights, maximum long-span challenges, and code requirements. Optimize the structural grid for material e�ciency.
Consider facade material selection early in the design. Use wood and brick facades where possible, using natural materials low in embodied carbon. Minimize the use of curtain wall and spandrel glass construction, to reduce emissions from embodied carbon while maximizing passive strategies to lower operational energy Understand the implications of facade materials choices on relevant factors
that will impact future design, including maintenance considerations, durability, and longevity. Source materials as locally as possible.
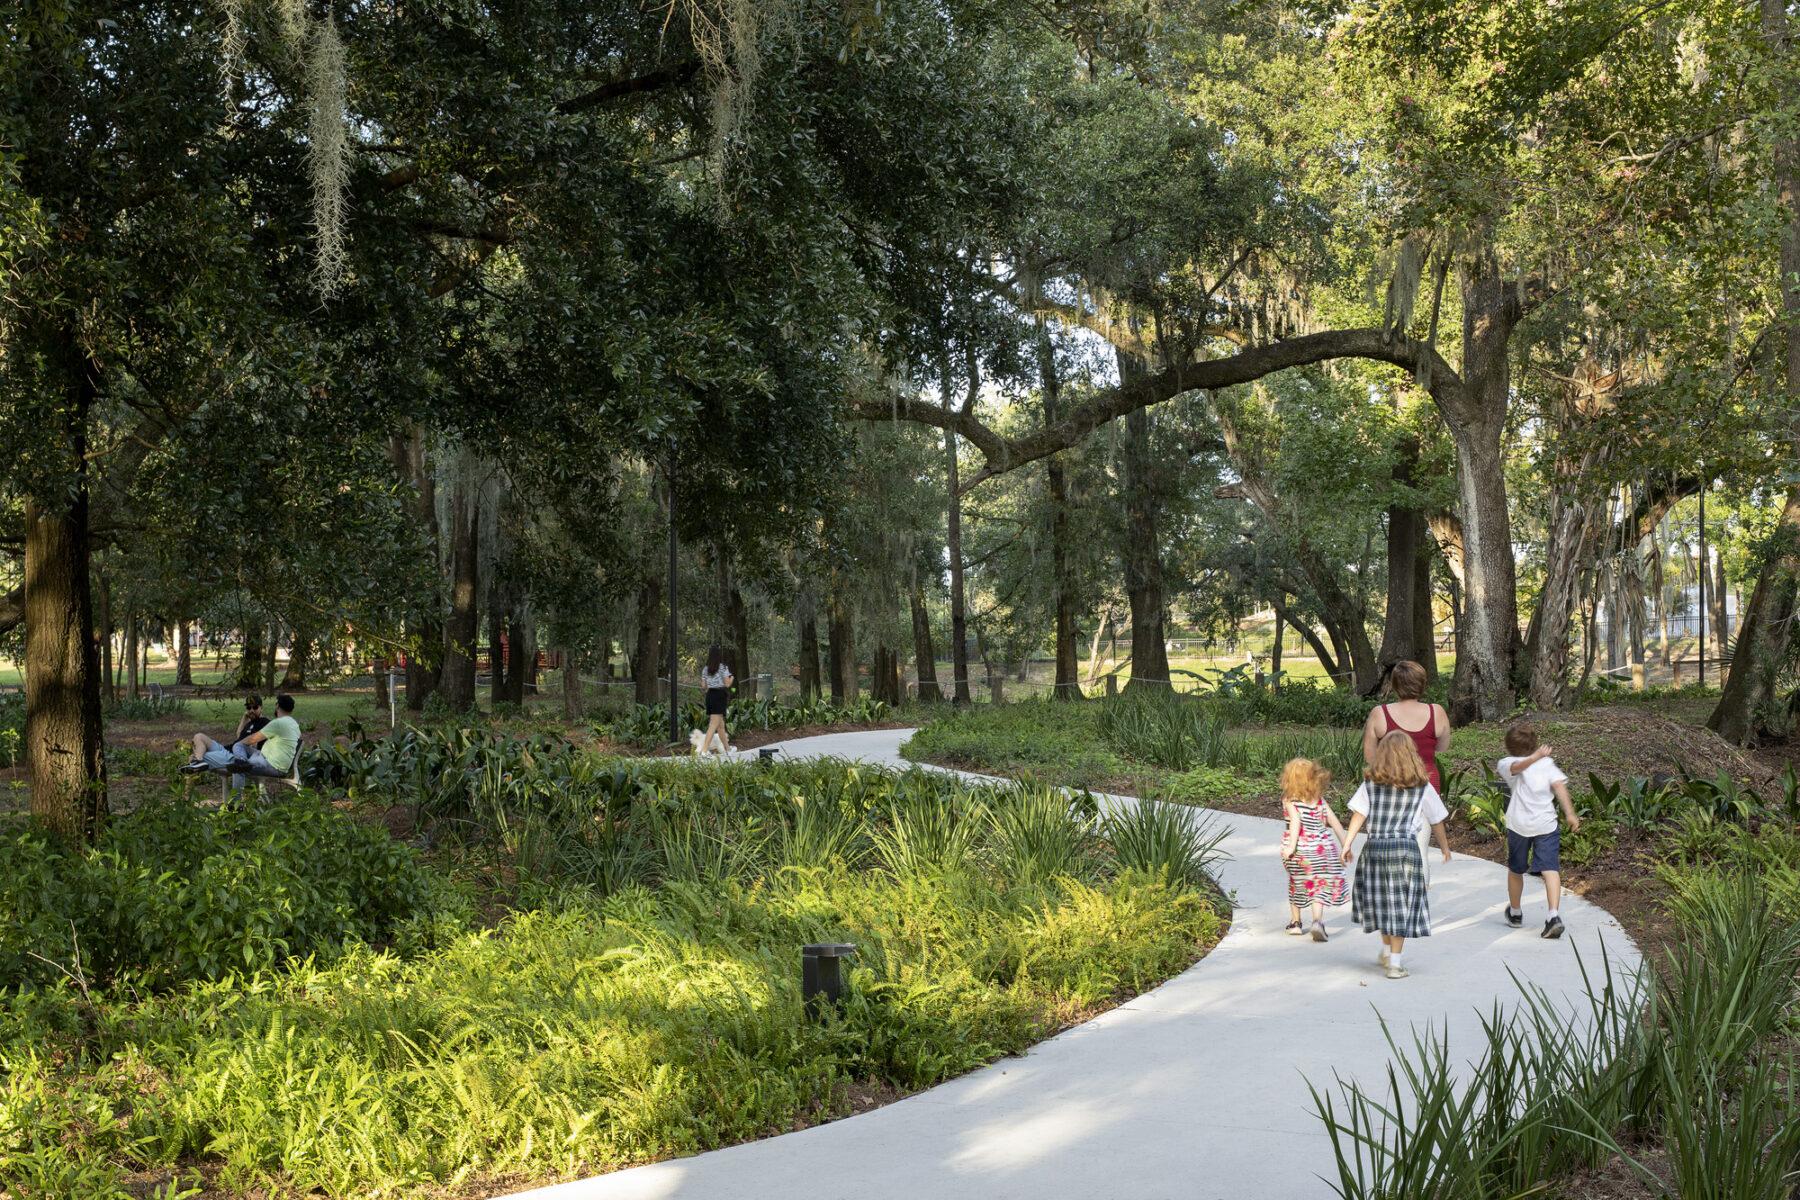
Preserveandprotectexistinghabitats,withapriorityformatureforestsandwetlands. One of the best ways to limit emissions from site demolition is to protect existing onsite carbon stores Forests and wetlands can have a very high amount of carbon stored, ranging from 8 kgC/m^2 to over 20 kgC/m^2 (Pan et. al., 2016). The best way to preserve these carbon stores is to manage existing habitats, monitoring and protecting their health during and after construction. In comparison, the demolition of surface pavements and minor structures is relatively low carbon emissions, especially with large demolition equipment and short transportation distances.
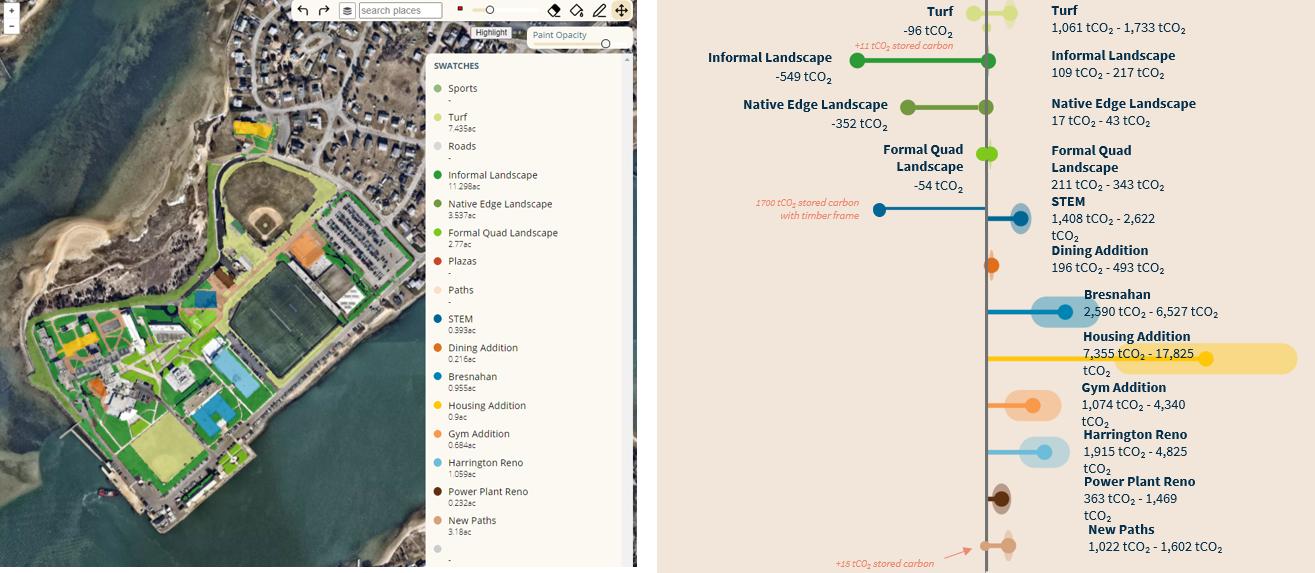 Figure23�ViewfromabetastudyusingCarbonConscienceVersion1,showingoptimizedbuilding footprintstominimizecarbonemissions,andconversionofabout40%ofcampusturfandgarden landscapeintohighercarbonsequesteringrestoredecosystems
Salvagematerialonsiteandlimitconstructionwastetransportation.
For larger sites, onsite salvage and processing of waste hardscape materials such as concrete pavements, aggregate base, or bituminous pavements can have significant savings in transportation costs (Mukherjee et al., 2011) and o�set imported material costs (Jiménez et al., 2018). While salvage is limited to key hardscape and aggregate items within the calculator, in a detailed design project there is a wide range of creative strategies for material salvage and reuse, all of which can be leveraged for significant design impacts and low carbon costs.
Figure25�Forlargesites,salvagematerialcandramaticallychangetotalprojectemissionsandbe economicallycompetitivewithimports AcasestudyfromHellinikonParkinAthensGreeceproposesthe reuseofover150,000cubicmetersofhardscapematerials,upcyclingtofurnishingsanddowncyclingtorip rapandroadbase,�SasakiwithsupportfromAtelierTenandDoxiadis+)
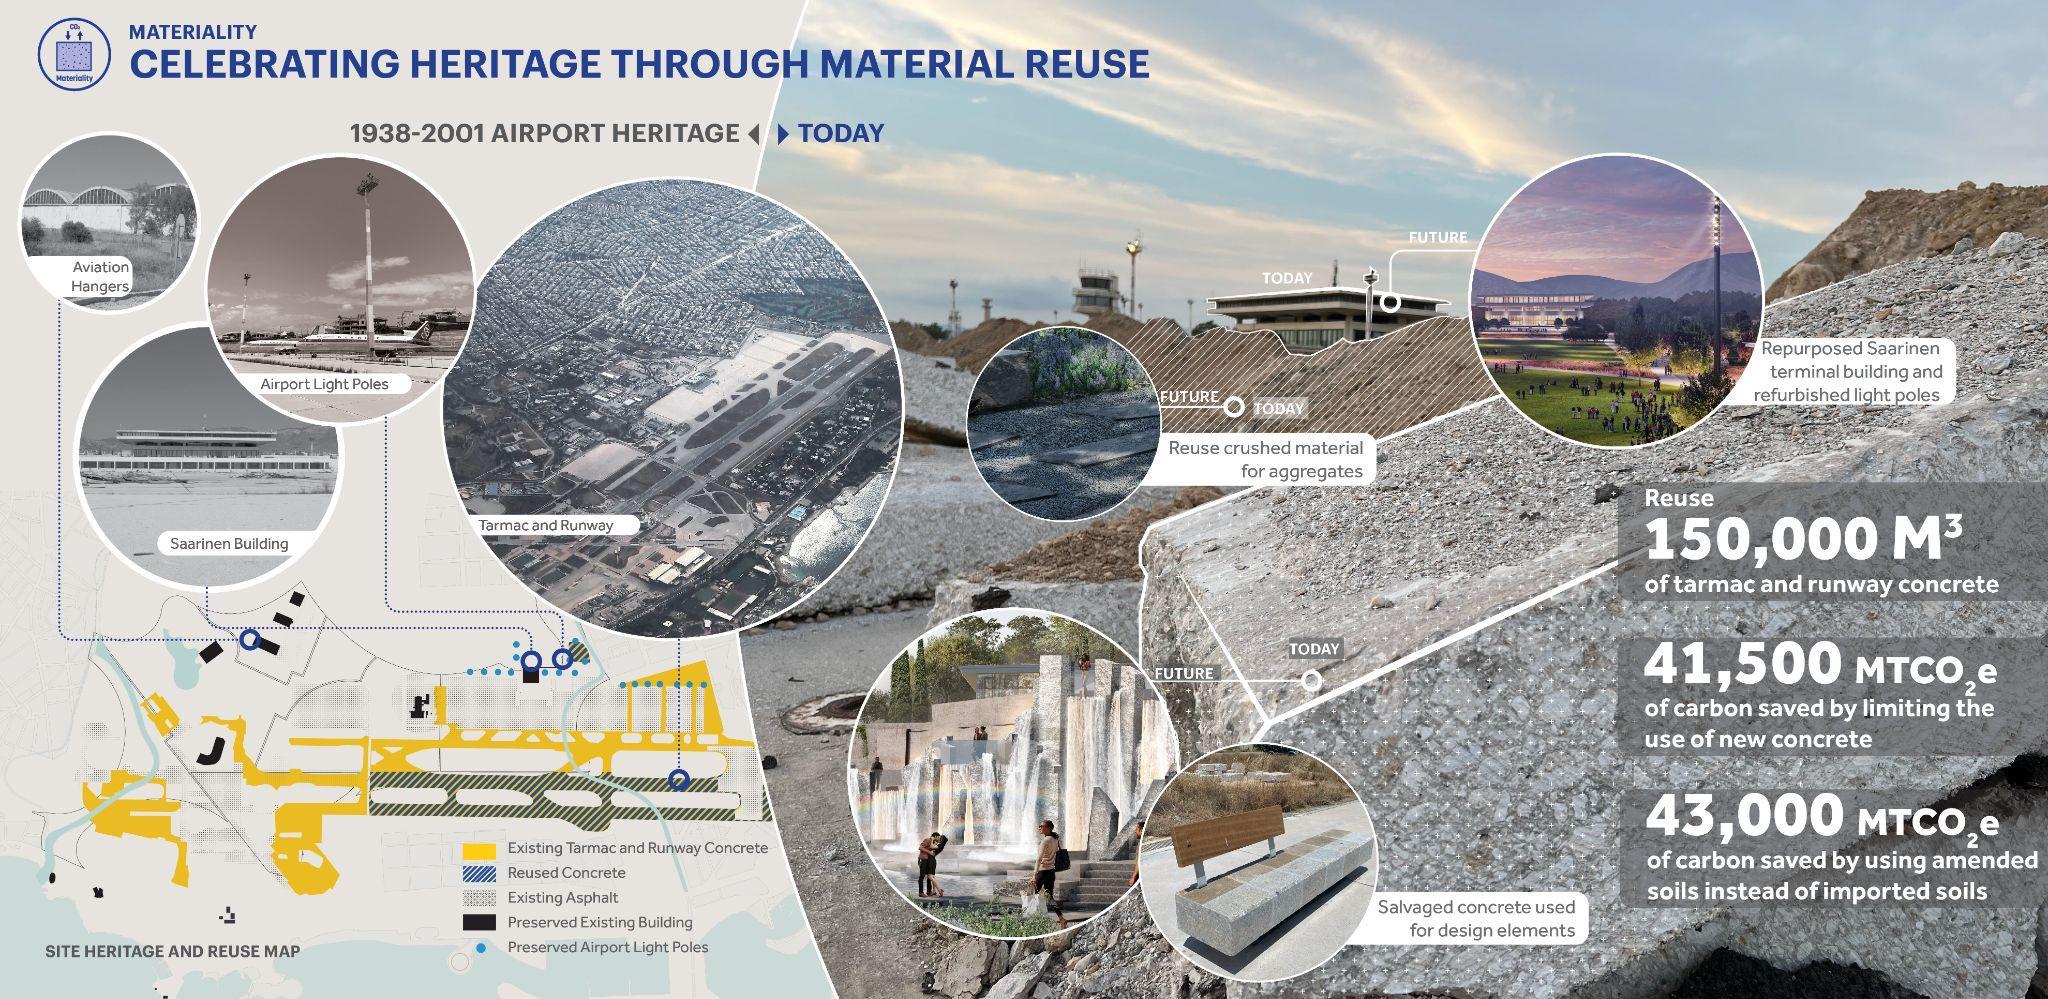
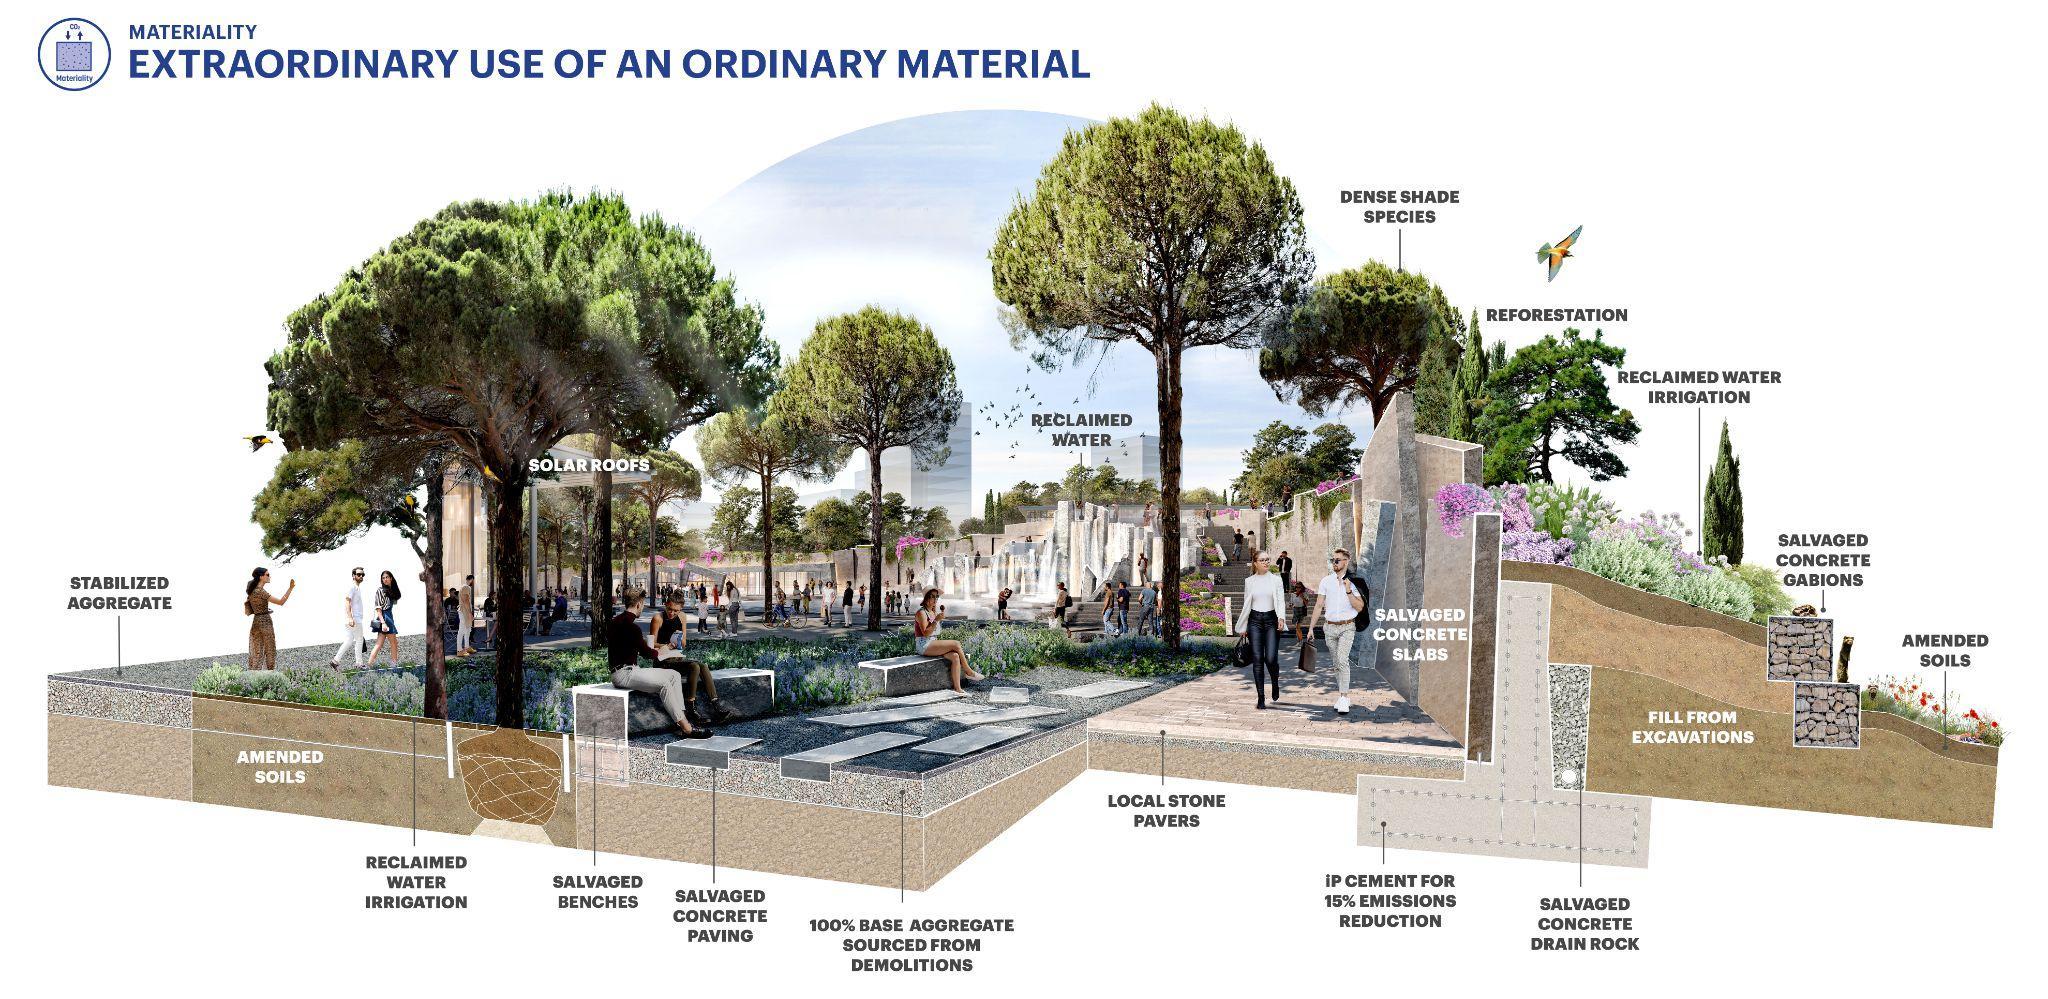
Minimizehardscapeandmaximizelow-maintenancesoftscapelanduses. Hardscapes always have a net carbon cost and should be used frugally, with a specific function, use, or expression that is worth the investment in money and carbon impacts. The scaling of hardscapes compared to their intended use has become common in many design communities, from oversized civic plazas in Asia to oversized parking requirements within the United States. The return to human-scaled environments, championed by designers such as Jan Gehl, nonprofits such as the Project for Public Spaces, and academics such as Serge Salat and Anne Whiston Spirn, has been an interdisciplinary movement that is slowly influencing regulatory institutional reform. Advocating for a higher proportion of high-quality, biodiverse green space within projects and reducing hardscape e�ectively trades a carbon negative (or net emissive) land use for a carbon positive (or net sequestering) land use.
Often in designed landscapes, there is a tendency to gravitate toward large use of turf, or smaller, more highly maintained garden spaces These tendencies lead to a default of medium maintenance landscapes that require significant commitments in regular mowing, blowing, and chemical treatments (Lerman & Contosta, 2019; E. G. McPherson et al., 2015; Zirkle et al., 2011). The cultural reasons for this approach are varied and complex, from aesthetics to tradition to Crime Prevention Through Environmental Design practices That said, usually the higher net carbon-sequestering land uses are natural, self-sustaining systems, requiring periodic or no maintenance. Advocating high carbon sequestering ecosystems will have the added benefit of also advocating for low-maintenance landscapes.
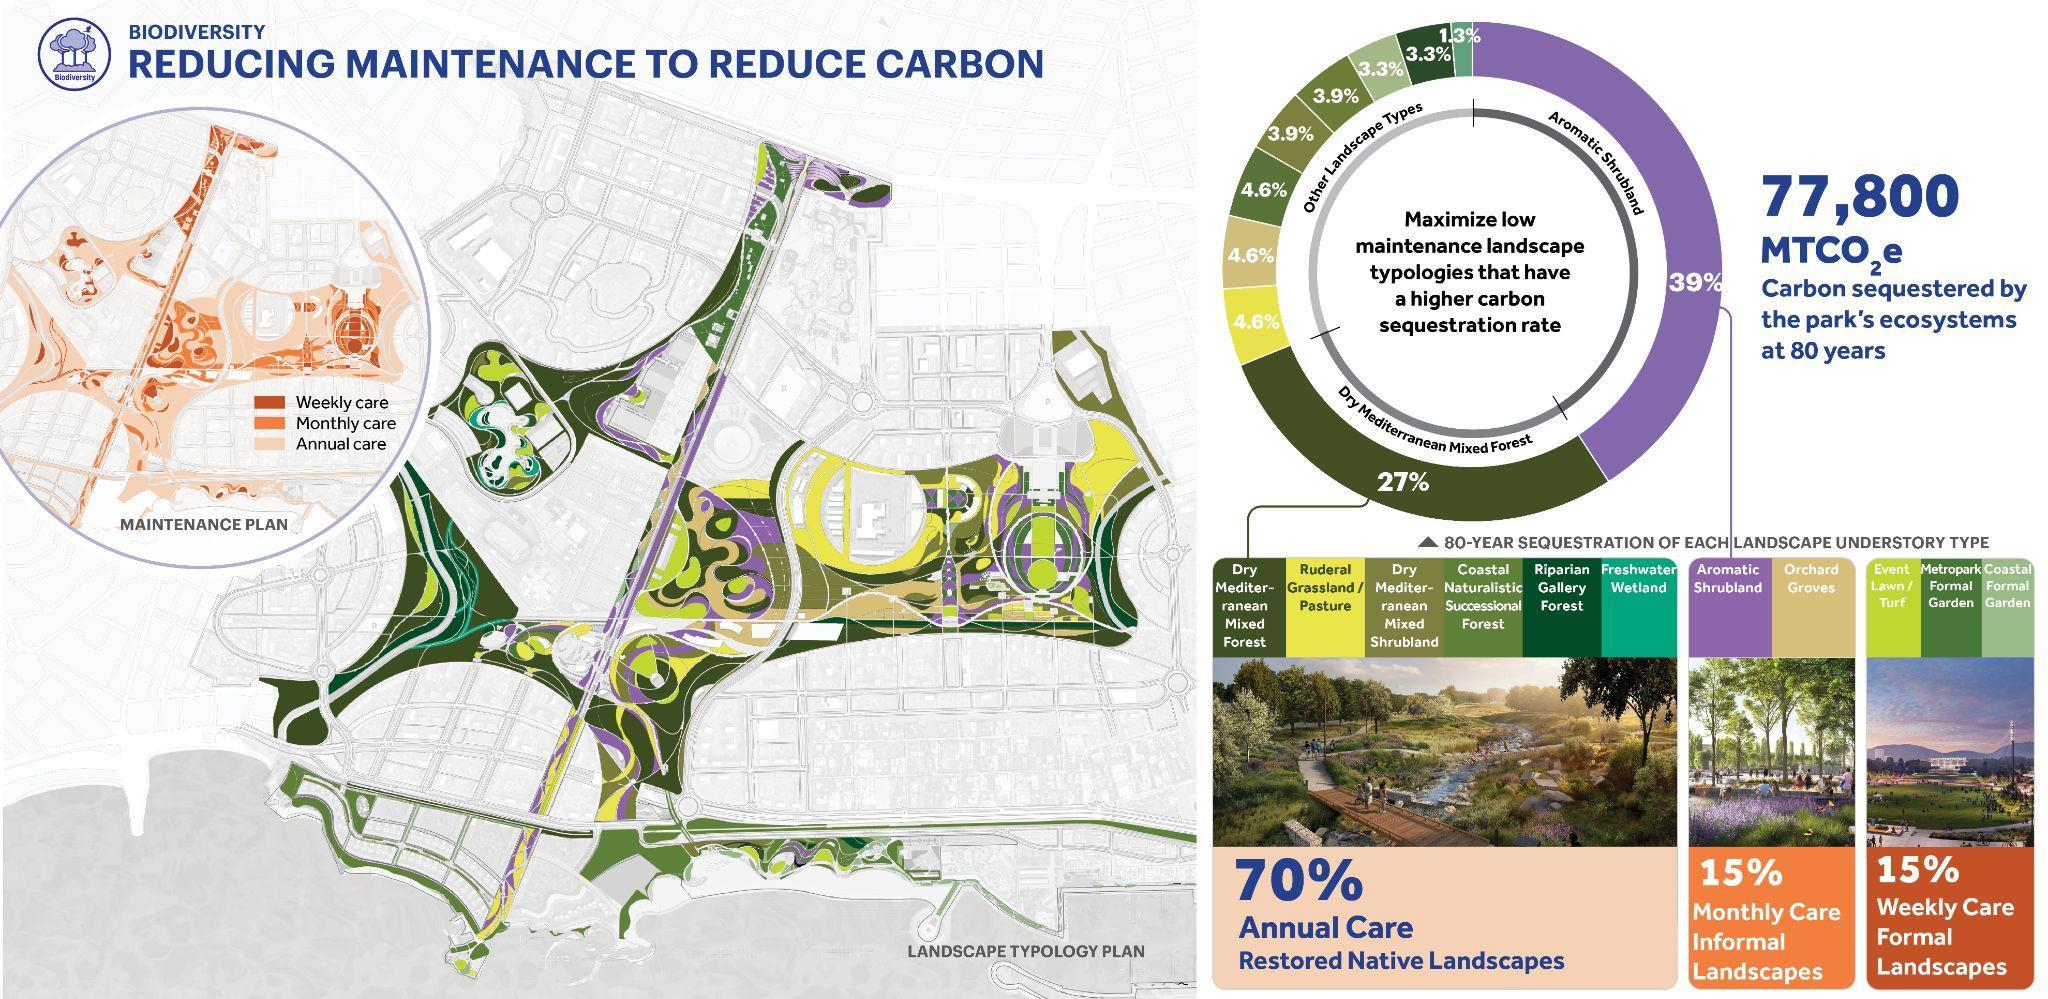
Minimizetheuseofconcreteandconventionalcementinbotharchitectureandhardscapesite work;explorealternativetypesofcementandalternativematerialstoconcrete.
Concrete is the highest embodied carbon masonry hardscape material due to the carbon costs of cement fabrication, requiring high energy inputs to produce clinker through sintering, and emitting CO2 as a chemical byproduct of its formation. While there are numerous studies and research into low-carbon concrete, the industry standards most commonly used are Type I and Type II Portland cement. The three most common substitutes found are Type IP, IS, and IL cement. Type IP cement is a Portland-pozzolan cement blend that replaces a portion of the cement with pozzolanic ash and is suitable for the replacement of Type II Portland cement. Similarly, Type IS and IL cement is a Portland-slag cement blend, and a Portland-limestone cement (Cannon et al , 2021; ICC, 2021; Johansen et al., 2006), that is suitable for replacement of Type I Portland cements. Carbon factors for these types of cement were found to be lower, varying per specific cement composition and fabrication facility (Building Transparency.org, 2023; Hammond & Jones, 2008; Jafari, 2021).
Substitutefabricatedconcretematerialswithquarriedmaterialsorair-driedbrick. The carbon factors of quarried and finished stone are lower than those of typical Portland cement concrete (Hammond & Jones, 2008; Kittipongvises et al., 2016; Mukherjee et al., 2011). Crushed aggregates and mined and screened sand are also much lower than typical concrete Assuming approximately equal transportation costs, the replacement of concrete with stone for such assemblies as dry stack stone walls or stone pavers over a compacted aggregate base with sand-swept joints can have dramatic carbon savings. Note, however, that these savings are e�ectively lost for stone veneer assemblies, which rely on concrete for their structure, when stone pavers overlay a concrete sub-slab, or when the stone has to be shipped significantly longer distances than a concrete alternative. Air-dried brick has similar savings to the use of stone, however, kiln-dried brick has a carbon factor closer to or slightly higher than typical concrete (Crawford et al., 2019; Dabaieh et al., 2020; Hammond & Jones, 2008; Mohan, 2016; NSF, 2020)
Minimizetheuseofmetalsandplastics.
Metals and plastics are both carbon-intensive classes of materials Metals require mining, smelting, and fabrication; in some cases, this involves high amounts of energy, such as for aluminum smelting from ore (Antti, 2013; Building Transparency.org, 2023; Carlisle et al., 2021; International Aluminum, 2021). Within the steels, mild steel is the most carbon e�cient, even when accounting for a paint application, followed by galvanized steel and then stainless steel, due to the carbon costs associated with zinc versus chromium and nickel (AGA, 2022; BE Group, 2023; Hammond & Jones, 2008; NSF, 2015). Plastics and high-density foams are often petrochemical products that require complex fabrication and carry high carbon factors (Crawford et al., 2019; Flannery & Mares, 2022; Huntsman, 2021; NSF, 2014)
For metals and plastic necessary to include in projects, maximizing recycled content will significantly reduce carbon footprints (Antti, 2013; EPA, 2023; GLE, 2018; Shash et al., 2014; Sizirici et al., 2021; Stephen, 2020; Tinz et al , 2022)
Prioritizetheuseofwood,asalowcarboncostandhighcarbonstoragematerial. Mass timber framing for large-scale projects and conventional wood framing for single- and multi-family residential are clearly the lowest-carbon structural materials available (De Wolf, 2017; Place et al., 2021).
Wood facades are the lowest-carbon cladding materials available for facades, although great care must be taken in detailing to make sure that they are durable and moisture-resistant. Clients must be prepared for any maintenance schedules necessary to refinish or repaint wood facades over time and be informed as to the expected lifespan of these and all systems. The selection of wood for exterior facades must be made carefully and within the context of woods available in the region of the project location. All wood should be sourced from companies that harvest with certified sustainable practices, such as Forest Stewardship Council (FSC) certification.
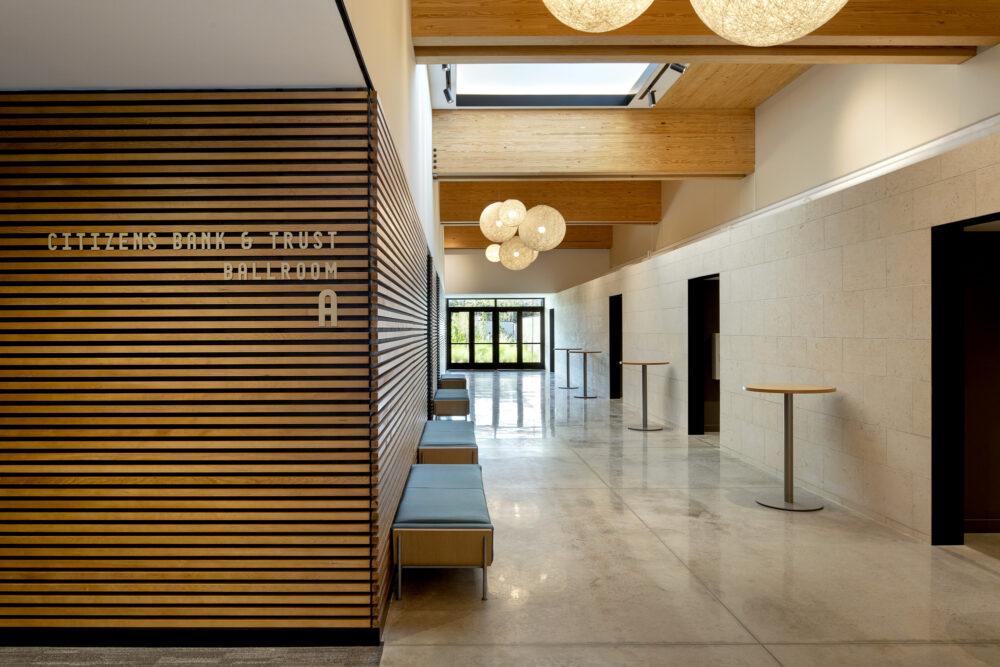
Sustainably harvested wood products can take advantage of high carbon sequestration rates in young tree stands and store the carbon in the built environment (R. Bergman & Bowe, 2008; Himes & Busby, 2020). The use of sustainably harvested wood should be encouraged as a carbon store within the built environment and detailed to last for decades. Domestically sourcing wood can halve the embodied carbon through the reduction in transportation costs While tropical hardwoods such as Ipe have become standard decking materials in the landscape, domestic alternatives such as black locust, cedar, and redwood are all equally rot and termite resistant, if not equally hard. The desire for tropical lumber is often driven by both aesthetic and durability concerns and is understandable when designers consider a Janka hardness rating of 3700 LBF for Ipe compared with 450 LBF for redwood or 350 LBF for cedar. In the United States and Europe, Black Locust (Robinia pseudoacacia) comes to the closest in hardness rating for decking materials with a hardness of 1 700 LBF(Meier, 2023).
Relatively new wood products have addressed this need, including a range of thermally and chemically treated wood products that either use torrefaction or acetylation to e�ectively melt the lignin in the wood tissue to create a hard, rot-resistant matrix in the wood products (Aro, 2018). In the Carbon Conscience calculator, only thermally modified decking was added to the land use data set due to a lack of LCA and EPD studies found for chemically modified products
Figure27�UseofmasstimberandwoodrainscreensatBonnetSpringsParkEventCenter,bySasakiIn addition to the reduced transportation costs associated with domestically sourced hardwood, there has been increasing reporting of illegally harvested timber products entering global trade (Brack, 2005; FSC Watch, 2023). This increases the importance of Chain-of-Custody (CoC) certifications and stamping of timber, especially as local regulators are moving away from cargo certification, such as in Brazil and Indonesia (Jong, 2019; Spring, 2020). We recommend international wood products be certified by third-party organizations, such as the Sustainable Forestry Initiative (SFI), the Programme for the Endorsement of Forest Certification (PEFC), or the FSC. Note, company certification alone may not su�ce to guarantee product origin, but rather stamped timber with a documented CoC sourced from a certified managed forest or stand. For more information on this issue, please see https://forestlegality org
Minimizeturfgrassesinplantingdesign,savingthemforhigh-useareas.
From a carbon-sequestered and stored perspective, turf grasses can sequester carbon and e�ectively contribute to carbon stored in soils if properly managed (E. G. McPherson et al., 1999; Pouyat et al., 2006; Qian & Follett, 2002). In addition to its living biomass, turf that is mowed and mulched, or allowed to develop thatch, can increase carbon stored in nonliving material and soils. However, in comparison to other softscape land uses these contributions can be relatively low (Townsend-Small & Czimczik, 2010).
Prioritizationoflowmaintenancenativeprairieandriparianrestorationecosystemsforin betweenspaces,insteadoflawns,atDellMedicalDistrict,UniversityofTexas,�Sasaki).
From an embodied carbon perspective, turf grasses have a high range of carbon emissions based on their farming and installation (Watkins et al., 2011). Sod turfs are likely to result in net carbon costs or emissions, regardless of future maintenance programs. If turf is sourced as sod, then the most likely methods of growing involve the use of diesel tractors for regular mowing as well as fertigation, both of which have relatively high carbon outputs (Selhorst & Lal, 2013), as well as the harvesting and transportation costs associated with including the average one inch of soil with the cut sod. In comparison, turf seed can be farmed with much lower energy inputs (Smetana & Crittenden, 2014), and saves on the transportation costs of the mass of the soil Hydroseeding has variable carbon costs associated with their fertilizers. We recommend using compost tea or options with organic sources of
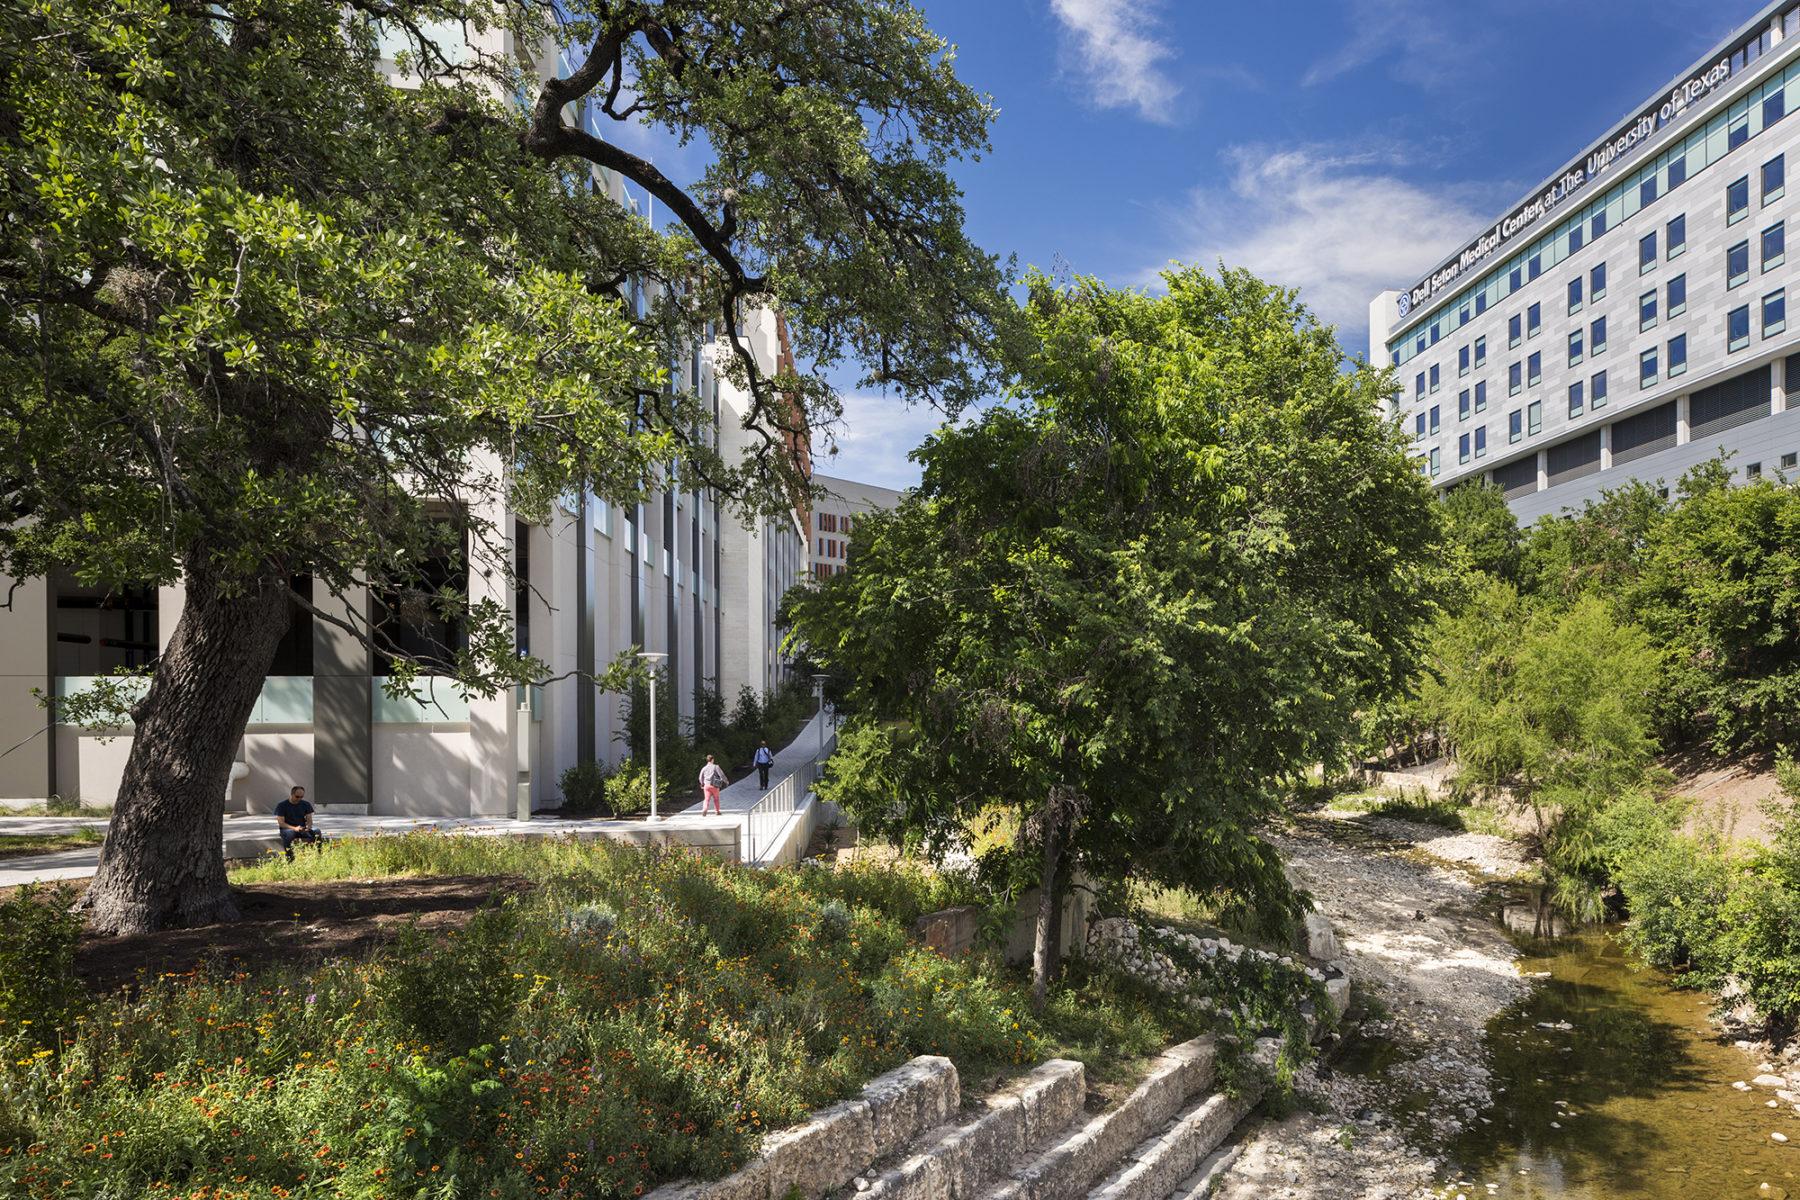 Figure28�
nitrogen when specifying hydroseed installation, or generally minimizing chemical inputs as industry standards often significantly over-fertilize compared with what is actually needed for optimum growth and health (Portmess, 2009; Rossi, 2020) Similarly, sprigging, a common method for installing rhizomatous turfs, can have low or high carbon costs, depending on farming methods, but saves on transportation costs in comparison with sod.
We did not include the operations costs associated with turf lawns, as they can range from low to high carbon inputs, with high inputs for maintenance being more industry common. In comparison with other softscape land uses, turf is a relatively low performer compared with forests, prairies, or wetlands from a carbon sequestration and storage perspective. We recommend strategically using turf only for high-use spaces, such as sports fields or event lawns, and note that natural turf has an embodied carbon benefit over synthetic turf. We would recommend exchanging other potential turf areas for restoration ecology. For current turf industry recommendations, please refer to the Sports Fields Management website of Cornell University, (http://safesportsfields.cals.cornell.edu/).
Maximizehighcarbonsequestrationlanduses,whereappropriate.
The highest-performing carbon-sequestration land uses are ecosystems that lock carbon in sediments due to anaerobic conditions, such as peat bogs, salt marshes, wetlands, and mangrove forests (Alongi, 2012; Asada et al., 2009; Mack et al., 2021). In these ecosystems, the annual sequestration of carbon into living biomass has the highest transfer of that carbon into long-term carbon stores once the vegetation dies and is locked in sediments, even beyond full ecosystem maturity. Depending on the region, forests can be equally e�ective, with a notable example being oceanic temperate rainforests, which have both high annual sequestration and significant carbon masses stored in soils (Easdale et al., 2019; Pan et al., 2013).
While the Carbon Conscience calculator uses metrics taken from averages across large-scale GIS research projects, forests even within the same region can be very heterogeneous in terms of composition and carbon-carrying capacity. When comparing stands and forests of similar type, structurally complex forests, with emergent canopy species, canopy species, and understory species, can contain higher amounts of biomass and sequester and store more carbon per unit area year than similar forests in monoculture or with limited diversity (Gough, 2021; Patton et al., 2022). Structural complexity can be a better carbon-storage indicator than species biodiversity, as some forest types can be extremely biodiverse but have slower growth rates and less carbon stored in biomass (Buotte et al., 2020). However, as a general rule, higher biodiversity is usually correlated with higher anticipated carbon stored within a given ecosystem typology (Schroth et al., 2011).
Prioritizenatural,local,andreusablematerials.
The more complex the fabrication of a material or product, the higher its associated carbon costs
Prioritizing the use of materials that can be quarried or harvested, from sand and aggregates to wood, is one of the single most e�ective ways to mitigate the carbon impacts of construction (Reddy, 2009). Materials that require calcination (such as concrete), oil input (such as bituminous pavements), smelting ore (such as metals), or complex chemical processes (such as plastics), all have substantial embodied carbon in the creation of the material.
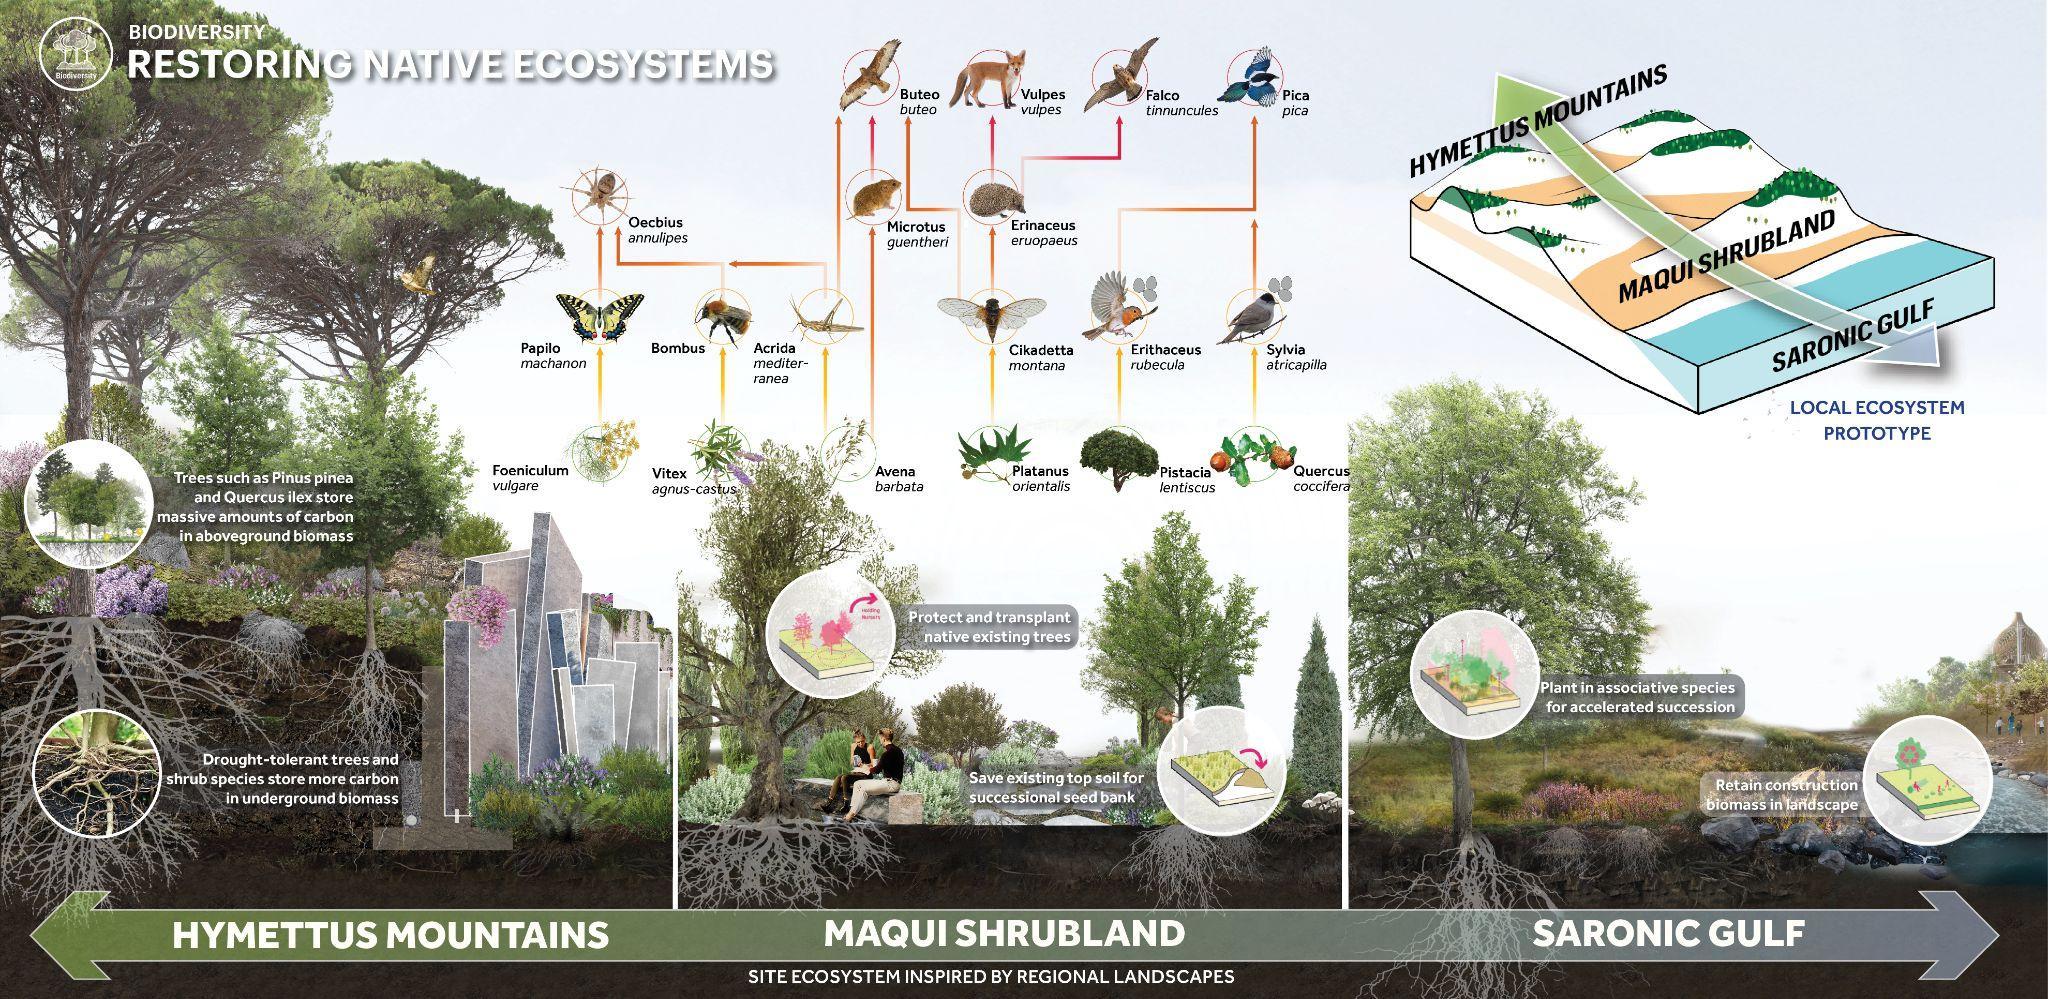
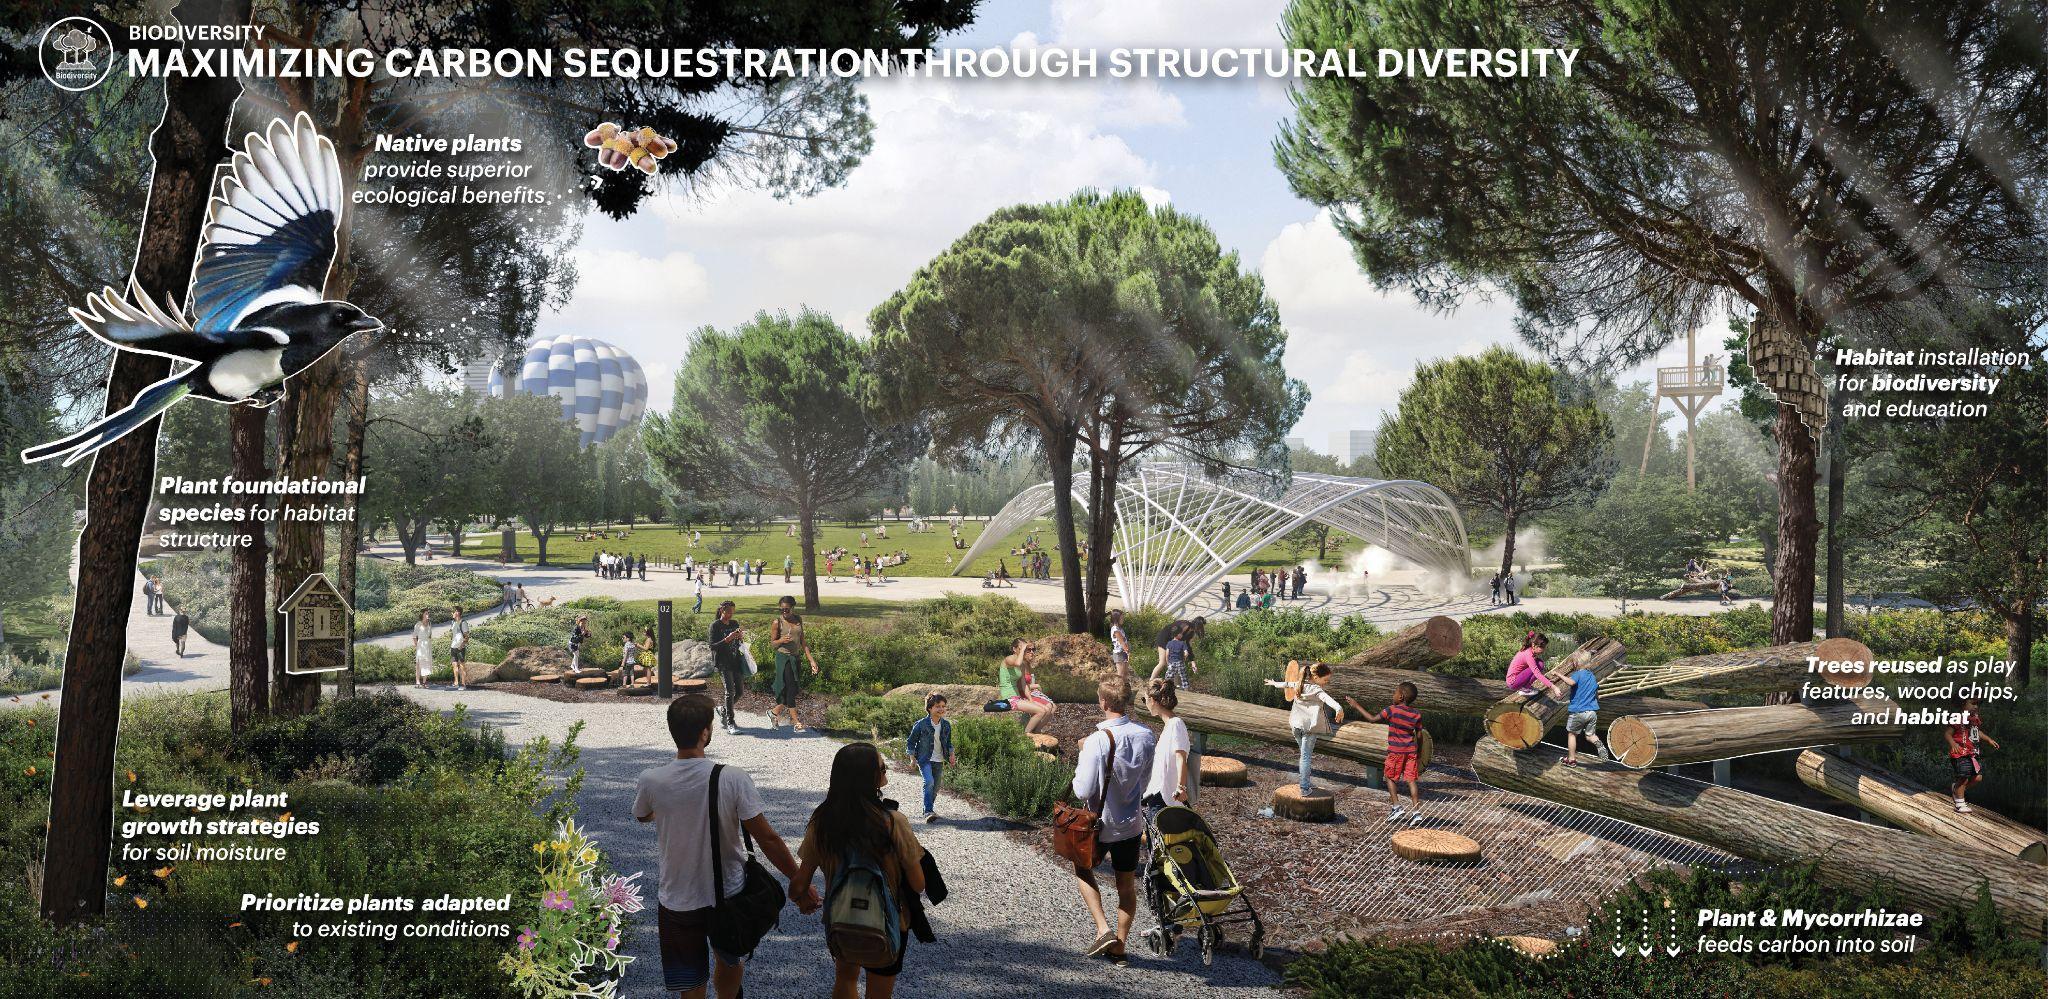 Figure29�PromotingbiodiversityandstructuralcomplexplantingdesignatHellinikon,inAthens,Greece, �SasakiwithsupportfromAtelierTenandDoxiadis+)
Transportation to a site, especially for masonry, metals, and heavy products, can be a substantial proportion of the embodied carbon of any given product or material (Gan et al., 2016). Note, in LEED V4, the regional materials credit was revised from a 500-mile radius to 100 miles e�ectively a reduction of 25 times in the sourcing area. While this raises the bar for this credit, we found the comparative carbon savings following this radius to be substantial. Using locally-sourced materials reduces this transportation-related carbon cost.
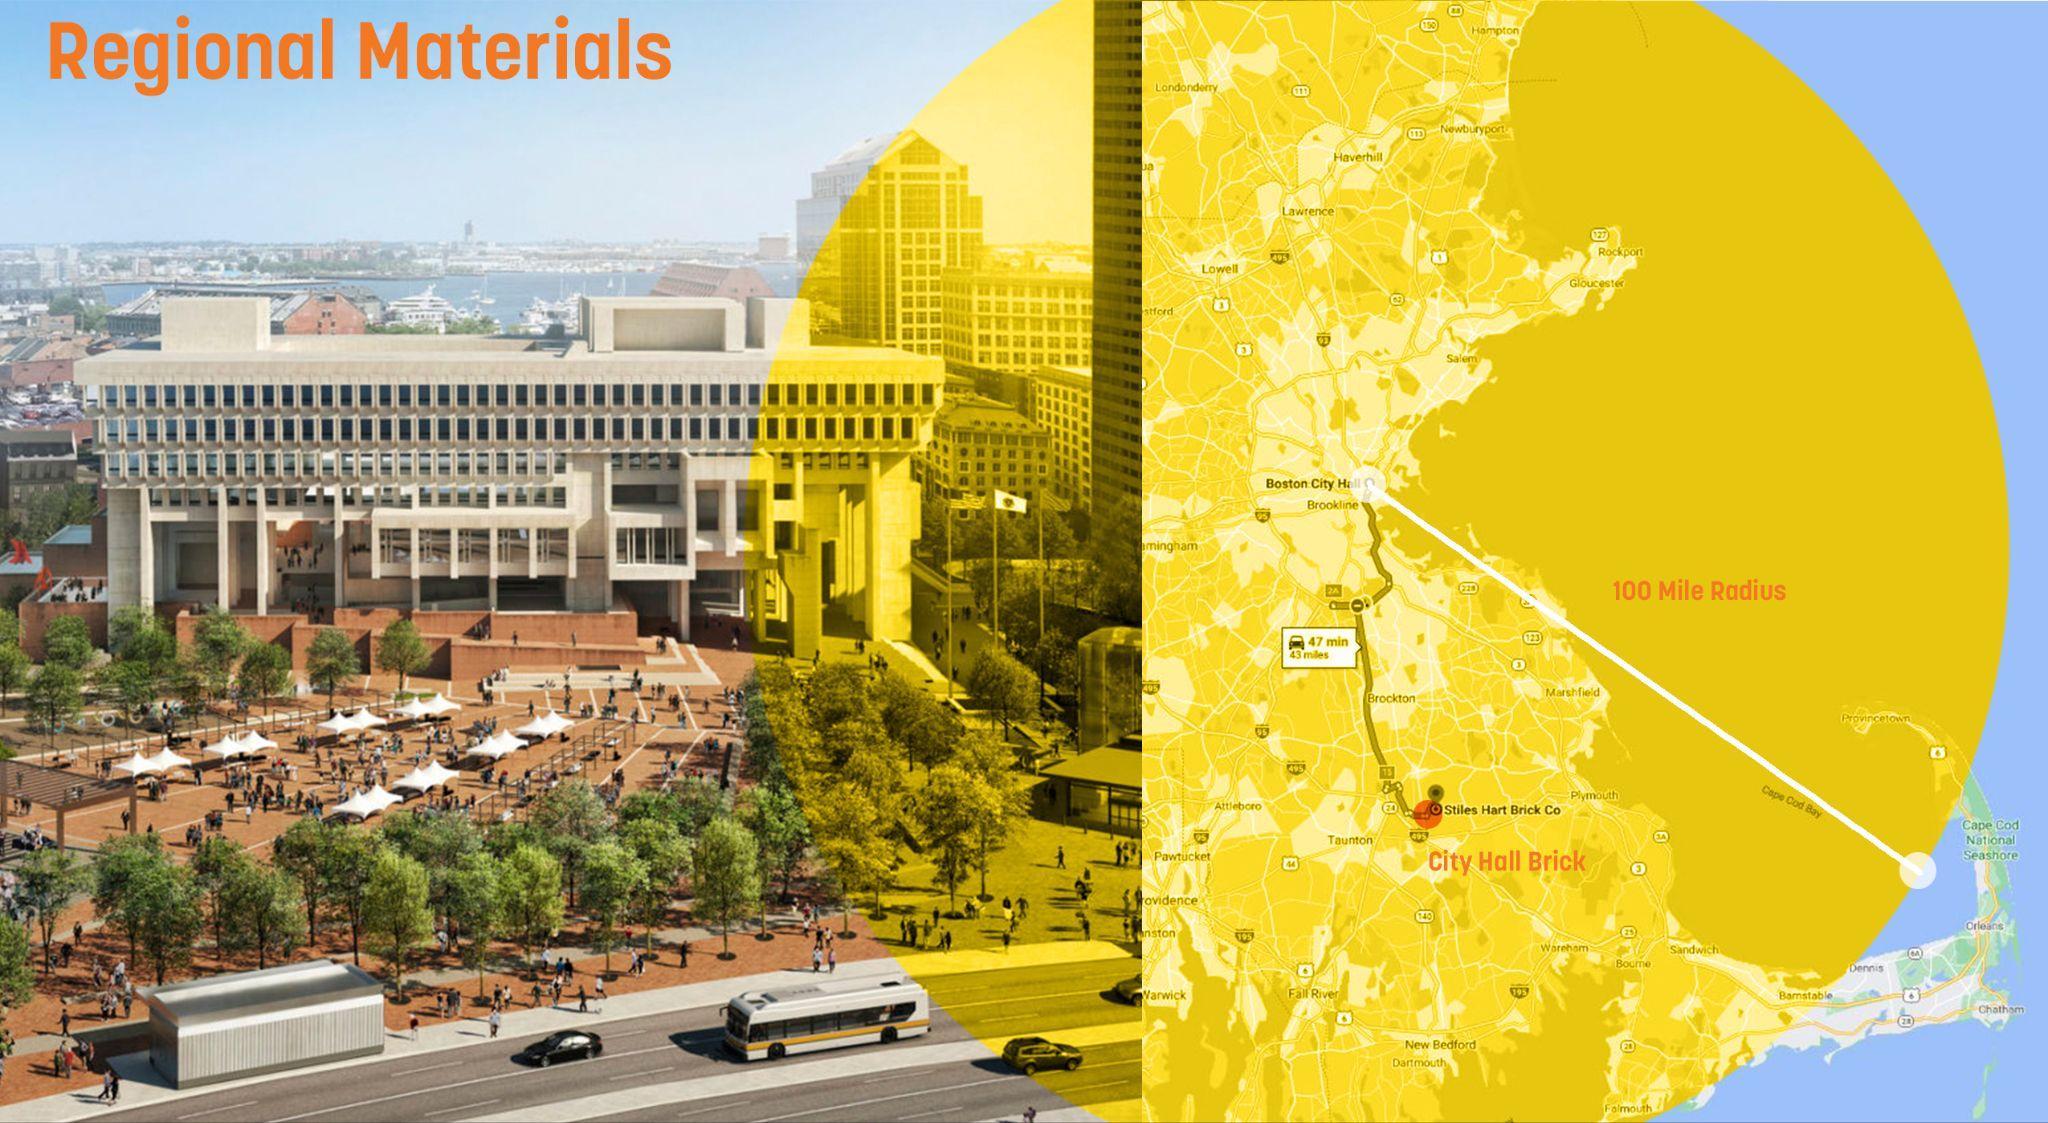
Installation is only one part of a project, material, or product life cycle Where possible, using salvaged materials, reusing materials already on site, or upcycling materials can e�ectively remove the embodied carbon for that material from the calculation of a given project (McDonough, 2002). This principle can apply to big moves, such as adaptive reuse of buildings, down to resetting cobble pavers. One way to enable this for future projects is to select durable, natural materials and consider the full life cycle of assemblies to prioritize future reuse (Simonen, 2014)
Lessismore.
Designing with a Carbon Conscience reconsiders the evaluation of a proposed design or plan from the perspective of the relative impact on our climate, as an additional factor to consider alongside economics and aesthetics. It reveals the comparative impacts of embodied carbon for various land uses and enables iterative design informed by carbon impacts. It shows that doing less, from a building or hardscape perspective, is always going to result in lower embodied carbon for construction. It also reveals that carbon-negative softscapes require significant amounts of area to o�set emissions from buildings or hardscapes.
We do not intend for this application to be a stand-alone factor in the evaluation of a design Within this tool, infill development in a densely populated community served by transit would have a high embodied carbon per area score compared to greenfield development of similar size but with large existing-to-remain woodland or softscape design. Carbon Conscience is best used to evaluate options within a given project, to help make design teams and clients aware of what decisions they can make to reduce the anticipated emissions from the construction of their projects.
Figure30�LocalsourcingofbrickforBostonCityHallPlaza,�Sasaki).BeyondCarbonConscience
The following section addresses a number of issues, concerns, and concepts not covered by the development of the Carbon Conscience tool, but enlightened by this research, and critical for the further advancement of understanding how we reduce the carbon impacts of the built environment. We share these thoughts to inspire our community, encourage prospective students, and perhaps help start some conversations.
Beyond providing a database for Carbon Conscience, our research revealed a strong need for investment in academic research in many areas of the built environment. While some subjects, such as carbon emissions associated with concrete, are exhaustively researched, others, such as embodied carbon associated with recycling processes, appear to have a less robust representation in the literature. Similarly, extensive studies have been conducted on carbon sequestered in living tissue of specific tree species or through di�erent agricultural approaches, but carbon sequestration for gardens and urban landscapes has been studied by a relatively small group of experts, and those are geographically limited, primarily from the United States and Europe This lag is reflected in ISO and EN codes as well. Currently, there are no common standards to account for nursery LCAs (Kuittinen et al., 2021). Other areas of potential investment in new investigations include understanding regional influences on carbon factors, energy source alternatives in material fabrication, carbon sequestration in horticultural land uses, and carbon assessments of the landscape chemical industry As a generalization, we found industries specified exclusively by landscape architects are behind the current trends in LCA and EPD development, in comparison to materials and products that are specified by architects and engineers.
The best way to enhance tools such as Carbon Conscience, Tally, or Pathfinder, is for academic research partners to work with design professional teams, to test projects and field verify or challenge results and predictions. Recent studies and advances, such as the CLF’s 2017 and 2023 Embodied Carbon Benchmark Studies, MIT’s deQo, and research at MIT’s Concrete Sustainability Hub show exciting advancements in this direction. Other key industry needs include developing common standards for benchmarking and tracking whole project life cycles, reporting for sustainability certifications, and mapping natural system carbon stocks. As a generation of academics, planners, and designers, we will need to work together on all of these issues, so we can all think more creatively and critically about how we address climate change in the built environment.
The Carbon Conscience team’s research has intentionally focused on embodied carbon, carbon stored, and carbon sequestered as those are variables that designers have the most control over during the design process, which should be partnered with energy modeling in detailed design phases to lead to WPLCA net-zero ambitions. A range of tools and e�orts exist in the design community for addressing operations and detailed design phases. For a summary of other available materials, please review Appendix A: Additional Carbon Calculators and Workflow Recommendations
Regarding operations specifically, a major roadblock for low carbon design we encountered is high carbon building codes and maintenance limitations. For example, for many parks and recreation departments within the United States, design standards appear to prioritize low-maintenance strategies first and foremost to control operational expenses. This often leads to standard hardscapes
being concrete for durability, and softscapes being mown lawns with trees. This leads to many parks and public spaces e�ectively being carbon-emitting land uses through emissions from mowers and other turf maintenance equipment, irrigation, and chemical inputs Because of the frequent, often weekly nature of turf maintenance, we suggest these standards are really medium maintenance, and low maintenance would be better defined as restoration style plantings that could require seasonal or annual maintenance by higher skilled employees. This is not a small consideration, given that there are over 40 million acres of turf in the United States, making turf the single largest irrigated crop (Steinberg, 2007). Concrete walkways are durable, but when the time comes for replacement, capital expenses are higher compared with stabilized aggregate pathways and they do not support resetting like unit paver systems. Many cities still ban the use of mass timber for structures over four stories high, even with the decades of demonstrations of proof-of-concept for durable mass timber high-rise developments in the Pacific Northwest, Finland, and Japan. There is work to be done to understand where regulations are getting in the way of low-carbon design, what the trade-o�s are, and where designers need to work as advocates within their regulatory communities to enable change. In the landscape architectural community, we believe that the general municipal awareness of carbon in building standards today is where stormwater and green infrastructure design was in the 1980s, and we anticipate a similar sea-change will need to happen for our profession and our municipalities to be able to deliver on current climate ambitions and commitments.
In the course of this research we have revealed that there are vast, often overlooked carbon costs in the built environment, and the more critical we are, the more inclusive of all the potential carbon costs of a project we are in our accounting, the more likely projects will appear to be net emitters based on contemporary construction standards We also recommend designers and regulators investigate carbon o�sets through either constructed restoration ecology projects (for example, a campus replanting former agriculture lands as forest to o�set a new lab building), or participating in the voluntary carbon market and purchasing o�set credits
The voluntary carbon market is a huge, complex, unregulated marketplace that is evolving day to day, and there is a concern in the carbon accounting industry that consideration of carbon o�sets can be taken as a carte-blanche for not improving carbon-emitting practices We take the position that carbon credits will have to be part of the picture to contribute to the global drawdown, at least until the energy regimes that underpin the construction industry undergo a renewable energy revolution. At the same time, we understand the discomfort with the current marketplace and suggest that one needs to be very selective about what voluntary carbon o�sets one invests in Many of the certified credits are reducing emissions, such as supporting biodigesters, burning o� methane emissions from oil rigs, or no-till agriculture, but do not contribute to the idea of drawdown that many clients think they are purchasing with carbon credits. Our team at Carbon Conscience describes these credits as investments in doing less harm, rather than drawdown
If a project team were to advocate for the use of carbon credits to achieve WPLCA net-zero or carbon positive goals, we suggest the team would want to invest in something that is directly removing carbon dioxide from the atmosphere This removal should be lasting, and be done in a way that is not exploitative of local peoples and does not support monoculture forestry practices. Informed by the research that has gone into Carbon Conscience, the most e�ective ecosystems for carbon
sequestration are wetlands, forests, and temperate prairie, and in all three, the more structurally complex and biodiverse systems sequester and store more carbon. These places need to be protected for a reasonable growth period, with the note that sustainable forest management for logging when mature is beneficial, as a large proportion of that carbon can be stored in structures, and higher sequestration rates can be achieved with mixed-age stands than mature static stands.
Carbon Conscience is focused on the site boundaries to develop the WPLCA Carbon o�set policies extend beyond the site or project. We believe there is an exciting future that challenges the current urban-rural carbon relationship. Right now, we generalize this system as an open loop: rural extraction to urban consumption, back to rural waste management. We believe this could be revised to a carbon cycle, where urban development drives investment in carbon-sequestering land uses in rural areas, which then provides the materials for sustainable construction. These regional-scale ambitions will require collaborative policy between municipalities and state governments, land banks, and NGOs with regional authority for land management and policy implementation.
Such policy structures may take years or decades to be established, and the timeline for global drawdown requires immediate and radical change. To that end, our team at Carbon Conscience has collected a few vetted carbon o�set websites and resources below for consideration. Perhaps the first steps will be case studies by designers partnering WPLCAs with carbon o�set investments, to test and show proof of concept to municipalities and regulators. Ultimately, a project team would need to match credits to their clients and communities' priorities and values, be they regional-centric, DEI, eco-justice, or institutional Through considerate assessments, innovation, and partnerships between designers, clients, and regulators, we hope we will see the normalization of carbon-neutral construction in this generation of the built environment. A few recommendations for investigating carbon credits are shared below:
Company Website
Verra
Climate Action Reserve
Saving Nature
City Forest Credits
Family Forest Carbon Program
Carbon O�set Company
Terrapass
Gold Standard
South Pole
https://verra org/programs/verified-carbon-st andard/
https://www.climateactionreserve.org/
https://savingnature com/
https://www cityforestcredits org/
https://familyforestcarbon org/
https://carbono�setcompany org/
https://terrapass com/business
https://www goldstandard org/
https://www.southpole.com/what-we-do
AppendixA�AdditionalCarbonCalculatorsandWorkflowRecommendations
The following are additional carbon calculators and workflow recommendations. In general, as a workflow, we suggest that Carbon Conscience is best used for planning and urban design stages for architecture and site projects, such as neighborhood design, districts, and city design. We suggest that the landscape dataset is su�ciently detailed to be useful through landscape architectural concept design. We suggest the default land uses in the landscape make the most sense for developing an initial baseline carbon footprint assessment, and typical structural systems in architectural land uses Users can then refine these defaults by exploring more wood-based systems in the architecture, and alternative material strategies in the landscape, in addition to refining the actual land-use composition. We suggest a reasonable baseline should reflect a project’s actual design intent first, and then for designers to strive for their emissions reduction goals as they iterate and refine the plan and assumptions.
The following recommendations are noted as of the writing of this paper in the spring 2023.
● For overall building concept and schematic design, we suggest using the EPIC tool by EHDD (https://epic.ehdd.com/) (EHDD, 2023).
● For a schematic review of structural systems, we advise the use of Beacon by Thornton Tomassetti (https://www.thorntontomasetti.com/capability/beacon) and deQo by MIT (https://www carbondeqo com/) (De Wolf, 2017; Embodied Carbon Lab, 2023)
● For a schematic review of facade systems, we suggest the Kaleidoscope tool by Payette (https://www.payette.com/kaleidoscope/) (Payette, 2023).
● For detailed architectural design in Revit, we advise the Tally Revit plugin provided by BuildingTransparency org (https://www buildingtransparency org/tally/tally-lca/), formerly through KieranTimberlake (KieranTimberlake, 2020).
● For landscape detailed design, we suggest using Pathfinder by Climate Positive Design (https://climatepositivedesign.com/pathfinder/) (Conrad, 2019).
For finding information on carbon factors of materials and products, in early design phases we suggest using the CLF baseline studies for architectural materials (https://carbonleadershipforum.org/clf-material-baselines-2023/) (Carlisle et al., 2021), and the baseline data and industry EPDs available on EC3 (https://buildingtransparency org/ec3/) (Building Transparency.org, 2023). For technical design phases, we advise trying to find specific product EPDs, starting with requesting EPDs from vendors you are specifying. The more designers ask for EPDs, the greater the pressure the vendor community will feel to participate in EPD and LCA studies. If specific product or material EPDs and LCAs are not available, we also suggest reviewing the US LCA database for more open-ended searches (https://www.nrel.gov/lci/).
For energy modeling in urban design stages, we suggest using the Cove Tool (https://cove.tools/) (cove tool, 2023), and for architecture during concept design, the EPIC tool mentioned above For landscape operations, we advise using Pathfinder, but partnered with the Cove tool for MEP and site lighting assessments, which requires some customization to create relevant data. We hope to see more tools and reporting standards developed in the coming years, as well as the incorporation of landscape data into architecturally-focused applications
AdditionalWeb-basedResources
● Architecture 2030, https://architecture2030.org/
● Athena Sustainable Materials Institute, http://www.athenasmi.org/
● Carbon Leadership Forum, https://carbonleadershipforum.org/
● Carbon Smart Materials Palette, https://materialspalette org/
● Climate Positive Design - Resource Recommendations, https://climatepositivedesign.com/resources/
● Concrete LCA tool (for concrete mixes) from ZGF, https://www zgf com/news post/lca-calculator-reduces-concretes-embodied-carbon/
● DesignBuilder (performance analysis tools), https://designbuilder.co.uk/
● EA Tool (for structural systems) from SOM:
https://www.som.com/news/new tool measures emissions from buildings
● EPD International, https://www environdec com/
● EPiC(LCA) Database, University of Melbourne.
https://msd.unimelb.edu.au/research/projects/current/environmental-performance-in-construc tion/epic-database
● IES VE (whole building energy simulation), https://www.iesve.com/software/building-energy-modeling
● i-Tree (for detailed arboriculture tools), https://www.itreetools.org/
● One Click LCA, https://www.oneclicklca.com/
● Society for Ecological Restoration Resource Center, https://www ser-rrc org/
● U.S. Life Cycle Inventory Database, https://www.nrel.gov/lci/
● OpenLCA Nexus, https://nexus.openlca.org/
● Greenhouse Gas Protocol, https://ghgprotocol.org/about-us
KeyBooksandArticles
The following are a few key books we think are extremely helpful for professionals and students orienting themselves to understanding the carbon impacts of the built environment, some of which were critical for the development of Carbon Conscience.
Berge, B. (2009). The Ecology of Building Materials (2nd ed.). Routledge.
Kuittinen, M., Organschi, A., & Ru�, A. (2022). Carbon: A Field Manual for Building Designers. Wiley.
LETI. (2022). Embodied Carbon Primer. LOW ENERGY TRANSFORMATION INITIATIVE C.I.C. https://www.leti.uk/ecp
Simonen, K. (2014). Life Cycle Assessment. Routledge.
Lal, R , Lorenz, K , Hüttl, R , Schneider, B , & von Braun, J (2013) Ecosystem Services and Carbon Sequestration in the Biosphere Springer