30% 45%
Better
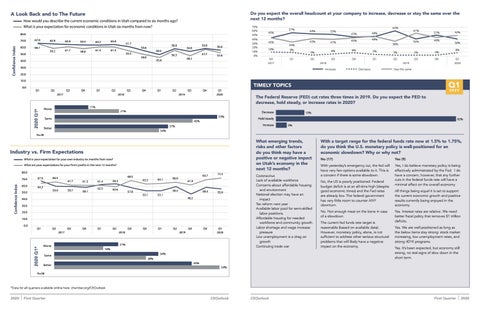
A Look Back and to The Future
DoN=38 you expect the overall headcount at your company to increase, decrease or stay the same over the next 12 months?
How would you describe the current economic conditions in Utah compared to six months ago? How would you describe the current economic conditions in Utah compared to six months ago? What is your expectation for economic conditions in Utah six months from now? What is your expectation for economic conditions in Utah six months from now? 80.0
70.0
Confidence Index
60.0 50.0 40.0 30.0 20.0
67.0
70.0
Confidence Index
80.0
60.0
66.1
65.0
66.1 61.7
50.059.2
Better
58.8
65.0 61.7
64.2 61.4
64.4
65.0
58.8 61.4
64.2
65.0
55.6 58.8
61.4 55.6
61.4 55.5
55.5 50.0
50.0
50.0 56.3
45.6
58.8 50.0 54.8
59.0
56.3 57.7 45.6 48.2
54.8 56.6 48.2 52.6
59.0 57.7
56.6 52.6
0.0 Q1
Q2
Q1
Q3
Worse
Q2
Q4 2017
Q3
Q4
Q1
Q2
Q1
Q3
Q2
2018
Q4 2018
Q3
Q1
Q4
Q2
Q1
Q3
Q2
2019
Q4 2019
Q3
Q1 2020
Q4
Q1 2020
11%
11%
21%
21% Same Better
37% 34%
45% 37%
53% 45%
N=38
Q4 2017
42%
9% Q1
8%
53%
43% 3%
Increase
Q2
62% 47%
48%
41%
45%
48%
6%
8%
5%
3%
Q4
Q1
Q2
Q3 Decrease
36%
2018
Stay the same Increase
41%
46%
2%
3%
Q3
Q4
2019 Decrease
Worse
21% 16%
Same
21%
30%
Better
50% 8% Q1 2020
Stay the same
Q1 2020
The Federal Reserve (FED) cut rates three times in 2019. Do you expect the FED to decrease, hold steady, or increase rates in 2020? 13%
Hold steady
82% 5%
42% 72.3 50% 8% 55.9 Q1 2020
Q1 2020
What emerging trends, risks and other factors do you think may have a positive or negative impact on Utah’s economy in the next 12 months? Coronavirus Lack of available workforce Concerns about affordable housing and environment National election may have an impact Tax reform next year Available labor pool for semi-skilled labor positions. Affordable housing for needed workforce and community growth. Labor shortage and wage increase pressure Low unemployment is a drag on growth Continuing trade war
34% 30% 45%
With a target range for the federal funds rate now at 1.5% to 1.75%, do you think the U.S. monetary policy is well-positioned for an economic slowdown? Why or why not? No (17)
Yes (9)
With yesterday’s emergency cut, the fed will have very few options available to it. This is a concern if there is some slowdown.
Yes, I do believe monetary policy is being effectively administrated by the Fed. I do have a concern, however, that any further cuts in the federal funds rate will have a minimal effect on the overall economy.
No, the US is poorly positioned: Federal budget deficit is at an all-time high (despite good economic times) and the Fed rates are already low. The federal government has very little room to counter ANY downturn. No. Not enough meat on the bone in case of a slowdown The current fed funds rate target is reasonable (based on available data). However, monetary policy, alone, is not sufficient to address other serious structural problems that will likely have a negative impact on the economy.
All things being equal it is set to support the current economic growth and positive results currently being enjoyed in the economy. Yes. Interest rates are relative. We need better fiscal policy that removes $1 trillion deficits. Yes. We are well-positioned as long as the below items stay strong: stock market increasing, low unemployment rates, and strong 401K programs. Yes. It’s been expected, but economy still strong, no real signs of slow down in the short term.
45% 54%
N=38
42%
34%
16% 34%
51%
56%
TIMELY TOPICS
Increase
Confidence Index
Better
2020 Q1*
Confidence Index
Same
10%
34%
Decrease 53%
What is your expectation for your own industry six months from now? What is your expectation for your own industry six months from now? What are your expectations for your firm's profits in the next 12 months? 62% What are 70% your expectations for your firm's 57%profits in the next 12 months? 62% 41% 60% 54% 53% 51% 80.057% 45% 41% 54% 53% 48% 47% 42% 69.7 51% 48% 80.0 45% 50% 47% 68.5 72.3 66.4 67.9 66.0 69.7 40% 70.0 48% 63.3 64.1 68.5 45% 66.4 61.9 46% 67.9 61.743% 59.3 66.0 48% 61.3 45% 56% 41%61.4 70.0 46% 45% 64.1 63.3 30% 43% 56% 61.9 61.7 34% 61.3 41% 61.4 59.3 36% 45% 50% 36% 64.3 20% 60.034% 62.5 60.0 10% 63.6 9% 64.3 8% 59.9 59.7 62.5 58.1 59.4 6% 10% 10% 50.0 9% 57.8 5% 8%3% 58.3 8% 63.6 3% 3% 2% 59.9 59.7 3% 58.3 58.1 6% 3% 3% 2% 53.1 57.85% 53.1 59.4 55.9 50.0 0% 53.1 48.2 Q4 40.0 Q4 Q1 Q2 Q3 Q1 Q2 Q3 Q4 53.1 48.2 Q1 Q2 Q3 Q1 Q2 Q3 Q4 Q4 Q1 Q4 40.0 2017 2018 2019 2017 2018 2019 2020 30.0 30.0 Increase Decrease Stay the same Increase Decrease Stay the same 20.0 20.0 10.0 10.0 0.0 Q1 Q2 Q3 Q4 Q1 Q2 Q3 Q4 Q1 Q2 Q3 Q4 0.0 Q1 Q2 Q3 Q4 Q1 Q2 Q3 Q4 Q1 Q2 Q3 Q4 Q1 2017 2018 2019 2017 2018 2019 2020
Worse
45%
54%
50%
Industry vs. Firm Expectations 70% 60% 50% 40% 30% 20% 10% 0%
57%
45%
20.0
N=38
N=38
61.7
61.7
70% 60% 50% 40% 30% 20% 10% 0%
10.0
2020 Q1*
Same
59.2
64.4
30.0
2017
Worse
65.9
40.0
10.0 0.0
65.9
67.0
54%
54%
*Data for all quarters available online here: chamber.org/CEOutlook
2020
I First Quarter
CEOutlook
42%
CEOutlook
First Quarter
I 2020