6 minute read
AGENT TO TOPOGRAPHY RATIO

from AEOLIAN - AADRL
by Salim Hilles

Advertisement


PROPORTIONALITY BETWEEN POPULATION AND THE SITE
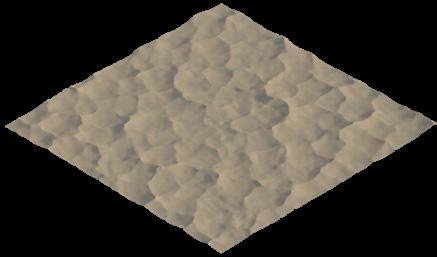
The density of the morphology is determined by the number of agents in the population. A larger population results in a denser structure, which can be more effective in a shorter amount of time. An important part of the research was to determine the optimal number of agents to use in order to create the most effective structure with the least number of agents. To do this, the team conducted simulations with two main variables: the number of agents and the size of the terrain.


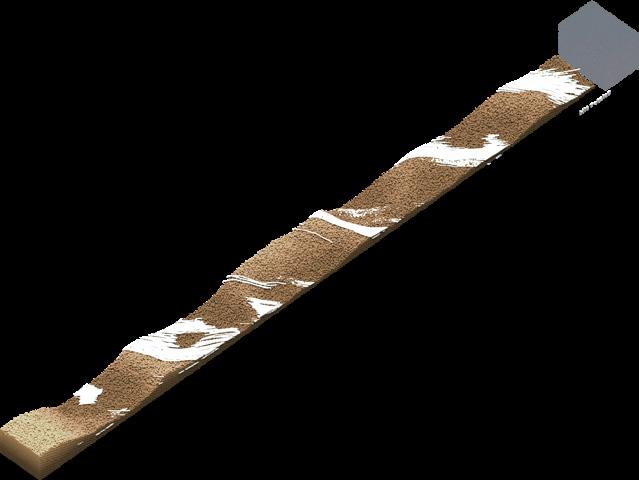
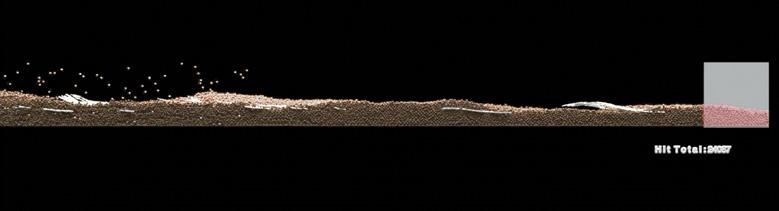
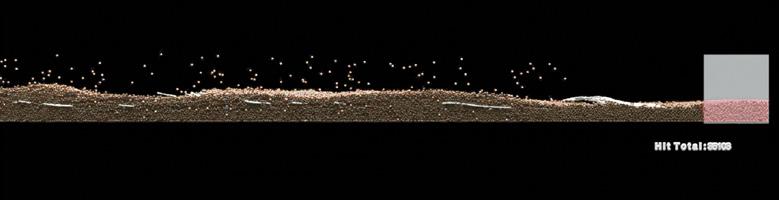
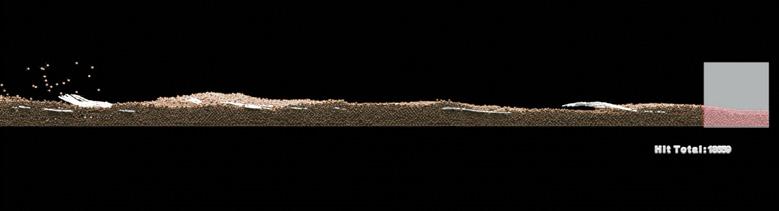
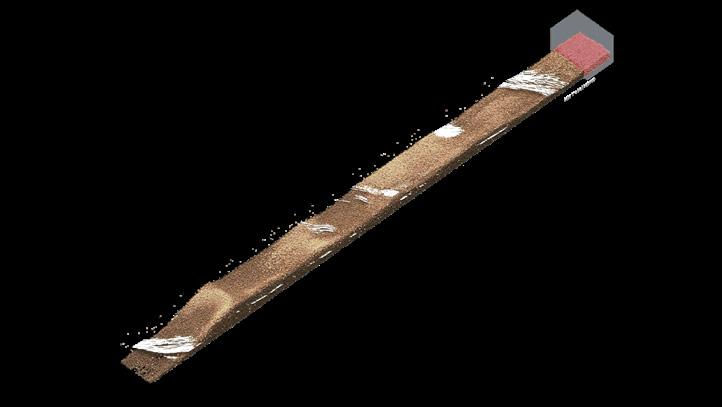
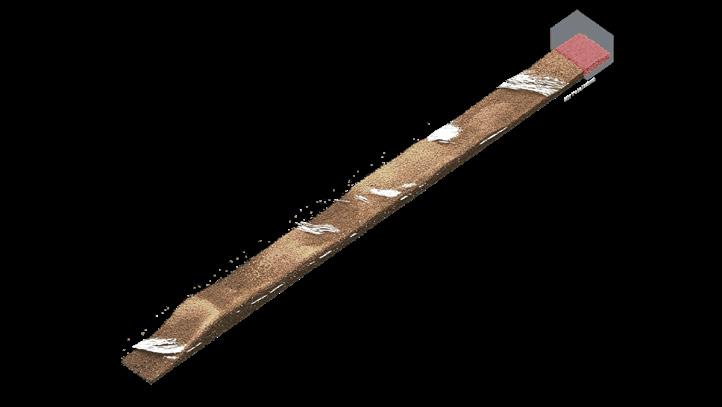
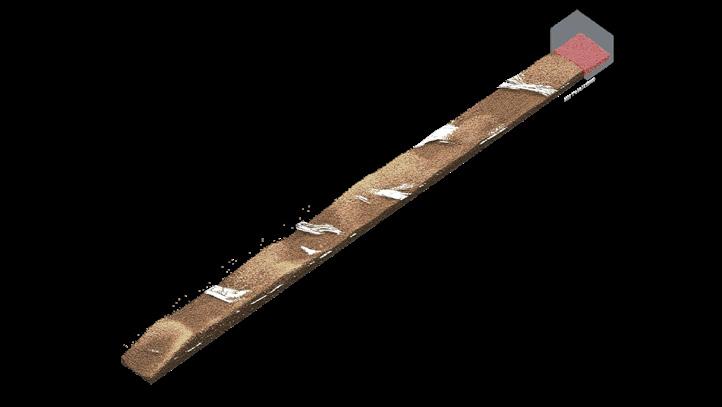
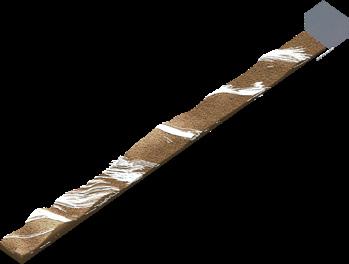
Length And Layers Performativity Tests
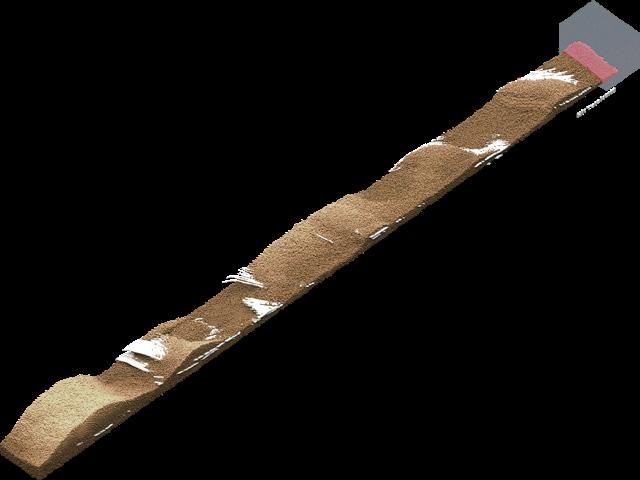
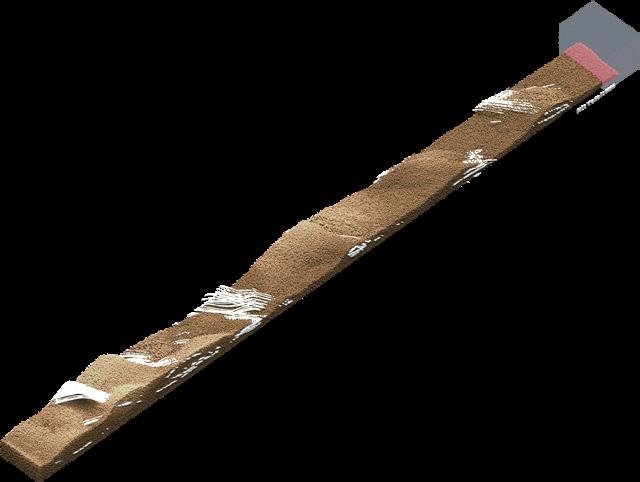
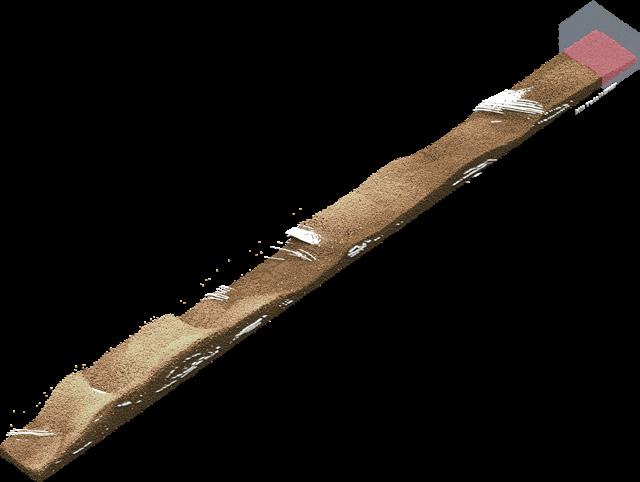
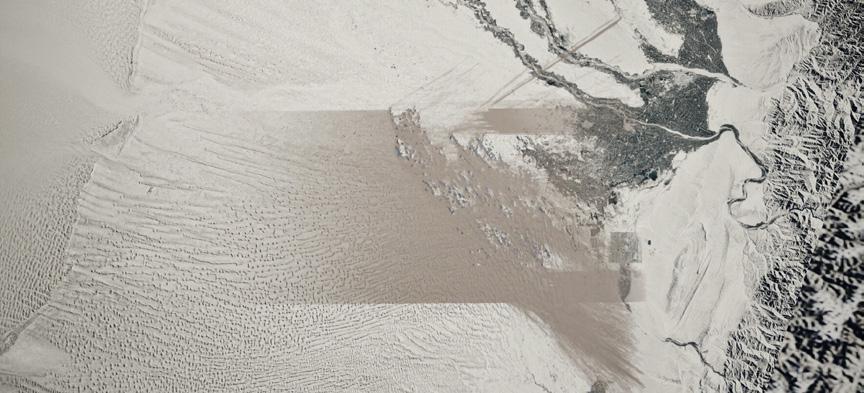
The performance of the structure is influenced by two main factors: its length and the number of layers it has. In order to assess the structure’s ability to redirect sand particles away from a specific site (in this case, a circular object representing a city), the team conducted simulations in which sand was blown over three different morphologies with varying sizes: 300 meters, 600 meters, and 1,000 meters. During the first set of simulations, the 1,000-meter structure was most effective at redirecting sand, with only 0.08% of particles able to pass through it. For the second round of simulations, an additional layer was added to the smaller structures, which were partially or completely buried at this point. As a result, both sizes performed much better than they had initially. The process was repeated for a third time, with the 300-meter structure performing as well as the 1,000-meter structure in the final simulation.

Proof Of Concept
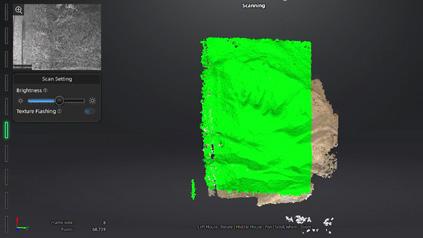
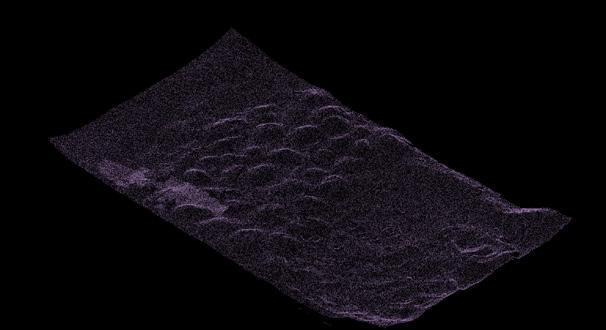
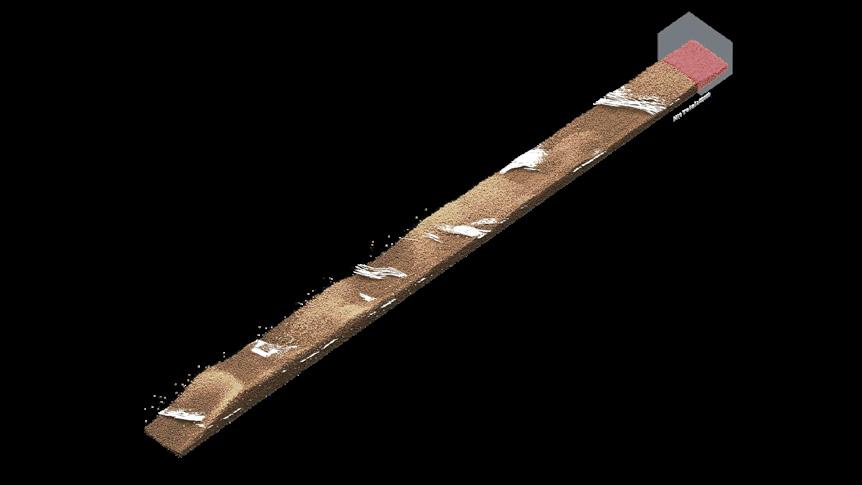
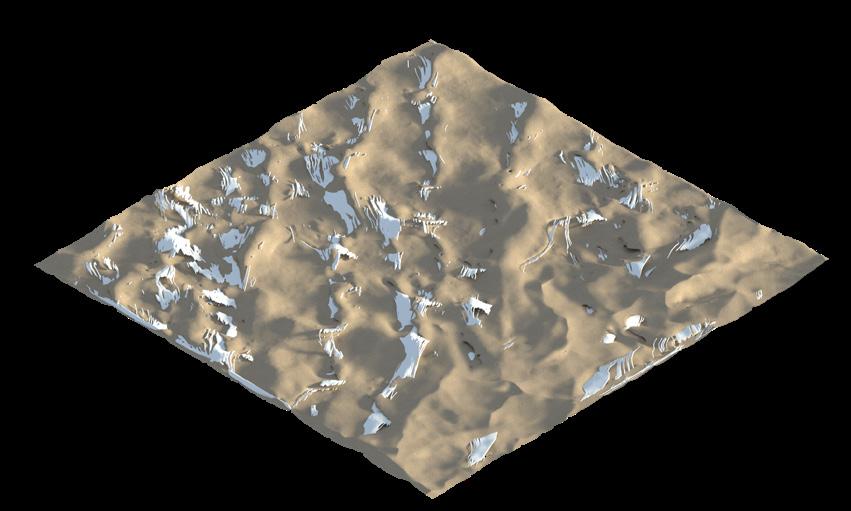
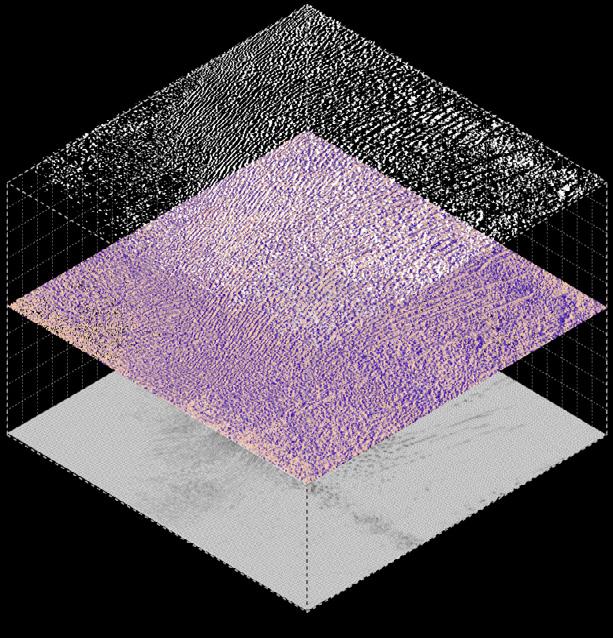
BRIDGING THE DIGITAL AND PHYSICAL ENVIRONMENTS he project team aimed to integrate simulation into their research by creating a bridge between the digital and physical environments. To achieve this, they employed 3D scanners to capture the geometries of real-world dune typologies, which were created through manual manipulation of sand aggregations. This generated realworld data that could then be incorporated into a digital framework for simulation purposes allowing for further analysis and parametrization of the terrain, simulation the agent based system using a host of agents to self-organize in the real-world hand-crafted landscape. Creating a point map enables the creation of a 3D mesh model that closely resembles real-world terrain. Additionally, the dune’s texture can also be remapped, allowing for a more realistic digital environment by bridging the gap between the digital and physical worlds. Moving forward, the generated dune typology will be used to simulate and generate the sand-to-glass morphology.


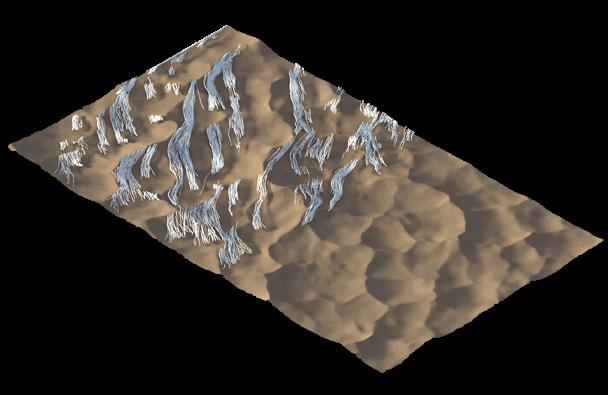
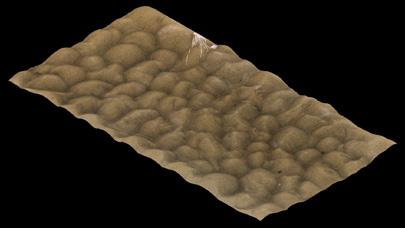
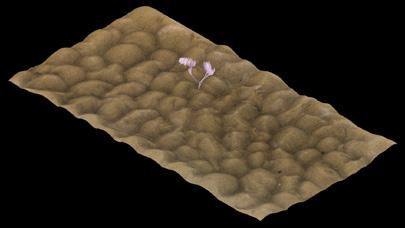
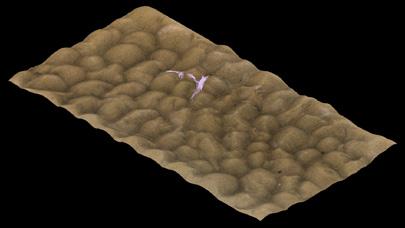
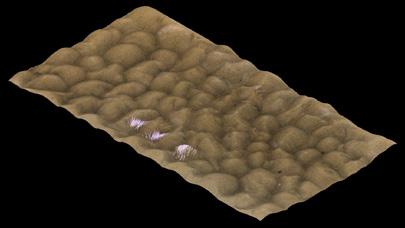
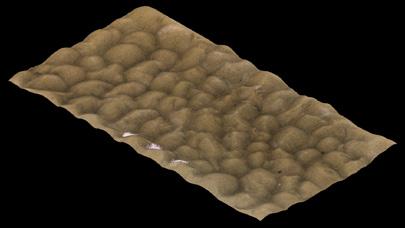
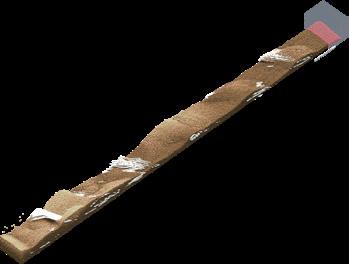
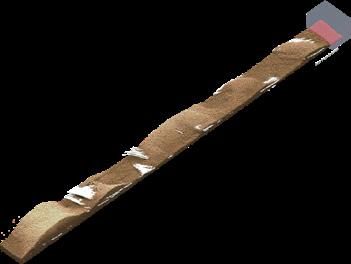
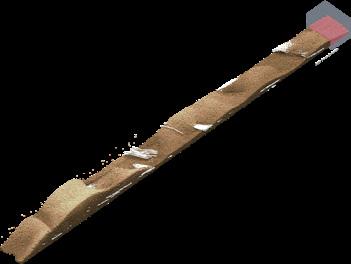
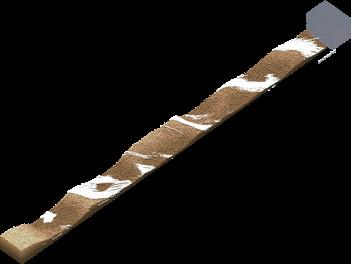
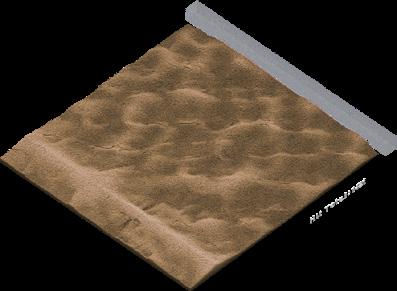
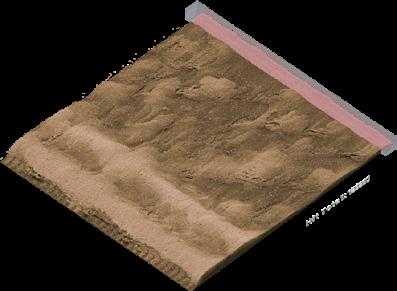
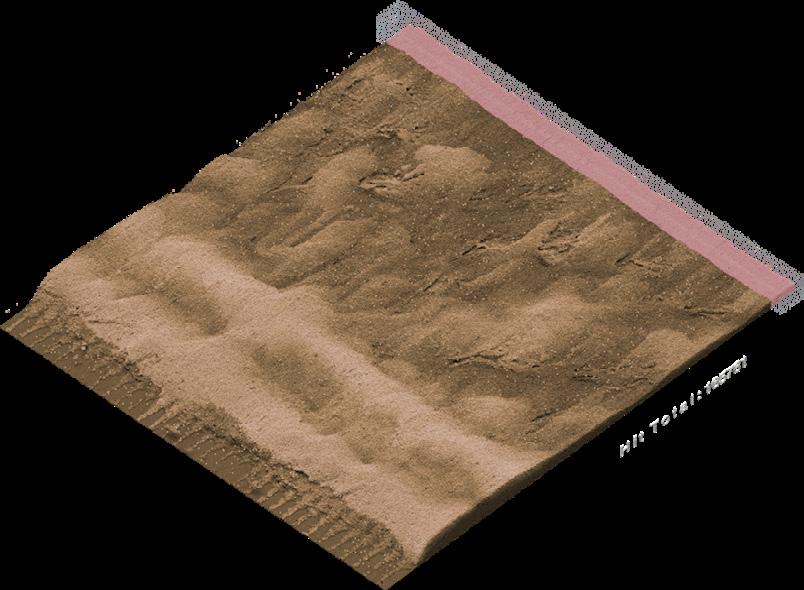
Hand-Crafted Dune Typology
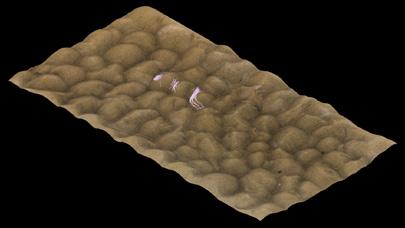
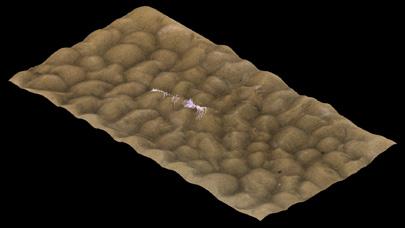
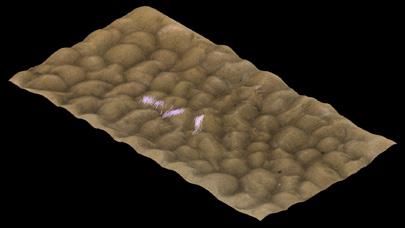
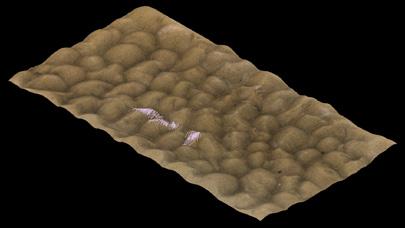
Scan Time Step 00:00:00
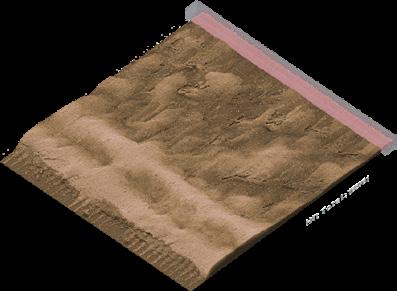
Scan Time Step 00:00:15
Scan Time Step 00:00:030
Scan Time Step 00:00:60
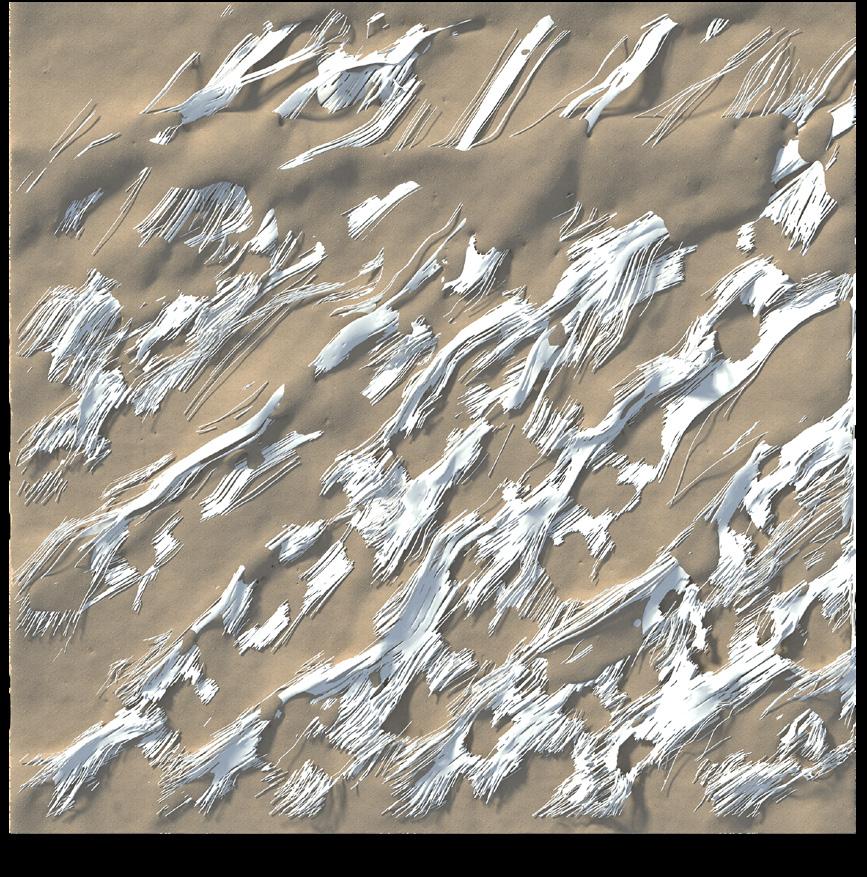
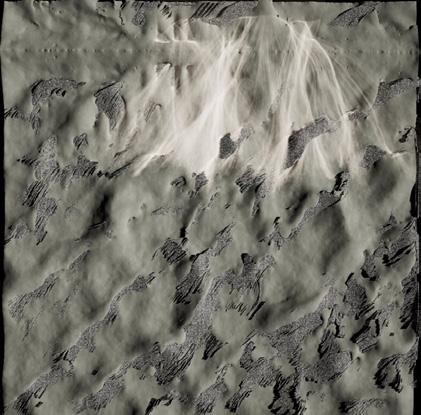
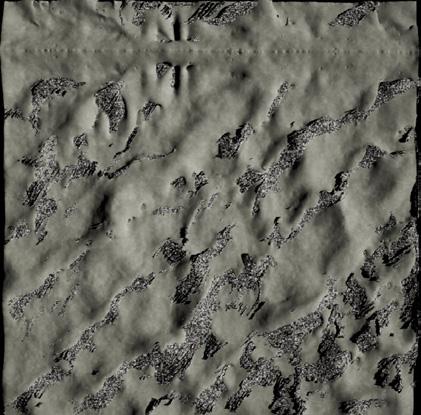
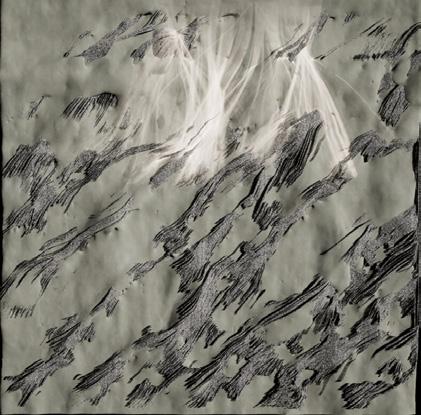
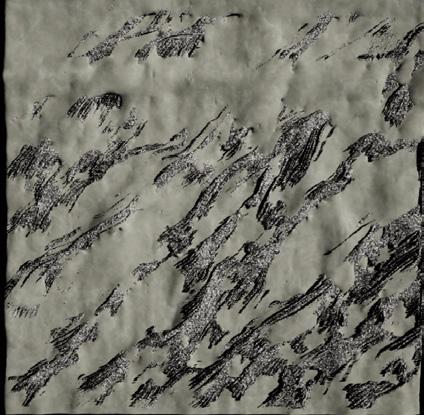
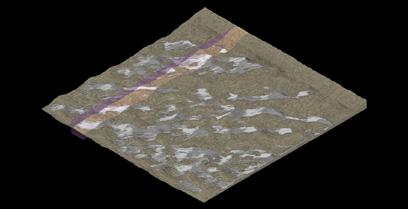
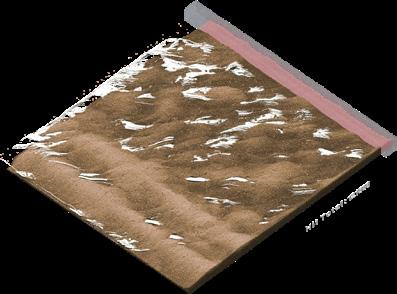
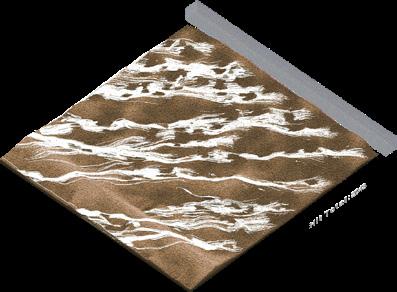
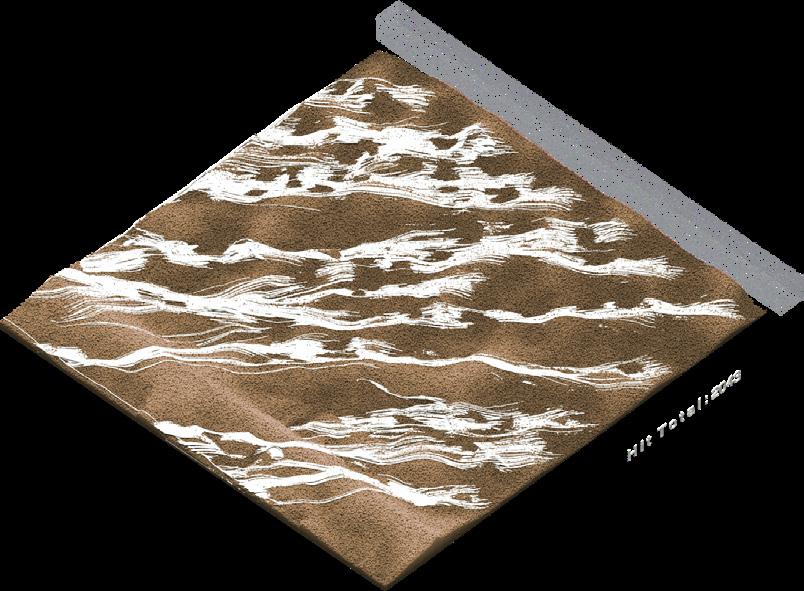
Once the structure is generated, a sand blowing experiment is conducted to test the performance terraformation of the landscape. Three different containers were attached to the back of the sand box to test the directionality of the sand particle flow.
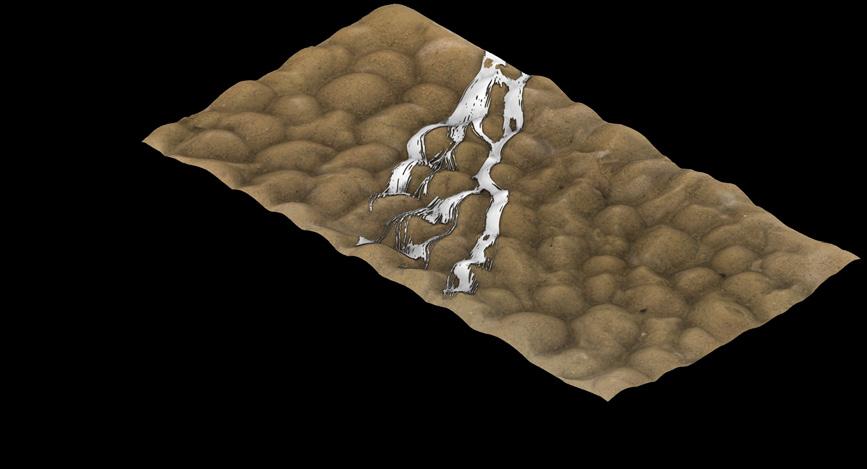

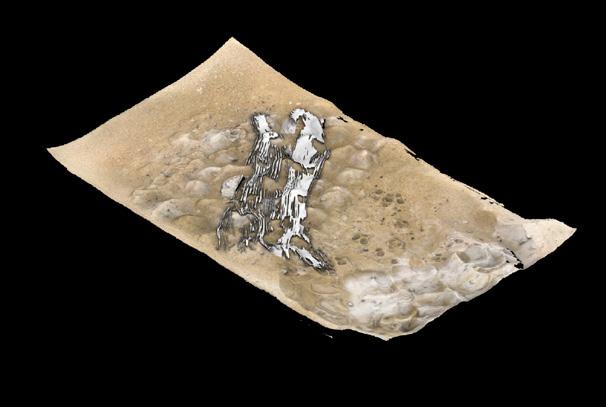
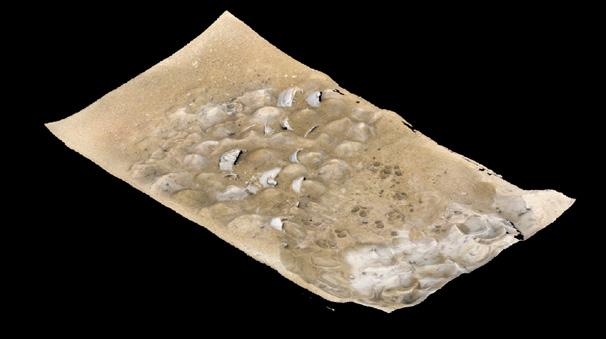
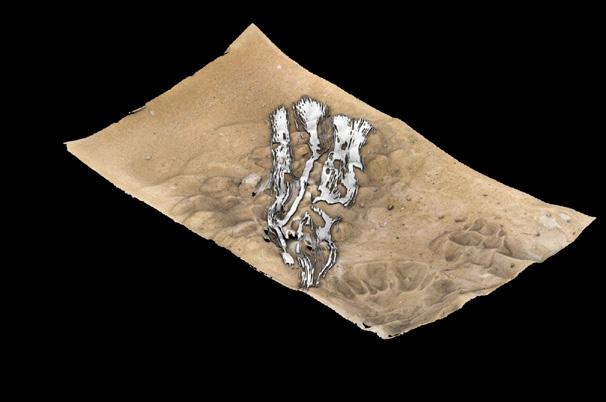


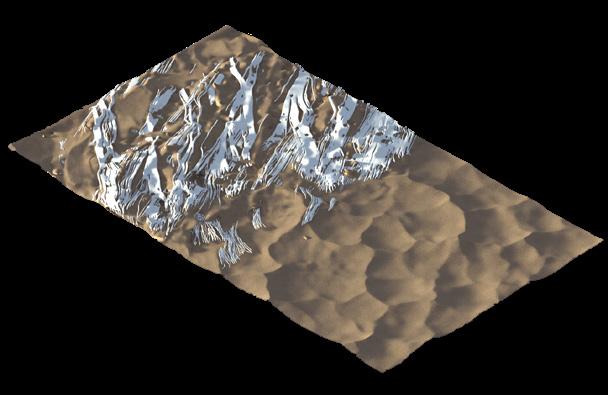
Layering Final Result
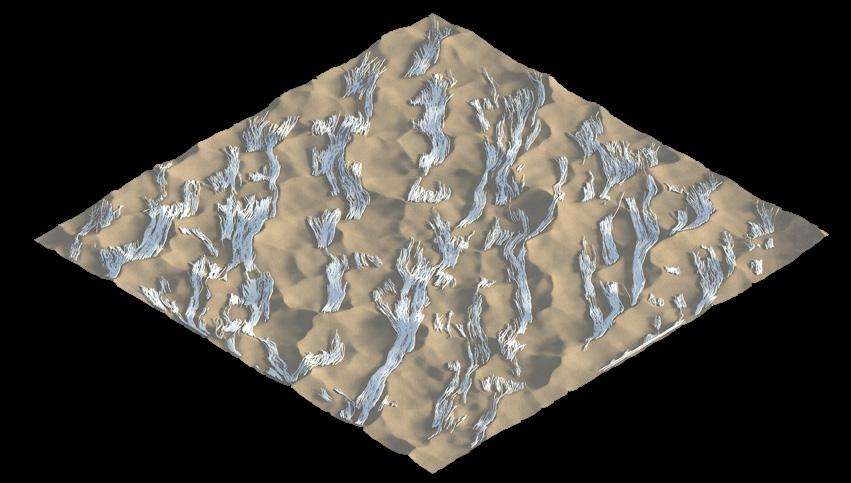
After three iterations of sand blowing, the generated morphology was able to redirect sand particles away from the area it surrounds. In addition, layering the structure after three iterations showed remarkable results in the experiments performance. Hence, proving the strategies deployed in the simulative environment successfully work when experimented in the real-world environment.
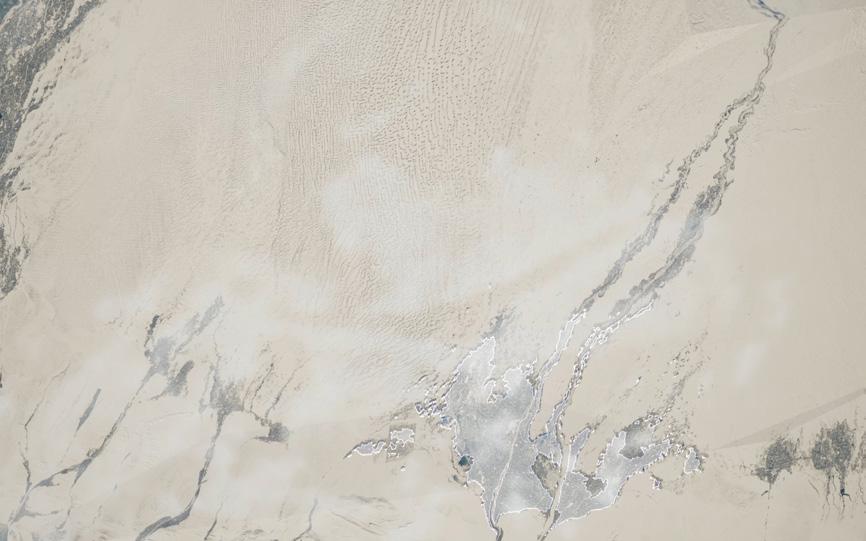
Site
TAKLA MAKAN DESERT
In order to evaluate the effectiveness of the strategy and comprehend its behaviour on a large scale, a specific location was selected for implementation. The chosen site was the Takla Makan Desert in Asia, which encompasses 337,000 square kilometres and is characterized by sandy terrain. The desert is situated in close proximity to the large city of Hotan with population 409,894. The major wind blows toward the city expanding the desert and covering it with sand.
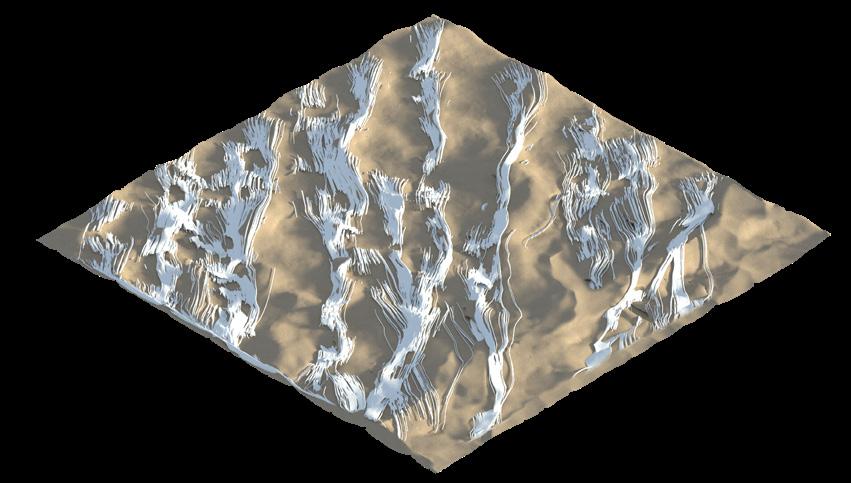
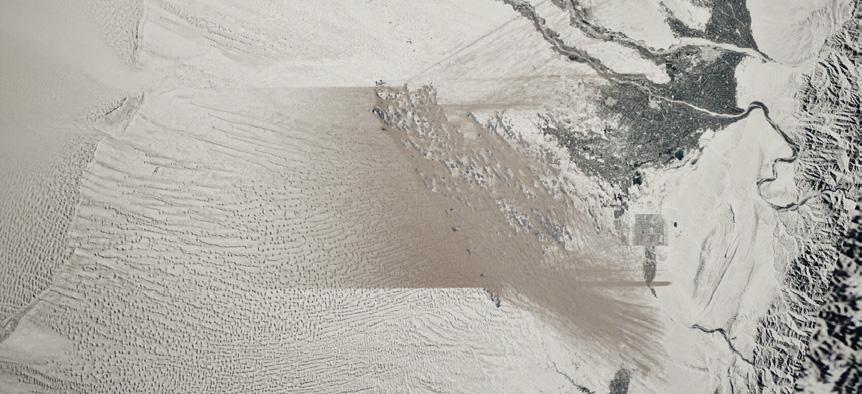
1KM2 - DEPLOYMENT TERRAFORMATION ON A 1KM2 LENSE
The focus was on the simulation environment on a 1km2 area of the 80km site, creating a machine ecology in which the agents used data from the landscape to strategize and self-organize. The simulations were repeated multiple times until the generated morphology was able to effectively redirect sand particles. Through this process, the agents were able to strategically fuse parts of the terrain and terraform the environment.
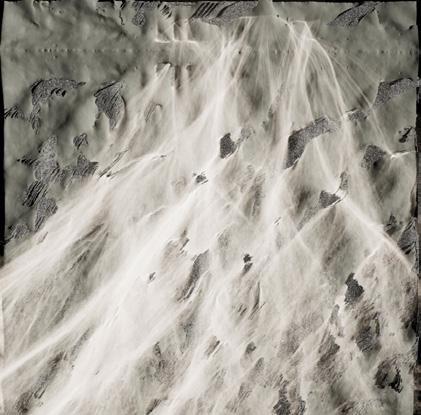
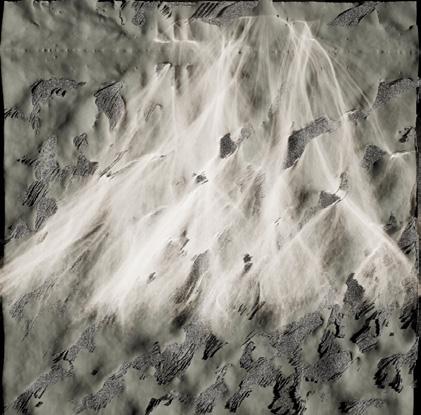
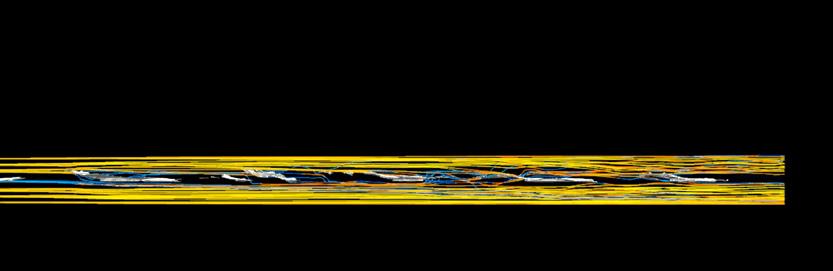
With each iteration, a simulation is run to visualize the flow of sand particles across a simulated landscape, highlighting the interaction of the sand with glass infrastructure. In the initial simulation, with no layers present, the sand particles move freely and are not redirected. As more layers are added to the structure, the sand particles are increasingly deflected to the left. The more layers that are incorporated into the structure, the more efficient it becomes at redirecting the flow of sand.


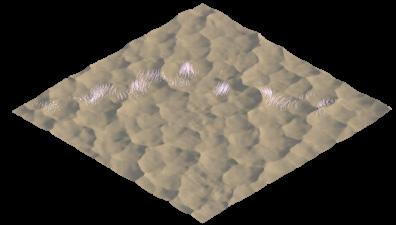

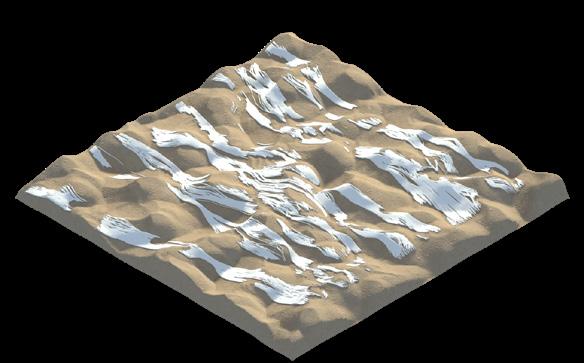
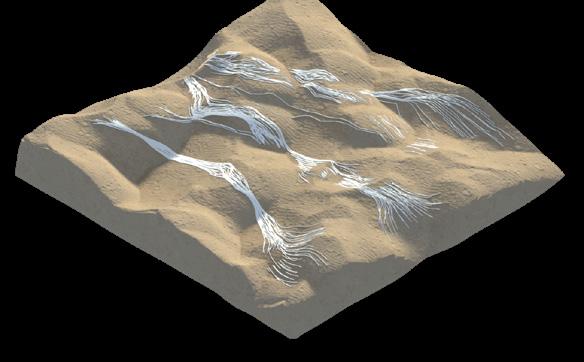
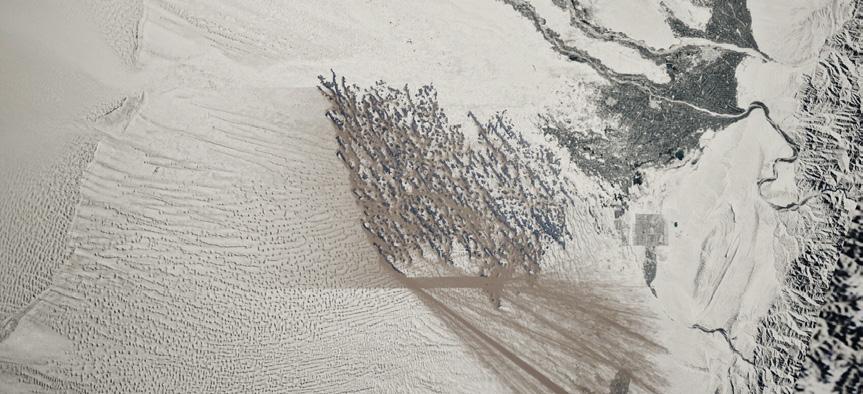
1st Layer Terraforming Dunescapes


1st Layer Terraforming Dunescapes

1ST LAYER - SAND ACCUMULATION ITERATIONS + SITE SELECTION
After sand is being fused onto the existing landscape by agents; the structures behave as barriers to prevent the sand from penetrating through and also capture sand grains. This procedure deepens the dune surface for agents to fuse additional structural layers.


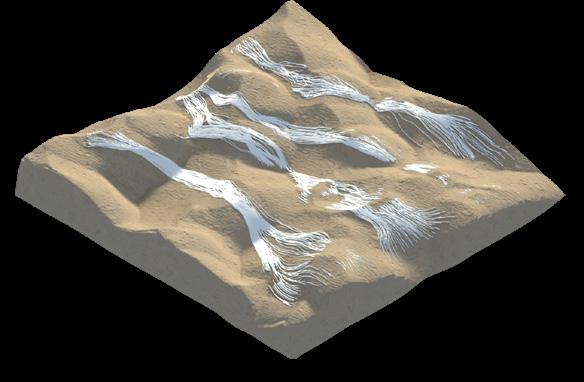
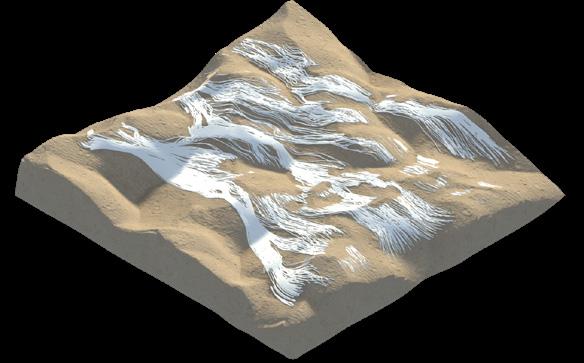
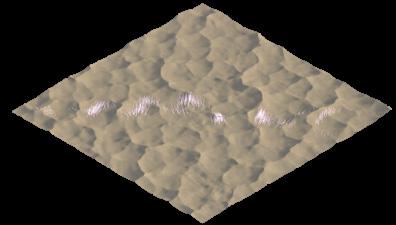
Accumulation of sand particles also higher increases quantity of sand gathered by the structure. The impact between structure and sand flow causes the number of sand particles to rise and expand for a deeper landscape in the second to fourth iterations. Around the area, they are generating increasingly complex movements.
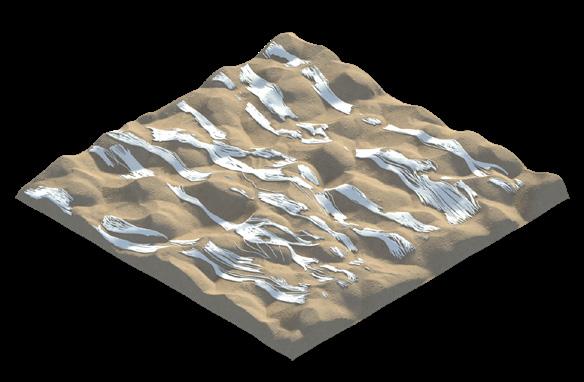
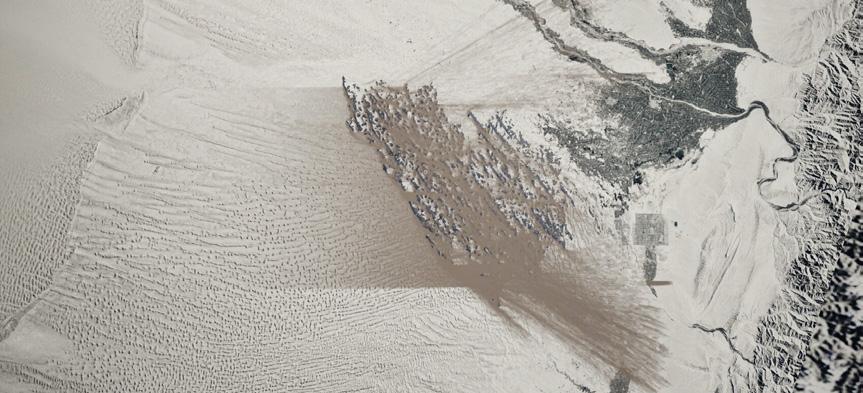
2nd Layer Terraforming Dunescapes


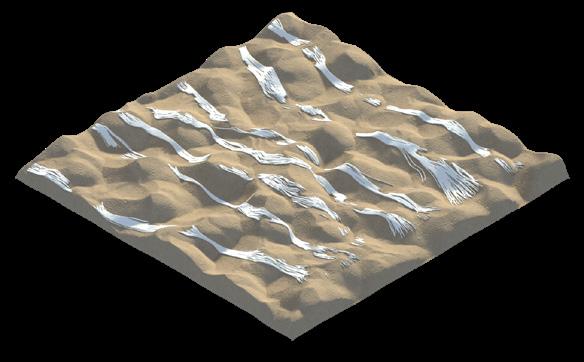
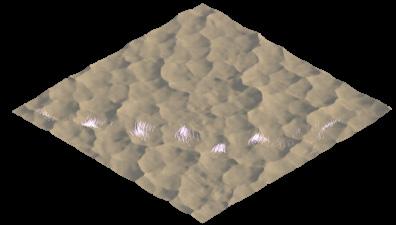
3rd Layer Terraforming Dunescapes


Performance
SHIFTING PARTICLE FLOW
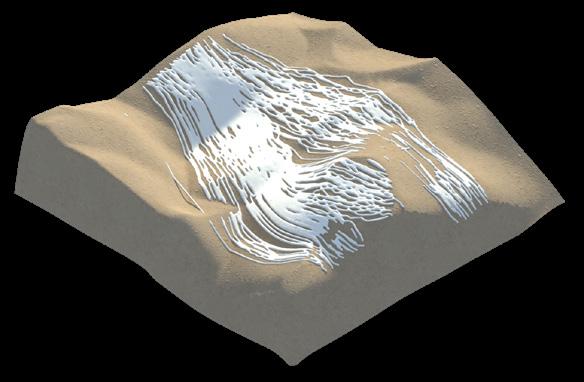
As shown in the comparison, the number of layers of the structure has a significant impact on the effectiveness of redirecting particles on a dune landscape. As the number of layers increases, there is a robust improvement in the performance of redirecting particles.

4th Layer Terraforming Dunescapes
Particle System

AGENT HERD BEHAVIOUR
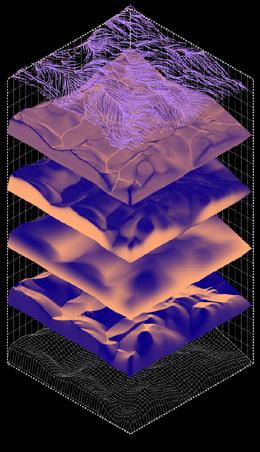
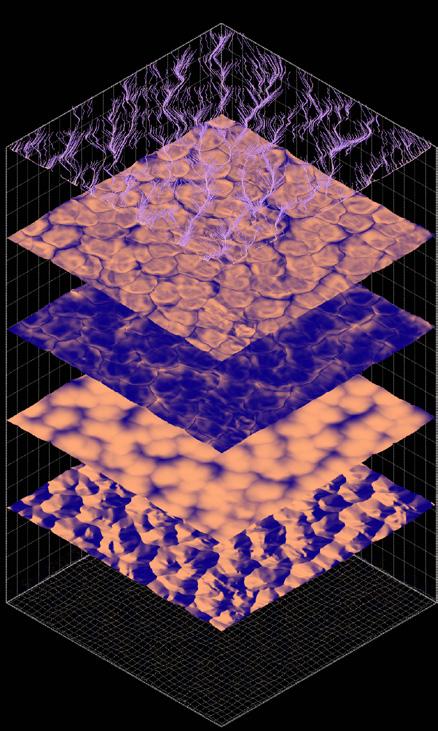
Density = Height + Curvature

To control how dense the agents couple with one another to form groups and clusters, the data received by layering the height map and the curvature map is utilized, creating a new map that builds a relationship between the agent’s vertical position and the curvature of the area they are traveling on.
Particle System


Particle System
AGENT HERD BEHAVIOUR
Structure Influence Changing Of Dunes Scenario


The following simulations evaluate the environment in two distinct states. The first being the dune landscape in its natural form, and the second, the terrain that has been altered by the generated morphology, which only exists within the context of a machine ecology


Global Scale Slopes Analysis
One group of agents operates within a 1 square kilometre area. However, for the global scale, a height map of the landscape was utilized to perform a slope orientation analysis, with a focus on identifying back side slopes facing towards the wind. In this global scale approach, the structure would be segmented based on the landscape characteristics. As demonstrated in the example, with the use of 10000 agents, an area of 1500 km2 can be covered in a period of 16 years. This approach has resulted in the gradual redirecting of sand particles away from the city.

YEARS ELAPSED -
YEARS ELAPSED -
YEARS ELAPSED -
YEARS ELAPSED -
YEARS ELAPSED -
YEARS ELAPSED -

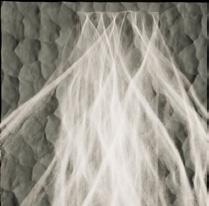
Drawing
The implemented sensing functions aid in determining the specific location where the structure (represented by a line) should be drawn. The agents make decisions regarding the length and location of the line based on the colour map, which is a visual representation of the previously conducted terrain analysis. The agents can also identify areas where the implementation of the structure is not required, as indicated by the colour map, and will not draw the line in those areas, in accordance with the strategy.
FOLLOWING
The agents are equipped with sensing functions that include two distinct behaviours. The first behaviour line sensing or following, enables the agents to recognize and move along lines left by other agents. The second behaviour colour analysis, enables the agents to interpret data from the environment and determine the area to be investigated.
The agents collaborate by following the lines left by the leading agents, which are marked by a black line. This enables the following agents to recognize and follow the route. In addition to the lines, the agents also communicate with ultrasonic sensors to avoid collisions with one another.
COLOUR
Mobility
Research on the natural systems’ coping mechanisms for the harsh environment, as well as the mobility of the local species, were conducted in order to incorporate mobility into the agent behaviours.
The mobility of the agents in the experiment was designed to evaluate various forms of movement on a dynamic particle system, such as sand. This was achieved by simulating the movement of wheels on sand using different geometric designs. The area of the site plays a crucial role in determining the friction with the ground and thus the feasibility of movement on the sand.


