Welcome to the 2024 Annual Rail Shipping Trends Report, a comprehensive document dedicated to uncovering, analyzing, and presenting the most pivotal trends, developments, and shifts within the railroad and freight transport sectors over the past couple of years.
As the backbone of supply chains across North America, rail transport's cost efficiency significantly impacts economies, businesses, and communities. This report aims to serve as an essential tool for stakeholders across the spectrum—from policymakers and industry leaders to logistics managers and academic researchers providing valuable insights and data-driven analysis to inform decision-making, strategy development, and future forecasting.
Whether you are seeking to streamline your logistics, reduce environmental impact, or simply gain a competitive edge in the market, this report is designed to serve as a cornerstone for innovation and improvement. It is our belief that through better understanding and strategic action, we can collectively overcome existing barriers and unlock new avenues for growth and efficiency within the rail shipping industry.
The insights below are just a glimpse into the comprehensive analysis and wealth of information within the full Rail Info product. Don't miss out on the full spectrum of rail shipping insights. Subscribe to Rail Info today and transform the way you make decisions in the rail industry.
Purpose of Annual Rail Shipping Trends Report 2024
The primary purpose of this report is to:
● Chart the Evolution: Document and analyze year-over-year trends in rail shipping, focusing on key performance indicators for major aspects of the industry.
● Identify Challenges and Opportunities: Uncover the underlying causes of persistent challenges within rail freight, from infrastructure constraints to regulatory impacts, and highlight emerging opportunities amidst evolving industry dynamics.
● Advance Industry Dialogue: Foster a richer dialogue among industry stakeholders by sharing findings, best practices, and forward-looking perspectives, facilitating collaborative efforts to address common challenges and harness innovation
● Enhance Visibility and Transparency: Increase transparency around rail shipping operations, fostering a deeper understanding of the role rail transport plays in broader logistics and supply chain ecosystems
Measure 1 – Tank Cars Online
Graph 1
Graph Measures
Overview:
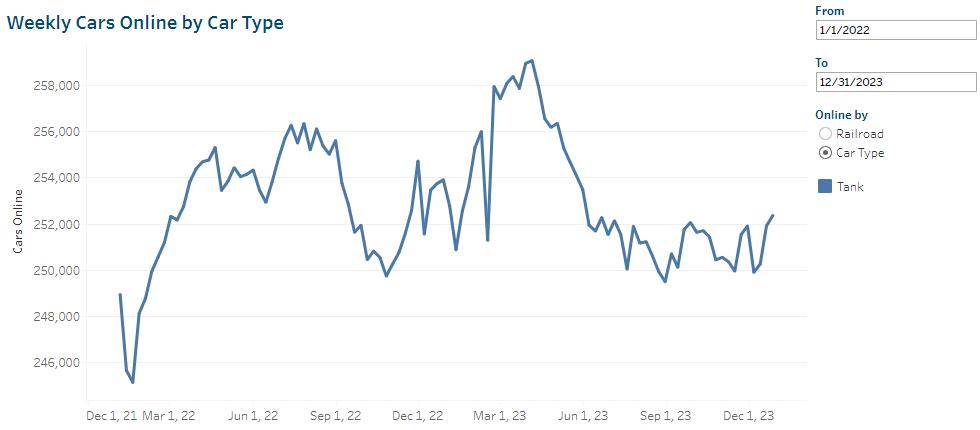
● The provided data shows the number of active freight rail tank cars online for various Class 1 railroads from January 2022 through the end of 2023
Railroads Included:
● BNSF
● Canadian National (CN)
● Canadian Pacific (CP)
● CSX
● Kansas City Southern (KCS)
● Norfolk Southern (NS)
● Union Pacific (UP)
Time Period of Records:
● The data spans from January 2022 to December 2023
● There is a weekly reporting of figures on Wednesdays
Content 1
Q1 2022 Increase
Tank cars are designed to carry almost any type of liquid products and materials, regulated or non-regulated. A variety of tank cars are produced for the rail shipping industry, and those generally fall under two designations: General Purpose, and Pressure tank cars. Because of the importance of tank cars in the transportation of chemicals, petroleum, food, flammable liquids and gasses, and other vital commodities, a comprehensive look at the tank cars online can
provide insights into the health of several industries, as well as the past performance of tank car manufacturers and lessors.
The observed rise and fall in tank cars online across most railroads throughout the course of 2022 and 2023 was indicative of several factors affecting the rail freight industry. This included macroeconomic downturns, supply chain disruptions, and shifts in the energy market impacting the demand for rail freight services.
Incidents such as the East Palestine derailment of a train of tank cars in February of 2023 likely meant that additional tank cars needed to be brought online to overcome those taken offline for safety, and to overcome the loss of products in the derailment. Similarly, the UP mandated shipping reductions of fertilizer, hydrogen, and nitrogen products during April of 2022 could have affected the amount of tank cars online by requiring additional railcars to be utilized to circumnavigate the UP’s decision. In both instances, though these were not the only effects, they likely had an impact during two seasons of increased tank car usage.
Measure 2 – Weekly Carloads by Railroad – Chemical
Graph 2
Graph Measures
Overview:
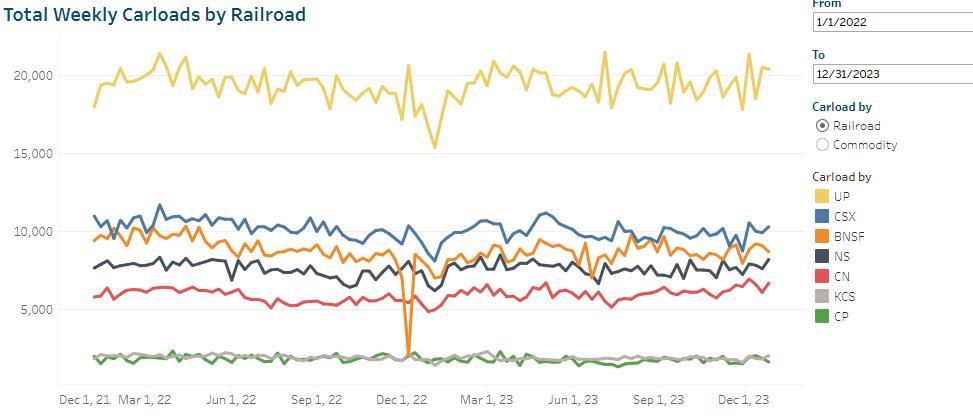
● The provided data shows the number of total chemical shipments on various Class 1 railroads from January 2022 through the end of 2023.
Railroads Included:
● BNSF
● Canadian National (CN)
● Canadian Pacific (CP)
● CSX
● Kansas City Southern (KCS)
● Norfolk Southern (NS)
● Union Pacific (UP)
Time Period of Records:
● The data spans from January 2022 to December 2023.
● There is a weekly reporting of figures on Wednesdays.
Content 2
In 2022, chemical manufacturers dependent on railway transportation were facing persistent supply chain challenges As the holiday season approached, the efficiency of rail logistics was crucial to easing the overburdened supply chain, yet many transit ports were overwhelmed, with some handling nearly four times their intended capacity This congestion was exacerbated by a significant reduction in railway workforce more than 20% in the previous three years partly due to the COVID-19 pandemic, which had seen imports fluctuate dramatically Although the
pandemic's effects were lessening at this point and import rates were climbing, there were still not enough employees to manage this increase efficiently.
Companies sought alternative transportation methods to speed up product delivery, but bulk purchasers were particularly hampered by congested railways, which led to loading and unloading delays. These delays extended turnaround times, causing product backlogs at warehouses and further delays in picking up new shipments.
Nearly all (93%) chemical manufacturers reported that railroad delays were either worsening or remaining unchanged. The disruptions consistently negatively impacted U.S. manufacturing operations over several quarters. Due to the unique needs and scale of chemical shipments, transitioning to trucking wasn’t usually a feasible alternative for these manufacturers.
The February 2023 East Palestine incident, in which a train of industrial chemicals derailed near an Ohio town, further delayed the recovery of the chemical rail shipping supply chain. However, towards the end of 2023, carloads began to increase again. As of the week ending October 14th , 2023, there were nine consecutive weeks of growth in chemical rail traffic. However, in the weeks preceding this rise, the overall chemical rail traffic experienced a decline of 1.1% compared to the same period in 2022.
Measure 3 – Cars Held
Graph 3
Graph Measures
Overview:
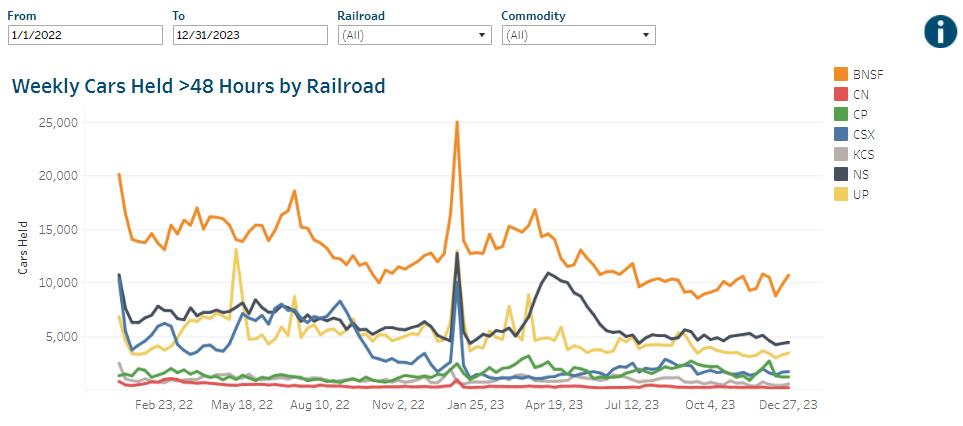
● The provided data shows the weekly average of cars held for the various Class 1 railroads from January 2022 through the end of 2023
● The Total Cars Held Report shows the average number of cars in revenue service that have not moved in 48 hours or more
Railroads Included:
● BNSF
● Canadian National (CN)
● Canadian Pacific (CP)
● CSX
● Kansas City Southern (KCS)
● Norfolk Southern (NS)
● Union Pacific (UP)
Time Period of Records:
● The data spans from January 2022 to December 2023
● There is a weekly reporting of figures on Wednesdays
Content 3
The Total Weekly Cars Held Report indicates the average number of cars in revenue service that have not moved in 48 hours or more. This graph can give insights into determining which railroads are affected by service issues, when shippers might expect longer holding times, and
how seasonal trends, weather issues, and the Class 1’s decisions impact the health of their networks, as well as the health of the supply chain of shippers on their networks.
For instance, on the dashboard, the UP experienced a significant spike in Cars Held in April of 2022. This came during a period of such significant strain on the UP’s networks that they announced a limit on customer-owned railcars on their network. The congestion was so high that they were forced to manage the inventory levels by reducing railcar inventories and could have been a contributing factor to their rise in Cars Held.
Another example can be seen with the NS’ rise in Cars Held over the first half of 2023. This could be largely attributed to the East Palestine derailment that took place in early February of 2023. The new tracks were not installed until four months later.
An example of seasonal trends can be seen with the spike in Cars Held at the end of 2022 and the smaller rise in 2023. Typically, the holiday season sees a rise in Cars Held as crews are not as available and end of the year shipping surges. Still, the holiday season of 2022 was an extraordinary spike. This can be attributed to several factors, including potential strikes, government intervention, and recovery from pandemic effects.
Measure 4 – BNSF Velocity
Graph 4
Overview:
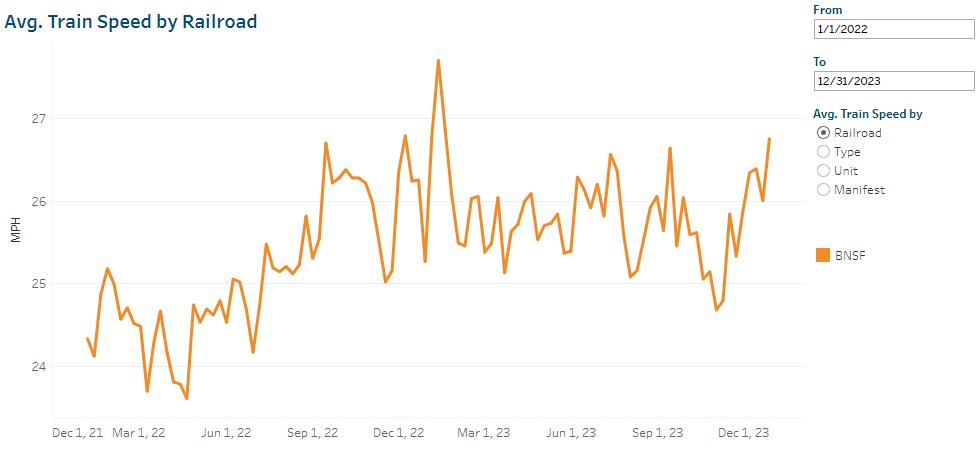
● The provided data shows the weekly average of BNSF train’s velocity for January 2022 through the end of 2023
● Velocity is the speed of a train from origination to destination, including the amount of time a train dwells in a yard for a crew change, pick-up or traffic set-off
Railroads Included:
● BNSF
Time Period of Records:
● The data spans from January 2022 to December 2023.
● There is a weekly reporting of figures on Wednesdays.
Content 4
Gradual Increase in Velocity
Throughout 2022 and 2023, there is a noticeable gradual increase in the average train speed (measured in miles per hour). This trend is punctuated by fluctuations that correspond to various factors, including seasonal changes, operational enhancements, or external disruptions.
Seasonal Fluctuations
The data points suggest a pattern of seasonal fluctuations. For example, speeds tend to increase in the late spring and early summer months, indicating potentially higher efficiency or less operational friction during these periods. Fall and winter months show some volatility, possibly due to weather-related challenges or changes in freight demand.
1. Operational Optimization: BNSF appears to be steadily optimizing its operations, as evidenced by the overall upward trend in average train speeds.
2. Resilience and Adaptation: The data indicates BNSF's resilience and ability to adapt to varying conditions, maintaining a generally positive trend amidst fluctuations.
Measure 5 – Trains Held
Graph 5
Graph Measures
Overview:
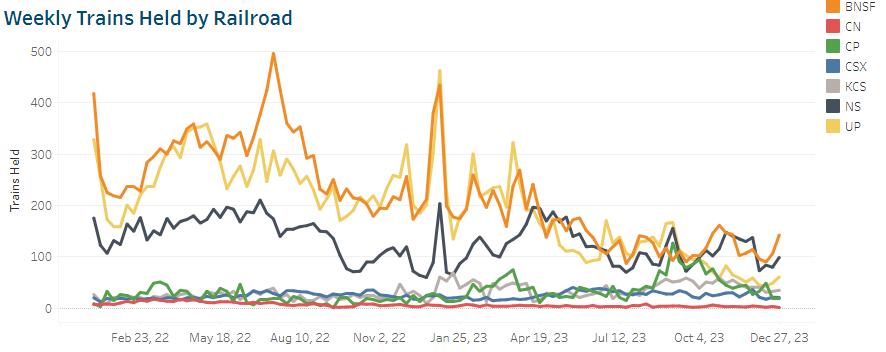
● The provided data shows the weekly average of trains delayed for the various Class 1 railroads from January 2022 through the end of 2023.
● Trains delayed is defined as the daily number of loaded and empty trains held short of destination or scheduled interchange for longer than six consecutive hours.
Railroads Included:
● BNSF
● Canadian National (CN)
● Canadian Pacific (CP)
● CSX
● Kansas City Southern (KCS)
● Norfolk Southern (NS)
● Union Pacific (UP)
Time Period of Records:
● The data spans from January 2022 to December 2023.
● There is a weekly reporting of figures on Wednesdays.
Content 5
The Trains Held report indicates a spike in August of 2022 followed by another spike at the end of 2022, into 2023 Following this, throughout 2023 the daily number of loaded and empty trains held short of destination or scheduled interchange for longer than six consecutive hours began to ease
Partially this is due to the ongoing effects of the Covid-19 pandemic that was exacerbated by a rift in the labor force in 2022. There had been a series of increasingly contentious strikes leading up to 2022; to address the rail service issues that had affected the industry for years, President Joe Biden created a Presidential Emergency Board. The height of the discussions came in the middle of 2022 to around September, when labor unions began to make tentative agreements.
However, some of the labor union’s members voted no on the ratification votes, and fears of a massive, potentially economy crippling strike contributed to Trains Held driving back up again in a dramatic spike. This strike was averted in December 2022 when the U.S. Government stepped in to avert the strike and force a labor agreement.
Throughout the rest of 2023, the number of Trains Held declined. There were small spikes in certain railroads (including the CP, NS, and UP) that can be attributed to such incidents as weather or the East Palestine derailment on the NS’ network. However, due to an easing of the labor issues, and weak demand for the rail freight shipping industry and intermodal industry, Trains Held would finish 2023 much lower than where it had begun the year.