About RSI Logistics
RSI Logistics has been providing cutting edge software and logistics solutions to rail shippers for over forty years. We began by manually helping shippers organize and optimize their rail logistics, but soon recognized the need for one automated, comprehensive system.
Today Rail Command®, our Rail Transportation Management System (Rail TMS), helps shippers across North America manage all aspects of their rail supply chain.
All the insights explored within this Annual Report are found within Rail Info, our industry metrics tool. The rail experts at RSI Logistics have developed this tool to provide rail industry intelligence in a method that is simplified, visualized, and streamlined.

Welcome to the 2025 Annual Rail Shipping Trends Report presented by RSI Logistics.
This comprehensive document is dedicated to uncovering, analyzing, and presenting the most pivotal trends, developments, and shifts within the railroad freight transport sectors over the past couple of years.
As the backbone of supply chains across North America, the performance of the rail shipping industry significantly impacts economies, businesses, and communities. This report aims to serve as an essential tool for stakeholders across the spectrum of business, government, and education, while providing valuable insights and data-driven analyses.
It is our belief that through better understanding and strategic action, we can collectively overcome existing barriers and unlock new avenues for growth and efficiency within the rail shipping industry.
Purpose of the Report
Chart Key Performance Indicators
Document and analyze year-over-year trends in rail shipping, focusing on key performance indicators for major aspects of the industry.
Identify Challenges and Opportunities
Uncover the underlying causes of persistent challenges within rail freight, from infrastructure constraints to regulatory impacts, and highlight emerging opportunities amidst evolving industry dynamics.
Advance Industry Dialogue
Foster a richer dialogue among industry stakeholders by sharing findings, best practices, and forward-looking perspectives, facilitating collaborative efforts to address common challenges and harness innovation.
Enhance Visibility and Transparency
Increase transparency around rail shipping operations, fostering a deeper understanding of the role rail transport plays in broader logistics and supply chain ecosystems.
Measure 1 Union Pacific Dwell Improvement
Despite the broader trends of increased dwell times across other rail networks, Union Pacific’s (UP) investments in capacity, operational efficiency, and strategic planning allowed the railroad to not only manage but improve dwell times.
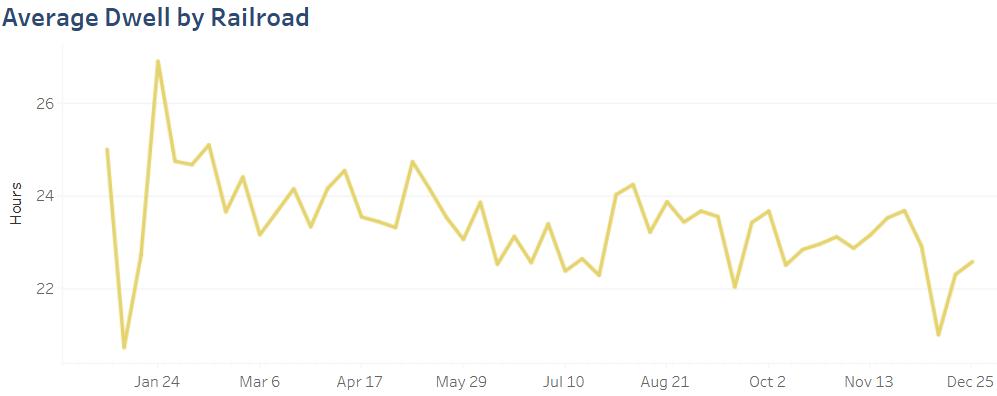
In October of 2024, UP’s CEO Jim Vena said that “As part of our strategy of Safety, Service and Operational Excellence, we expect the unexpected. We keep a buffer of resources to handle the ebbs and flows of our business, which has allowed us to recover quickly from severe weather and natural disasters, maintain fluidity during the recent Canadian rail work stoppage, and continue to improve the service we sold our customers”.
Throughout 2024, UP made key investments and operational adjustments to accommodate the shift in volume effectively:
Figure 1. Average Dwell by Railroad
• UP increased the well car (a type of railroad car specially designed to carry intermodal containers) supply to the ports of Los Angeles and Long Beach by 27% since the beginning of September 2024.
• The company added more crews at inland intermodal terminals and positioned additional lift equipment, notably in Joliet, Illinois, and in Marion, Arkansas.
• Daily calls with port terminals and ocean carriers were held to establish plans for maximum throughput capability.
• Union Pacific’s efforts to balance its fleet and efficiently manage the increased traffic through its capability investments enabled the railroad not only to meet but also exceed expectations in terms of service delivery.
While other carriers’ networks faced increases, the UP saw a 5% reduction in dwell time in the trailing four-week average year over year.
Measure 2
Norfolk Southern Velocity
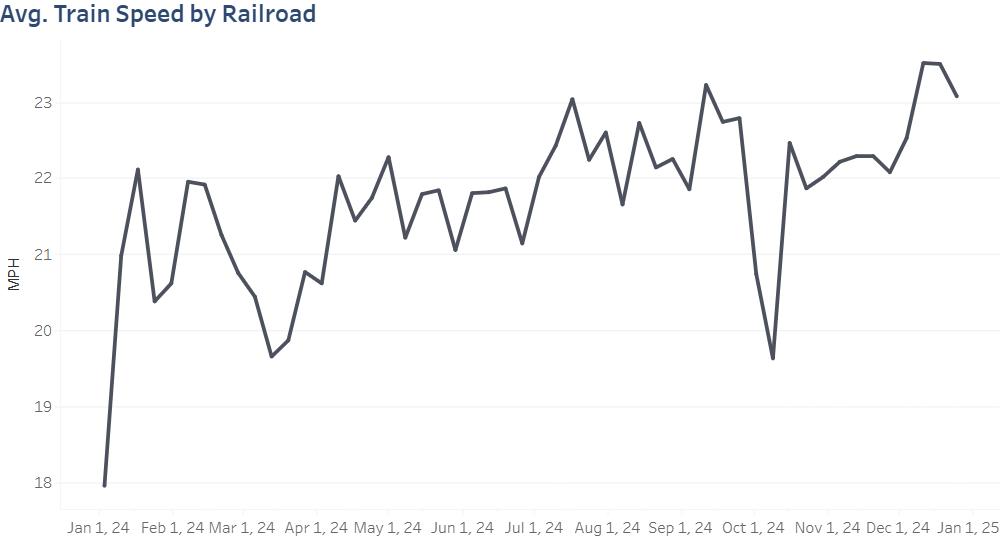
Over the course of 2024 the Norfolk Southern (NS) improved their train speed from 20.8 miles per hour (MPH) in the fourth quarter of 2023 to 22.6 MPH by the end of 2024. This was a 9% increase from the previous year.
Hurricane Season
Throughout 2024, velocity improved despite some small decreases. However, one of the most significant decreases came in late September and early October. Notably this was from two back-to-back hurricanes that hit the network of NS within two weeks of each other. However, the operational improvements the NS had made worked to quickly mitigate the damage and ensure that the recovery took place quickly.
Figure 2. Average Train Speed by Railroad

Operational Priorities
In March of 2024, the NS appointed a new Chief Operating Officer, who immediately pushed to streamline operational processes through:
• Launching a safety initiative designed to reinforce safety best practices, which would maintain smoother and faster operations and minimize disruptions, both of which contribute to speed.
• Assembling a network-wide asset utilization task force within the Network Operations Center that would assess inefficiencies and focus on improving operations.
• Developing a network heat map to identify blockages and better understand network congestion, then focusing on improving speed in those areas.
• Classifying two hump yards as ‘High Performance Terminals’, which would aim to achieve a 33% improvement in dwell time within 60 days and reduce turnaround times for trains.
• Removing 53 low-volume intermodal lanes that did not have a high enough density, which reduced the complexity of the network, reducing conflicts that could slow down speed.
According to the NS, in just two weeks, the carrier increased merchandise train speed by 8%.
Measure 3 Canadian Weekly Cars Online
Though both Canadian carriers had instances where their cars online were higher in 2024 than 2023, more often the number of cars online had decreased from the year before. Several factors contributed to this trend, including strikes, adverse weather conditions, a downward shift in grain production, and ports struggling with high volume.
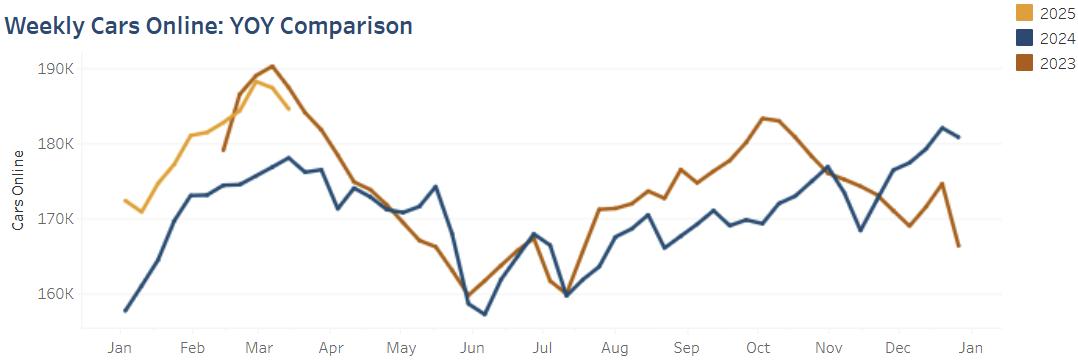
Figure 3. Weekly Cars Online
In 2024, Canada faced significant challenges that strained the rail network.
An October strike at the Port of Vancouver caused temporary closures and disruptions which left a backlog that continued to challenge operations and logistics. Rail container traffic was particularly strained as Vancouver is a critical juncture for trans-Pacific trade, affecting shipments bound for the U.S. and other international markets. And in late August, Canada’s two major rail carriers were halted due to a work stoppage that followed months of labor uncertainty. Though both rail carriers announced a swift recovery, the network was still impacted.
Alberta, a major producer of agriculture, energy, oil and gas, faced yet another recordbreaking wildfire season. The Jasper wildfire forced the CN to cease rail operations through the vital corridor in July, which prompted a growing backlog of shipments. Westbound movements from Alberta and eastbound movements from the Port of Vancouver were cut off or forced to be rerouted far from their initial routes. Even after rail lines began to reopen, the delays were so significant that the rail supply chain was stressed for some time.
Measure 4 NS Operating Ratio
The NS improved their Operating Ratio over 2024 after beginning the year at their highest Operating Ratio over the last few years.
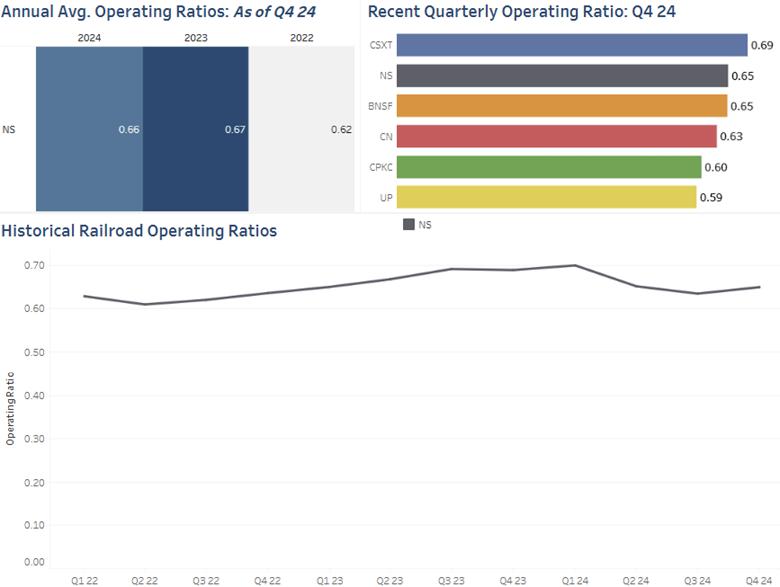
Figure 4. Annual Avg. Operating Ratios: As of Q4 24
Figure 5. Recent Quarterly Operating Ratio: Q4 24
Figure 6. Historical Railroad Operating Ratios
For the fourth quarter of 2024, the Norfolk Southern (NS) announced an adjusted 64.9% operating ratio for the quarter. Operating Ratio (costs divided by revenue) is an important metric that measures a carrier’s efficiency through both decreasing total operating costs and increasing total revenue.
The NS’s end of year operating ratio improved from 68.8% from a year before, and the adjusted full-year 2024 operating ratio was 65.8% - almost two percentage points better than the 2023 adjusted full-year operating ratio of 67.4%.
Several operational strategies contributed to the improved operating ratio:
• Attention paid to operational spending and streamlining processes.
• Insurance recoveries related to the Eastern Ohio derailment outpaced the incremental costs associated with it.
• Despite the overall decline in revenue, excluded lower fuel surcharge revenue shows an operating revenue increase of 2% on a volume growth of 3% compared to Q4 2023.
Measure 5 Overall Railcar Volume
Through 2024 carloads shipped throughout North America were down, yet intermodal units had increased. Combined, carloads and intermodal units had increased versus the same period in 2023.
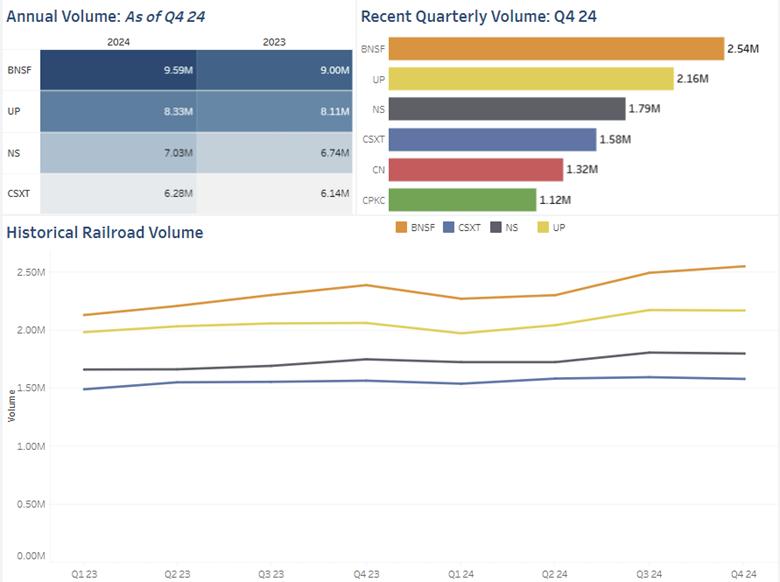
Compared to 2023, 2024’s annual volume for railcars of the major United States carriers (BNSF, UP, NS, and CSXT) was up 3.4%. However, this growth was driven by intermodal, which increased by 9.3% over the 52 weeks of the year. Carloads, on the other hand, declined 2.9%.
Figure 7. Annual Volume: As of Q4 24
Figure 8. Recent Quarterly Volume: Q4 24
Figure 9. HIstorical Railroad Volume
Decline in Carloads
Most notably, declines in carloads were recorded in sectors traditionally reliant on carload shipping. Coal carloads decreased by 13.6%, metallic ores and metals by 3.7%, and nonmetallic minerals by 5.9%. Other categories only saw marginal growth, like forest products and motor vehicles and parts, both of which only expanded by 1%.
These sectors often serve as a bellwether for industrial demand and economic health, so the drop in rail traffic for these commodities could be due to underlying economic shifts rather than sector-specific challenges.
Intermodal Growth
By November 2024, the intermodal volume reached the third-highest record on file.
There was resilient consumer spending, driven by a strong job market and stable inflation which supported the possibility of robust retail activity. However, businesses were also building up inventories, in part as a hedge against uncertainties. Potential tariff increases under the Trump administration may have prompted shippers to expedite the movement of goods to avoid additional costs, contributing to higher intermodal volumes.
Furthermore, diversion of shipments from East Coast ports due to labor concerns and the strategic movements in response to global trade dynamics exerted significant impact on the volume of goods being transported via intermodal services. Railroads are also investing in infrastructure improvements, such as the completion of a $100 million second span over the Rio Grande by CPKC that doubled cross-border intermodal capacity.
Throughout 2025, the rail industry continues to explore the latest trends, technologies, and challenges that influence how goods are shipped across the networks. Throughout this eBook, we have explored the changing landscape of the rail industry, focusing on the trends of the overall industry over the last couple of years. These trends not only highlight the challenges shippers face but also the exciting opportunities for growth and improvement within the rail sector.
The story of rail shipping in 2025 is about embracing change, becoming more resilient, and using technology to make operations and logistics smoother, safer, and more customer friendly.
As we work towards a better future for rail shipping, we encourage everyone involved in the rail industry to join us in this effort. Let us make a difference together by staying informed, embracing innovative technologies, working together, and planning for the unexpected. That is why we developed Rail Info, to simplify, visualize, and streamline these critical insights from the rail industry. Explore a new way of analyzing rail industry data, where complex information is transformed into customizable, actionable insights accessible to you.