VIC

VICTORIA GREENFIELD MARKET REPORT
Q4 2024

VICTORIA GREENFIELD MARKET REPORT
Q4 2024

Luke Kelly
National Managing Director
Built Form
luke@rpmgrp.com.au
While the final quarter of 2024 saw some improvement, it was not without its challenges. Sales activity in Melbourne and Geelong’s growth areas increased by 20% compared to Q4 2023, signalling a cautious recovery in buyer sentiment. However, momentum has remained inconsistent, with sales slowing month on month and continuing affordability pressures weighing on the market.
Affordability remains a key theme across the board. While no longer increasing, elevated construction costs, continue to strain developers and buyers alike. Developer-led rebates and discounts, and government grants have played a vital role in sustaining demand. Titled land has been the primary beneficiary of these incentives, making up nearly 60% of total sales in Q4. Yet even with these efforts, titled lots lingered longer on the market, with the average time on market hitting a record high of 186 days.
• Sales improved in Q4, but affordability constraints and elevated construction costs continue to limit momentum.
• Shifting buyer demographics and the surge in south east corridor sales has pushed the median lot prices past $400,000.
• The regional market rebounded in Q4 due to its affordability advantage, new stock releases show developer confidence.
Despite these challenges, the median price for lots increased by 2.4% in Q4, surpassing the $400,000 mark. This rise in median price is largely attributed to a shift in buyer demographics and more sales in pricier areas.
Upgraders and downsizers, who tend to have more financial flexibility, have become more prominent in the market, outnumbering first home buyers. Their presence has helped push prices higher, though this increase is softened by the rebates and discounts developers are offering to keep sales afloat.
The south east corridor, where lot prices are notably higher, has seen an increase share of total sales –naturally skewing the overall median price upward. Conversely, the western corridor, with its more price-sensitive buyers, continued to struggle with affordability challenges.
Meanwhile, the regional land market has seen a more marked recovery, with significant gains in sales activity and new stock. This signals renewed confidence from both buyers and developers,
who are responding to demand with more land releases. Regional markets are benefiting from their continued affordability advantage over metropolitan areas, making them an attractive option.
We have also noted greenfield townhomes gaining traction as an investment option, offering strong yields and long-term growth potential.
The outlook for Victoria’s land market remains cautiously optimistic with affordability remaining a key concern. The February rate cut is expected to lift consumer confidence and enquiry levels, but sustained improvements in sales will require multiple rate cuts.
By June 2026, interest rates could fall by up to 1%, increasing borrowing capacity by approximately 10%. For example, a household earning $120,000 could afford to borrow an additional $60,000. However, this remains well below what was possible in 2022. In the meantime, developers will need to continue leaning on strategic pricing, product innovation, and incentives to keep demand steady.
For more information, please visit: www.rpmgrp.com.au
For a detailed market analysis or a tailored report, email the team at: contactus@rpmgrp.com.au

Inflation has fallen enough for Australia to begin its rate-cutting cycle.
RPM’s Research, Data & Insights division provides indepth analysis on current local and overseas economic and property market conditions. The team consists of economists, property experts, and GIS analysts that provide real-time market intelligence, and analytical and strategic advice.
Our knowledge and expertise are an invaluable resource for RPM’s developer clients, empowering them to make intelligent, informed, and strategic decisions when evaluating residential developments and investment opportunities.
Our data and analysis help clients maximise their marketing efforts and achieve sales targets on their estates. Each month we collect extensive data on approximately 350 estates in Victoria, 140 estates in Queensland and 180 in New South Wales, providing our clients with a comprehensive understanding of the market dynamics. This also underpins the core strategic decision-making of our own business.
We profile every lot including lot size, price, orientation, sqm rate and title status, monitoring through to final sale.
Your dedicated research team:

Michael Staedler General Manager
Research, Data & Insights

Andrew Raponi
Senior Research Manager
Research, Data & Insights

Research Manager
Research, Data & Insights
Luke Kelly
National Managing Director Built Form
luke@rpmgrp.com.au
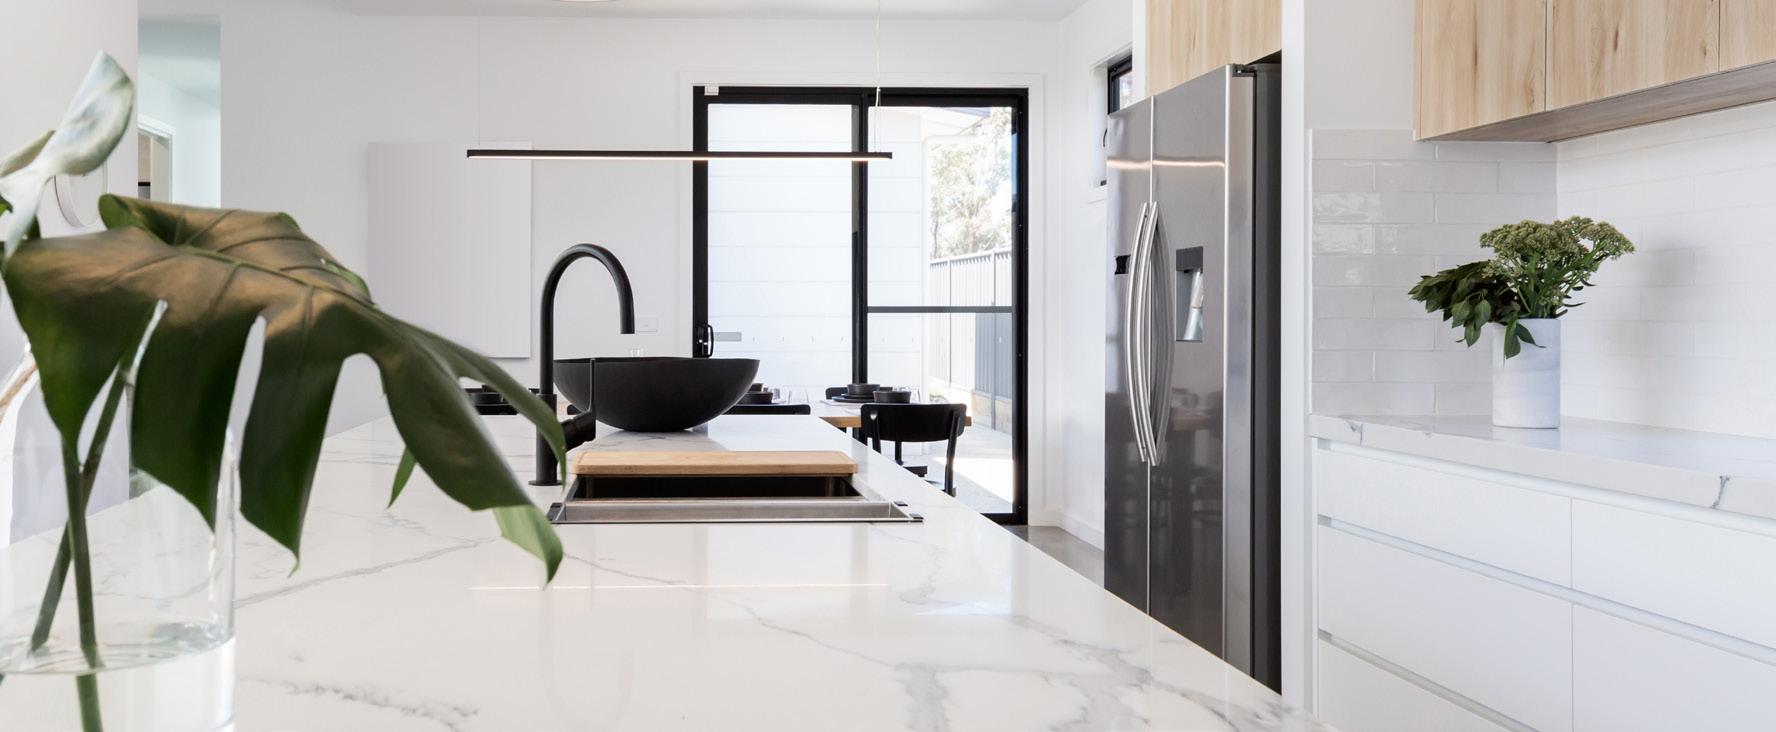
Townhomes are an investor’s smartest play.
The townhome market is evolving. What was once primarily seen as a first home buyer’s domain is now an increasingly attractive investment opportunity. Townhomes are now firmly on the radar for investors due to their relatively affordable entry point, coupled with strong yield – particularly in Melbourne’s greenfield corridors.
Greenfield townhomes, typically priced between $500,000 and $600,000, remain more affordable than comparable options in most other states. As Melbourne’s outer suburbs experience significant infrastructure investments and developer confidence rises, the greenfield townhome market has become an increasingly sought-after investment destination.
New loan commitments to investors rose 10% over 2024. There is a growing recognition that townhomes are a strategic investment opportunity with clear financial benefits. The combination of strong returns, stamp duty concessions, depreciation factors, and land tax advantages makes townhomes an ideal investment vehicle in today’s market. When factoring in the current elevated construction costs and high interest rates, townhomes offer a highly attractive risk to reward ratio for investors seeking value and stability.
They’ve proven to be more resilient than other residential property types during market downturn. Townhomes typically see less price volatility and offer higher rental yields, providing investors with consistent cash flow and long-term capital gains. And with affordability pressures still high, many investors (and renters) prefer townhouses as a more cost-effective option compared to standalone houses.
As market conditions shift, RPM Built Form division has adapted its strategies to better align with investors’ goals, as well as owner occupiers’ needs. We’re actively guiding our developer partners in refining their offerings to ensure their products meet demand, whether by incorporating innovative design solutions or responding to the growing need for single storey townhomes with an even greater affordability advantage. With limited supply in greenfield areas, townhomes remain the most compelling investment option that will also ease the pressure on an already strained rental market.

Tim Hyland
National
Strategy Manager
Transactions & Advisory
tim@rpmgrp.com.au
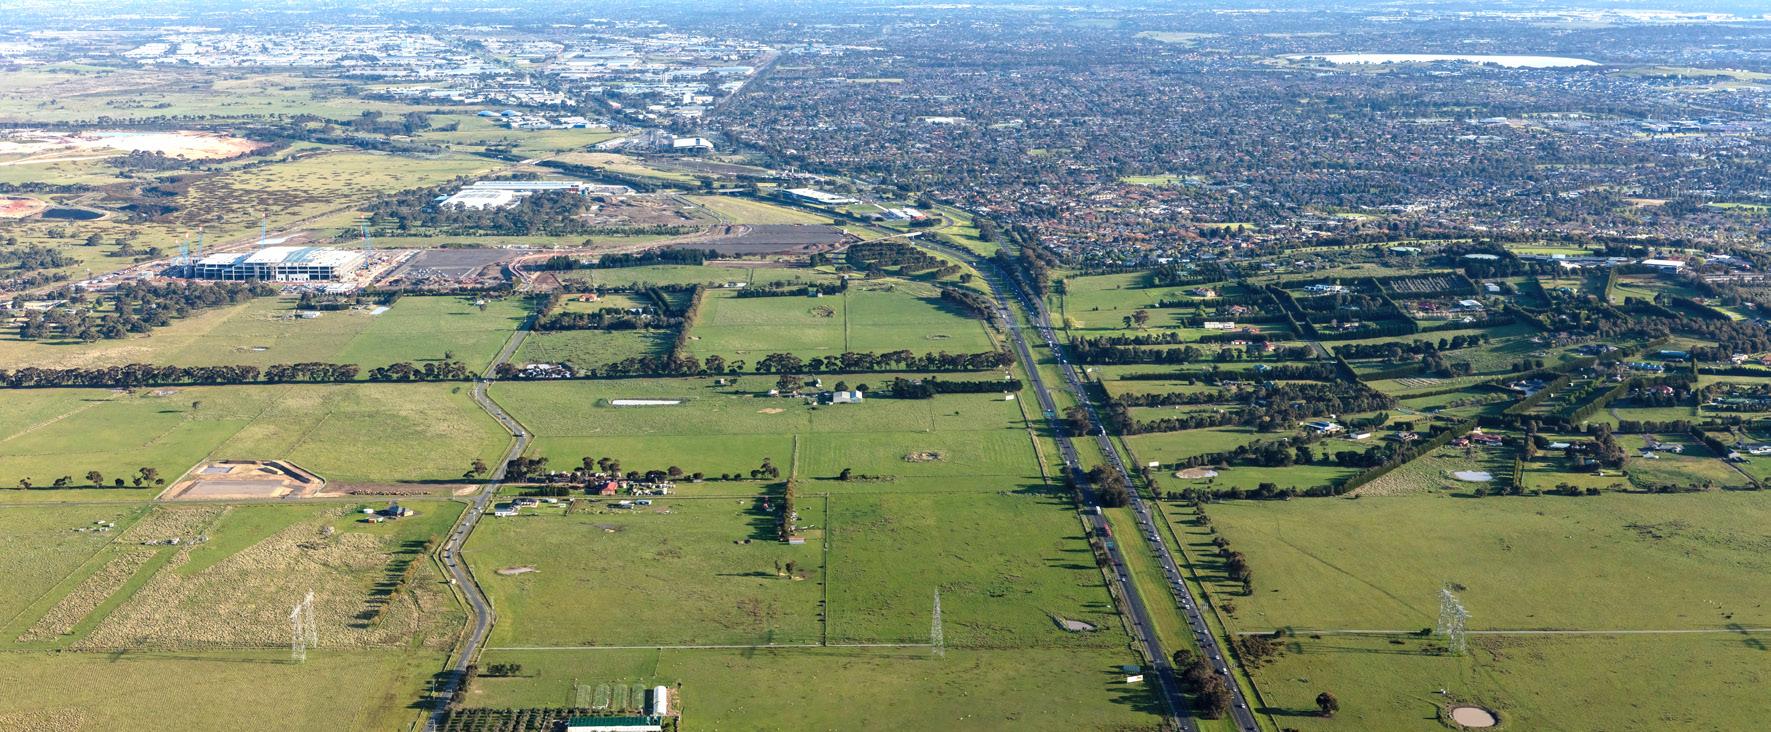
The race for digital infrastructure in Australia is on, with data centres at the forefront of a technological revolution that will shape the nation’s economic future. As the demand for cloud computing, artificial intelligence (AI), and digital services soars, the data centre industry is undergoing a rapid expansion with Melbourne emerging as a key hub in the Asia-Pacific region.
Australia’s data centre capacity is projected to more than double from 1,350 MW in 2024 to 3,100 MW by 2030, requiring an estimated $26 billion in investment. Melbourne is poised to capture the lion’s share of this growth; of the 183,000sqm currently under construction across the nation, close to three-quarters of new supply will be in Melbourne. This surge is driven by increasing land constraints in traditional hubs and a growing preference for large, hyperscale data centres.
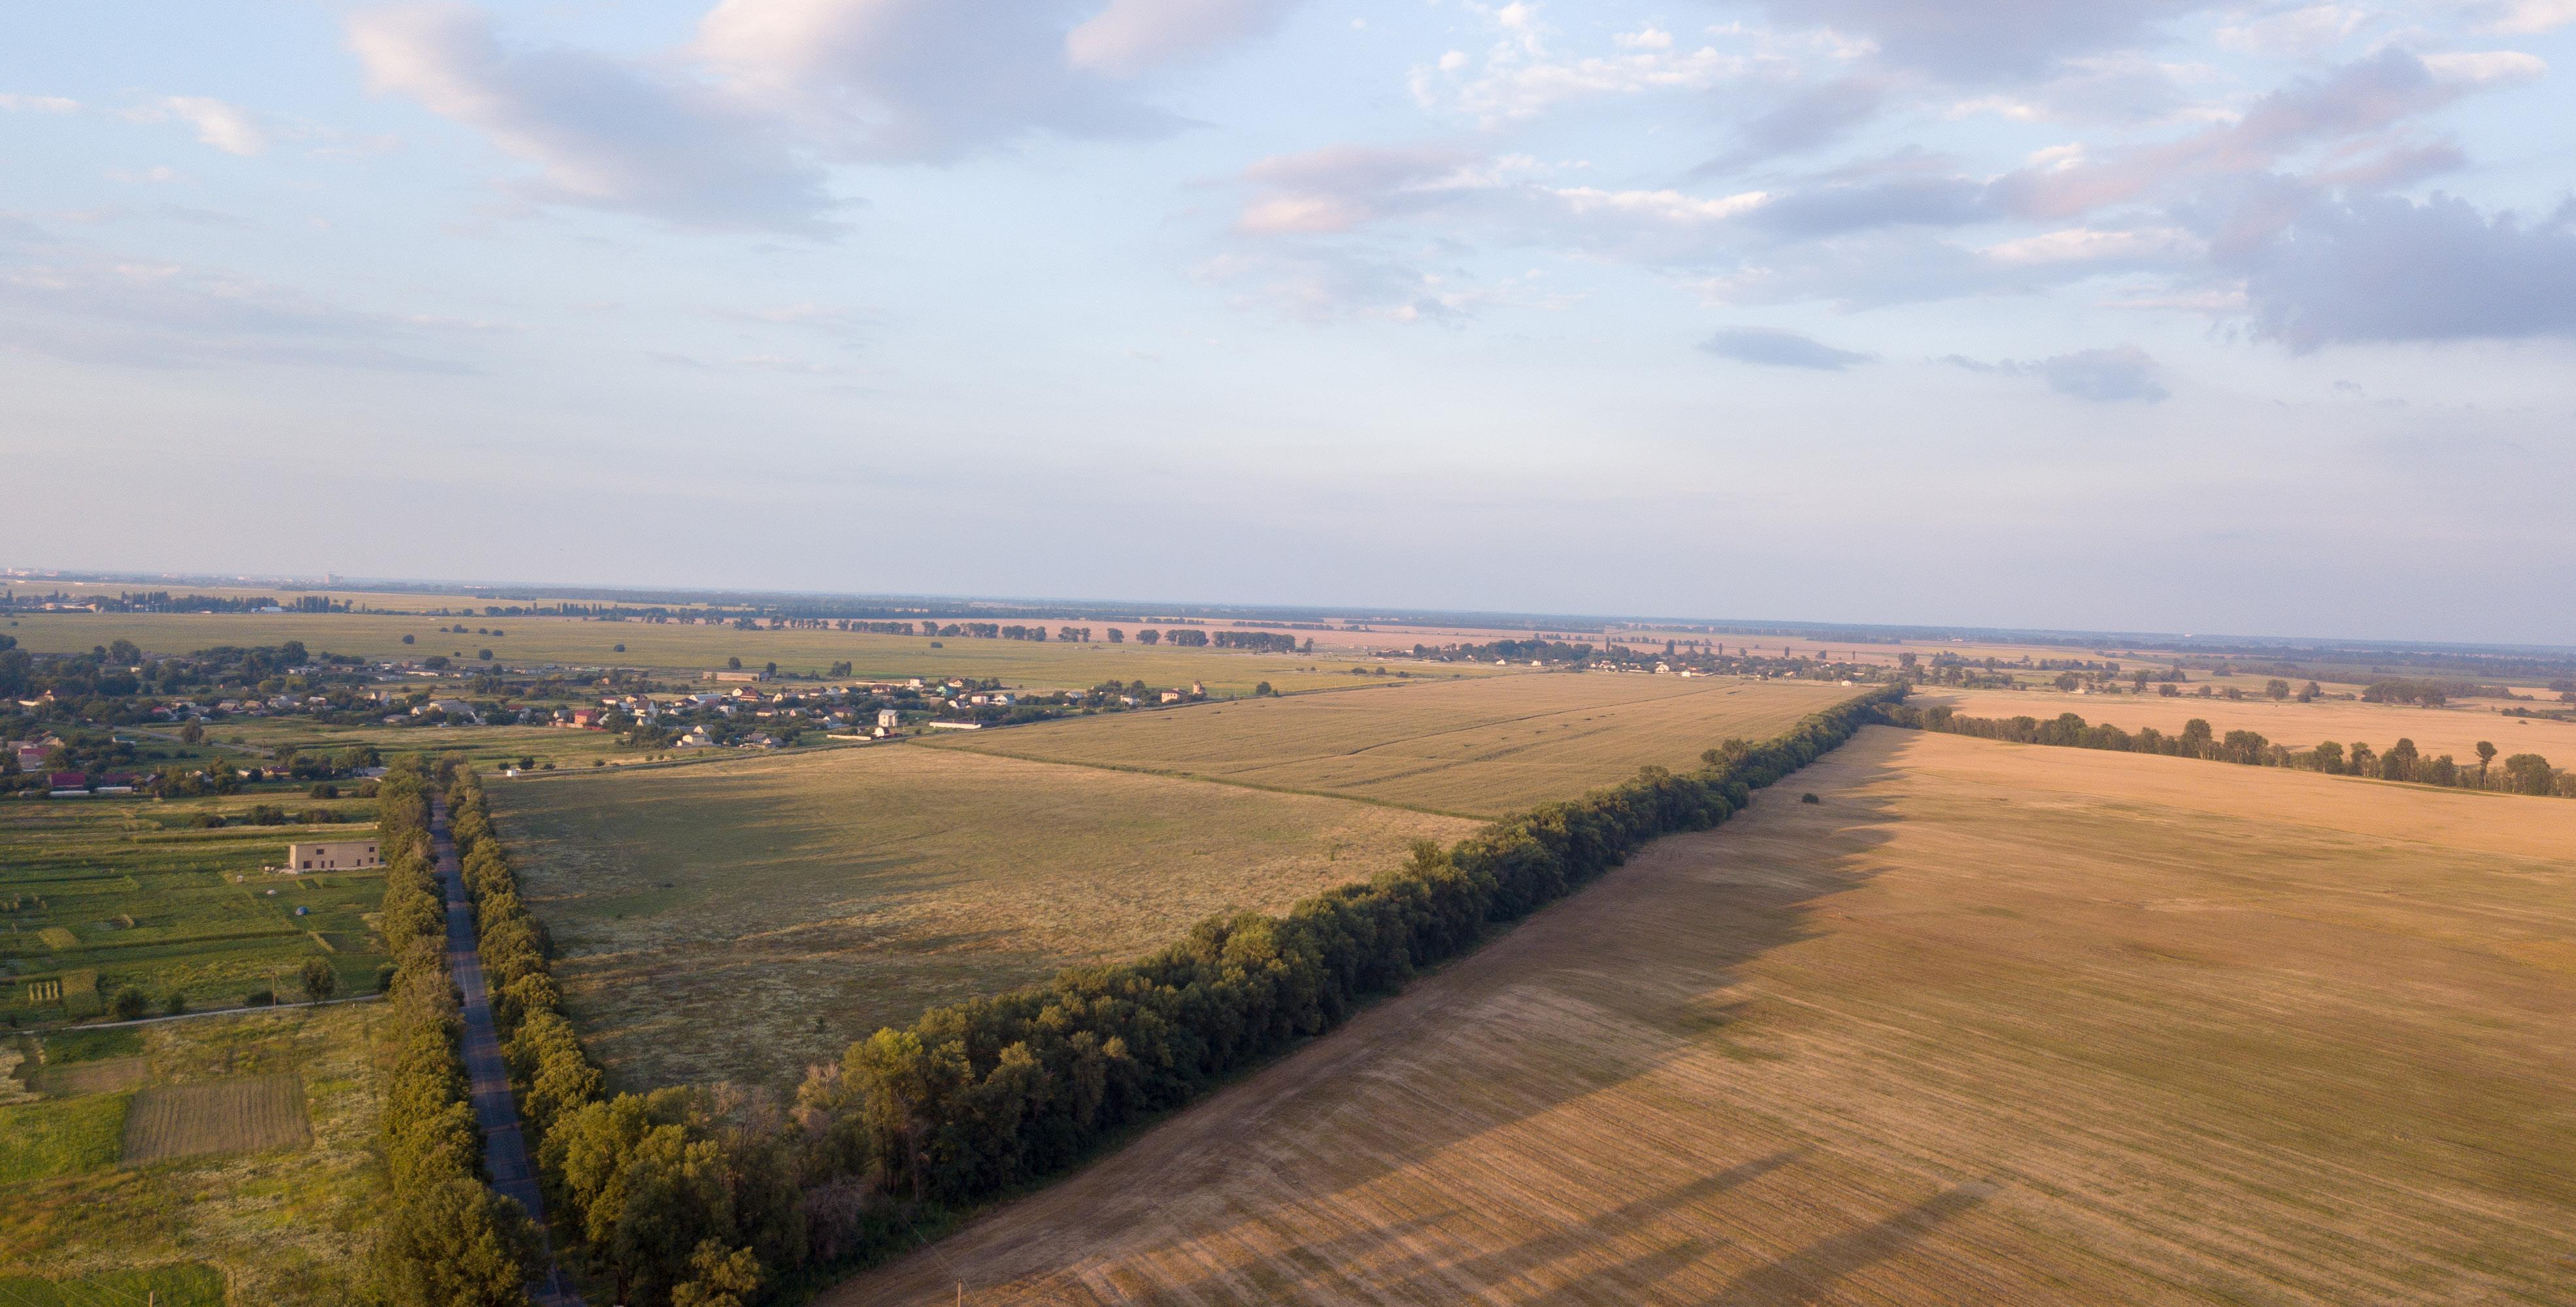
With land constraints reshaping the market, Victoria’s greenfield development sites are becoming the new frontier for digital infrastructure.
Historically, data centres in Melbourne have been concentrated in industrial areas such as Fishermans Bend, Yarraville, and Tullamarine. However, as demand shifts toward larger, more power-intensive operations, greenfield sites are becoming the new frontier. These expansive sites allow for scalable infrastructure, advanced cooling solutions, and more efficient energy management – all key priorities for operators’ focus on sustainability and performance.
The greenfield shift presents both a challenge and an opportunity. Melbourne’s industrial land supply is at an all-time low, making site acquisitions increasingly competitive. Greenfield sites offer a rare opportunity for developers to secure large-scale, long-term assets that can accommodate the next generation of digital infrastructure. RPM Transactions & Advisory (T&A) division, with our deep local expertise and established relationships with major landowners, is playing a pivotal role in identifying and securing strategic parcels of land for data centre development.


Leveraging our GIS mapping data and industry renowned research capabilities, RPM T&A is working closely with global players from the US, Singapore, and Japan to facilitate the next generation of data centre projects. As competition for prime sites intensifies, those who act decisively will gain a significant advantage in securing Melbourne’s most strategic locations.
Beyond land availability, Melbourne’s broader economic and technological strengths underpin its rise as a data centre powerhouse. The city is home to Australia’s top-ranked university and a highly skilled workforce, essential for supporting the growing demand for engineers, network specialists, and cybersecurity professionals. With four in ten data centre roles currently experiencing shortages, workforce development will be critical to sustaining the industry’s momentum.
The significance of data centres extends well beyond their footprint. They underpin Australia’s digital economy, supporting industries from finance and e-commerce to healthcare and artificial intelligence. Generative AI alone could add up to $115 billion
to Australia’s economy by 2030, but realising this potential depends on the nation’s ability to scale up its digital infrastructure.
Melbourne’s continued rise as a data centre hub will hinge on its ability to navigate land supply constraints, workforce challenges, and energy requirements. With strong fundamentals and a proactive approach to development opportunities, we are well positioned to cement Melbourne’s status as a leading destination for digital infrastructure investment in the AsiaPacific region.
For more information on development site opportunities, contact
Tim Hyland
tim@rpmgrp.com.au
Zaynoun Melhem zaynoun@rpmgrp.com.au

Rod Anderson
National Managing Director Communities
rod@rpmgrp.com.au
Sales activity closed 2024 on a stronger note than the previous year, with total gross sales across Melbourne and Geelong’s growth areas reaching 2,149 lots in Q4 –a 20% increase from Q4 2023, signalling cautious improvement in buyer sentiment.
However, momentum remained inconsistent. Q4 sales fell 9% from Q3, a typical seasonal dip, while each month recorded fewer sales than the last, reflecting ongoing affordability challenges.
Steady interest rates provided little relief to purchasing power, while upward pressure on building materials and labour maintained elevated construction costs. To counter these constraints, developer incentives –including rebates, discounts, and government grants –sustained demand, particularly for titled or near titled* land, which made up nearly 60% of total sales.
Despite incentives, titled lots lingered longer on the market. The average trading period for lots sold in Q4 hit 186 days, the highest on record.
Higher priced south east sales drove median prices higher despite affordability pressures.
Median lot price growth accelerated to 2.4% in Q4, pushing values past $400,000. While this seems at odds with affordability constraints, RPM Buyer Surveys show upgraders and downsizers outnumbering first home buyers in Q4. Their greater financial flexibility helps offset borrowing constraints with higher savings and equity.
The headline price of $401,000 does not fully reflect actual transaction values. Typical rebates and discounts of up to 10% in some areas ease the burden, but net lot price remains high.
Geographical sales distribution also influenced price growth. The south east, where the median lot price exceeds $460,000, gained market share, lifting the overall median – especially in a lower volume market.
By year-end, the new home market had an estimated 5,655 lots available, up 5% from Q3. New supply fell 8% to 1,679 lots, while stock returns inched up 2% to 730 lots.
* Within three months of title
We survey all buyers on RPM managed estates in the greenfield market.
The following illustrates demographic and purchase intent amongst all purchasers over Q4 2024. For a detailed analysis of any corridor, LGA, or suburb in Victoria, please contact our Research, Data & Insights team.
contactus@rpmgrp.com.au
$650-700k
$600-650k
$550-600k
$500-550k
$450-500k
$400-450k
Source: RPM Research, Data & Insights

Sales activity in the western growth corridor dropped 17% in Q4 2024, with only 740 lots sold. While this number was slightly higher than Q4 2023, it marked a clear decline in market activity. The corridor’s share of total sales fell to 34%, still the highest among Melbourne’s four growth areas.
Sales dropped substantially in Wyndham and Melton, down 18% and 13% respectively. Additionally, the average time on market for lots sold stretched to 207 days, the longest of any growth corridor. This extended selling period highlights the sluggish market and the increasingly challenging market conditions.
The western growth corridor’s new land supply hit its lowest point in over a decade during Q4 2024, with lot releases dropping 4% to 563.
Wyndham saw a sharp 9% drop in supply, while Melton recorded a slight 2% rise. Stock returned to market increased 7% to 303 lots, which added pressure on absorption rates. Wyndham led in stock returns, but Melton showed a notable increase from the previous quarter, narrowing the gap between the two regions. Slow lot absorption and high stock levels are deterring further releases.
The western growth corridor’s median lot price edged up by 0.3% in Q4 2024, reaching $380,000. Despite this modest rise, prices remain 1.3% below their peak in Q4 2022.
More notably, the corridor has once again lost its status as the most affordable growth area – a title it briefly reclaimed in Q3 – now surpassing the northern growth corridor in median lot price.
Meanwhile, lot sizes remain unchanged at 350sqm across the last two years. This stability reflects the ongoing tension between affordability constraints and buyers’ preference for a lot size that can accommodate their ideal new home.
Sales in the northern growth corridor slowed in Q4 2024, falling 17% and reducing its share of total sales to 26%. Despite this, the corridor recorded 557 gross sales, marking a 5% increase from the same time last year.
Hume, after steady growth earlier in the year, saw the steepest decline, with sales plunging 44% to a two-year low. Mitchell (-31%) and Sunbury (-6%) also recorded losses, while Whittlesea was the only municipality to see growth, up 11%. The average time on market for lots in the north edged up to 150 days but remained the shortest among Melbourne’s growth corridors – signalling that while demand is easing, it remains strongest in the north.
New supply in the northern growth corridor remains below lot absorption, though the gap is narrowing. Over Q4, new releases declined 4% to 509 lots, a more tempered contraction than in previous quarters.
Whittlesea was the only area to record a decline in new lot supply, while Mitchell saw releases triple – albeit from a low base. Hume and Sunbury also saw increases. Stock returning to the market remained elevated at 173 lots in Q4. However, this is a 22% decrease, marking the first quarterly decline in over a year.
Source: RPM Research, Data & Insights
The northern growth corridor was the only region to see a decline in median lot prices over Q4, falling 2.6% to $371,000. This drop made it the most affordable growth corridor across Melbourne and Geelong.
Sunbury recorded the sharpest price correction, largely due to a significant reduction in the median lot size. Despite this, the overall median lot size for the corridor held steady at 350sqm.
Unlike the other growth corridors, sales activity in the south east rose 5% to 611 gross lot sales. More significantly, this marked a 61% annual increase and the highest sales volume in two and a half years. The corridor’s share of total sales climbed to 28%, surpassing the northern corridor.
Cardinia saw lot sales more than double, driven by a surge in titled lot sales, while Casey remained dominant, accounting for 77% of the corridor’s total sales. A higher proportion of titled lots contributed to a slight increase in the average time on market, reaching 157 days in Q4.
After three consecutive quarters of growth, new land supply in the south east growth corridor fell sharply in Q4, dropping 16% to 425 lots. This downturn was evenly distributed across the Casey and Cardinia regions, both recording a 16% decline in lot releases.
Meanwhile, stock returns in the south east corridor surged 20% to 146 lots – the highest increase among all growth corridors. This rise was driven entirely by Casey.
Source:
The south east growth corridor remains the priciest vacant land market, with the median lot price rising another 5.5% in Q4 to $463,000. This increase was driven in part by a 2% increase in the median lot size to 392sqm. As a result, the median lot value has set a new record, surpassing its previous peak in Q2 2024. The price per square metre rate also edged higher.
Sales activity in the Geelong growth corridor continued its upward trajectory in Q4, with gross sales rising 9% to 241 lots. Sales have also surged 76% year on year, with the Q4 result being the highest since Q2 2022.
Geelong’s share of sales climbed to 11%, the highest in three years, though still just shy of its longterm average of 12%. Armstrong Creek continued to account for the majority of sales, while sales patterns diverged elsewhere with Bellarine seeing a sharp 167% increase while Lara saw a 36% decline. Despite strong demand, the average time to market stretched to 282 days, the longest of any region – evidence of the ongoing challenges in clearing older stock.
New lot releases in the Geelong growth corridor declined in Q4 2024, dropping 6% to 182 lots after a significant rise in Q3. Armstrong Creek emerged as the main source of new releases once again, overtaking Lara, which saw a sharp decline.
Stock returns in the region rose 19% to 108 lots, with Armstrong Creek accounting for most of the returns. The Geelong corridor continues to face challenges with new lot supply remaining below historical levels, and stock returns trending upward each quarter.
Source:
The median lot size in Geelong growth corridor increased 2% over Q4 2024, returning to 400sqm. This underpinned a 2.9% rise in the median lot price, which now stands at $389,000. While this marks an improvement, the current price is still 4.2% below the record high of Q1 2024.

Michael Staedler
General Manager
Research, Data & Insights
m.staedler@rpmgrp.com.au
Rate cuts will likely boost sentiment, but market challenges remain.
On February 18th, The Reserve Bank of Australia (RBA) announced that inflation has fallen enough for Australia to begin its rate-cutting cycle. The Consumer Price Index (CPI) slowed further to 2.4% in Q4 2024, slipping below the midpoint of the RBA’s target range of 2%-3%.
Meanwhile, underlying inflation fell to 3.2%, reinforcing the case for monetary easing. While this rate cut will boost buyer sentiment and borrowing capacity, it is not a cure-all for the challenges facing the new home market.
The reduction in the interest rate will build on other policy measures that have improved purchasing power. These include the July 2024 stage 3 tax cuts, rebates and discounts on vacant lots, and government programs such as the Federal Home Guarantee Scheme (HGS) and Victoria Homebuyer Fund. While these initiatives may increase buyer interest, converting enquiries into actual sales will remain challenging amid competition from cheaper alternatives.
Melbourne’s median house price has corrected by 20% since its late 2021 peak, including a 2.1% decline in Q4 2024 alone. In contrast, median lot prices have risen by 16% over the same period, climbing another 2.4% in Q4. However, it’s crucial to reiterate what is driving this price movement: while pricing has shown growth, once rebates and incentives are factored in, actual values are typically 5%-10% lower. Furthermore, sales volumes remain well below peak levels, with 2,149 sales recorded in Q4 – just over half of what constitutes the long term average sales activity for a Q4 period.
The composition of sales is another factor to be mindful of. The south east corridor, where median lot prices exceed $460,000, has increased its share of total sales. This shift naturally elevates the overall median price, a trend that is more pronounced when sales volumes are lower. This effect highlights the increased prevalence of non-first home buyers in Q4, who typically have greater wealth and are less sensitive to affordability concerns and interest rate changes compared to first home buyers.
As a result of this price rise, the land to house price ratio has risen to 45%, significantly higher than its long-term average of 35%.
The secondary vacant land market remains a key factor influencing affordability. At the end of 2024 and into early 2025, approximately 2,700 resale lots were available for sale. Although this is 20% less than mid2024 levels, it still equates to nearly four months’ worth of average sales activity over the past two years.
Secondary market lots are similarly priced against comparable developer lots, providing competition for new home demand.
Looking ahead, as affordability pressures ease in line with projected interest rate cuts, sales in the new home market should benefit from improved sentiment. However, the extent of this uplift will depend on how quickly new home pricing adjusts relative to competing options.
Victoria has averaged 61,100 dwellings a year over the last decade, peaking at 69,129 in the year to September 2017. This was still 14% below the State Government’s target of delivering 80,000 new dwellings annually over the next decade.
Subsequently, the new home market will be instrumental in achieving this goal, given its ability to scale supply efficiently, offer diverse housing products, and maintain relative affordability for detached homes.

Rod Anderson National Managing Director Communities rod@rpmgrp.com.au
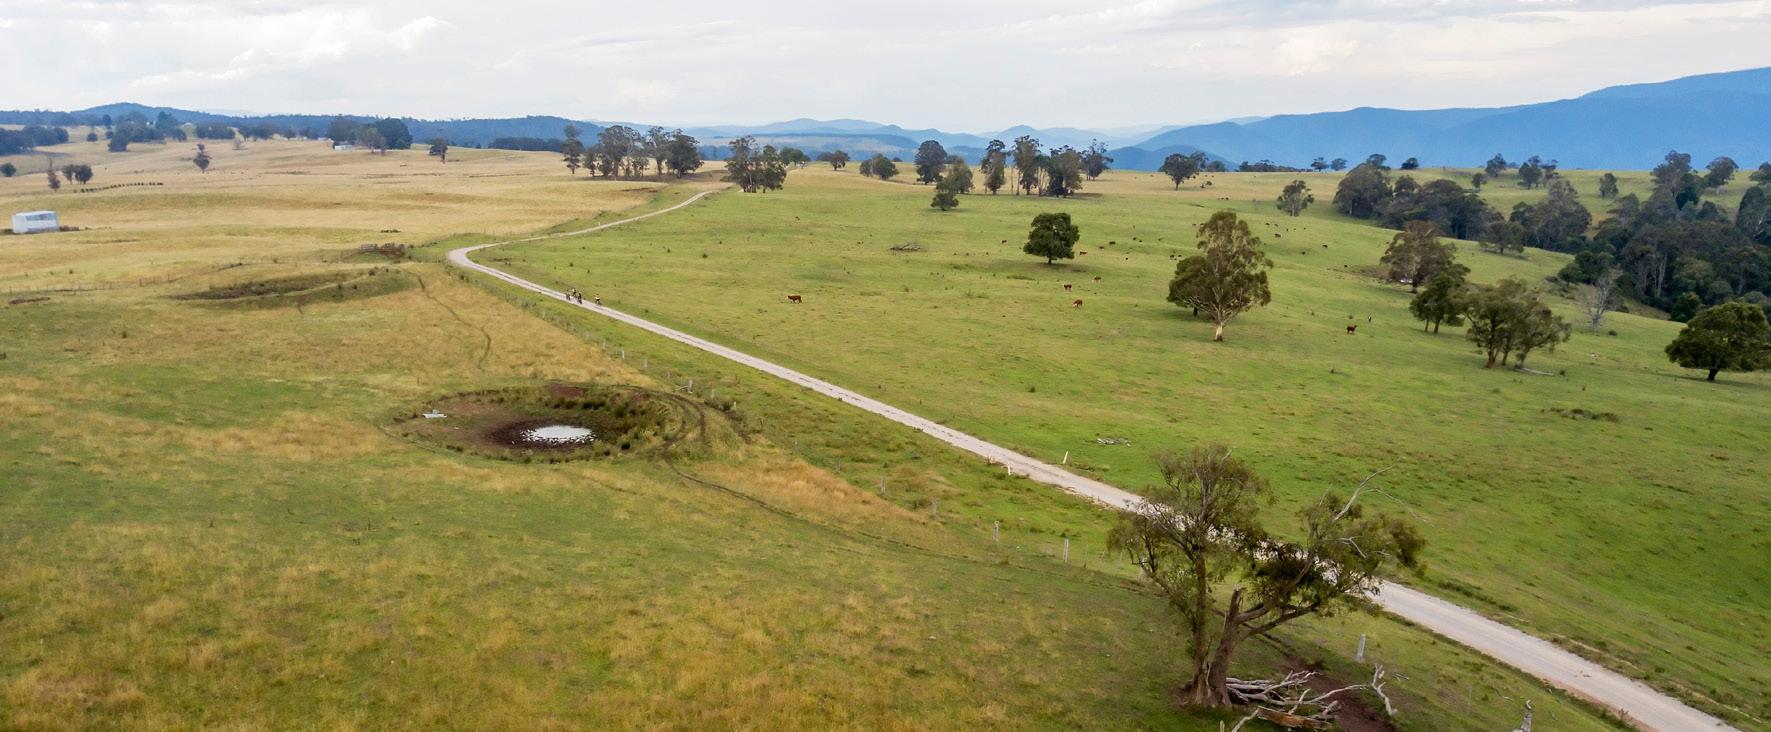
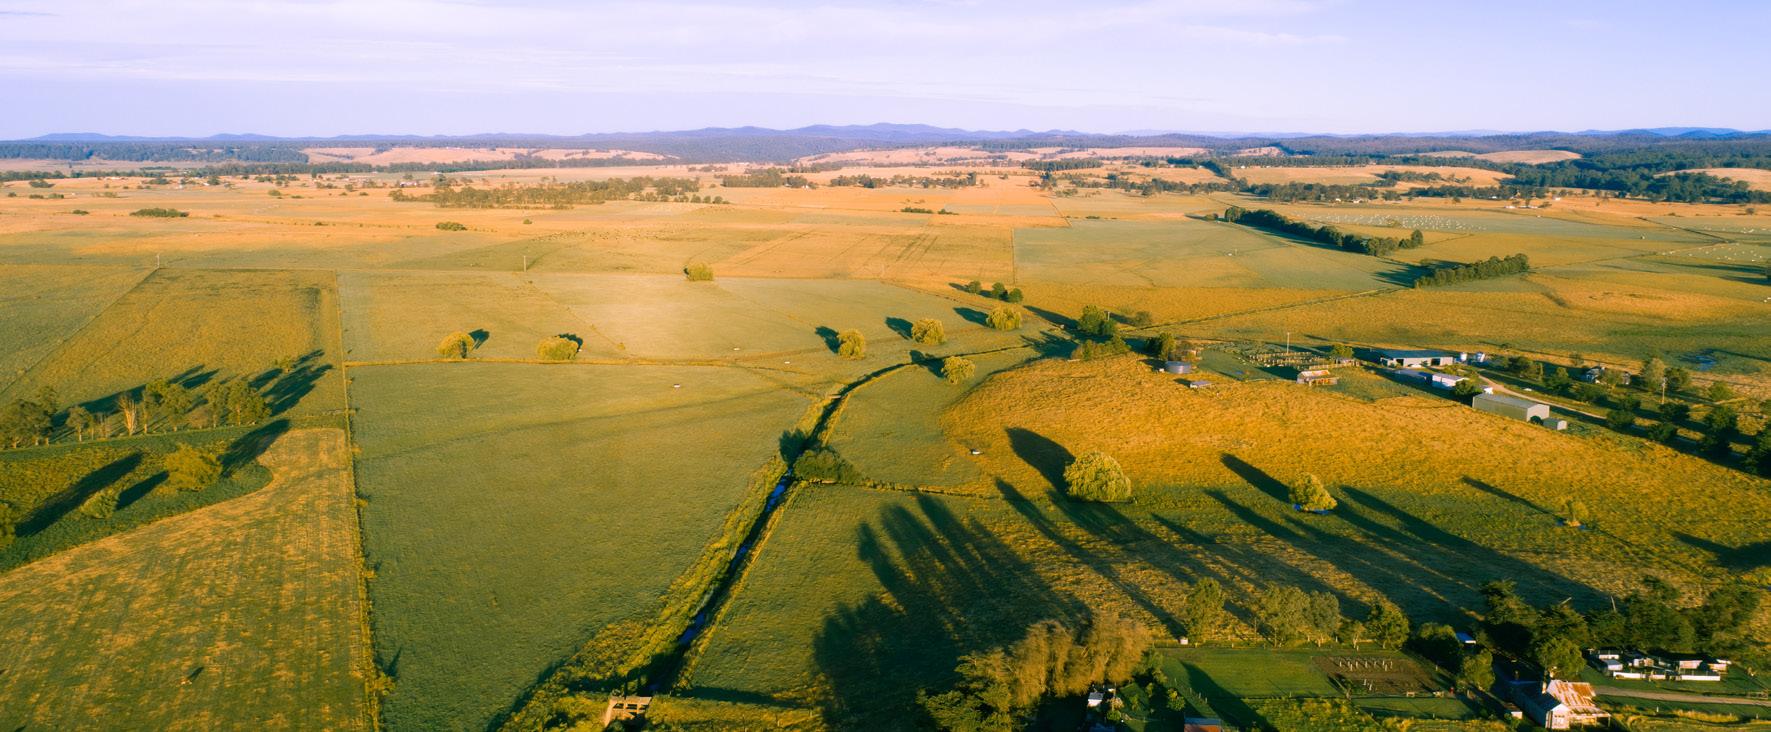
Victoria’s regional property market showed promising momentum in Q4 2024 following a slower Q3, with significant gains in both sales activity and new stock. This uptick, seen across almost all regional corridors, suggests a rebound in buyer interest and developer confidence.
Many regions hit their highest sales activity of 2024 this quarter, ending the year strong. Increased new land releases in Q4 also opened up more options for buyers, signalling a shift in developer strategies as they prioritise delivering new stock to meet market demand. This move highlights confidence in the regional market’s ability to absorb the new additions.
The regional property market gains momentum, signalling renewed buyer confidence.
Despite some price growth, regional markets largely maintained their affordability advantage compared to the metropolitan greenfield market. The median price of stock overhang has remained stable and below the sold price, a key indicator of market health and stability. This stability is critical for sustaining long-term regional market growth, especially with affordability acting as a key draw for both local and metropolitan buyers.
However, challenges remain. Elevated construction costs, coupled with a persistent shortage of skilled trades, will continue to place pressure on developers. Without an adjustment in land prices, house and land packages may become increasingly difficult to secure. The positive note is that as the financial situation improves in 2025, the market may start to find its footing, though it will take time for conditions to fully normalise.

Q4 2024 marked a strong finish to the year with a significant rise in sales activity. A total of 155 lots were sold, the highest figure of the year. This is a 40% increase (+44 lots) from Q3 and a significant 50% jump (+52 lots) compared to Q4 2023.
The surge in sales can be attributed to new land releases in Q2, alongside discounted titled lots introduced during the festive season, which helped drive buyer interest throughout the quarter.
The western region led the charge, accounting for 91% of total sales with 141 lots sold. In contrast, the southern and eastern regions recorded just eight and six lot sales respectively. The northern region, facing a shortage of available stock, saw no sales during the quarter.
113 new lots were released in Q4 2024, marking a substantial 116% increase (+64 lots) from the previous quarter. Most of these new releases were concentrated in the western region, with the southern and eastern regions following closely behind. This shift comes after a quieter period in Q3, signalling a strategic move by developers to deliver new stock while remaining confident in the market’s ability to absorb it.
However, Ballarat saw a notable uptick in cancellations, with 103 lots returned to the market during the quarter. The combination of new releases and cancellations pushed the total stock level to 861 lots – its highest point since Q2 2019. Despite the increased sales activity, the overall stock overhang remained elevated, closing the year at 706 lots.
Source: RPM Research, Data & Insights
Ballarat’s median land price for the quarter came in at $305,000, reflecting a modest 4% decline (-$13,000) from the previous quarter and a 2% drop (-$5,000) compared to Q4 2023. These price shifts are largely driven by changes in sales activity and increasing household costs.
The median lot size held steady at 448sqm between 2021 and early 2023. However, post Covid, it has varied between 400sqm and 448sqm. After reaching its highest point in Q3, the median lot size adjusted to 449sqm in Q4. As a result, the price per square metre rate slipped slightly to $679.
Bendigo saw a significant 35% increase (+17 lots) in sales activity in Q4 2024, marking a 53% year on year increase (+23 lots). Despite the holiday season slowing some market activity, Q4 still delivered the second-highest sales result of the year. This uptick can be largely attributed to the promotion of discounted titled lots leading up to Christmas, which attracted more buyers.
The northern region continued to dominate, claiming 61% of total sales for the quarter. Meanwhile, the eastern region saw a smaller increase, accounting for 28% of overall sales. New land releases, primarily in the northern and eastern regions, rose by 17 lots to 43 new lots in Q4. This increase in supply provides buyers entering the market in 2025 with more options and opportunities to secure land.
New land releases and cancellations contributed to a 5% growth in stock overhang levels, reaching a total of 300 lots. Meanwhile, stock overhang saw a slight decrease, ending the quarter at 234 lots –the lowest it has been in 2024.
While stock levels in the northern regions saw a modest increase, other areas experienced slight declines, presenting a timely opportunity for developers to introduce new land releases and diverse product offerings for 2025.
Source: RPM Research, Data & Insights
In Q4, the region saw its highest median price of 2024, reaching $290,000. This represents a 5% increase from the previous quarter, though it is down 3% year on year. The growth in median price is likely driven by a rise in the sale of larger lots, particularly in the western areas, where prices tend to be higher.
Lot sizes also increased in Q4, with the median lot size rising by 4% from Q3 to 628sqm. The western region saw the most significant change, with its median lot size doubling from the previous quarter. While lot sizes grew, the price per square metre rate remained steady at $462. The northern and eastern regions saw only modest changes in both price and size. Source:

The Drouin and Warragul region performed strongly in Q4 2024, recording 61 sales – the highest for the year. This marks a 45% (+19 lots) increase from the previous quarter and a significant 126% growth (+34 lots) from the same time last year. Warragul led the charge, with 67% of sales (41 lots), while Drouin claimed 33% (20 lots) for the quarter.
The uptick in activity can be largely attributed to developer-led discounts leading up to the festive season, which helped drive buyer interest.
The region saw 100 new lots enter the market –70 in Drouin and 30 in Warragul. This surge in new releases is the largest for 2024 and plays a critical role in alleviating the region’s stock shortage.
The increase also signals developers’ growing confidence in the market’s capacity to absorb these new releases.
The significant rise in new stock released in Q4 2024 saw the year end with a total of 326 lots – an increase of 29% quarterly and 16% annually. Despite the uptick in sales activity, the region’s stock overhang remains elevated at 265 lots, the highest since Q3 2018.
Demand for regional change is expected to continue rising, driven by the proximity to expanding developments in Nar Nar Good and Pakenham East. Meanwhile, the Drouin and Warragul regions are experiencing stock shortages. The increasing availability of stock across the region may provide additional supply and opportunities for buyers looking to purchase in 2025.
Source: RPM Research, Data & Insights
The Drouin and Warragul regions saw a median price of $325,000 in Q4 2024, marking a 1% quarterly increase (+$4,550), though this was a 6% drop (-$20,000) compared to Q4 2023. The median price rise is due to stronger activity in Drouin, where larger lots tend to command higher price points.
Accordingly, Drouin’s median size rose 5% to 561sqm. Despite both the lot size and median price increasing, the price per metre rate actually dipped slightly to $579, the lowest of 2024.

After two consecutive quarters of decline, the Macedon Ranges and Mitchell Shire region rebounded in Q4 2024 with sales jumping 55% (+17 lots) to 48. This was a 60% increase (+18 lots) compared to the same time last year.
However, new lot releases slowed significantly, with only 19 lots introduced in the quarter – the lowest level of new supply in 2024. This level was more in line with the previous corresponding period. It also highlights considerable stock was released over the first three quarters of 2024 and stock overhang levels were at a long term high over the last two quarters.
19 lots were returned to the market due to cancellations in Q4 2024. Despite this, the overall stock overhang declined slightly, closing the year with 333 lots. This marks a reduction from the peak seen in Q3, though stock levels remain elevated – still the second highest they have been in the past decade.
Source: RPM Research, Data & Insights
The Macedon Ranges and Mitchell Shire median price reached $435,000 in Q4 2024, marking a 26% increase (+$90,000) from the previous quarter and a 20% increase ($72,500) compared to the same time last year. This price growth can be attributed to a surge in sales activity in the Macedon Ranges, which accounted for 79% of total sales in the area. Macedon also saw higher price points, with a median price of $455,250, compared to the Mitchell Shire’s $341,200.
Despite the price rise, the median lot size in these regions shrank, dropping 16% (-118sqm) from the previous quarter and by 10% (-68sqm) compared to Q4 2023. This smaller median lot size contributed to a significant increase in the price per square metre rate, which rose 50% (+238) to a record $711 per sqm.
Michael Staedler
General Manager Research, Data & Insights
m.staedler@rpmgrp.com.au
Buyers’ leverage grows as developers adjust to demand and affordability constraints.
Looking ahead, the regional market is expected to experience more balanced demand. Buyers, particularly those from urban areas seeking more affordable options, will continue to be a driving force –provided the affordability advantage holds. Developers are likely to respond with more appropriately priced land offerings, and lot sizes may become smaller than traditional sizes to keep prices in check.
The broader economic landscape will play a significant role in shaping market activity. The February interest rate cut will ease financial pressures, but a material improvement in buyers’ purchasing capacities may not emerge until later in the year. Until then, price reductions and other incentives will remain key to sustaining buyer interest.
In the current market, buyers hold considerable leverage. With developers more willing to negotiate, the stage is set for those in the market to secure better deals. However, the pace of change will ultimately depend on the economic factors at play, particularly interest rates and construction costs.
For more information, please visit: www.rpmgrp.com.au
For a detailed market analysis or a tailored report, email the team at: contactus@rpmgrp.com.au
Research, Data & Insights

Michael Staedler
General Manager
Research, Data & Insights
m.staedler@rpmgrp.com.au

Andrew Raponi
Senior Research Manager a.raponi@rpmgrp.com.au

Laurence Rao
Senior Research Analyst - VIC laurence@rpmgrp.com.au

Simon Brinkman
Senior Research Analyst - QLD simon@rpmgrp.com.au
Executive, Sales and Marketing Leadership


Luke Kelly
National Managing Director
Built Form luke@rpmgrp.com.au

Rod Anderson
National Managing Director Communities rod@rpmgrp.com.au

Peter Grant
National Managing Director Business Development peter@rpmgrp.com.au

Imogene Schaefer
General Manager
Marketing imogene@rpmgrp.com.au
Michael Vilar
General Manager
Medium Density michaelv@rpmgrp.com.au

Greg Rankin
General Manager Communities gregr@rpmgrp.com.au

Johnathon Driessen
General Manager
Communities johnathon@rpmgrp.com.au

Tim Hyland
National Strategy Manager
Transactions & Advisory tim@rpmgrp.com.au
For detailed insights or custom reporting, contact the team at: contactus@rpmgrp.com.au