Victoria’s greenfield land market entered 2025 with cautious optimism, buoyed by the Reserve Bank of Australia’s (RBA) first interest rate cut since 2020. The February decision to lower the cash rate by 25 basis points followed a sustained drop in inflation through late 2024, offering some longawaited relief to buyers.
But sentiment didn’t shift overnight. Enquiry levels began to lift, though many waited to see how the market would respond before acting. When momentum did return, it was measured. Gross lot sales across Melbourne and Geelong reached 2,094 in March –up 1% on the same time last year but still 2% shy of Q4 2024. The reflects a market still wrestling with affordability pressures, despite a more favourable interest rate environment.
• March sales jumped 5% year on year, following the RBA’s first rate cut since 2020.
• Despite discounts, titled lots are taking over six months to sell, keeping negotiating power firmly with buyers.
• Borrowing power is quietly rebuilding.
Buyer caution is evident in both product choice and pace. Titled and near-titled lots (where rebates between 5%-10% were common) accounted for the lion’s share of sales. These ready-to-build lots remain a drawcard, but even with incentives, the average lot spent over six months on the market before selling. Median prices held at $400,000, while a slight increase in lot sizes trimmed the price per square metre rate.
On the supply side, developers released 1,852 lots in Q1 (up 10% quarter on quarter). While this is a positive shift, supply continues to trail underlying demand, with total available stock climbing to around 6,150 lots by quarter’s end.
Beyond metro borders, regional markets felt the seasonal softening more sharply. Following a surge in late 2024, Q1 brought the typical slowdown in activity, though Bendigo stood out as the only major region to record an increase in sales.
Elsewhere, elevated stock was less about new supply and more about the market absorbing a backlog of end of year releases. Median prices held firm or softened slightly, helping the regions maintain their affordability edge – particularly for buyers seeking value beyond the metro fringe.
Looking ahead, the combination of further rate relief and policy changes may tip the balance. The combination of the stage 3 tax cut and February rate cut shows that borrowing power is quietly rebuilding among those previously priced out of the market. Additionally, if expanded, the Help to Buy scheme could open the door for more first home buyers by scrapping LMI (Lenders Mortgage Insurance) and income caps.
With scale, product diversity, and relative affordability on its side, the greenfield sector remains central to meeting the state’s housing supply targets.
For more information, please visit: www.rpmgrp.com.au
For a detailed market analysis or a tailored report, email the team at: contactus@rpmgrp.com.au
Whats Inside
The cash rate remained unchanged in
but a potential rate cut is expected in May.
A Data Driven, Holistic Approach to Property
RPM’s Research, Data & Insights division provides indepth analysis on current local and overseas economic and property market conditions. The team consists of economists, property experts, and GIS analysts that provide real-time market intelligence, and analytical and strategic advice.
Our knowledge and expertise are an invaluable resource for RPM’s developer clients, empowering them to make intelligent, informed, and strategic decisions when evaluating residential developments and investment opportunities.
Our data and analysis help clients maximise their marketing efforts and achieve sales targets on their estates. Each month we collect extensive data on approximately 350 estates in Victoria, 140 estates in Queensland and 180 in New South Wales, providing our clients with a comprehensive understanding of the market dynamics. This also underpins the core strategic decision-making of our own business.
We profile every lot including lot size, price, orientation, sqm rate and title status, monitoring through to final sale.
Your dedicated research team:
Michael Staedler General Manager
Research, Data & Insights
Andrew Raponi
Senior Research Manager
Research, Data & Insights
Research Manager
Research, Data & Insights
Laurence Rao
Dollar per sqm rates
Stock release levels
Volume of stock returned to market
Volume of lots sold
Distribution of price points
Activity levels by market, product & developer
Stock level fluctuations
Distribution of lots of a particular size
This rich data helps our team and clients to better understand:
in April but a potential rate cut is expected in May.
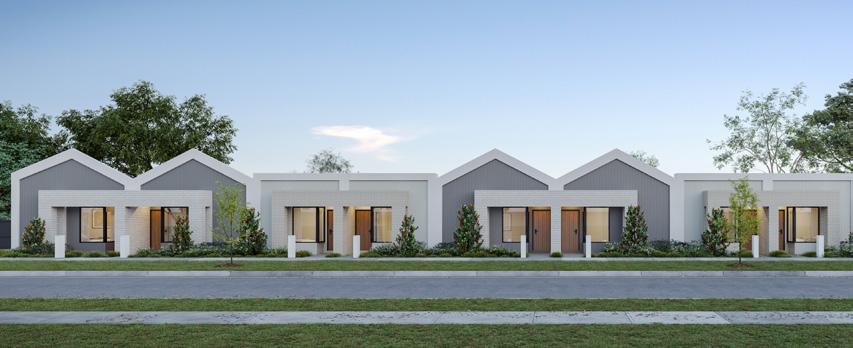
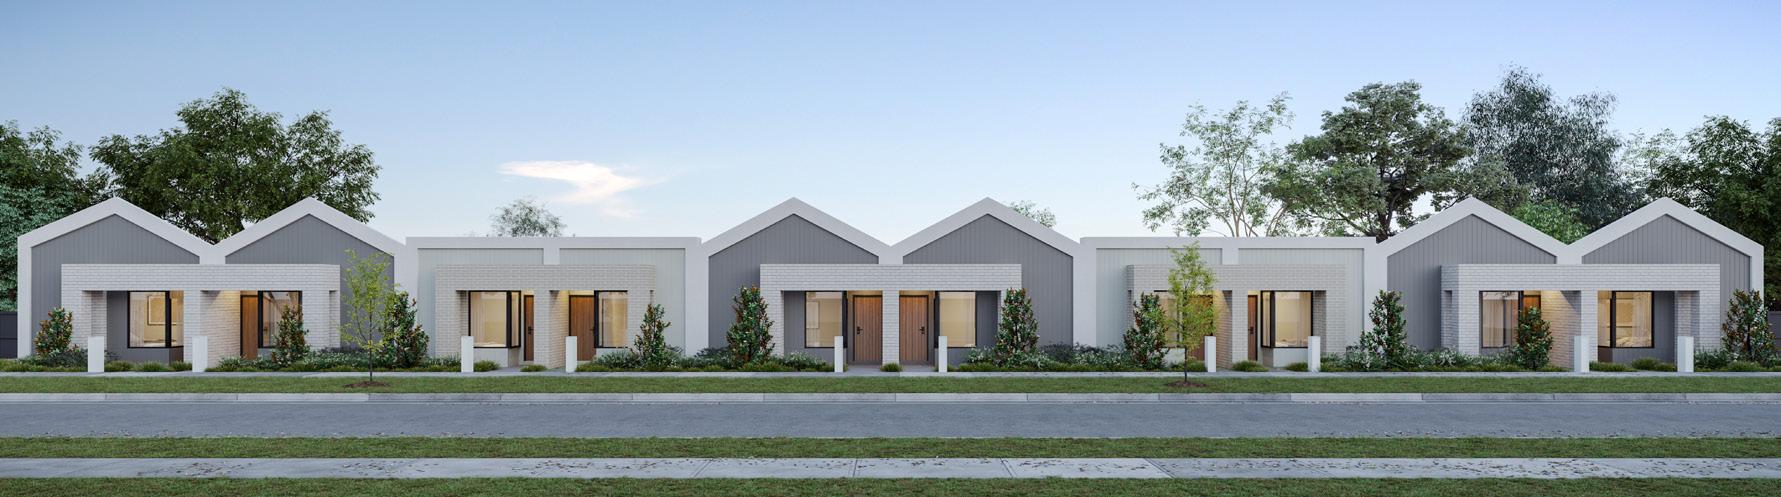
Medium Density
Luke Kelly
National Managing Director Built Form
luke@rpmgrp.com.au
Borrowing capacity has been one of the casualties of the post-pandemic economic cycle. At its weakest point in 2024, the average household income of $100,000 had a purchasing capacity of $469,800¹, which is 36% below their purchasing power of $735,500 in April 2022. This shift reshaped demand, compressed homeownership aspirations, and placed housing beyond reach for many prospective buyers – particularly budget conscious households.
Borrowing power is quietly rebuilding, and it’s starting to reshape demand.
1 Assuming a 10% deposit.
2 $80,000 household income.
3 $200,000 household income.
2025 is signalling the beginning of recalibration. The combination of the stage 3 tax cut mid-last year, highly competitive rates from banks enticing new customers, and the RBA’s first interest rate cut in five years has led to a modest but measurable lift in borrowing power.
For some households, this translates to an additional purchasing capacity of $5,900² to $19,000³. This is enough to shift the dinner table conversations from renting to a well-located townhome.
Using the example above, a household on $100,000 income may see their purchasing capacity rise by around $8,000, or 2%.
The improvement in purchasing capacity will come down to the pace of interest rate cuts. Markets are currently expecting three more cuts this year. If that holds, purchasing power could increase by another $25,300 for an $80,000 household income, or up to $80,400 for households earning $200,000. In this scenario, the same $100,000 household income
in the example mentioned could see their limit grow from $477,800 to around $511,500 – not back to where things stood in 2022, but it is certainly heading in the right direction.
These projections are key to the way we plan, price, and position housing products; particularly in the medium density market. As borrowing power recovers, so does the demand for well-designed townhomes that offer a balance of affordability, location, and liveability.
Our teams actively map projected affordability ranges against pipeline supply; this work underpins our ongoing collaboration with builder partners to ensure future products are calibrating to meet the rising (but still price conscious) demand.
While the full trajectory of interest rates remains uncertain, the direction is becoming clearer. For medium density housing, the combination of the tax cut, rate relief, and considered product delivery will shape the conditions for renewed market momentum.
Everley Townhomes by Sienna Homes - 2 Bed $399,000 and 3 Bed $467,000
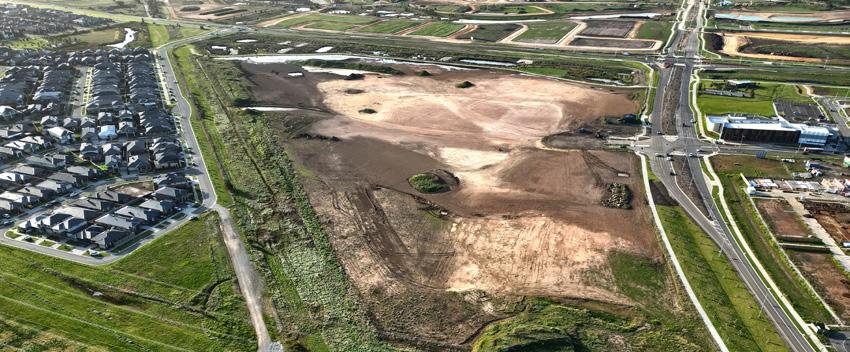
Development Sites
Tim Hyland
National Strategy Manager
Transactions & Advisory
tim@rpmgrp.com.au
Momentum is returning following a quieter period in Victoria’s development site market and developers are taking notice. Across both metropolitan and regional growth corridors, we are seeing renewed activity from developers looking to secure their next opportunity.
Capital ready developers are moving on future pipeline sites.
At the core of this shift is a forward-thinking mindset. Developers are becoming increasingly active, securing land that is either within approved PSPs or those to be approved in the short to medium term. In areas where developable land is in short supply, competition is ramping up. Many groups are focused on positioning themselves well today, so they are ready to go when the broader market kicks back into gear.
This has been evident in areas like Clyde North, where RPM Transactions & Advisory recently sold two of the last remaining, large-scale superlots in a highly competitive campaign.
However, it’s not just about what land is available, but rather how it’s being offered – terms are everything. With PSP and CHMP processes holding up development in many areas, vendors who are willing to
meet the market and offer extended terms (often tied to planning milestones) are seeing success. These structures give developers confidence and breathing room, particularly as many prepare for their next delivery phase.
Additionally, there’s no shortage of capital on hand, particularly from Japanese and Southeast Asian investors as well as local private capital. This influx is supporting developers who are keen to strike while the conditions are favourable and secure well-located, future-ready parcels.
Although this shift isn’t quite a boom, it is a rising wave of interest from buyers. The next growth cycle may not be far off, and for active developers with a clear strategy and the right funding partners, the groundwork is being laid now.
For more information on development site opportunities, contact
Tim Hyland tim@rpmgrp.com.au
Zaynoun Melhem zaynoun@rpmgrp.com.au
Vacant Land Market
Gross Lot Sales
Casey
Cardinia
Hume
Whittlesea
Sunbury
Mitchell
Wyndham
Melton
Moorabool
Melbourne and Geelong Buyer Surveys
We survey all buyers on RPM managed estates in the greenfield market. The following illustrates demographic and purchase intent amongst all purchasers over Q1 2025. For a detailed analysis of any corridor, LGA, or suburb in Victoria, please contact our Research, Data & Insights team.
contactus@rpmgrp.com.au
$650-700k
$600-650k
$550-600k
$500-550k
$450-500k
$400-450k
West Growth Corridor
West Corridor - Vacant Land Stock
New supply in the Western Growth Corridor edged up 2% year on year in Q1 2025, reaching 626 releases. While this outpaced the growth in sales, it lagged well behind the pace of supply seen in Melbourne’s other growth corridors. Most of the uplift came from Melton, where three new estates launched during the quarter. Stock returns jumped 17% to 337 lots, recording the highest quarterly figure in four years.
Source: RPM Research, Data & Insights
West Corridor - Lot Price and Size
The Western Growth Corridor’s median lot price climbed 1.3% in Q1 2025, returning to its previous peak of $385,000. Price growth was stronger in Melton than in Wyndham, widening the gap between the two. This trend reflects a geographic divide; while Wyndham’s sales are dispersed across the municipality, Melton’s activity is concentrated in its more expensive eastern pocket. Despite the price difference, both markets share a median lot size of 350sqm, consistent with the corridor-wide average.
North Corridor - Buyer Activity
Gross lot sales in the Northern Growth Corridor reached 627 in Q1 2025, down 6% year on year, with a notably soft start in Whittlesea. Time on market rose to 160 days, continuing a gradual upward trend, though it remained the shortest across Melbourne’s growth corridors.
Beneath the subdued annual figures, however, lies a rebound in buyer demand. March recorded the highest monthly sales figures since August 2022, as a result of the interest rate cut. This latequarter momentum lifted Q1 sales 13% above the previous quarter and pushed the corridor’s share of total metropolitan sales to 30%.
Hume Whittlesea Sunbury Mitchell
Sales (10 years)
North Corridor - Vacant Land Stock
New supply in the Northern Growth Corridor surged in Q1 2025, outpacing lot sales for the first time since Q3 2022. Resales climbed 35% over the quarter and 52% annually to 689 lots. Supply lifted across Hume, Whittlesea, and Sunbury, each launching a new estate during the quarter. Stock returns also rose moderately, increasing 4% to 180 lots.
Source: RPM Research, Data & Insights
South East Corridor
South East Corridor - Buyer Activity
Sales activity in the South East Growth Corridor slowed in Q1 2025, with 478 gross lot sales – an 8% quarterly decline and 19% annual decline. As a result, the corridor’s share of total metropolitan sales slipped to 23%. Both Casey and Cardinia contributed equally to the drop in demand, while the average time on market stretched slightly to 168 days.
South East Corridor - Vacant Land Stock
New lot supply in the South East Growth Corridor rose 9% over the quarter and 30% annually, reaching 474 lots in Q1 2025. This lift was driven by three new estates launching in Casey.
Stock returns jumped 22% to 178 lots, marking the second consecutive quarter of sizeable growth. This time, however, the increase was entirely due to activity in Cardinia, unlike the broader distribution seen previously.
Source:
South East Corridor - Lot Price and Size
The South East Growth Corridor remains the most expensive vacant lot market, despite a 2.2% drop in the median lot price to $451,000 in Q1 2025. This decline was driven by a 4.3% fall in the median lot size to 375sqm.
Affordability pressures in the South East are sharper than in other corridors, prompting a shift in buyer demand toward smaller lots. Despite this, the median price per square metre rate rose, highlighting the area’s underlying demand and premium position, even as buyers adjust expectations to meet budget constraints.
Greater Geelong Corridor
Greater Geelong - Vacant Land Stock
No new estates launched in the Geelong Growth Corridor in Q1 2025, contributing to a sharp 65% drop in new supply to just 63 lots – just above the long term low seen in Q4 2023. Most of these releases came from Armstrong Creek.
On a positive note, stock returns halved to 54 lots, marking the corridor’s best result since mid-2023.
Source: RPM Research, Data & Insights
Greater Geelong - Lot Price and Size
In Q1 2025, the Geelong Growth Corridor’s median lot size held steady at 400sqm, while the median lot price edged down 1.2% to $384,450 – now sitting 5.3% below the peak recorded in Q1 2024. Armstrong Creek, the corridor’s largest sub-market, remained the most affordable despite a 4.5% increase in its median lot size.
Victorian Greenfield Market Outlook
Michael Staedler
General Manager Research, Data & Insights
m.staedler@rpmgrp.com.au
Growing signs that the market is turning a corner, buoyed by encouraging data out of Q1 2025.
The Reserve Bank of Australia (RBA) is widely expected to deliver a second interest rate cut at its May meeting after underlying inflation eased to 2.9% over the quarter. This marks the first time since late 2021 that inflation has fallen back within the RBA’s 2%-3% target range, strengthening the case for further easing.
New home construction costs in Melbourne also showed signs of relief. The new dwelling purchase by owner occupier index declined 1.6% over the quarter and 1.3% annually – the first annual drop in nearly four years. For new buyers, this softening comes as welcome news after years of steep cost increases.
Affordability indicators have improved slightly. While median lot prices held steady, Melbourne’s median house price rose 2.7%, pushing the land-to-house price ratio to 43%. This is the first time house prices have outpaced land values since Q3 2021, though the ratio remains well above its long-term average of 36%
These shifts are supporting a modest recovery in sentiment. However, a more pronounced uplift in lot sales will likely require both additional rate cuts (to help restore lost borrowing capacity) and continued house price growth, which would enhance the affordability appeal of house and land packages relative to established homes.
For now, a high volume of titled and resale lots continues to fuel competitive pricing. Rebates and discounts are expected to persist through FY25, with some developers likely to adjust prices downwards in response to ongoing supply levels.
Policy settings are also poised to drive demand. The Federal Government’s proposed expansion of the Help to Buy Scheme would allow all first home buyers to purchase new homes with just a 5% deposit and no Lenders Mortgage Insurance (LMI), removing income caps while retaining property price caps. This is expected to favour greenfield markets in outer Melbourne and regional cities.
The new home market will be essential in delivering the Victorian Government’s target of 80,000 new dwellings per year over the next decade, thanks to its capacity to scale, offer product diversity, and maintain relative affordability.
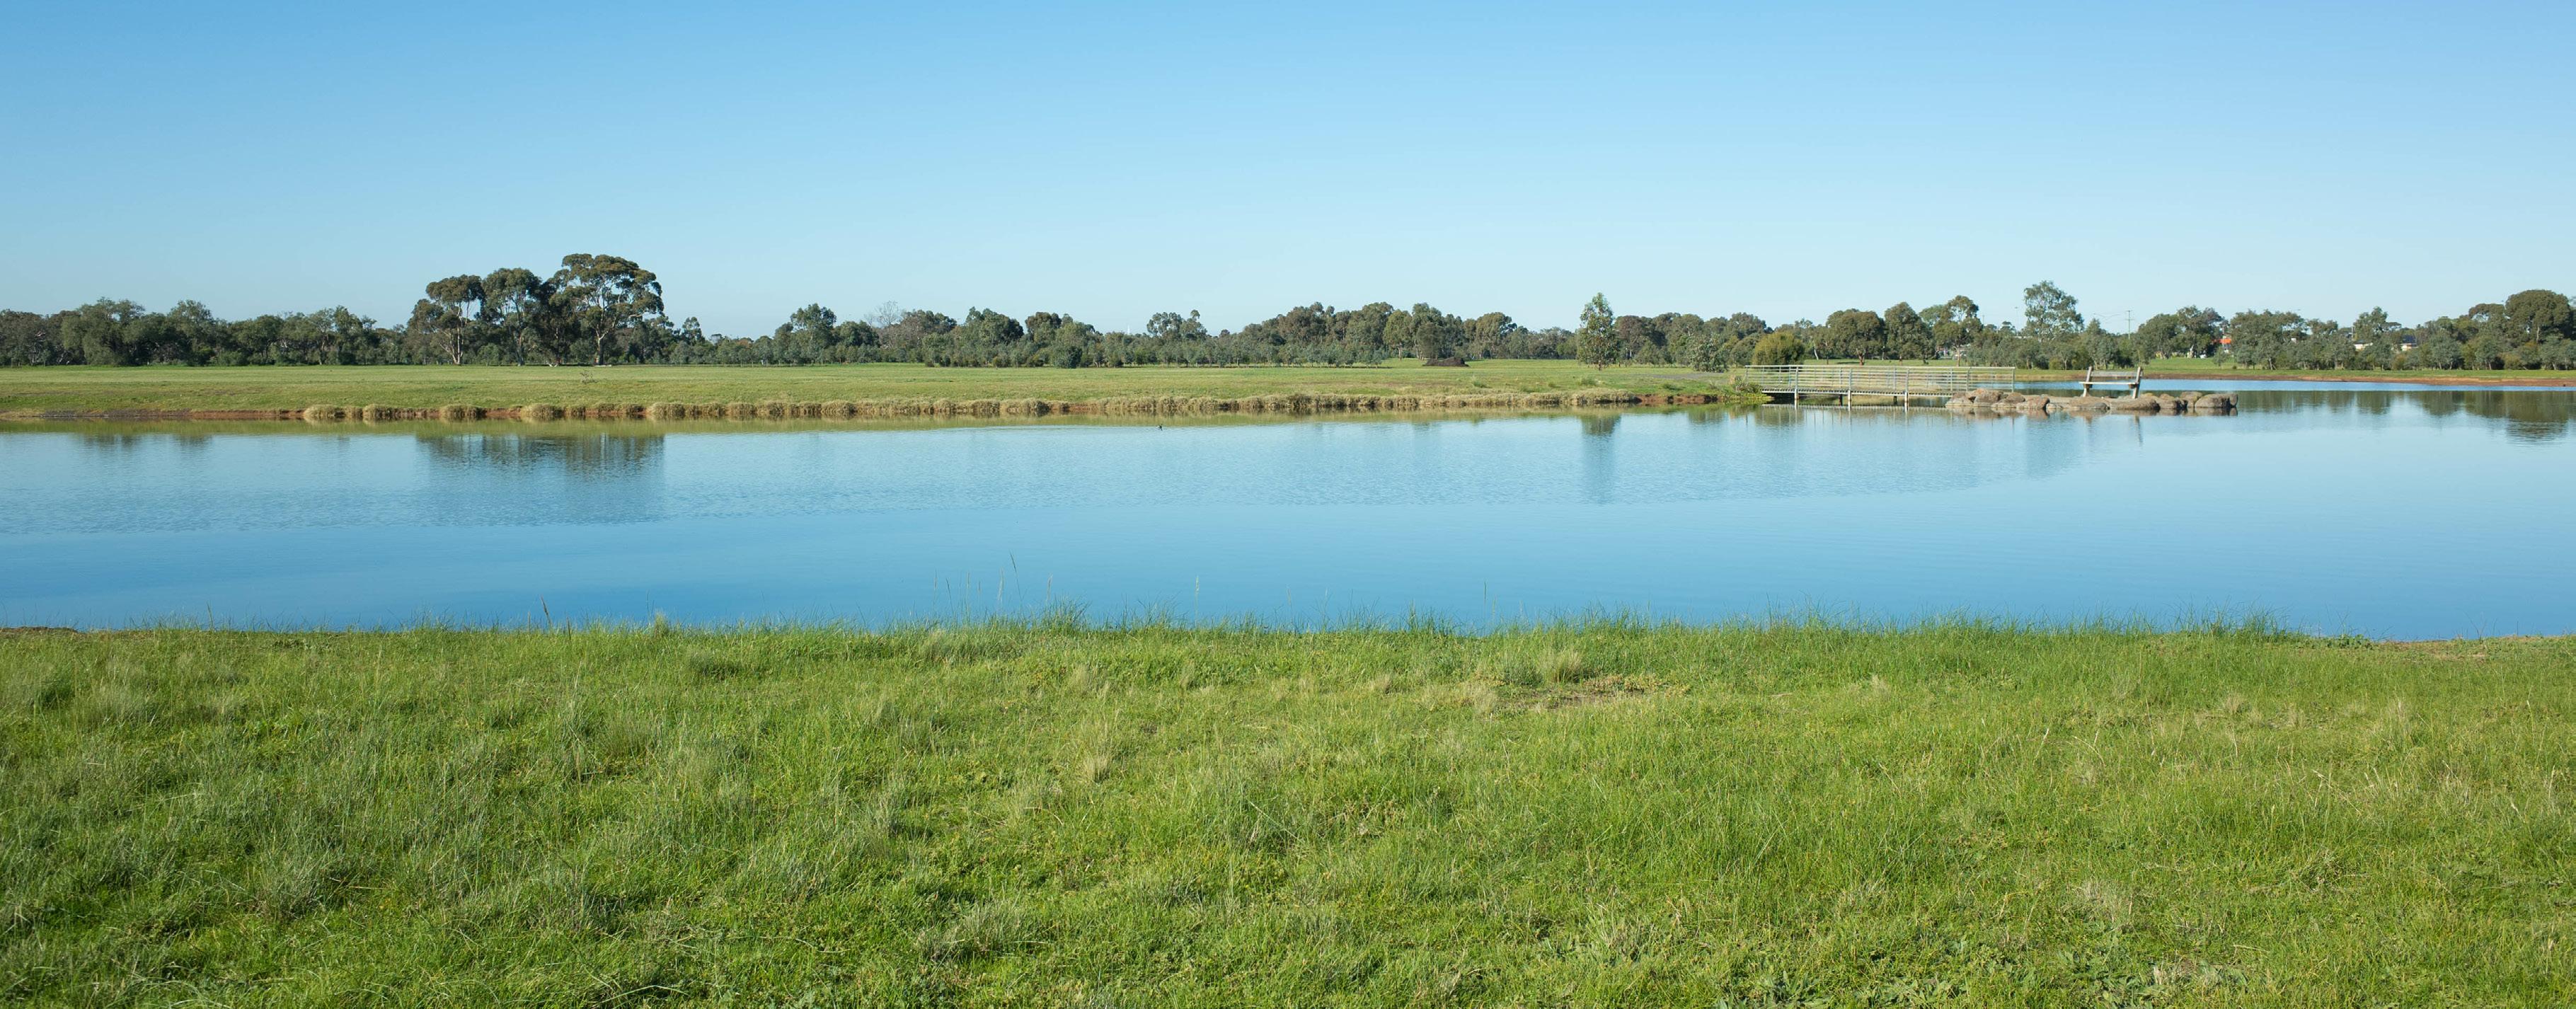
Regional Land Market Overview
Rod Anderson
National Managing Director Communities rod@rpmgrp.com.au
The regional land markets began the year on a more subdued note, following a strong finish to 2024. Sales activity surged in Q4, driven in part by a wave of heavily promoted end of year releases and incentives. The market then cooled as the calendar ticked over.
This isn’t unusual. Historically, the first quarter of the year tends to soften, with a seasonal slowdown following the promotional push at the end of the previous year. In Q1, stock levels remained elevated, not because of new supply (in fact, new releases declined) but because the market was still absorbing the influx of lots from Q4.
Bendigo was the outlier, being the only region to record a quarter on quarter increase in sales activity. Other markets saw a modest dip in sales, consistent with past seasonal patterns.
A more balanced market after the holiday surge.
Despite the pullback in releases, price points remained one of the regional market’s key advantages. Median lot prices across the regional areas held steady or dipped slightly, helping to maintain a clear affordability advantage compared to metropolitan markets. This price buffer supports local buyers while also positioning the regional market as an attractive option for those moving from Metropolitan Melbourne.
In a potential tailwind, the Reserve Bank of Australia (RBA) cut the cash rate to 4.1% in February – the first rate cut since late 2023. While inflation and cost of living pressures remain high, the rate reduction has improved borrowing capacity and buyer sentiment. First home buyers and upgraders alike may find more room to move in the months ahead.
Whether this translates into renewed momentum in regional sales remains to be seen. But with stock still moving and prices staying competitive, the fundamentals remain in place for a stable, albeit cautious, start to the year.
Ballarat - Buyer Activity
Ballarat eased into 2025 with 91 lot sales in the first quarter, a sharp 41% fall from the previous quarter, down 64 lots. The decline followed an end-of-year rush fuelled by festive season incentives like discounts and rebates, which did not carry into the new year.
Positively, despite the quarterly drop, sales were 38% higher than at the same time last year, with 25 more lots sold than in Q1 2024 – a sign of stronger underlying demand.
Activity remained heavily concentrated in the western region, which accounted for 87% of sales (79 lots). The eastern and northern regions trailed with five and four lots sold, while the southern region saw a modest slowdown, recording just three sales for the quarter.
Ballarat -Vacant Land Stock
Ballarat’s new supply softened in early 2025, with 61 new lots released in Q1 – a 46% drop (52 lots) from the last quarter. Most releases were concentrated in the west, with limited activity elsewhere.
The pullback followed a heavy stock release program to end 2024, as developers attempted to add various product offerings to drive an improvement in sales through the festive season.
Alongside new supply, 45 lots were returned to the market during the quarter. Total stock edged 6% lower from a historical high to 807 lots by the end of March. However, with sales slowing, the stock overhang rose slightly, with 716 lots remaining unsold at quarter’s end – a historical high.
Stock Overhang
Source: RPM Research, Data & Insights
Ballarat - Lot Price and Size
Ballarat’s median lot price held steady at $305,000 in Q1 2025, unchanged from the previous quarter and just 1% ($2,000) lower than a year ago. Lot sizes, however, moved higher. The median lot size rose 12% over the quarter to 504sqm (the largest since March 2021) and grew 21% (87sqm) year-on-year.
This increase was largely driven by a greater share of larger lots sold in the northern region, which lifted the overall median. As a result, the median price per square metre eased slightly to $605/sqm.
As the modest movement in pricing over the past year indicates, the region is fighting an affordability issue with developers attempting to meet the market without creating valuation concerns on previously sold lots.
Source: RPM Research, Data & Insights
Bendigo
Bendigo - Vacant Land Stock
Despite stronger sales, Bendigo’s total stock levels edged higher over the quarter. A total of 19 lots were returned to the market due to cancellations, and combined with new releases, stock levels rose to 313 lots by the end of March.
Stock overhang remained steady, slipping by just one lot to 233 lots at the end of the quarter. Most available stock remains concentrated in the northern region, highlighting an opportunity for developers to diversify future releases across other areas to better balance supply.
Drouin & Warragul
Drouin & Warragul - Vacant Land Stock
Following the surge in new releases at the end of 2024, vacant land supply in Drouin and Warragul remained elevated through Q1 2024, holding steady at 282 lots – a relatively high level compared to recent quarters. Despite a modest drop in sales, stock overhang eased slightly, declining 11% over the quarter and 7% over the year to 236 lots.
Demand for regional relocation is expected to remain strong, supported by growth in nearby developments in Nar Nar Goon and Pakenham East. Elevated stock levels may help address ongoing shortages across the broader region. The February interest rate cut could also help reignite buyer activity in the coming months.
Source: RPM Research, Data & Insights
Drouin & Warragul - Lot Price and Size
The median lot price in Drouin and Warragul held steady at $323,500 in Q1 2025, recording only a slight decline of $1,500 from the previous quarter. Year-on-year, the median price was down 6% (-$22,050).
Lot sizes edged higher, with the median increasing 1% (+4sqm) to 565sqm. With prices stable and lots slightly larger, the median price per square metre softened by 1%, settling at $573/sqm.
Macedon & Mitchell
Macedon and Mitchell - Vacant Land Stock
In Q1 2025, 14 lots were returned to market due to cancellations. This was a 22% decline from the previous quarter (-4 lots) but still twice the number recorded last year. Given the softer sales and a slowdown in new releases, stock overhang held steady. The quarter closed with 331 unsold lots, unchanged from last quarter.
Regional Land Market Outlook
Michael Staedler
General Manager
Research, Data & Insights
m.staedler@rpmgrp.com.au
Success lies in smart, responsive developments.
After a period of intense activity and seasonal fluctuations, the regional land market is entering a phase of recalibration. A more balanced level of demand is likely in the near term, shaped by shifting buyer preferences and broader economic conditions.
One key shift is the gradual return to the office for many. As more employers encourage a return to the workplace, the appeal for a full-time tree change may wane for some. That said, demand for regional living remains strong, particularly if the affordability equation stacks up.
For developers, this means a sharper focus on product-market fit. Buyers are price sensitive, and lots that meet budget expectations (often slightly smaller than traditional lots) are more likely to sell. With the established market showing signs of fatigue, greenfield projects that respond to this affordability-driven demand will be best placed to capture buyer interest.
The February interest rate cut added a welcome layer of support. While it has boosted confidence and lifted buyer sentiment, it is too early to expect immediate changes in sales volumes. The true test will come later in the year, as the effects of a sustained lower rate environment begin to filter through.
For now, buyers remain in a strong position. With supply still working its way through the system and price sensitivity high, negotiating power rests firmly with buyers. Developers willing to adapt to price and lot configurations will be best positioned to keep deals moving as the market finds its footing again.
For more information, please visit: www.rpmgrp.com.au
For a detailed market analysis or a tailored report, email the team at: contactus@rpmgrp.com.au
Our Team
Research, Data & Insights
Michael Staedler
General Manager
Research, Data & Insights
m.staedler@rpmgrp.com.au
Andrew Raponi
Senior Research Manager a.raponi@rpmgrp.com.au
Laurence Rao
Research Manager - VIC laurence@rpmgrp.com.au
Simon Brinkman
Research Manager - QLD simon@rpmgrp.com.au
Executive, Sales and Marketing Leadership
Luke Kelly
National Managing Director
Built Form luke@rpmgrp.com.au
Rod Anderson
National Managing Director
Communities rod@rpmgrp.com.au
Peter Grant
National Managing Director Business Development peter@rpmgrp.com.au
Imogene Schaefer
General Manager
Marketing imogene@rpmgrp.com.au
Michael Vilar
General Manager
Medium Density michaelv@rpmgrp.com.au
Greg Rankin
General Manager Communities gregr@rpmgrp.com.au
Johnathon Driessen
General Manager
Communities johnathon@rpmgrp.com.au
Tim Hyland
National Strategy Manager
Transactions & Advisory tim@rpmgrp.com.au
Unlocking Australia’s Property Landscape
For detailed insights or custom reporting, contact the team at: contactus@rpmgrp.com.au